cross-industry chief compliance officer and staff salary surveys · 2019-10-30 · chief compliance...
TRANSCRIPT

Cross-Industry Chief Compliance Officer and Staff Salary Surveys
2019
corporatecompliance.org

Join a community of 7,600+ compliance and ethics professionals. Gain access to a wealth of knowledge, resources, and industry connections. Become a member of the Society of Corporate Compliance and Ethics (SCCE).
Find out what SCCE can do for you
Educational ConferencesEnjoy registration discounts for a robust
calendar of events, ranging from weekly web conferences, one-day regional conferences, to three-and-a-half day national conferences, and classroom- style academies covering the basics of compliance and ethics.
Publications and ResourcesSolve your compliance problems with our
valuable publications at a discounted rate. In addition you will receive our monthly members-only publication, CEP Magazine. Stay up-to-date on the latest compliance practices and news.
CEUs & Certifi cationReceive discounts on Compliance Certifi cation Board
(CCB)® certifi cation exams. Flex your knowledge of compliance and be a resource in your fi eld.
Networking OpportunitiesDon’t feel stranded on a compliance
island. Meet and connect at SCCE events and share ideas on SCCEnet, our thriving online healthcare compliance community.
Join todaycorporatecompliance.org/membership

The Society of Corporate Compliance and Ethics (SCCE)® is pleased to provide you with the 2019 Cross-Industry Chief Compliance Officer and Staff Salary Surveys report.
This survey, last conducted in 2017, contains the latest information about compensation for the corporate compliance community.
We have included compensation data for both the chief compliance and ethics officer and compliance staff. This data can help compliance professionals and their employers to better understand and evaluate compensation packages.
The survey results are based on data from compliance professionals in many industries and around the world. Ours is a fast-growing profession, and this data reflects its increasing expansiveness and SCCE’s commitment to meet our members’ needs. We hope you find the data from this survey to be useful.
Sincerely,
Adam Turteltaub, CCEP, CHC Vice President of Strategic Initiatives & International Programs Society of Corporate Compliance and Ethics & Health Care Compliance Association

CONFIDENTIALITY ASSURANCE The 2019 Cross-Industry Chief Compliance Officer and Staff Salary Surveys is based on a strictly confidential survey conducted of individuals working in the compliance profession. Upon receipt, all survey responses are assigned a confidential code number by Fondulas Strategic Research and any name or company identification is removed. Survey processing is then conducted on an absolutely anonymous basis. No SCCE staff member nor any industry company or individual, nor anyone else other than a select few Fondulas Research associates ever see any individual’s results.

Cross-Industry Chief Compliance Officer Salary Survey
Table of Contents INTRODUCTION .................................................................................................................................................................................. 3 ABOUT THIS REPORT ................................................................................................................................................................................ 4 SURVEY METHODOLOGY ........................................................................................................................................................................... 5 DEFINITIONS .......................................................................................................................................................................................... 5 RESPONDENT PROFILE........................................................................................................................................................................ 6 PERCENTAGE OF COMPANY’S LEGAL AND REGULATORY RISK THAT YOU ARE INVOLVED IN ......................................................................................... 7 ANNUAL COMPLIANCE BUDGET MANAGED .................................................................................................................................................... 8 NUMBER OF EMPLOYEES IN ORGANIZATION AS A WHOLE .................................................................................................................................. 9 NUMBER OF EMPLOYEES IN ORGANIZATION THAT CCO RUNS COMPLIANCE FOR ....................................................................................................10 ANNUAL REVENUES OF THE ORGANIZATION AS A WHOLE .................................................................................................................................11 ANNUAL REVENUES OF THE ORGANIZATION THAT CCO RUNS COMPLIANCE FOR ....................................................................................................12 NUMBER OF COUNTRIES IN WHICH COMPLIANCE IS MANAGED ..........................................................................................................................13 NUMBER OF YEARS MANAGING THE COMPLIANCE DEPARTMENT .......................................................................................................................14 CERTIFICATIONS .....................................................................................................................................................................................15 TYPE OF ORGANIZATION ...........................................................................................................................................................................16 GEOGRAPHIC REGION ..............................................................................................................................................................................17 TYPE OF INDUSTRY ..................................................................................................................................................................................18 GENDER ...............................................................................................................................................................................................19 AGE ....................................................................................................................................................................................................20 HIGHEST LEVEL OF EDUCATION ..................................................................................................................................................................21 YEARS IN COMPLIANCE PROFESSION ............................................................................................................................................................21 DO YOU HAVE A CONTRACT? ....................................................................................................................................................................23 DO YOU HAVE A SEVERANCE CLAUSE IN YOUR CONTRACT (AMONG THOSE WITH A CONTRACT)? ..............................................................................24 EXECUTIVE SUMMARY ......................................................................................................................................................................25 AVERAGE TOTAL COMPENSATION BY PERCENTAGE OF COMPANY’S LEGAL AND REGULATORY RISK AREAS CCO INVOLVED IN.............................................26 AVERAGE TOTAL COMPENSATION BY NUMBER OF EMPLOYEES IN THE COMPLIANCE AND ETHICS GROUP MANAGED .......................................................27 AVERAGE TOTAL COMPENSATION BY ANNUAL COMPLIANCE BUDGET MANAGED....................................................................................................28 AVERAGE TOTAL COMPENSATION BY NUMBER OF EMPLOYEES THAT CCO RUNS COMPLIANCE FOR ............................................................................29 AVERAGE TOTAL COMPENSATION BY REVENUE THAT CCO RUNS COMPLIANCE FOR ................................................................................................30 AVERAGE TOTAL COMPENSATION BY NUMBER OF YEARS MANAGING THE COMPLIANCE DEPARTMENT ........................................................................31 AVERAGE TOTAL COMPENSATION BY YEARS IN THE COMPLIANCE PROFESSION ......................................................................................................32 AVERAGE TOTAL COMPENSATION BY TYPE OF ORGANIZATION ...........................................................................................................................33 AVERAGE TOTAL COMPENSATION BY GEOGRAPHIC REGION ..............................................................................................................................34 AVERAGE TOTAL COMPENSATION BY CERTIFICATION .......................................................................................................................................35 AVERAGE TOTAL COMPENSATION BY INDUSTRY ..............................................................................................................................................36 AVERAGE TOTAL COMPENSATION BY AGE .....................................................................................................................................................37 AMOUNT OF BONUS ELIGIBLE ....................................................................................................................................................................38 BASIS OF BONUS ....................................................................................................................................................................................39 AVERAGE TOTAL COMPENSATION BY CONTRACT STATUS ..................................................................................................................................40 AVERAGE TOTAL COMPENSATION BY SEVERANCE CLAUSE STATUS ......................................................................................................................41 SALARY DATA ....................................................................................................................................................................................42 Chief Compliance Officer Salary Results ..............................................................................................................................................43

DETAILED RESULTS ............................................................................................................................................................................47 Chief Compliance Officer Detailed Results...........................................................................................................................................48 2019 CROSS-INDUSTRY STAFF SALARY SURVEY .................................................................................................................................66 INTRODUCTION .................................................................................................................................................................................67 ABOUT THIS REPORT ...............................................................................................................................................................................68 RESPONDENT PROFILE.......................................................................................................................................................................70 TITLE/LEVEL ..........................................................................................................................................................................................71 NUMBER OF EMPLOYEES IN ORGANIZATION AS A WHOLE .................................................................................................................................72 NUMBER OF EMPLOYEES IN THE PORTION OF THE ORGANIZATION THAT THE COMPLIANCE PROGRAM OVERSEES............................................................73 ANNUAL REVENUES OF THE ORGANIZATION AS A WHOLE .................................................................................................................................74 ANNUAL REVENUES OF THE PORTION OF THE ORGANIZATION THAT THE COMPLIANCE PROGRAM OVERSEES .................................................................75 NUMBER OF COUNTRIES IN WHICH WORK IS CONDUCTED ................................................................................................................................76 NUMBER OF YEARS IN THE COMPLIANCE DEPARTMENT ....................................................................................................................................77 TYPE OF ORGANIZATION ...........................................................................................................................................................................78 TYPE OF INDUSTRY ..................................................................................................................................................................................79 GEOGRAPHIC REGION ..............................................................................................................................................................................80 ELEMENTS OF THE COMPLIANCE PROGRAM THAT STAFF ARE INVOLVED IN............................................................................................................81 HOW MUCH OF YOUR COMPANY'S LEGAL AND REGULATORY RISK AREAS IS THE COMPLIANCE DEPARTMENT IS RESPONSIBLE FOR MANAGING? .........................82 HOW MANY PEOPLE REPORT UP THROUGH TO THE INDIVIDUAL? ......................................................................................................................83 CERTIFICATIONS .....................................................................................................................................................................................84 DO YOU HAVE A CONTRACT? ....................................................................................................................................................................85 DO YOU HAVE A SEVERANCE CLAUSE IN YOUR CONTRACT? (AMONG THOSE WITH A CONTRACT) ..............................................................................86 HIGHEST LEVEL OF EDUCATION ..................................................................................................................................................................87 GENDER ...............................................................................................................................................................................................88 EXECUTIVE SUMMARY ......................................................................................................................................................................89 AVERAGE TOTAL COMPENSATION BY TITLE/LEVEL...........................................................................................................................................90 AVERAGE TOTAL COMPENSATION BY COMPLIANCE BUDGET FOR ORGANIZATION ....................................................................................................91 AVERAGE TOTAL COMPENSATION BY ANNUAL REVENUES IN THE PORTION OF THE ORGANIZATION THAT THE INDIVIDUAL WORKS IN COMPLIANCE FOR ...........92 AVERAGE TOTAL COMPENSATION BY NUMBER OF EMPLOYEES IN THE PORTION OF THE ORGANIZATION THAT THE INDIVIDUAL WORKS IN COMPLIANCE FOR .....93 AVERAGE TOTAL COMPENSATION BY NUMBER OF EMPLOYEES REPORTING UP THROUGH TO INDIVIDUAL .....................................................................94 AVERAGE TOTAL COMPENSATION BY TYPE OF ORGANIZATION ...........................................................................................................................95 AVERAGE TOTAL COMPENSATION BY CERTIFICATIONS HELD ..............................................................................................................................96 AVERAGE TOTAL COMPENSATION BY ELEMENTS OF A COMPLIANCE PROGRAM THE INDIVIDUAL IS INVOLVED IN .............................................................97 AVERAGE TOTAL COMPENSATION BY CONTRACT STATUS ..................................................................................................................................98 AVERAGE TOTAL COMPENSATION BY SEVERANCE CLAUSE IN CONTRACT ...............................................................................................................99 AVERAGE TOTAL COMPENSATION BY GEOGRAPHIC REGION ............................................................................................................................ 100 AVERAGE TOTAL COMPENSATION BY TITLE/YEARS IN COMPLIANCE PROFESSION .................................................................................................. 101 SALARY DATA .................................................................................................................................................................................. 102 Vice President Salary Results ........................................................................................................................................................... 103 Director Salary Results ..................................................................................................................................................................... 104 Manager Salary Results.................................................................................................................................................................... 108 Assistant/Specialist Salary Results .................................................................................................................................................... 112 DETAILED RESULTS .......................................................................................................................................................................... 116 Staff Detailed Results ....................................................................................................................................................................... 117

2019 Cross-Industry Chief Compliance Officer Salary Survey 3
Introduction

2019 Cross-Industry Chief Compliance Officer Salary Survey 4
About This Report
The 2019 Cross-Industry Chief Compliance Officers Salary Survey is another important service provided by the Society of Corporate Compliance and Ethics & Health Care Compliance Association (SCCE & HCCA). The information contained in this report offers salary and compensation data for individuals working in the compliance profession. The report is designed to allow organizations and individuals to compare their data with those of their peers. The results throughout this report are presented for both the total sample of survey respondents, and for specific segments within the sample, to allow organizations to more easily compare its own data to the results of individuals with similar characteristics. In addition to the total sample, the individual segments reported throughout include the following:
• Percentage of Company’s Legal and Regulatory Risk Areas the Chief Compliance Officer (CCO) Is Involved in • Number of Employees in the Compliance and Ethics Group Managed • Number of Employees in Organization as a Whole • Annual Revenues of the Organization as a Whole • Number of Direct Reports to the CCO • Annual Compliance Budget Managed • Number of Employees in Portion of the Organization That CCO Runs Compliance for • Annual Revenues in Portion of the Organization That CCO Runs Compliance for • Number of Countries in Which Compliance Is Managed • Number of Years Managing the Compliance Department • Years in Compliance Profession • Certifications Held • Type of Organization • Type of Industry • Number of Compliance Program Elements the CCO Is Involved in • Geographic Region • Gender • Age • Highest Level of Education • Contract Status • Amount of Bonus Eligible • Basis of Bonus • Presence of Severance Clause in One’s Contract
The goal of this survey is to report the salaries of chief compliance officers for an organization or division, versus leaders of specialized areas of compliance. To capture that broader audience, CCOs responsible for less than 26% of an organization’s legal and regulatory risk are not included in the results reported here. Please note that the salary and other data published in this report should be considered guidelines rather than absolute standards. Even organizations that are similar on some characteristics, such as location, size, industry, etc., will differ in other ways, making it difficult to draw exact comparisons. In the end, results in this report that are different from one’s own experience are most likely an indication that other factors are at play. Note that a minimum of five responses was required to show data for any question, from any individual segments. Also note that results based on relatively small responses (e.g., fewer than 25) are subject to higher levels of statistical error and should be interpreted with caution.

2019 Cross-Industry Chief Compliance Officer Salary Survey 5
This study was conducted for SCCE & HCCA by Fondulas Strategic Research LLC, an independent professional survey research firm located in East Sandwich, MA. The company specializes in surveys for trade and professional associations, including surveys measuring trends in salary levels over time and employee attitudes. SCCE & HCCA are proud to present the enclosed insights into the salary levels in the compliance industry. We wish to thank the professionals who submitted data for the study. Your support was essential in making this study a success. Survey Methodology
In June 2019, an email invitation was sent to approximately 50,000 individuals that make up SCCE& HCCA’s database. In total, 2,898 completed online submissions were received by mid-September. Of the 2,898 responses, 479 were selected on the basis of the following criteria:
• The chief compliance officer worked for a non-healthcare provider • The chief compliance officer was responsible for at least 26% of an organization’s legal and regulatory risk
Fondulas Strategic Research maintains strict confidentiality standards in the research it conducts. For example, all data that could potentially identify individual respondents (name, organization, etc.) are stripped from the survey data and replaced with an identifying number. In addition, all results were checked, using both automated and manual processes, for internal consistency and accuracy. Final results were tabulated by Fondulas Strategic Research, and the report was completed in October 2019.
Definitions
Average (mean): the arithmetic average obtained by adding the individual values for all responses to a particular question and dividing by the total number answering; a measure of central value that can be distorted by extreme high or low values.
Median: a measure of central value that is not affected by extreme values; calculated by arranging all responses in numerical order and selecting the value that falls exactly in the middle, with half higher and half lower.
25th Percentile: when responses are ordered from lowest to highest, the lower quartile is the response 25% from the bottom. In other words, 75% of the responses are higher than this measure.
75th Percentile: when responses are ordered from the lowest to highest, the upper quartile is the response 25% from the top. In other words, 25% of the responses are higher than this measure.

2019 Cross-Industry Chief Compliance Officer Salary Survey 6
Respondent Profile

2019 Cross-Industry Chief Compliance Officer Salary Survey 7
Percentage of Company’s Legal and Regulatory Risk That You Are Involved in Approximately 4 in 10 of the chief compliance officers qualifying for the survey say they manage more than 75% of their firm’s legal and regulatory risk.
26%–50%, 26%
51%–75%, 31%
76%–100%, 43%

2019 Cross-Industry Chief Compliance Officer Salary Survey 8
Annual Compliance Budget Managed One-third of CCOs manage a compliance budget of less than $100,000 annually. At the other extreme, 40% manage a budget of $1 million or more.
Under $100 thousand, 35%
$100 thousand–$499.9 thousand, 14% $500 thousand–$999.9 thousand, 11%
$1 million–$4.9 million, 15%
$5 million–$9.9 million, 9%
$10 million or more, 16%

2019 Cross-Industry Chief Compliance Officer Salary Survey 9
Number of Employees in Organization as a Whole A bit fewer than half of CCOs work in organizations with fewer than 1,000 employees, while 1 in 4 work in organizations with 7,500 or more employees.
Fewer than 250, 22%
250–999, 25%
1,000–2,999, 15%
3,000–7,499, 14%
7,500–14,999, 9%
15,000–29,999, 4%
30,000 or more, 11%

2019 Cross-Industry Chief Compliance Officer Salary Survey 10
Number of Employees in Organization That CCO Runs Compliance for One in five CCOs (19%) are responsible for fewer than 100 employees as part of their program. On the other end, another one in five (21%) are responsible for 5,000 or more employees.
Fewer than 100, 19%
100–249, 12%
250–499, 13% 500–999, 15%
1,000–1,999, 9%
2,000–2,999, 4%
3,000–4,999, 8%
5,000–7,499, 5%
7,500–14,999, 8%
15,000 or more, 8%

2019 Cross-Industry Chief Compliance Officer Salary Survey 11
Annual Revenues of the Organization as a Whole Annual revenues in the organizations these CCOs work for vary widely across the sample, with 1 in 5 in organizations whose revenues are less than $15 million, but 32% in organizations with $1 billion or more in revenue.
Less than $5 million, 9%
$5 million–$14.9 million, 13%
$15 million–$29.9 million, 5%
$30 million–$49.9 million, 9%
$50 million–99.9 million, 7%
$100 million–$499.9 million, 15%
$500 million–$999.9 million, 9%
$1 billion–$2.9 billion, 14%
$3 billion or more, 18%

2019 Cross-Industry Chief Compliance Officer Salary Survey 12
Annual Revenues of the Organization That CCO Runs Compliance for Organizational revenues for the compliance functions of the business also vary from the very lowest (28% at less than $15 million) to the very highest (one-fourth at $1 billion or more).
Less than $5 million, 14%
$5 million–$14.9 million, 14%
$15 million–$29.9 million, 6%
$30 million–$49.9 million, 9%
$50 million–$99.9 million, 8%
$100 million–$499.9 million, 15%
$500 million–$999.9 million, 9%
$1 billion–2.9 billion, 11%
$3 billion or more, 14%

2019 Cross-Industry Chief Compliance Officer Salary Survey 13
Number of Countries in Which Compliance is Managed Although two-thirds of non-healthcare CCOs are responsible for managing compliance in one country, the other one-third manages multiple countries—including 14% overseeing compliance work in more than 10 countries.
1, 64%
2 to 5, 15%
6 to 10, 6%
11 or more, 14%

2019 Cross-Industry Chief Compliance Officer Salary Survey 14
Number of Years Managing the Compliance Department Slightly over half of non-healthcare CCOs have managed their department for fewer than 5 years; just 15% have had that role in their department for more than 10 years.
1–5, 58%
6–10, 27%
11–15, 9%
16 or more, 6%

2019 Cross-Industry Chief Compliance Officer Salary Survey 15
Certifications The most commonly held certification among non-healthcare CCOs is the CCEP, which 28% have. Even among these non-healthcare professionals, CHC is also fairly common (at 19%). No other single certification tested in the survey rises above 7%, although more than one-third report a variety of miscellaneous certifications.
15%
37%
1%
3%
2%
4%
4%
5%
5%
6%
7%
19%
28%
None
Other
Senior Professionals in Human Resources (SPHR)
Leading Professional in Ethics & Compliance (LPEC)
Certified in Healthcare Research Compliance (CHRC)
Certified Information Privacy Professional (CIPP)
Certified Fraud Examiner (CFE)
Certified Internal Auditor (CIA)
Certified in Healthcare Privacy Compliance (CHPC)
Certified Public Accountant (CPA)
Certified Compliance and Ethics Professional-International (CCEP-I)
Certified in Healthcare Compliance (CHC)
Certified Compliance and Ethics Professional (CCEP)

2019 Cross-Industry Chief Compliance Officer Salary Survey 16
Type of Organization These CCOs are most likely to work in privately held firms, at 40%; next most common are publicly traded firms (24%) and nonprofits (17%).
Nonprofit, 17%
Privately held, 40% Publicly traded, 24%
Governmental, 11%
Academic, 8%
Other, 1%

2019 Cross-Industry Chief Compliance Officer Salary Survey 17
Geographic Region Non-health-care CCOs are widely distributed across the country, with representation strongest in the South Atlantic, Pacific, and East North Central regions. Another 15% are based outside the US.
East North Central
East South Central Mid-Atlantic Mountain New England Pacific South Atlantic West North
Central West South
Central Illinois Alabama New Jersey Arizona Connecticut Alaska Delaware Iowa Arkansas
Indiana Kentucky New York Colorado Maine California Florida Kansas Louisiana
Michigan Mississippi Pennsylvania Idaho Massachusetts Hawaii Georgia Minnesota Oklahoma
Ohio Tennessee Montana New Hampshire Oregon Maryland Missouri Texas
Wisconsin Nevada Rhode Island Washington North Carolina Nebraska
New Mexico Vermont South Carolina North Dakota
Utah Virginia South Dakota
Wyoming Washington DC West Virginia
New England, 4% Mid-Atlantic, 11%
East North Central, 12%
West North Central, 9%
South Atlantic, 14% East South Central, 2%
West South Central, 9%
Mountain, 8%
Pacific, 12%
US, no region reported, 3%
Non-US, 15%

2019 Cross-Industry Chief Compliance Officer Salary Survey 18
Type of Industry Non-healthcare CCOs are more likely to work in insurance than in any other industry, although industries vary widely across the sample of respondents.
22%1%1%1%1%1%1%1%1%1%2%2%2%2%2%3%3%
4%4%4%
6%6%
7%9%
15%
Other
Research & Development
Supply Chain/Logistics
Real Estate/Mortgage
Telecommunications
Transportation/Warehousing
Utilities
Aerospace/Aviation/Defense
Accounting/Auditing
Biotechnical and Pharmaceutical
Chemical/Polymers/Fibers
Computer Software
Legal
Banking
Education/Training/Library
Consulting Services
Retail/Wholesale
Energy
Pharma/Medical Device
Information Technology
Manufacturing and Production
Financial Services
Government/Policy
Higher Education
Insurance

2019 Cross-Industry Chief Compliance Officer Salary Survey 19
Gender In this year’s survey, 60% of non-healthcare CCOs are women and 40% are men.
Men, 40%
Women, 60%

2019 Cross-Industry Chief Compliance Officer Salary Survey 20
Age Two-thirds of non-healthcare CCOs are between 40 and 59 years old, one in four are younger than 40, and 13% are 60 or older. Median age across CCOs is 48.
Less than 30, 1%
30–39, 21%
40–49, 34%
50–59, 32%
Over 60, 12%
Younger than 30, 2%
30–39, 22%
40–49, 30%
50–59, 34%
60 or older, 13%
Median Age 48

2019 Cross-Industry Chief Compliance Officer Salary Survey 21
Highest Level of Education 7 in 10 CCOs have an advanced degree, including nearly one-third with a JD.
Some college, 5%
Bachelor’s degree, 25%
MBA, 16%Master’s degree (non-MBA), 20%
JD, 30%
PhD, 4%

2019 Cross-Industry Chief Compliance Officer Salary Survey 22
Years in Compliance Profession Two-thirds of non-healthcare CCOs have been working in compliance for 5–19 years; one-fifth have been in the profession for more than 20 years, and 13% are relatively new: in compliance for less than 5 years.
Less than 5, 13%
5–9, 26%
10–19, 42%
20 or more, 18% Median Tenure
11 years

2019 Cross-Industry Chief Compliance Officer Salary Survey 23
Do You Have a Contract? 1 in 4 non-healthcare CCOs have a contract.
Yes, 26%
No, 74%
2019 Cross-Industry Chief Compliance Officer Salary Survey 24
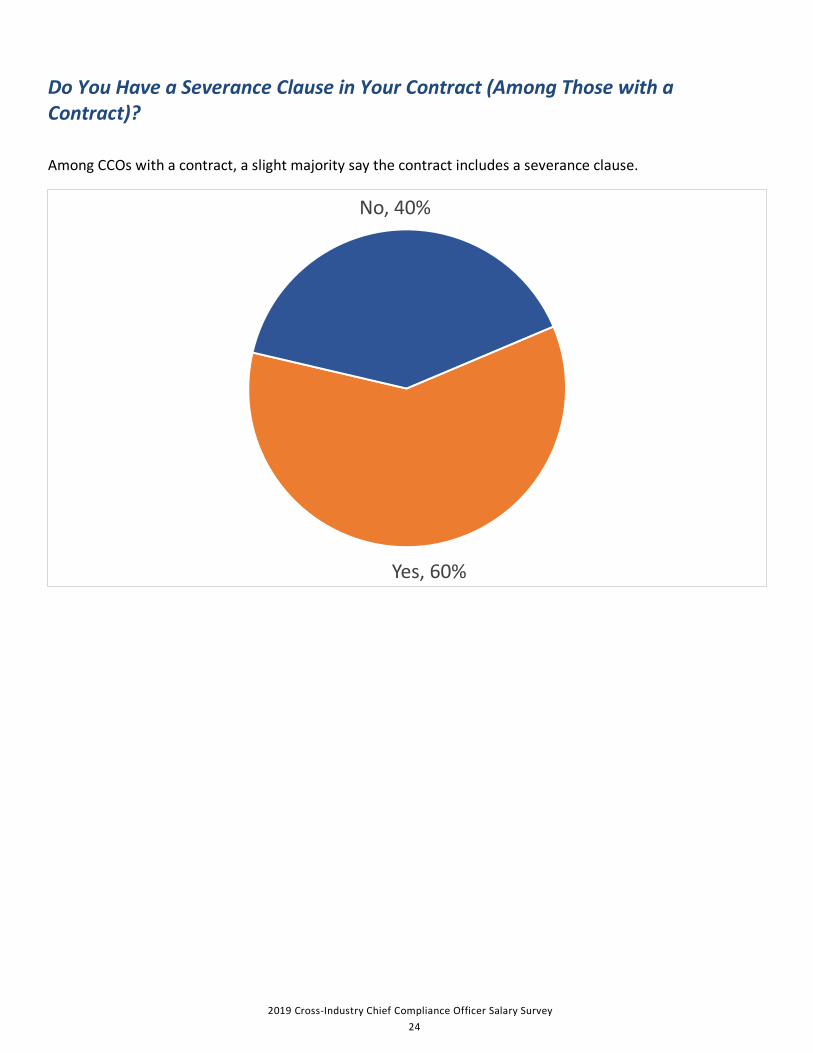
Do You Have a Severance Clause in Your Contract (Among Those with a Contract)? Among CCOs with a contract, a slight majority say the contract includes a severance clause.
Yes, 60%
No, 40%

2019 Cross-Industry Chief Compliance Officer Salary Survey25
Executive Summary

2019 Cross-Industry Chief Compliance Officer Salary Survey26
Average Total Compensation by Percentage of Company’s Legal and Regulatory Risk Areas CCO Involved in Total CCO compensation is linearly related to the proportion of risk managed, peaking at just over $190K among those managing more than 75% of the organization’s legal and regulatory risk.
$191,463
$182,253
$180,515
76%–100%
51%–75%
26%–50%
2019 Cross-Industry Chief Compliance Officer Salary Survey27
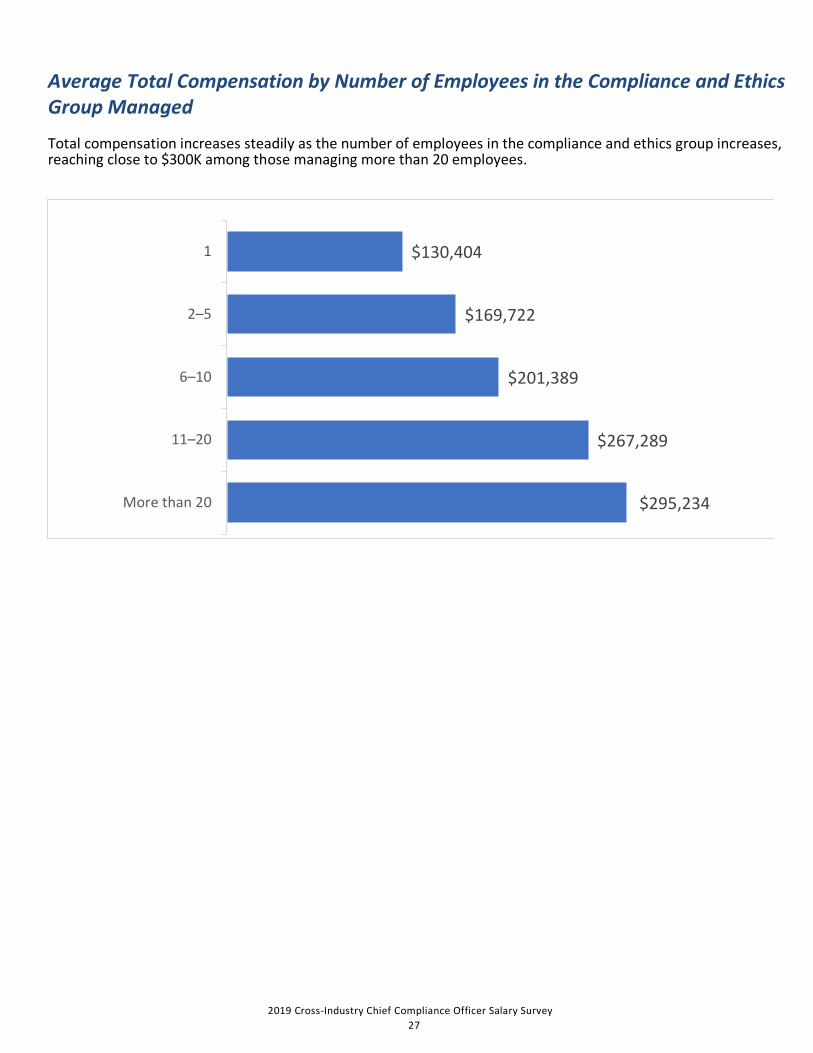
Average Total Compensation by Number of Employees in the Compliance and Ethics Group Managed Total compensation increases steadily as the number of employees in the compliance and ethics group increases, reaching close to $300K among those managing more than 20 employees.
$295,234
$267,289
$201,389
$169,722
$130,404
More than 20
11–20
6–10
2–5
1
2019 Cross-Industry Chief Compliance Officer Salary Survey28
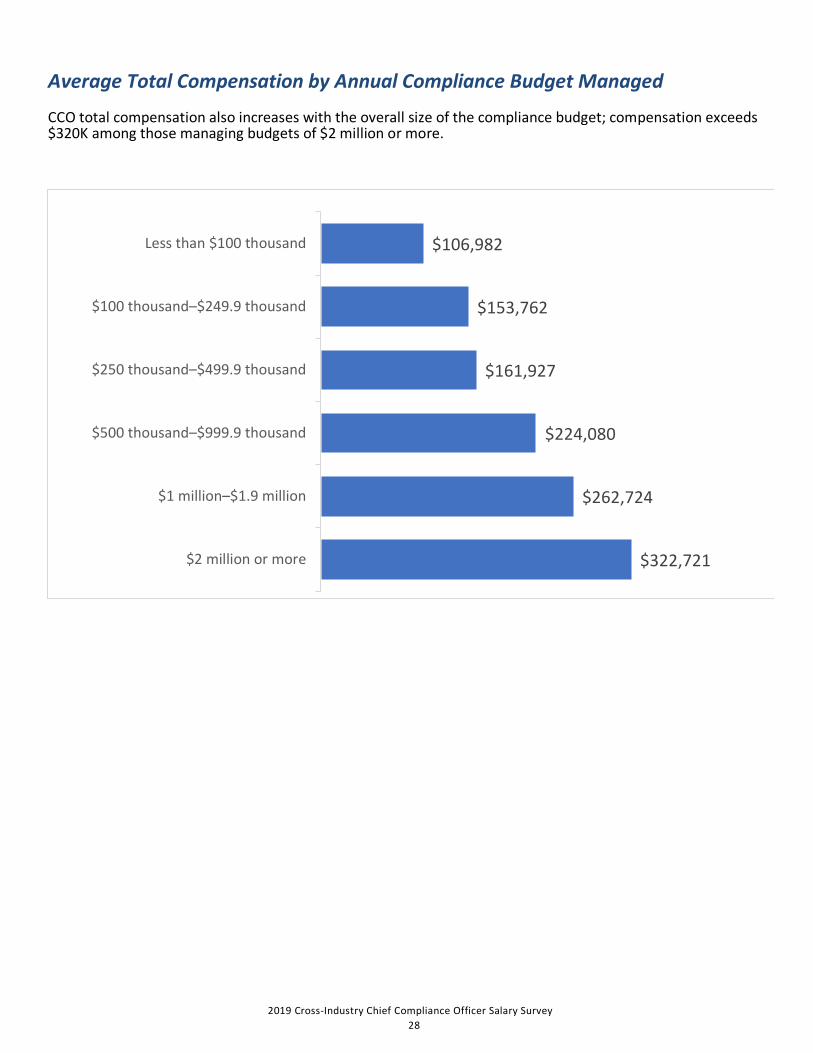
Average Total Compensation by Annual Compliance Budget Managed CCO total compensation also increases with the overall size of the compliance budget; compensation exceeds $320K among those managing budgets of $2 million or more.
$322,721
$262,724
$224,080
$161,927
$153,762
$106,982
$2 million or more
$1 million–$1.9 million
$500 thousand–$999.9 thousand
$250 thousand–$499.9 thousand
$100 thousand–$249.9 thousand
Less than $100 thousand

2019 Cross-Industry Chief Compliance Officer Salary Survey29
Average Total Compensation by Number of Employees That CCO Runs Compliance for Although the relationship isn’t strictly linear, CCO compensation tends to increase with the number of employees falling under the CCO’s responsibility.
$352,809
$217,486
$259,281
$242,756
$201,871
$167,309
$135,902
$151,227
$147,000
$150,297
15,000 or more
7,500–14,999
5,000–7,499
3,000–4,999
2,000–2,999
1,000–1,999
500–999
250–499
100–249
Fewer than 100

2019 Cross-Industry Chief Compliance Officer Salary Survey30
Average Total Compensation by Revenue That CCO Runs Compliance for CCO compensation is clearly highest among those whose compliance department accounts for more than $3 billion in organization revenue.
$352,482
$221,794
$196,765
$176,311
$182,032
$131,003
$111,087
$111,264
$127,991
$3 billion or more
$1 billion–$2.9 billion
$500 million–$999.9 million
$100 million–$499.9 million
$50 million–$99.9 million
$30 million–$49.9 million
$15 million–$29.9 million
$5 million–$14.9 million
Less than $5 million

2019 Cross-Industry Chief Compliance Officer Salary Survey31
Average Total Compensation by Number of Years Managing the Compliance Department Total compensation varies by number of years managing the compliance department, with no clear correlation between tenure in the department and compensation.
$186,997
$195,548
$203,154
$152,716
$173,607
$149,801
$200,642
$187,602
16 or more
11–15
6–10
5
4
3
2
1

2019 Cross-Industry Chief Compliance Officer Salary Survey32
Average Total Compensation By Years in the Compliance Profession More reliable as a predictor of compensation than years in a particular department is total years of compliance experience, with those in the field for more than 20 years making the most.
$256,573
$215,914
$202,865
$178,352
$108,083
$133,852
21 or more years
16–20 years
11–15 years
6–10 years
3–5 years
Less than 3 years

2019 Cross-Industry Chief Compliance Officer Salary Survey33
Average Total Compensation by Type of Organization Non-healthcare compensation is by far highest for those working in publicly traded companies.
$133,236
$139,155
$148,604
$154,846
$312,239
Nonprofit
Governmental
Academic
Privately held
Publicly traded
2019 Cross-Industry Chief Compliance Officer Salary Survey34
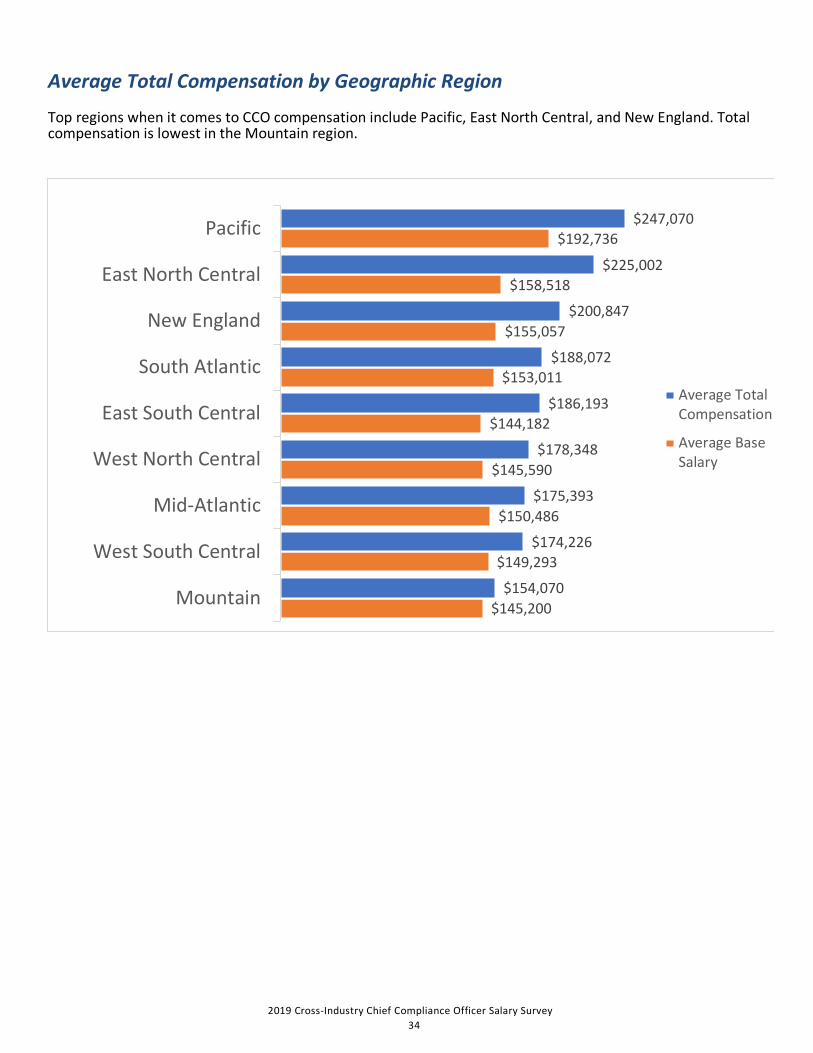
Average Total Compensation by Geographic Region Top regions when it comes to CCO compensation include Pacific, East North Central, and New England. Total compensation is lowest in the Mountain region.
$145,200
$149,293
$150,486
$145,590
$144,182
$153,011
$155,057
$158,518
$192,736
$154,070
$174,226
$175,393
$178,348
$186,193
$188,072
$200,847
$225,002
$247,070
Mountain
West South Central
Mid-Atlantic
West North Central
East South Central
South Atlantic
New England
East North Central
Pacific
Average TotalCompensation
Average BaseSalary

2019 Cross-Industry Chief Compliance Officer Salary Survey35
Average Total Compensation by Certification Compensation is highest among CIPP, CCEP-I, CPA, LPEC, and CCEP certificants.
$141,359
$192,797
$155,138
$162,182
$164,434
$192,676
$194,230
$207,332
$221,075
$232,427
$240,424
$253,289
None
Other
Certified in Healthcare Privacy Compliance (CHPC)
Certified Fraud Examiner (CFE)
Certified in Healthcare Research Compliance (CHRC)
Certified in Healthcare Compliance (CHC)
Certified Internal Auditor (CIA)
Certified Compliance and Ethics Professional (CCEP)
Leading Professional in Ethics & Compliance (LPEC)
Certified Public Accountant (CPA)
Certified Compliance and Ethics Professional-International (CCEP-I)
Certified Information Privacy Professional (CIPP)

2019 Cross-Industry Chief Compliance Officer Salary Survey36
Average Total Compensation by Industry CCO compensation tends to be highest in the retail, manufacturing, and computer software industries; it’s lower in government agencies and educational institutions.
$133,327
$146,787
$157,417
$169,210
$185,700
$197,915
$201,116
$211,970
$217,472
$223,215
$243,843
$257,792
Government/ Policy
Higher Education
Chemical/ Polymers/ Fibers
Consulting Services
Education/ Training/ Library
Insurance
Information Technology
Financial Services
Energy
Computer Software
Manufacturing and Production
Retail/Wholesale

2019 Cross-Industry Chief Compliance Officer Salary Survey37
Average Total Compensation by Age CCO compensation is, not surprisingly, lowest for those under 40 years old. Compensation levels peak at age 50–59.
$164,075
$213,542
$223,106
$223,411
$213,627
$171,807
$140,685
$89,098
$73,394
65 or older
60–64
55–59
50–54
45–49
40–44
35–39
30–34
Younger than 30

2019 Cross-Industry Chief Compliance Officer Salary Survey38
Amount of Bonus Eligible Two-thirds of non-healthcare CCOs receive a bonus tied to salary, although the percentage used to calculate the bonus varies widely.
None, 34%
0%–10% of salary, 18% 11%–20% of salary, 16%
21%–30% of salary, 14%
31%–40% of salary, 8%
41% or more of salary, 10%

2019 Cross-Industry Chief Compliance Officer Salary Survey39
Basis of Bonus Two-thirds of non-healthcare CCOs who get a bonus say it’s tied to both company and personal performance. For those saying one or the other, company performance is a bit more likely to be the basis of the bonus than personal performance.
Company performance, 20%
Personal performance,
12%
Both, 68%

2019 Cross-Industry Chief Compliance Officer Salary Survey40
Average Total Compensation by Contract Status Total compensation is slightly higher among CCOs with a contract than among those without a contract.
$183,976
$190,983
No contract
Has a contract

2019 Cross-Industry Chief Compliance Officer Salary Survey41
Average Total Compensation by Severance Clause Status Total compensation is also higher among CCOs with a severance clause in their contract than among those without a severance clause.
$165,039
$208,513
No severanceclause
Have severanceclause

2019 Cross-Industry Chief Compliance Officer Salary Survey42
Salary Data

2019 Cross-Industry Chief Compliance Officer Salary Survey43
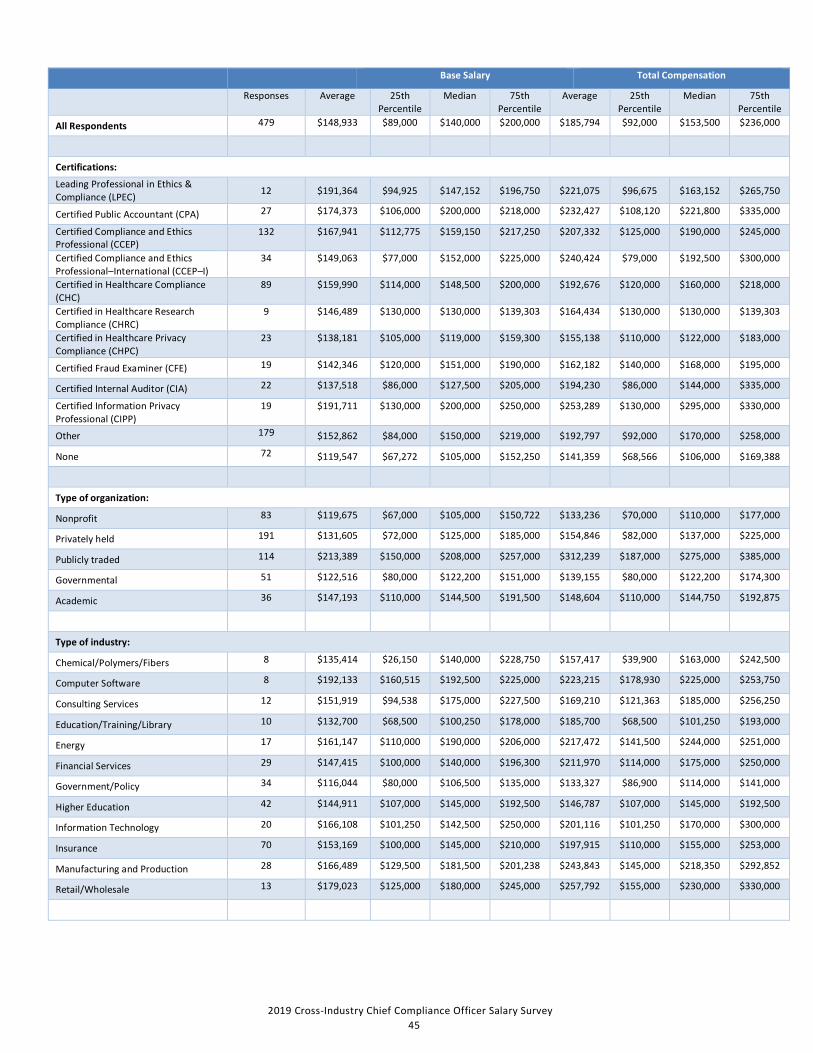
Chief Compliance Officer Salary Results Non-Healthcare
Base Salary Total Compensation
Responses Average 25th Percentile
Median 75th Percentile
Average 25th Percentile
Median 75th Percentile
All Respondents 479 $148,933 $89,000 $140,000 $200,000 $185,794 $92,000 $153,500 $236,000
Percentage of company's legal and regulatory risk areas CCO involved in:
26%–50% 123 $144,642 $90,000 $129,000 $200,000 $180,515 $91,000 $140,000 $235,000
51%–75% 148 $144,248 $70,000 $128,000 $194,250 $182,253 $72,688 $136,000 $239,250
76%–100% 208 $154,803 $100,000 $149,500 $200,000 $191,463 $105,000 $165,000 $240,000
Number of employees in the compliance and ethics group managed:
1 113 $118,145 $65,000 $105,000 $155,000 $130,404 $67,800 $107,000 $167,550
2 to 5 212 $142,200 $92,750 $131,500 $195,283 $169,722 $100,500 $147,000 $230,000
6 to 10 66 $162,337 $106,000 $150,000 $215,000 $201,389 $122,200 $175,000 $267,000
11 to 15 25 $201,700 $145,000 $200,000 $220,000 $306,140 $145,000 $210,000 $290,000
16 to 20 10 $132,050 $106,000 $131,000 $144,000 $170,162 $108,120 $149,500 $210,000
More than 20 53 $203,109 $140,000 $220,000 $267,000 $295,234 $183,000 $295,000 $390,000
Annual compliance budget managed:
< $100k 166 $97,339 $60,000 $90,000 $130,000 $106,982 $60,300 $97,750 $137,000
$100k–$249k 66 $131,610 $74,000 $109,075 $175,000 $153,762 $82,100 $123,500 $200,001
$250k–$499k 55 $139,736 $107,000 $144,000 $175,000 $161,927 $110,000 $151,000 $195,000
$500k–$999k 71 $183,694 $140,000 $185,000 $225,000 $224,080 $160,000 $221,800 $284,000
$1m–$1.9m 44 $202,039 $159,250 $200,000 $244,250 $262,724 $192,500 $233,125 $297,500
$2m+ 77 $219,178 $150,000 $212,000 $275,000 $322,721 $192,250 $295,000 $390,000
Number of employees that CCO runs compliance for:
Less than 100 89 $129,943 $60,000 $100,000 $175,000 $150,297 $60,975 $110,000 $199,500
100–249 56 $128,650 $75,375 $114,500 $178,750 $147,000 $85,100 $125,000 $206,500
250–499 63 $131,633 $90,000 $128,000 $180,000 $151,227 $90,000 $130,000 $194,000
500–999 70 $118,469 $74,000 $114,000 $150,000 $135,902 $80,000 $120,500 $171,000
1,000–1,999 44 $141,643 $92,500 $140,000 $200,000 $167,309 $94,000 $144,500 $229,500
2,000–2,999 21 $165,838 $110,000 $150,000 $240,000 $201,871 $121,000 $174,300 $275,000
3,000–4,999 37 $181,249 $127,000 $192,000 $240,000 $242,756 $141,000 $244,000 $298,000
5,000–7,499 22 $194,654 $148,500 $178,000 $275,000 $259,281 $165,000 $195,950 $385,000
7,500–14,999 38 $177,055 $152,000 $183,500 $205,000 $217,486 $167,000 $194,500 $292,856
15,000+ 39 $219,285 $162,060 $220,000 $285,000 $352,809 $192,500 $290,000 $528,650

2019 Cross-Industry Chief Compliance Officer Salary Survey44
Base Salary Total Compensation
Responses Average 25th Percentile
Median 75th Percentile
Average 25th Percentile
Median 75th Percentile
All Respondents 479 $148,933 $89,000 $140,000 $200,000 $185,794 $92,000 $153,500 $236,000
Annual revenues of part of organization that the CCO runs compliance for:
Less than $5 million 67 $111,078 $55,000 $100,000 $155,000 $127,991 $56,000 $100,000 $182,000
$5 million to less than $15 million 65 $95,998 $64,000 $90,000 $125,000 $111,264 $65,000 $102,000 $130,000
$15 million to less than $30 million 27 $104,313 $67,000 $90,000 $144,000 $111,087 $67,600 $104,000 $160,000
$30 million to less than $50 million 43 $119,527 $83,000 $105,000 $159,000 $131,003 $86,000 $110,000 $180,000
$50 million to less than $100 million 38 $168,850 $84,900 $147,500 $190,000 $182,032 $108,000 $145,000 $225,000
$100 million to less than $500 million 74 $148,803 $110,000 $150,000 $200,000 $176,311 $118,000 $167,500 $236,000
$500 million to less than $1 billion 41 $161,163 $120,000 $167,550 $210,000 $196,765 $122,000 $169,300 $232,000
$1 billion to less than $3 billion 55 $176,128 $140,000 $170,000 $215,000 $221,794 $155,000 $210,000 $290,000
$3 billion or more 69 $231,567 $185,000 $220,000 $285,000 $352,482 $211,700 $304,000 $417,000
Number of countries in which compliance is managed:
1 308 $128,559 $75,000 $120,000 $174,825 $148,463 $80,000 $127,250 $192,000
2 to 5 73 $160,264 $90,000 $167,680 $218,000 $203,952 $96,765 $200,001 $242,000
6 to 10 30 $171,023 $120,000 $157,500 $200,000 $198,946 $140,000 $191,500 $241,000
11 or more 67 $220,183 $178,000 $220,000 $265,000 $331,734 $201,000 $292,838 $390,000
Number of years managing the compliance department:
1 or less 89 $152,155 $100,000 $145,000 $190,000 $187,602 $110,000 $152,000 $230,000
2 58 $164,155 $90,000 $150,000 $210,000 $200,642 $90,000 $177,500 $250,030
3 47 $127,203 $75,000 $119,000 $180,000 $149,801 $86,900 $126,000 $225,000
4 38 $150,779 $90,000 $121,500 $219,000 $173,607 $100,000 $135,000 $221,800
5 35 $130,371 $70,000 $120,000 $210,000 $152,716 $70,200 $137,000 $218,000
6–10 94 $150,206 $86,000 $150,361 $200,000 $203,154 $93,000 $168,425 $253,000
11–15 59 $147,804 $80,000 $140,000 $210,000 $195,548 $80,000 $165,000 $282,000
16 or more 59 $155,339 $91,000 $140,000 $200,000 $186,997 $97,000 $155,000 $219,000
Years in compliance profession:
<3 years 25 $121,220 $77,000 $129,000 $165,000 $133,852 $77,000 $129,000 $179,000
3–5 years 68 $91,380 $55,505 $73,000 $129,375 $108,083 $56,335 $75,000 $130,750
6–10 years 142 $140,250 $80,000 $120,000 $190,000 $178,352 $84,500 $130,000 $230,000
11–15 years 125 $161,396 $110,000 $155,000 $200,000 $202,865 $120,700 $180,300 $240,000
16–20 years 70 $164,584 $119,000 $153,500 $210,000 $215,914 $130,000 $183,361 $280,000
21+ years 49 $213,949 $156,000 $200,000 $250,000 $256,573 $168,750 $218,000 $304,000
2019 Cross-Industry Chief Compliance Officer Salary Survey45
Base Salary Total Compensation
Responses Average 25th Percentile
Median 75th Percentile
Average 25th Percentile
Median 75th Percentile
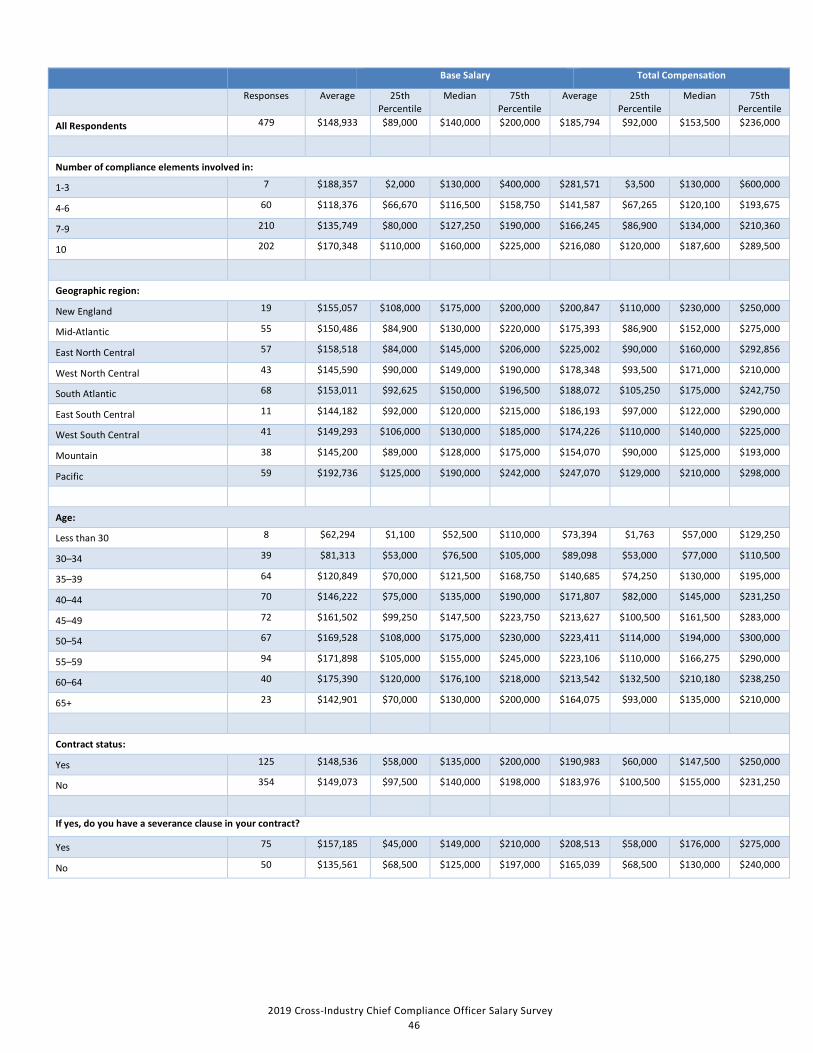
All Respondents 479 $148,933 $89,000 $140,000 $200,000 $185,794 $92,000 $153,500 $236,000
Certifications:
Leading Professional in Ethics & Compliance (LPEC) 12 $191,364 $94,925 $147,152 $196,750 $221,075 $96,675 $163,152 $265,750
Certified Public Accountant (CPA) 27 $174,373 $106,000 $200,000 $218,000 $232,427 $108,120 $221,800 $335,000
Certified Compliance and Ethics Professional (CCEP)
132 $167,941 $112,775 $159,150 $217,250 $207,332 $125,000 $190,000 $245,000
Certified Compliance and Ethics Professional–International (CCEP–I)
34 $149,063 $77,000 $152,000 $225,000 $240,424 $79,000 $192,500 $300,000
Certified in Healthcare Compliance (CHC)
89 $159,990 $114,000 $148,500 $200,000 $192,676 $120,000 $160,000 $218,000
Certified in Healthcare Research Compliance (CHRC)
9 $146,489 $130,000 $130,000 $139,303 $164,434 $130,000 $130,000 $139,303
Certified in Healthcare Privacy Compliance (CHPC)
23 $138,181 $105,000 $119,000 $159,300 $155,138 $110,000 $122,000 $183,000
Certified Fraud Examiner (CFE) 19 $142,346 $120,000 $151,000 $190,000 $162,182 $140,000 $168,000 $195,000
Certified Internal Auditor (CIA) 22 $137,518 $86,000 $127,500 $205,000 $194,230 $86,000 $144,000 $335,000
Certified Information Privacy Professional (CIPP)
19 $191,711 $130,000 $200,000 $250,000 $253,289 $130,000 $295,000 $330,000
Other 179 $152,862 $84,000 $150,000 $219,000 $192,797 $92,000 $170,000 $258,000
None 72 $119,547 $67,272 $105,000 $152,250 $141,359 $68,566 $106,000 $169,388
Type of organization:
Nonprofit 83 $119,675 $67,000 $105,000 $150,722 $133,236 $70,000 $110,000 $177,000
Privately held 191 $131,605 $72,000 $125,000 $185,000 $154,846 $82,000 $137,000 $225,000
Publicly traded 114 $213,389 $150,000 $208,000 $257,000 $312,239 $187,000 $275,000 $385,000
Governmental 51 $122,516 $80,000 $122,200 $151,000 $139,155 $80,000 $122,200 $174,300
Academic 36 $147,193 $110,000 $144,500 $191,500 $148,604 $110,000 $144,750 $192,875
Type of industry:
Chemical/Polymers/Fibers 8 $135,414 $26,150 $140,000 $228,750 $157,417 $39,900 $163,000 $242,500
Computer Software 8 $192,133 $160,515 $192,500 $225,000 $223,215 $178,930 $225,000 $253,750
Consulting Services 12 $151,919 $94,538 $175,000 $227,500 $169,210 $121,363 $185,000 $256,250
Education/Training/Library 10 $132,700 $68,500 $100,250 $178,000 $185,700 $68,500 $101,250 $193,000
Energy 17 $161,147 $110,000 $190,000 $206,000 $217,472 $141,500 $244,000 $251,000
Financial Services 29 $147,415 $100,000 $140,000 $196,300 $211,970 $114,000 $175,000 $250,000
Government/Policy 34 $116,044 $80,000 $106,500 $135,000 $133,327 $86,900 $114,000 $141,000
Higher Education 42 $144,911 $107,000 $145,000 $192,500 $146,787 $107,000 $145,000 $192,500
Information Technology 20 $166,108 $101,250 $142,500 $250,000 $201,116 $101,250 $170,000 $300,000
Insurance 70 $153,169 $100,000 $145,000 $210,000 $197,915 $110,000 $155,000 $253,000
Manufacturing and Production 28 $166,489 $129,500 $181,500 $201,238 $243,843 $145,000 $218,350 $292,852
Retail/Wholesale 13 $179,023 $125,000 $180,000 $245,000 $257,792 $155,000 $230,000 $330,000
2019 Cross-Industry Chief Compliance Officer Salary Survey46
Base Salary Total Compensation
Responses Average 25th Percentile
Median 75th Percentile
Average 25th Percentile
Median 75th Percentile
All Respondents 479 $148,933 $89,000 $140,000 $200,000 $185,794 $92,000 $153,500 $236,000
Number of compliance elements involved in:
1-3 7 $188,357 $2,000 $130,000 $400,000 $281,571 $3,500 $130,000 $600,000
4-6 60 $118,376 $66,670 $116,500 $158,750 $141,587 $67,265 $120,100 $193,675
7-9 210 $135,749 $80,000 $127,250 $190,000 $166,245 $86,900 $134,000 $210,360
10 202 $170,348 $110,000 $160,000 $225,000 $216,080 $120,000 $187,600 $289,500
Geographic region:
New England 19 $155,057 $108,000 $175,000 $200,000 $200,847 $110,000 $230,000 $250,000
Mid-Atlantic 55 $150,486 $84,900 $130,000 $220,000 $175,393 $86,900 $152,000 $275,000
East North Central 57 $158,518 $84,000 $145,000 $206,000 $225,002 $90,000 $160,000 $292,856
West North Central 43 $145,590 $90,000 $149,000 $190,000 $178,348 $93,500 $171,000 $210,000
South Atlantic 68 $153,011 $92,625 $150,000 $196,500 $188,072 $105,250 $175,000 $242,750
East South Central 11 $144,182 $92,000 $120,000 $215,000 $186,193 $97,000 $122,000 $290,000
West South Central 41 $149,293 $106,000 $130,000 $185,000 $174,226 $110,000 $140,000 $225,000
Mountain 38 $145,200 $89,000 $128,000 $175,000 $154,070 $90,000 $125,000 $193,000
Pacific 59 $192,736 $125,000 $190,000 $242,000 $247,070 $129,000 $210,000 $298,000
Age:
Less than 30 8 $62,294 $1,100 $52,500 $110,000 $73,394 $1,763 $57,000 $129,250
30–34 39 $81,313 $53,000 $76,500 $105,000 $89,098 $53,000 $77,000 $110,500
35–39 64 $120,849 $70,000 $121,500 $168,750 $140,685 $74,250 $130,000 $195,000
40–44 70 $146,222 $75,000 $135,000 $190,000 $171,807 $82,000 $145,000 $231,250
45–49 72 $161,502 $99,250 $147,500 $223,750 $213,627 $100,500 $161,500 $283,000
50–54 67 $169,528 $108,000 $175,000 $230,000 $223,411 $114,000 $194,000 $300,000
55–59 94 $171,898 $105,000 $155,000 $245,000 $223,106 $110,000 $166,275 $290,000
60–64 40 $175,390 $120,000 $176,100 $218,000 $213,542 $132,500 $210,180 $238,250
65+ 23 $142,901 $70,000 $130,000 $200,000 $164,075 $93,000 $135,000 $210,000
Contract status:
Yes 125 $148,536 $58,000 $135,000 $200,000 $190,983 $60,000 $147,500 $250,000
No 354 $149,073 $97,500 $140,000 $198,000 $183,976 $100,500 $155,000 $231,250
If yes, do you have a severance clause in your contract?
Yes 75 $157,185 $45,000 $149,000 $210,000 $208,513 $58,000 $176,000 $275,000
No 50 $135,561 $68,500 $125,000 $197,000 $165,039 $68,500 $130,000 $240,000

2019 Cross-Industry Chief Compliance Officer Salary Survey47
Detailed Results

2019 Cross-Industry Chief Compliance Officer Salary Survey48
Chief Compliance Officer Detailed Results Non-Healthcare
Annual Compliance Budget Managed
All Respondents < $100k $100k–
$249k $250k–$499k
$500k–$999k $1m+
Are you the compliance officer for:
Responses 479 166 66 55 71 121
Your organization as a whole 70% 71% 68% 62% 79% 69%
A division or operating unit of the organization 30% 29% 32% 38% 21% 31%
Percentage indicating involvement in the following compliance elements:
Responses 479 166 66 55 71 121
Compliance Auditing/Monitoring 94% 96% 92% 93% 99% 91%
Compliance Education 94% 94% 91% 96% 99% 93%
Compliance Investigations 89% 88% 88% 89% 93% 88%
Hot Line/Anonymous Reporting 75% 65% 77% 78% 87% 79%
Reporting to the Board 76% 70% 71% 75% 87% 80%
Compliance Risk Assessments 91% 92% 83% 91% 99% 92%
Compliance Discipline/Incentives 68% 62% 68% 71% 83% 67%
Code of Conduct 85% 80% 86% 84% 97% 84%
Policies and Procedures 98% 100% 97% 96% 99% 97%
Measuring Program Effectiveness 83% 79% 79% 78% 94% 88%
How much of your company’s legal and regulatory risk areas are you responsible for managing?
Responses 479 166 66 55 71 121
26%–50% 26% 27% 23% 22% 24% 29%
51%–75% 31% 34% 38% 24% 24% 31%
76%–100% 43% 40% 39% 55% 52% 40%
How many employees, including you, are in the compliance and ethics group you manage?
Responses 479 166 66 55 71 121
1 24% 45% 27% 29% 4% 2%
2 to 5 44% 41% 61% 56% 62% 24%
6 to 10 14% 5% 5% 11% 25% 25%
11 to 15 5% 2% 0% 2% 6% 14%
16 to 20 2% 2% 2% 0% 0% 4%
More than 20 11% 5% 6% 2% 3% 31%

2019 Cross-Industry Chief Compliance Officer Salary Survey49
Annual Compliance Budget Managed
All Respondents < $100k
$100k–$249k
$250k–$499k
$500k–$999k $1m+
Annual compliance budget managed:
Responses 479 166 66 55 71 121
75th Percentile $1,000,000 $25,000 $200,000 $325,000 $750,000 $4,122,500
Median $250,000 $2,000 $150,000 $300,000 $600,000 $2,000,000
25th Percentile $25,000 $0 $100,000 $250,000 $500,000 $1,500,000
Average $29,417,832 $17,171 $153,530 $305,754 $638,434 $116,554,958
<$100k 35% 100% 0% 0% 0% 0%
$100k–$249k 14% 0% 100% 0% 0% 0%
$250k–$499k 11% 0% 0% 100% 0% 0%
$500k–$999k 15% 0% 0% 0% 100% 0%
$1m–$1.9m 9% 0% 0% 0% 0% 36%
$2m+ 16% 0% 0% 0% 0% 64%
Approximately how many employees work in your organization as a whole?
Responses 479 166 66 55 71 121
Less than 100 13% 18% 18% 18% 6% 4%
100–249 10% 16% 18% 9% 3% 1%
250–499 11% 14% 11% 18% 10% 5%
500–999 14% 17% 17% 11% 14% 9%
1,000–1,999 10% 7% 12% 9% 17% 8%
2,000–2,999 5% 5% 3% 7% 7% 6%
3,000–4,999 8% 7% 3% 5% 14% 11%
5,000–7,499 6% 3% 2% 5% 8% 11%
7,500–9,999 3% 1% 5% 2% 0% 7%
10,000–14,999 6% 3% 8% 5% 13% 5%
15,000–19,999 2% 0% 0% 0% 3% 6%
20,000–29,999 2% 1% 3% 2% 1% 3%
30,000–49,999 2% 1% 0% 0% 1% 5%
50,000–74,999 3% 2% 2% 2% 1% 7%
75,000–99,999 3% 1% 0% 4% 0% 7%
100,000 + 3% 4% 0% 2% 1% 7%

2019 Cross-Industry Chief Compliance Officer Salary Survey50
Annual Compliance Budget Managed
All Respondents < $100k
$100k–$249k
$250k–$499k
$500k–$999k $1m+
Approximately how many employees work in the portion of the organization that you run compliance for?
Responses 479 166 66 55 71 121
Less than 100 19% 25% 26% 22% 7% 12%
100–249 12% 17% 20% 15% 7% 2%
250–499 13% 16% 11% 18% 14% 7%
500–999 15% 18% 15% 16% 13% 10%
1,000–1,999 9% 7% 11% 7% 17% 7%
2,000–2,999 4% 4% 3% 5% 4% 5%
3,000–4,999 8% 5% 3% 2% 15% 12%
5,000–7,499 5% 1% 2% 4% 7% 10%
7,500–9,999 3% 1% 3% 2% 1% 8%
10,000–14,999 5% 3% 6% 7% 8% 3%
15,000–19,999 1% 1% 0% 0% 3% 3%
20,000–29,999 2% 0% 2% 0% 3% 4%
30,000–49,999 1% 1% 0% 0% 0% 4%
50,000–74,999 1% 1% 0% 0% 0% 4%
75,000–99,999 1% 0% 0% 0% 0% 2%
100,000 + 2% 1% 0% 2% 0% 5%
What are the annual revenues of the organization you work for?
Responses 479 166 66 55 71 121
Less than $5 million 9% 16% 6% 5% 7% 4%
$5 million to less than $15 million 13% 23% 20% 13% 3% 3%
$15 million to less than $30 million 5% 7% 8% 9% 4% 1%
$30 million to less than $50 million 9% 10% 18% 4% 7% 5%
$50 million to less than $100 million 7% 6% 12% 11% 10% 3%
$100 million to less than $500 million 15% 13% 20% 22% 24% 7%
$500 million to less than $1 billion 9% 7% 6% 9% 6% 14%
$1 billion to less than $3 billion 14% 7% 8% 16% 28% 19%
$3 billion or more 18% 11% 3% 11% 11% 43%
What are the annual revenues for the portion of the organization that your part of the compliance and ethics program oversees?
Responses 479 166 66 55 71 121
Less than $5 million 14% 23% 11% 11% 10% 7%
$5 million to less than $15 million 14% 21% 24% 11% 6% 3%
$15 million to less than $30 million 6% 7% 9% 9% 4% 1%
$30 million to less than $50 million 9% 11% 15% 9% 7% 4%
$50 million to less than $100 million 8% 6% 9% 15% 10% 6%
$100 million to less than $500 million 15% 13% 20% 16% 27% 10%
$500 million to less than $1 billion 9% 7% 6% 9% 7% 13%
$1 billion to less than $3 billion 11% 6% 5% 11% 23% 17%
$3 billion or more 14% 7% 2% 9% 7% 39%

2019 Cross-Industry Chief Compliance Officer Salary Survey51
Annual Compliance Budget Managed
All Respondents < $100k
$100k–$249k
$250k–$499k
$500k–$999k $1m+
For how many countries do you manage compliance?
Responses 479 166 66 55 71 121
1 64% 76% 65% 71% 56% 50%
2-5 15% 13% 26% 18% 14% 13%
6-10 6% 4% 8% 7% 8% 7%
11 or more 14% 7% 2% 4% 21% 31%
Where do you work?
Responses 479 166 66 55 71 121
United States 85% 81% 83% 84% 92% 87%
North America, other than the US 2% 2% 2% 0% 1% 2%
South America 2% 1% 5% 0% 0% 3%
Europe 6% 10% 3% 4% 4% 2%
Asia 4% 4% 5% 7% 3% 2%
Africa 3% 2% 3% 4% 0% 3%
Australia 0% 0% 0% 2% 0% 0%
Current age:
Responses 479 166 66 55 71 121
75th Percentile 56 55 55 57 58 57
Median 48 46 45 50 50 53
25th Percentile 40 37 38 41 43 42
Average 48.0 45.4 45.8 49.7 51.1 50.2
Gender:
Responses 479 166 66 55 71 121
Male 40% 25% 33% 51% 49% 55%
Female 60% 75% 67% 49% 51% 45%
Years in compliance profession:
Responses 479 166 66 55 71 121
75th Percentile 15 12 15 19 17 20
Median 11 9 10 12 12 13
25th Percentile 6 5 6 7 9 10
Average 12.0 9.7 10.4 13.5 13.3 14.8
Years with current employer:
Responses 479 166 66 55 71 121
75th Percentile 10 9 9 9 11 12
Median 5 4 4 5 6 6
25th Percentile 2 1 2 2 3 2
Average 7.6 6.9 6.9 6.9 8.8 8.4

2019 Cross-Industry Chief Compliance Officer Salary Survey52
Annual Compliance Budget Managed
All Respondents < $100k
$100k–$249k
$250k–$499k
$500k–$999k $1m+
Years holding current job title:
Responses 479 166 66 55 71 121
75th Percentile 6 5 4 7 6 6
Median 3 3 2 4 4 3
25th Percentile 1 1 1 2 2 1
Average 4.4 3.9 3.8 5.5 5.2 4.5
Industry:
Responses 479 166 66 55 71 121
Accounting/Auditing 1% 2% 0% 0% 0% 2%
Administrative and Support Services * 0% 2% 0% 1% 0%
Advertising/Marketing * 1% 0% 0% 0% 0%
Public Relations * 0% 0% 0% 0% 1%
Aerospace/Aviation/Defense 1% 1% 3% 0% 3% 0%
Architectural Services * 0% 0% 0% 1% 0%
Automotive/Motor Vehicles/Parts * 1% 0% 0% 0% 0%
Banking 2% 2% 3% 4% 0% 1%
Biotechnical and Pharmaceutical 1% 1% 3% 2% 1% 2%
Chemical/Polymers/Fibers 2% 1% 3% 0% 3% 2%
Computer Hardware * 1% 0% 0% 1% 0%
Computer Services * 0% 0% 2% 1% 0%
Computer Software 2% 2% 3% 0% 0% 2%
Construction 1% 0% 0% 2% 3% 0%
Consulting Services 3% 4% 3% 0% 3% 1%
Consumer Products * 0% 0% 0% 0% 1%
Education/Training/Library 2% 2% 3% 2% 0% 3%
Electronics * 1% 0% 0% 0% 0%
Energy 4% 3% 3% 5% 4% 3%
Engineering * 0% 0% 0% 1% 1%
Financial Services 6% 7% 6% 9% 1% 6%
Government/Policy 7% 7% 9% 7% 4% 8%
Higher Education 9% 8% 5% 13% 11% 8%
Hospitality/Tourism * 1% 0% 2% 0% 0%
Human Resources/Recruiting * 0% 0% 0% 0% 1%
Information Technology 4% 6% 5% 4% 3% 2%
Insurance 15% 13% 11% 7% 20% 20%
Internet/ECommerce * 0% 0% 0% 0% 1%
Law Enforcement/Security Services * 1% 0% 0% 0% 0%
Legal 2% 2% 3% 2% 3% 0%
Manufacturing and Production 6% 3% 5% 5% 11% 7%
Military * 0% 0% 2% 0% 0%
Mining * 1% 0% 0% 0% 1%

2019 Cross-Industry Chief Compliance Officer Salary Survey53
Annual Compliance Budget Managed
All Respondents < $100k
$100k–$249k
$250k–$499k
$500k–$999k $1m+
Operations Management * 1% 0% 0% 1% 0%
Pharma/Medical Device 4% 3% 6% 7% 3% 3%
Real Estate/Mortgage 1% 1% 2% 0% 0% 2%
Research & Development 1% 0% 2% 4% 0% 0%
Restaurant and Food Service * 0% 2% 0% 0% 0%
Retail/Wholesale 3% 2% 3% 2% 0% 5%
Science * 0% 0% 0% 0% 1%
Sports and Recreation/Fitness * 0% 2% 0% 0% 0%
Supply Chain/Logistics 1% 1% 0% 0% 1% 0%
Telecommunications 1% 0% 2% 4% 1% 0%
Tobacco * 0% 0% 0% 0% 1%
Transportation/Warehousing 1% 0% 0% 2% 3% 1%
Utilities 1% 1% 2% 4% 0% 0%
Other 16% 23% 14% 11% 13% 13%
*=Less than 1%
How many years have you run the compliance department?
Responses 479 166 66 55 71 121
Average 5.9 5.1 4.8 6.8 7.1 6.7
1 19% 26% 21% 15% 10% 16%
2 11% 8% 20% 11% 7% 12%
3 12% 15% 12% 9% 8% 11%
4 8% 10% 8% 7% 8% 5%
5 9% 9% 8% 9% 10% 9%
6 to 10 27% 21% 24% 29% 39% 28%
11 to 15 9% 7% 6% 9% 11% 11%
16 or more 6% 4% 2% 11% 6% 9%
Type of organization:
Responses 479 166 66 55 71 121
Nonprofit 17% 22% 11% 15% 20% 15%
Privately held 40% 49% 52% 40% 34% 24%
Publicly traded 24% 13% 18% 20% 27% 41%
Governmental 11% 10% 14% 11% 11% 10%
Academic 8% 5% 5% 15% 7% 10%
Other 1% 1% 2% 0% 1% 0%

2019 Cross-Industry Chief Compliance Officer Salary Survey54
Annual Compliance Budget Managed
All Respondents < $100k
$100k–$249k
$250k–$499k
$500k–$999k $1m+
Percentage holding the following certifications:
Responses 479 166 66 55 71 121
Leading Professional in Ethics & Compliance (LPEC) 3% 2% 3% 5% 4% 1%
Certified Public Accountant (CPA) 6% 1% 6% 4% 6% 12%
Certified Compliance and Ethics Professional (CCEP) 28% 22% 26% 15% 34% 39%
Certified Compliance and Ethics Professional–International (CCEP–I) 7% 4% 8% 5% 11% 10%
Certified in Healthcare Compliance (CHC) 19% 16% 17% 24% 20% 20%
Certified in Healthcare Research Compliance (CHRC) 2% 1% 2% 5% 1% 2%
Certified in Healthcare Privacy Compliance (CHPC) 5% 4% 9% 4% 4% 4%
Advanced Practitioner in Ethics and Compliance Certification (APEX) 0% 1% 0% 0% 0% 0%
Certified Fraud Examiner (CFE) 4% 1% 5% 11% 4% 4%
Certified Internal Auditor (CIA) 5% 3% 6% 5% 3% 7%
Certified Information Privacy Professional (CIPP) 4% 1% 8% 7% 3% 5%
Professionals in Human Resources (PHR) 0% 0% 2% 0% 0% 1%
Senior Professionals in Human Resources (SPHR) 1% 1% 2% 0% 0% 2%
Health Ethics Trust Certified Compliance Professional (CCP) 0% 0% 0% 0% 0% 1%
Health Ethics Trust Certified Compliance Executive (CCE) 0% 0% 0% 0% 0% 1%
Accredited Healthcare Fraud Investigator (AHFI) 0% 0% 0% 0% 0% 0%
Other 37% 39% 36% 36% 39% 35%
None 15% 23% 14% 15% 10% 7%
Highest level of education attained:
Responses 479 166 66 55 71 121
Some college 5% 5% 6% 9% 3% 2%
Bachelor’s degree 25% 30% 30% 16% 18% 22%
MBA 16% 18% 17% 24% 11% 13%
Master’s degree (non-MBA) 20% 21% 17% 18% 18% 22%
JD 30% 20% 29% 31% 46% 36%
PhD 4% 5% 2% 2% 3% 4%
Amount of bonus eligible:
Responses 479 166 66 55 71 121
None 34% 46% 39% 42% 28% 17%
0%–10% of your salary 18% 24% 21% 16% 13% 11%
11%–20% of your salary 16% 12% 20% 25% 20% 15%
21%–30% of your salary 14% 7% 11% 9% 27% 20%
31%–40% of your salary 8% 7% 3% 4% 10% 12%
41% or more of your salary 10% 4% 6% 4% 3% 26%

2019 Cross-Industry Chief Compliance Officer Salary Survey55
Annual Compliance Budget Managed
All Respondents < $100k
$100k–$249k
$250k–$499k
$500k–$999k $1m+
If you receive a bonus, what is it based on?
Responses 352 100 50 39 60 103
Company performance 20% 20% 16% 18% 22% 20%
Personal performance 12% 18% 16% 10% 7% 9%
Both 68% 62% 68% 72% 72% 71%
Do you have a contract?
Responses 479 166 66 55 71 121
Yes 26% 25% 24% 35% 23% 26%
No 74% 75% 76% 65% 77% 74%
If yes, do you have a severance clause in your contract?
Responses 125 42 16 19 16 32
Yes 60% 48% 38% 79% 63% 75%
No 40% 52% 63% 21% 38% 25%
If yes, what percent of your annual salary is it equivalent to?
Responses 75 20 6 15 10 24
<20% 12% 25% 0% 13% 0% 8%
20%–29% 11% 0% 33% 20% 10% 8%
30%–49% 1% 0% 0% 0% 10% 0%
50%+ 31% 15% 17% 20% 50% 46%
My severance does not translate into this measure 45% 60% 50% 47% 30% 38%
Number of compliance elements involved in:
Responses 479 166 66 55 71 121
1–3 1% 1% 0% 0% 0% 4%
4–6 13% 15% 20% 20% 3% 7%
7–9 44% 54% 41% 35% 37% 40%
All 10 42% 30% 39% 45% 61% 48%

2019 Cross-Industry Chief Compliance Officer Salary Survey56
Annual Compliance Budget Managed
All Respondents < $100k
$100k–$249k
$250k–$499k
$500k–$999k $1m+
Geographic region:
Responses 479 166 66 55 71 121
New England 4% 6% 3% 7% 1% 2%
Mid-Atlantic 11% 13% 6% 11% 10% 13%
East North Central 12% 10% 11% 4% 18% 16%
West North Central 9% 8% 9% 5% 10% 11%
South Atlantic 14% 16% 17% 13% 14% 12%
East South Central 2% 3% 0% 2% 1% 3%
West South Central 9% 8% 14% 9% 13% 4%
Mountain 8% 8% 8% 13% 6% 7%
Pacific 12% 5% 12% 18% 15% 17%
US region not given 3% 4% 5% 2% 3% 2%
Non-US 15% 19% 17% 16% 8% 13%

2019 Cross-Industry Chief Compliance Officer Salary Survey57
Number of Employees in Organization As A Whole
All
Respondents Less than
250 250–999 1,000–
2,999 3,000–7,499
7,500–14,999
15,000–29,999
30,000 or more
Are you the compliance officer for:
Responses 479 107 120 72 68 41 19 52
Your organization as a whole 70% 84% 81% 75% 66% 54% 47% 38%
A division or operating unit of the organization
30% 16% 19% 25% 34% 46% 53% 62%
Percentage indicating involvement in the following compliance elements:
Responses 479 107 120 72 68 41 19 52
Compliance Auditing/Monitoring 94% 97% 93% 93% 97% 93% 95% 88%
Compliance Education 94% 95% 93% 89% 97% 98% 100% 94%
Compliance Investigations 89% 86% 92% 86% 90% 90% 95% 88%
Hot Line/Anonymous Reporting 75% 58% 79% 76% 88% 93% 79% 65%
Reporting to the Board 76% 78% 74% 81% 75% 73% 79% 71%
Compliance Risk Assessments 91% 91% 88% 93% 96% 90% 89% 96%
Compliance Discipline/Incentives 68% 65% 64% 74% 72% 63% 68% 75%
Code of Conduct 85% 81% 80% 88% 87% 93% 89% 88%
Policies and Procedures 98% 98% 98% 100% 100% 98% 100% 94%
Measuring Program Effectiveness 83% 79% 78% 82% 97% 83% 89% 85%
How much of your company’s legal and regulatory risk areas are you responsible for managing?
Responses 479 107 120 72 68 41 19 52
26%–50% 26% 22% 15% 26% 24% 34% 53% 42%
51%–75% 31% 32% 29% 36% 31% 34% 16% 29%
76%–100% 43% 46% 56% 38% 46% 32% 32% 29%
How many employees, including you, are in the compliance and ethics group you manage?
Responses 479 107 120 72 68 41 19 52
1 24% 38% 23% 19% 16% 20% 11% 17%
2 to 5 44% 50% 53% 43% 38% 49% 42% 17%
6 to 10 14% 2% 14% 13% 22% 20% 26% 19%
11 to 15 5% 1% 3% 6% 6% 7% 5% 15%
16 to 20 2% 0% 3% 3% 4% 0% 5% 2%
More than 20 11% 8% 3% 17% 13% 5% 11% 29%

2019 Cross-Industry Chief Compliance Officer Salary Survey58
Number of Employees in Organization As A Whole
All
Respondents Less than
250 250–999 1,000–
2,999 3,000–7,499
7,500–14,999
15,000–29,999
30,000 or more
Annual compliance budget managed:
Responses 479 107 120 72 68 41 19 52
75th Percentile $1,000,000 $250,000 $500,000 $875,000 $2,000,000 $1,500,000 $1,500,000 $3,000,000
Median $250,000 $70,000 $150,000 $350,000 $550,000 $500,000 $1,183,105 $1,000,000
25th Percentile $25,000 $10,000 $0 $57,500 $90,750 $200,000 $350,000 $81,375
Average $29,417,832 $2,253,144 $916,261 $2,402,771 $1,366,647 $2,094,819 $1,416,479 $256,401,348
<$100k 35% 52% 43% 26% 25% 15% 11% 27%
$100k–$249k 14% 22% 15% 14% 4% 20% 11% 2%
$250k–$499k 11% 14% 13% 13% 9% 10% 5% 8%
$500k–$999k 15% 6% 14% 24% 24% 22% 16% 6%
$1m–$1.9m 9% 0% 5% 11% 10% 17% 37% 17%
$2m+ 16% 6% 9% 13% 28% 17% 21% 40%
Approximately how many employees work in your organization as a whole?
Responses 479 107 120 72 68 41 19 52
Less than 100 13% 57% 0% 0% 0% 0% 0% 0%
100–249 10% 43% 0% 0% 0% 0% 0% 0%
250–499 11% 0% 45% 0% 0% 0% 0% 0%
500–999 14% 0% 55% 0% 0% 0% 0% 0%
1,000–1,999 10% 0% 0% 64% 0% 0% 0% 0%
2,000–2,999 5% 0% 0% 36% 0% 0% 0% 0%
3,000–4,999 8% 0% 0% 0% 59% 0% 0% 0%
5,000–7,499 6% 0% 0% 0% 41% 0% 0% 0%
7,500–9,999 3% 0% 0% 0% 0% 32% 0% 0%
10,000–14,999 6% 0% 0% 0% 0% 68% 0% 0%
15,000–19,999 2% 0% 0% 0% 0% 0% 47% 0%
20,000–29,999 2% 0% 0% 0% 0% 0% 53% 0%
30,000–49,999 2% 0% 0% 0% 0% 0% 0% 17%
50,000–74,999 3% 0% 0% 0% 0% 0% 0% 29%
75,000–99,999 3% 0% 0% 0% 0% 0% 0% 23%
100,000 + 3% 0% 0% 0% 0% 0% 0% 31%

2019 Cross-Industry Chief Compliance Officer Salary Survey59
Number of Employees in Organization As A Whole
All
Respondents Less than
250 250–999 1,000–
2,999 3,000–7,499
7,500–14,999
15,000–29,999
30,000 or more
Approximately how many employees work in the portion of the organization that you run compliance for?
Responses 479 107 120 72 68 41 19 52
Less than 100 19% 59% 8% 8% 6% 2% 5% 10%
100–249 12% 40% 3% 3% 3% 0% 0% 10%
250–499 13% 0% 43% 1% 9% 0% 5% 8%
500–999 15% 0% 47% 6% 7% 7% 0% 4%
1,000–1,999 9% 0% 0% 56% 1% 5% 5% 0%
2,000–2,999 4% 0% 0% 26% 1% 0% 0% 2%
3,000–4,999 8% 0% 0% 0% 43% 10% 11% 4%
5,000–7,499 5% 0% 0% 0% 26% 5% 11% 0%
7,500–9,999 3% 0% 0% 0% 1% 27% 5% 4%
10,000–14,999 5% 1% 0% 0% 0% 44% 0% 8%
15,000–19,999 1% 0% 0% 0% 0% 0% 32% 2%
20,000–29,999 2% 0% 0% 0% 0% 0% 26% 6%
30,000–49,999 1% 0% 0% 0% 0% 0% 0% 12%
50,000–74,999 1% 0% 0% 0% 0% 0% 0% 13%
75,000–99,999 1% 0% 0% 0% 0% 0% 0% 6%
100,000 + 2% 0% 0% 0% 1% 0% 0% 13%
What are the annual revenues of the organization you work for?
Responses 479 107 120 72 68 41 19 52
Less than $5 million 9% 22% 9% 4% 6% 2% 5% 0%
$5 million to less than $15 million 13% 32% 14% 10% 9% 0% 0% 0%
$15 million to less than $30 million 5% 8% 9% 6% 0% 2% 0% 2%
$30 million to less than $50 million 9% 13% 18% 4% 1% 2% 0% 2%
$50 million to less than $100 million 7% 7% 15% 4% 4% 5% 0% 2%
$100 million to less than $500 million 15% 12% 18% 32% 16% 7% 0% 0%
$500 million to less than $1 billion 9% 3% 7% 15% 18% 10% 5% 4%
$1 billion to less than $3 billion 14% 1% 6% 17% 32% 32% 26% 15%
$3 billion or more 18% 1% 3% 8% 13% 39% 63% 75%
What are the annual revenues for the portion of the organization that your part of the compliance and ethics program oversees?
Responses 479 107 120 72 68 41 19 52
Less than $5 million 14% 28% 11% 13% 13% 2% 11% 6%
$5 million to less than $15 million 14% 28% 15% 11% 10% 5% 0% 0%
$15 million to less than $30 million 6% 8% 10% 4% 1% 2% 0% 2%
$30 million to less than $50 million 9% 12% 18% 8% 1% 2% 0% 2%
$50 million to less than $100 million 8% 7% 17% 4% 7% 5% 0% 0%
$100 million to less than $500 million 15% 11% 18% 31% 13% 10% 5% 10%
$500 million to less than $1 billion 9% 3% 5% 8% 15% 15% 11% 15%
$1 billion to less than $3 billion 11% 1% 4% 14% 26% 27% 16% 13%
$3 billion or more 14% 1% 3% 7% 12% 32% 58% 52%

2019 Cross-Industry Chief Compliance Officer Salary Survey60
Number of Employees in Organization As A Whole
All
Respondents Less than
250 250–999 1,000–
2,999 3,000–7,499
7,500–14,999
15,000–29,999
30,000 or more
For how many countries do you manage compliance?
Responses 479 107 120 72 68 41 19 52
1 64% 79% 79% 69% 49% 51% 37% 33%
2 to 5 15% 16% 17% 17% 12% 15% 16% 15%
6 to 10 6% 1% 2% 11% 10% 7% 5% 15%
11 or more 14% 4% 3% 3% 29% 27% 42% 37%
Where do you work?
Responses 479 107 120 72 68 41 19 52
United States 85% 86% 87% 81% 93% 80% 95% 71%
North America, other than the US 2% 3% 1% 3% 0% 0% 0% 4%
South America 2% 3% 0% 1% 1% 0% 0% 6%
Europe 6% 4% 8% 4% 3% 7% 5% 10%
Asia 4% 1% 2% 8% 3% 7% 0% 8%
Africa 3% 3% 3% 3% 0% 5% 0% 2%
Australia 0% 1% 0% 0% 0% 0% 0% 0%
Current age:
Responses 479 107 120 72 68 41 19 52
75th Percentile 56 55 55 59 57 57 55 56
Median 48 46 46 54 53 50 50 49
25th Percentile 40 37 40 41 41 42 41 42
Average 48.0 45.6 47.0 50.6 49.6 50.2 49.5 47.6
Gender
Responses 479 107 120 72 68 41 19 52
Male 40% 35% 31% 47% 43% 46% 42% 56%
Female 60% 65% 69% 53% 57% 54% 58% 44%
Years in compliance profession:
Responses 479 107 120 72 68 41 19 52
75th Percentile 15 15 15 14 20 17 15 15
Median 11 10 10 10 13 12 12 11
25th Percentile 6 6 5 6 8 8 6 8
Average 12.0 11.7 11.0 11.4 13.6 13.3 12.8 12.8
Years with current employer:
Responses 479 107 120 72 68 41 19 52
75th Percentile 10 9 8 12 10 11 16 13
Median 5 4 5 5 4 6 7 5
25th Percentile 2 2 2 2 2 2 4 2
Average 7.6 7.1 6.9 8.5 6.7 8.5 9.8 8.2

2019 Cross-Industry Chief Compliance Officer Salary Survey61
Number of Employees in Organization As A Whole
All
Respondents Less than
250 250–999 1,000–
2,999 3,000–7,499
7,500–14,999
15,000–29,999
30,000 or more
Years holding current job title:
Responses 479 107 120 72 68 41 19 52
75th Percentile 6 5 5 6 6 7 6 6
Median 3 3 3 2 4 4 3 3
25th Percentile 1 2 1 1 1 1 1 1
Average 4.4 4.8 4.3 4.4 4.3 4.3 3.6 4.3
Industry:
Responses 479 107 120 72 68 41 19 52
Accounting/Auditing 1% 2% 2% 1% 0% 0% 5% 2%
Administrative and Support Services * 0% 0% 0% 0% 2% 5% 0%
Advertising/Marketing * 0% 0% 0% 0% 0% 0% 2%
Public Relations * 0% 0% 0% 1% 0% 0% 0%
Aerospace/Aviation/Defense 1% 0% 3% 1% 0% 5% 0% 0%
Architectural Services * 0% 0% 1% 0% 0% 0% 0%
Automotive/Motor Vehicles/Parts * 0% 1% 0% 0% 0% 0% 2%
Banking 2% 4% 3% 3% 0% 0% 0% 0%
Biotechnical and Pharmaceutical 1% 0% 3% 3% 0% 2% 0% 2%
Chemical/Polymers/Fibers 2% 2% 0% 3% 1% 5% 0% 2%
Computer Hardware * 0% 0% 0% 3% 0% 0% 0%
Computer Services * 0% 1% 1% 0% 0% 0% 0%
Computer Software 2% 4% 2% 0% 1% 0% 0% 2%
Construction 1% 0% 2% 0% 1% 0% 0% 0%
Consulting Services 3% 5% 1% 1% 7% 0% 0% 0%
Consumer Products * 0% 0% 0% 0% 0% 5% 0%
Education/Training/Library 2% 1% 3% 0% 4% 2% 5% 0%
Electronics * 0% 1% 0% 0% 0% 0% 0%
Energy 4% 3% 1% 7% 7% 5% 5% 0%
Engineering * 0% 0% 0% 0% 0% 5% 2%
Financial Services 6% 13% 6% 3% 4% 5% 0% 2%
Government/Policy 7% 7% 8% 8% 10% 5% 0% 4%
Higher Education 9% 1% 6% 18% 12% 20% 11% 6%
Hospitality/Tourism * 1% 1% 0% 0% 0% 0% 0%
Human Resources/Recruiting * 0% 0% 0% 0% 0% 0% 2%
Information Technology 4% 7% 4% 1% 0% 5% 11% 4%
Insurance 15% 14% 18% 17% 12% 5% 5% 19%
Internet/ECommerce * 0% 0% 0% 1% 0% 0% 0%
Law Enforcement/Security Services * 0% 0% 0% 1% 0% 0% 0%
Legal 2% 1% 3% 3% 1% 0% 0% 2%
Manufacturing and Production 6% 1% 1% 4% 13% 15% 11% 12%
Military * 0% 0% 0% 1% 0% 0% 0%
Mining * 0% 2% 0% 0% 0% 0% 0%
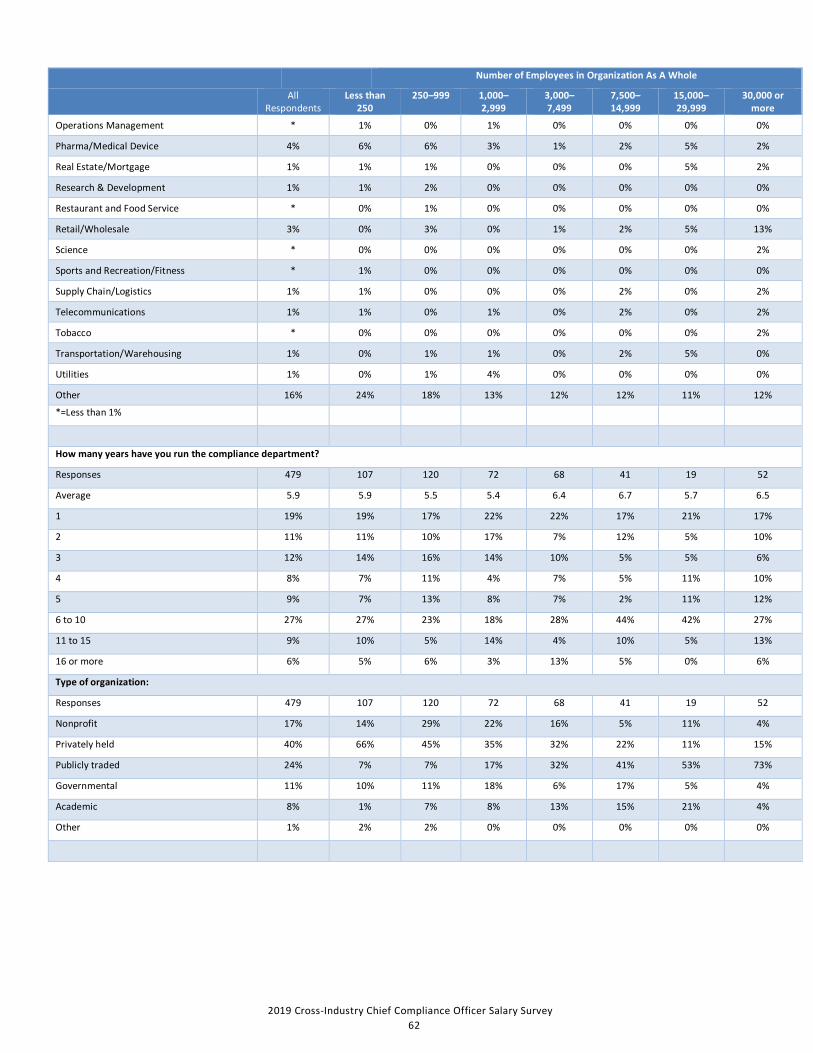
2019 Cross-Industry Chief Compliance Officer Salary Survey62
Number of Employees in Organization As A Whole
All
Respondents Less than
250 250–999 1,000–
2,999 3,000–7,499
7,500–14,999
15,000–29,999
30,000 or more
Operations Management * 1% 0% 1% 0% 0% 0% 0%
Pharma/Medical Device 4% 6% 6% 3% 1% 2% 5% 2%
Real Estate/Mortgage 1% 1% 1% 0% 0% 0% 5% 2%
Research & Development 1% 1% 2% 0% 0% 0% 0% 0%
Restaurant and Food Service * 0% 1% 0% 0% 0% 0% 0%
Retail/Wholesale 3% 0% 3% 0% 1% 2% 5% 13%
Science * 0% 0% 0% 0% 0% 0% 2%
Sports and Recreation/Fitness * 1% 0% 0% 0% 0% 0% 0%
Supply Chain/Logistics 1% 1% 0% 0% 0% 2% 0% 2%
Telecommunications 1% 1% 0% 1% 0% 2% 0% 2%
Tobacco * 0% 0% 0% 0% 0% 0% 2%
Transportation/Warehousing 1% 0% 1% 1% 0% 2% 5% 0%
Utilities 1% 0% 1% 4% 0% 0% 0% 0%
Other 16% 24% 18% 13% 12% 12% 11% 12%
*=Less than 1%
How many years have you run the compliance department?
Responses 479 107 120 72 68 41 19 52
Average 5.9 5.9 5.5 5.4 6.4 6.7 5.7 6.5
1 19% 19% 17% 22% 22% 17% 21% 17%
2 11% 11% 10% 17% 7% 12% 5% 10%
3 12% 14% 16% 14% 10% 5% 5% 6%
4 8% 7% 11% 4% 7% 5% 11% 10%
5 9% 7% 13% 8% 7% 2% 11% 12%
6 to 10 27% 27% 23% 18% 28% 44% 42% 27%
11 to 15 9% 10% 5% 14% 4% 10% 5% 13%
16 or more 6% 5% 6% 3% 13% 5% 0% 6%
Type of organization:
Responses 479 107 120 72 68 41 19 52
Nonprofit 17% 14% 29% 22% 16% 5% 11% 4%
Privately held 40% 66% 45% 35% 32% 22% 11% 15%
Publicly traded 24% 7% 7% 17% 32% 41% 53% 73%
Governmental 11% 10% 11% 18% 6% 17% 5% 4%
Academic 8% 1% 7% 8% 13% 15% 21% 4%
Other 1% 2% 2% 0% 0% 0% 0% 0%

2019 Cross-Industry Chief Compliance Officer Salary Survey63
Number of Employees in Organization As A Whole
All
Respondents Less than
250 250–999 1,000–
2,999 3,000–7,499
7,500–14,999
15,000–29,999
30,000 or more
Percentage holding the following certifications:
Responses 479 107 120 72 68 41 19 52
Leading Professional in Ethics & Compliance (LPEC)
3% 2% 1% 6% 1% 5% 0% 4%
Certified Public Accountant (CPA) 6% 5% 3% 4% 7% 12% 5% 8%
Certified Compliance and Ethics Professional (CCEP)
28% 16% 24% 25% 38% 44% 37% 33%
Certified Compliance and Ethics Professional–International (CCEP–I)
7% 3% 4% 8% 6% 7% 5% 23%
Certified in Healthcare Compliance (CHC) 19% 23% 26% 18% 9% 7% 11% 17%
Certified in Healthcare Research Compliance (CHRC)
2% 1% 3% 1% 0% 2% 5% 2%
Certified in Healthcare Privacy Compliance (CHPC)
5% 7% 5% 6% 4% 0% 5% 2%
Advanced Practitioner in Ethics and Compliance Certification (APEX)
0% 1% 0% 0% 0% 0% 0% 2%
Certified Fraud Examiner (CFE) 4% 1% 2% 7% 7% 7% 5% 4%
Certified Internal Auditor (CIA) 5% 3% 4% 7% 4% 10% 5% 2%
Certified Information Privacy Professional (CIPP)
4% 4% 8% 3% 1% 0% 0% 6%
Professionals in Human Resources (PHR) 0% 1% 0% 1% 0% 0% 0% 0%
Senior Professionals in Human Resources (SPHR)
1% 2% 0% 0% 1% 0% 0% 4%
Health Ethics Trust Certified Compliance Professional (CCP)
0% 0% 0% 0% 0% 0% 0% 2%
Health Ethics Trust Certified Compliance Executive (CCE)
0% 0% 0% 0% 0% 0% 0% 2%
Accredited Healthcare Fraud Investigator (AHFI)
0% 0% 0% 0% 0% 0% 0% 0%
Other 37% 38% 38% 42% 37% 37% 47% 27%
None 15% 20% 18% 14% 15% 7% 5% 12%
Highest level of education attained:
Responses 479 107 120 72 68 41 19 52
Some college 5% 7% 8% 4% 0% 0% 5% 4%
Bachelor’s degree 25% 36% 23% 19% 22% 27% 11% 21%
MBA 16% 18% 15% 19% 15% 20% 5% 15%
Master’s degree (non-MBA) 20% 18% 23% 19% 21% 15% 21% 21%
JD 30% 20% 26% 33% 38% 37% 58% 33%
PhD 4% 3% 4% 4% 4% 2% 0% 6%
Amount of bonus eligible:
Responses 479 107 120 72 68 41 19 52
None 34% 44% 43% 36% 24% 44% 21% 4%
0%–10% of your salary 18% 25% 23% 13% 18% 2% 5% 15%
11%–20% of your salary 16% 17% 10% 21% 15% 17% 21% 25%
21%–30% of your salary 14% 8% 13% 14% 19% 20% 21% 13%
31%–40% of your salary 8% 3% 5% 8% 18% 5% 11% 13%
41% or more of your salary 10% 3% 7% 8% 7% 12% 21% 29%
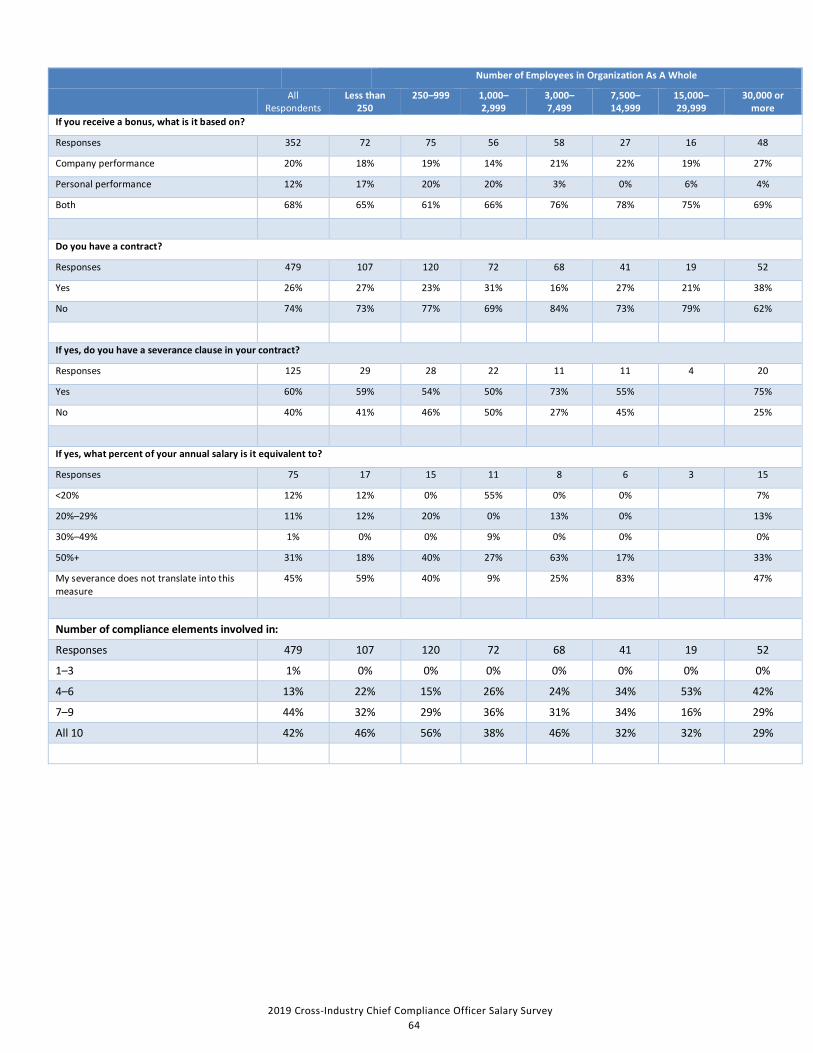
2019 Cross-Industry Chief Compliance Officer Salary Survey64
Number of Employees in Organization As A Whole
All
Respondents Less than
250 250–999 1,000–
2,999 3,000–7,499
7,500–14,999
15,000–29,999
30,000 or more
If you receive a bonus, what is it based on?
Responses 352 72 75 56 58 27 16 48
Company performance 20% 18% 19% 14% 21% 22% 19% 27%
Personal performance 12% 17% 20% 20% 3% 0% 6% 4%
Both 68% 65% 61% 66% 76% 78% 75% 69%
Do you have a contract?
Responses 479 107 120 72 68 41 19 52
Yes 26% 27% 23% 31% 16% 27% 21% 38%
No 74% 73% 77% 69% 84% 73% 79% 62%
If yes, do you have a severance clause in your contract?
Responses 125 29 28 22 11 11 4 20
Yes 60% 59% 54% 50% 73% 55%
75%
No 40% 41% 46% 50% 27% 45%
25%
If yes, what percent of your annual salary is it equivalent to?
Responses 75 17 15 11 8 6 3 15
<20% 12% 12% 0% 55% 0% 0% 7%
20%–29% 11% 12% 20% 0% 13% 0% 13%
30%–49% 1% 0% 0% 9% 0% 0% 0%
50%+ 31% 18% 40% 27% 63% 17% 33%
My severance does not translate into this measure
45% 59% 40% 9% 25% 83% 47%
Number of compliance elements involved in:
Responses 479 107 120 72 68 41 19 52
1–3 1% 0% 0% 0% 0% 0% 0% 0%
4–6 13% 22% 15% 26% 24% 34% 53% 42%
7–9 44% 32% 29% 36% 31% 34% 16% 29%
All 10 42% 46% 56% 38% 46% 32% 32% 29%

2019 Cross-Industry Chief Compliance Officer Salary Survey65
Number of Employees in Organization As A Whole
All
Respondents Less than
250 250–999 1,000–
2,999 3,000–7,499
7,500–14,999
15,000–29,999
30,000 or more
Geographic region:
Responses 479 107 120 72 68 41 19 52
New England 4% 8% 2% 3% 7% 2% 0% 0%
Mid-Atlantic 11% 9% 13% 18% 4% 12% 5% 13%
East North Central 12% 8% 10% 11% 15% 20% 11% 15%
West North Central 9% 11% 11% 8% 4% 10% 11% 6%
South Atlantic 14% 12% 15% 13% 15% 12% 32% 13%
East South Central 2% 2% 3% 1% 4% 2% 5% 0%
West South Central 9% 7% 8% 7% 16% 5% 21% 4%
Mountain 8% 7% 1% 6% 9% 5% 11% 6%
Pacific 12% 17% 11% 10% 16% 10% 0% 12%
US region not given 3% 4% 3% 4% 1% 2% 0% 2%
Non-US 15% 14% 13% 19% 7% 20% 5% 29%

2019 Cross-Industry Staff Salary Survey 66
2019 Cross-Industry Staff Salary Survey

2019 Cross-Industry Staff Salary Survey 67
Introduction

2019 Cross-Industry Staff Salary Survey 68
About This Report
The 2019 Cross-Industry Staff Salary Survey is another important service provided by the Society of Corporate Compliance and Ethics & Health Care Compliance Association (SCCE & HCCA). The information contained in this report offers salary and compensation data for individuals working in the compliance profession. The report is designed to allow organizations and individuals to compare their data with those of their peers. The results throughout this report are presented for both the total sample of survey respondents, and for specific segments within the sample, to allow organizations to more easily compare its own data to the results of individuals with similar characteristics. In addition to the total sample, the individual segments reported throughout include the following:
• Title/level • Number of Employees in Organization as a Whole • Number of Employees in the Portion of the Organization That the Compliance Program Oversees • Annual Revenues of the Organization as a Whole • Annual Revenues of the Portion of the Organization That the Compliance Program Oversees • Number of Employees in the Compliance and Ethics Group • Annual Compliance Budget • Number of Employees in the Compliance Portion of the Organization • Number of Direct Reports to the Individual • Annual Revenues in Compliance Portion of the Organization • Number of Countries in Which Compliance Is Managed • Number of Years In the Compliance Department • Years in Compliance Profession • Certifications Held • Type of Organization • Amount of Company's Legal and Regulatory Risk Areas Compliance Department is Responsbile for Managing • Type of Industry • Number of Compliance Program Elements the Individual Is Involved in • Geographic Region • Gender • Age • Highest Level of Education • Contract Status • Presence of Severance Clause in One’s Contract
Please note that the salary and other data published in this report should be considered guidelines rather than absolute standards. Even organizations that are similar on some characteristics, such as location, size, industry, etc., will differ in other ways, making it difficult to draw exact comparisons. In the end, results in this report that are different from one’s own experience are most likely an indication that other factors are at play. Note that a minimum of five responses was required to show data for any question, from any individual segments. Also note that results based on relatively small responses (e.g., fewer than 25) are subject to higher levels of statistical error and should be interpreted with caution. This study was conducted for SCCE & HCCA by Fondulas Strategic Research LLC, an independent professional survey research firm located in East Sandwich, MA. The company specializes in surveys for trade and professional associations, including surveys measuring trends in salary levels over time and employee attitudes. SCCE & HCCA are proud to present the enclosed insights into the salary levels in the compliance industry. We wish
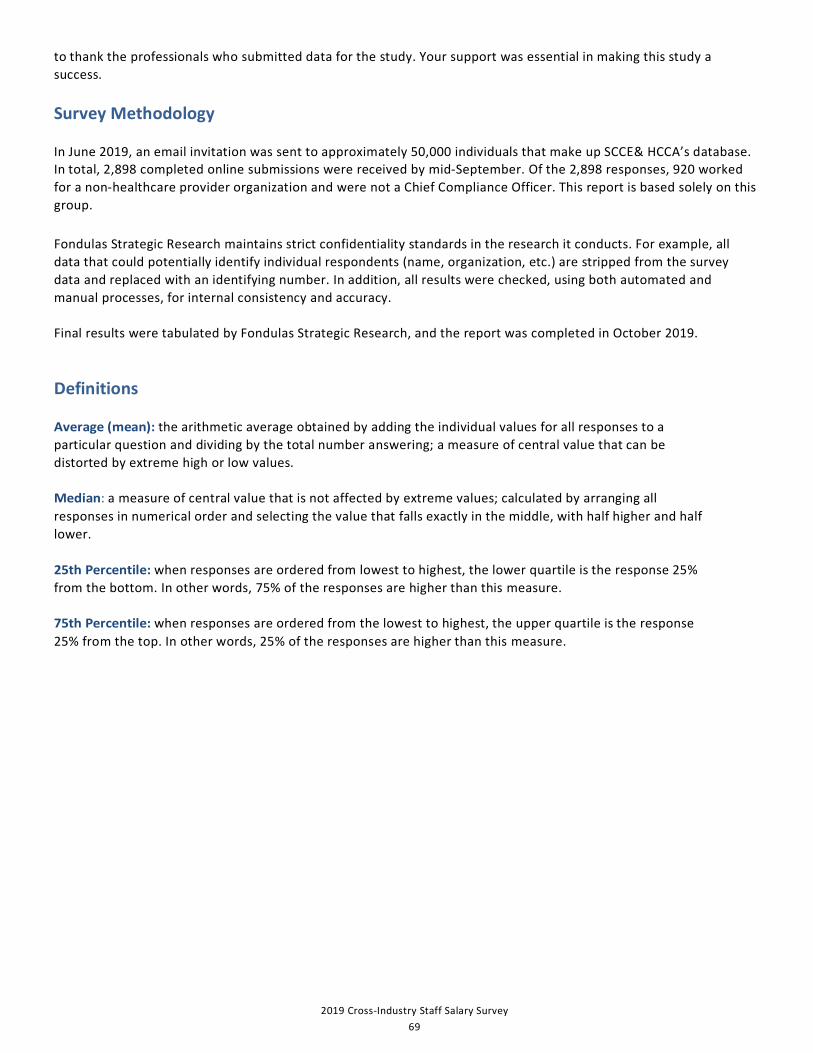
2019 Cross-Industry Staff Salary Survey 69
to thank the professionals who submitted data for the study. Your support was essential in making this study a success.
Survey Methodology
In June 2019, an email invitation was sent to approximately 50,000 individuals that make up SCCE& HCCA’s database. In total, 2,898 completed online submissions were received by mid-September. Of the 2,898 responses, 920 worked for a non-healthcare provider organization and were not a Chief Compliance Officer. This report is based solely on this group. Fondulas Strategic Research maintains strict confidentiality standards in the research it conducts. For example, all data that could potentially identify individual respondents (name, organization, etc.) are stripped from the survey data and replaced with an identifying number. In addition, all results were checked, using both automated and manual processes, for internal consistency and accuracy. Final results were tabulated by Fondulas Strategic Research, and the report was completed in October 2019.
Definitions
Average (mean): the arithmetic average obtained by adding the individual values for all responses to a particular question and dividing by the total number answering; a measure of central value that can be distorted by extreme high or low values. Median: a measure of central value that is not affected by extreme values; calculated by arranging all responses in numerical order and selecting the value that falls exactly in the middle, with half higher and half lower. 25th Percentile: when responses are ordered from lowest to highest, the lower quartile is the response 25% from the bottom. In other words, 75% of the responses are higher than this measure. 75th Percentile: when responses are ordered from the lowest to highest, the upper quartile is the response 25% from the top. In other words, 25% of the responses are higher than this measure.

2019 Cross-Industry Staff Salary Survey 70
Respondent Profile
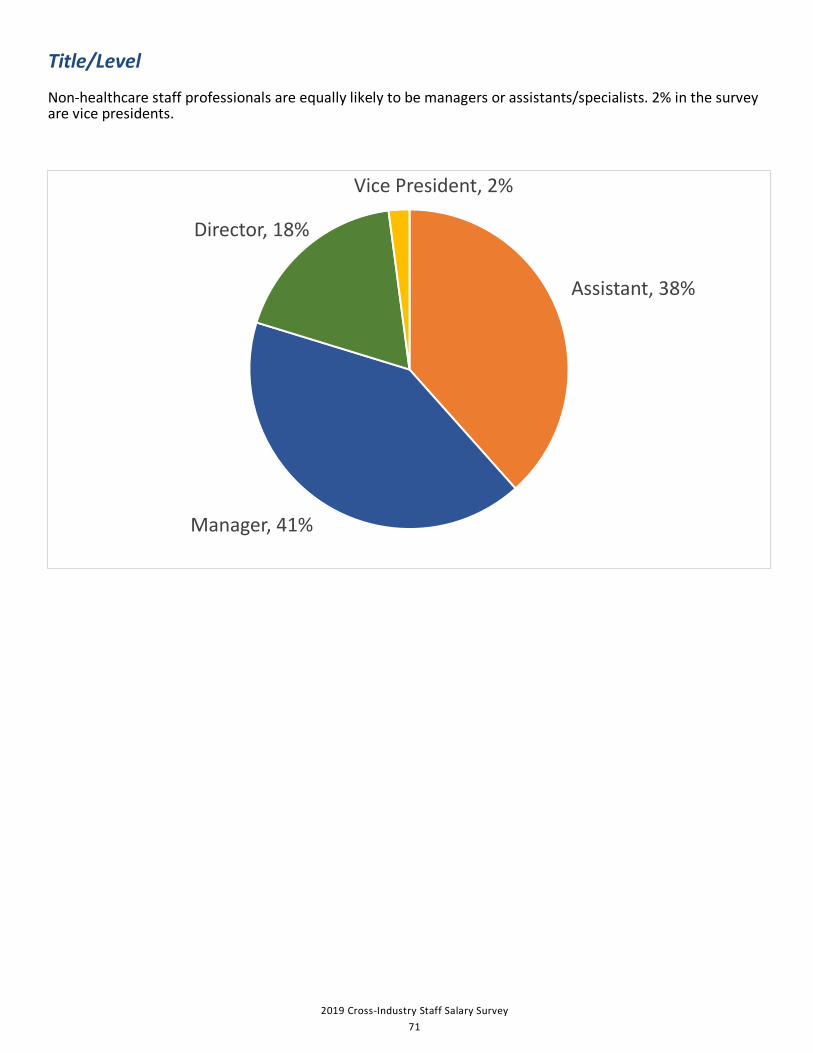
2019 Cross-Industry Staff Salary Survey 71
Title/Level Non-healthcare staff professionals are equally likely to be managers or assistants/specialists. 2% in the survey are vice presidents.
Assistant, 38%
Manager, 41%
Director, 18%
Vice President, 2%

2019 Cross-Industry Staff Salary Survey 72
Number of Employees in Organization as a Whole Non-healthcare staff members work in organizations that vary widely when it comes to total employee size.
Fewer than 250, 11%
250–999, 13%
1,000–2,999, 14%
3,000–7,499, 16%
7,500–14,999, 13%
15,000–29,999, 11%
30,000 or more, 22%

2019 Cross-Industry Staff Salary Survey 73
Number of Employees in the Portion of the Organization That the Compliance Program Oversees One-fourth of staff professionals work in organizations where the compliance program oversees fewer than 100 employees, but nearly one-third work in firms overseeing 7,500 or more employees.
Fewer than 100, 24%
100–249, 7%
250–999, 14%
1,000–1,999, 8% 2,000–2,999, 4%
3,000–4,999, 8%
5,000–7,499, 6%
7,500–14,999, 10%
15,000 or more, 19%

2019 Cross-Industry Staff Salary Survey 74
Annual Revenues of the Organization as a Whole Fully one-third of non-healthcare compliance staff professionals work in firms with $3 billion or more in total revenue.
Less than $5 million, 8%
$5 million–$14.9 million, 8%
$15 million–$29.9 million, 5%
$30 million–$49.9 million, 4%
$50 million–99.9 million, 6%
$100 million–$499.9 million, 10%
$500 million–$999.9 million, 8%$1 billion–$2.9 billion,
16%
$3 billion or more, 35%
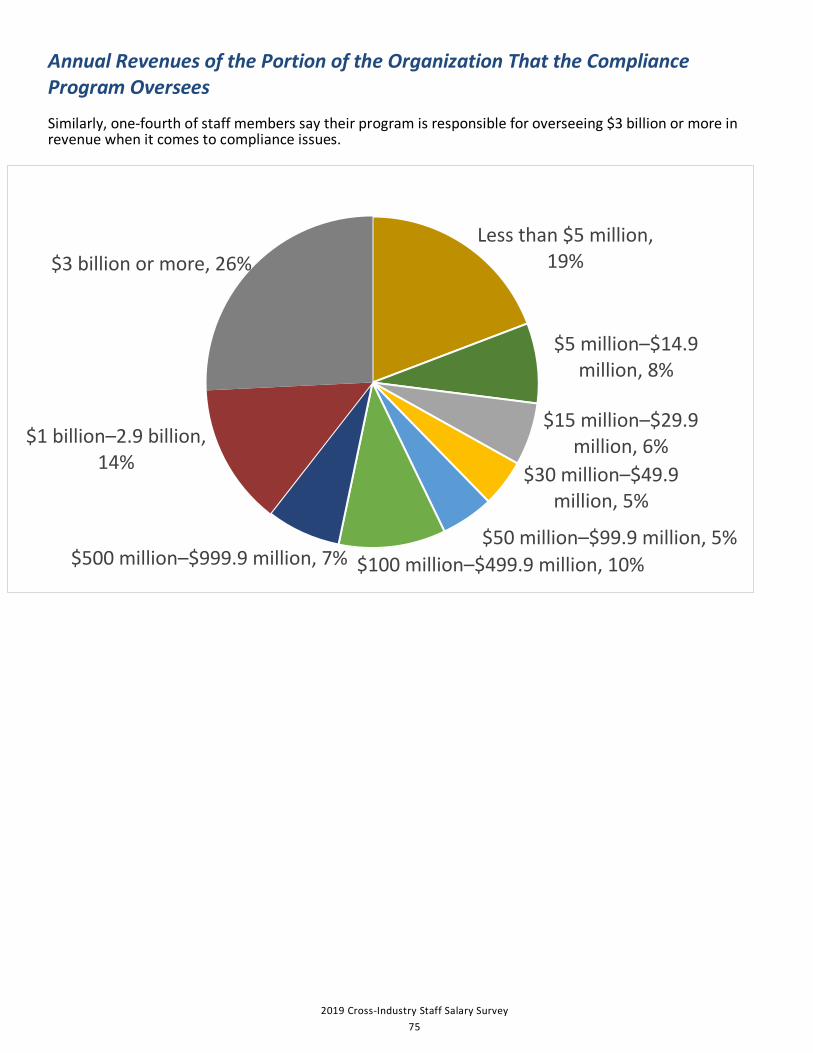
2019 Cross-Industry Staff Salary Survey 75
Annual Revenues of the Portion of the Organization That the Compliance Program Oversees Similarly, one-fourth of staff members say their program is responsible for overseeing $3 billion or more in revenue when it comes to compliance issues.
Less than $5 million, 19%
$5 million–$14.9 million, 8%
$15 million–$29.9 million, 6%
$30 million–$49.9 million, 5%
$50 million–$99.9 million, 5%$100 million–$499.9 million, 10%$500 million–$999.9 million, 7%
$1 billion–2.9 billion, 14%
$3 billion or more, 26%
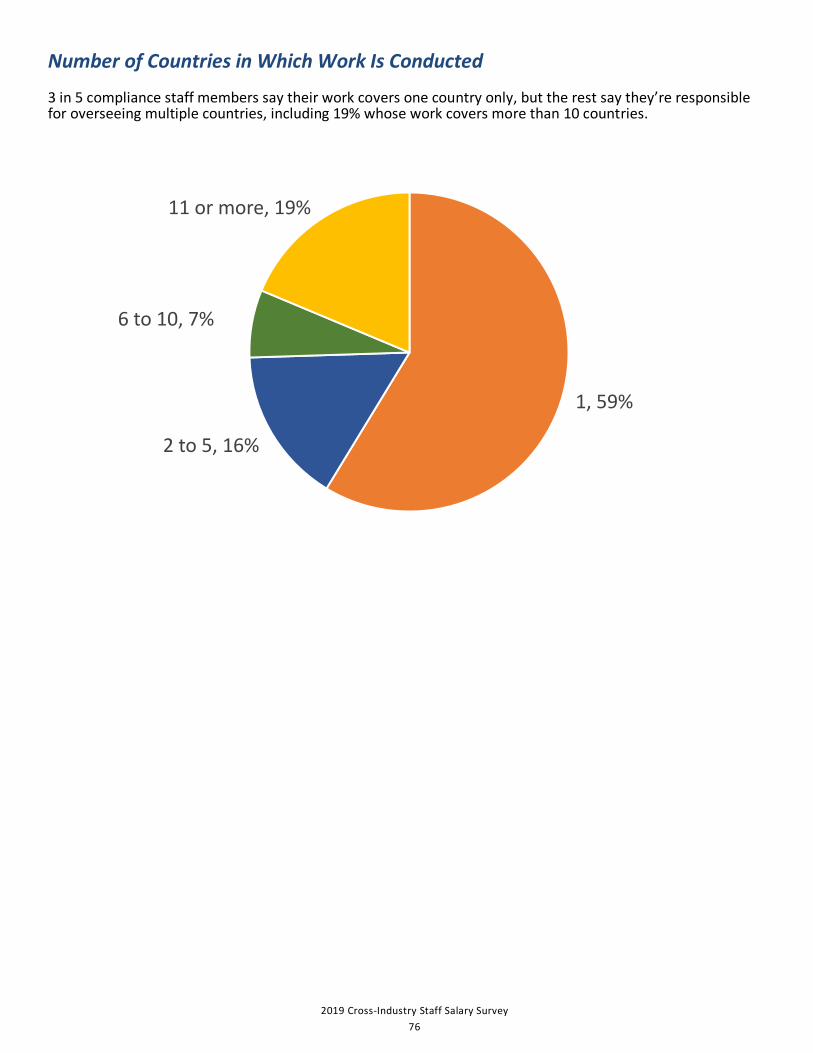
2019 Cross-Industry Staff Salary Survey 76
Number of Countries in Which Work Is Conducted 3 in 5 compliance staff members say their work covers one country only, but the rest say they’re responsible for overseeing multiple countries, including 19% whose work covers more than 10 countries.
1, 59%
2 to 5, 16%
6 to 10, 7%
11 or more, 19%

2019 Cross-Industry Staff Salary Survey 77
Number of Years in the Compliance Department As with CCOs, the majority of staff members are relatively new to the department, with a tenure of five years or less. One-third have been with their current department for more than five years.
1–5, 68% 6–10, 19%
11–15, 10% 16 or more, 4%
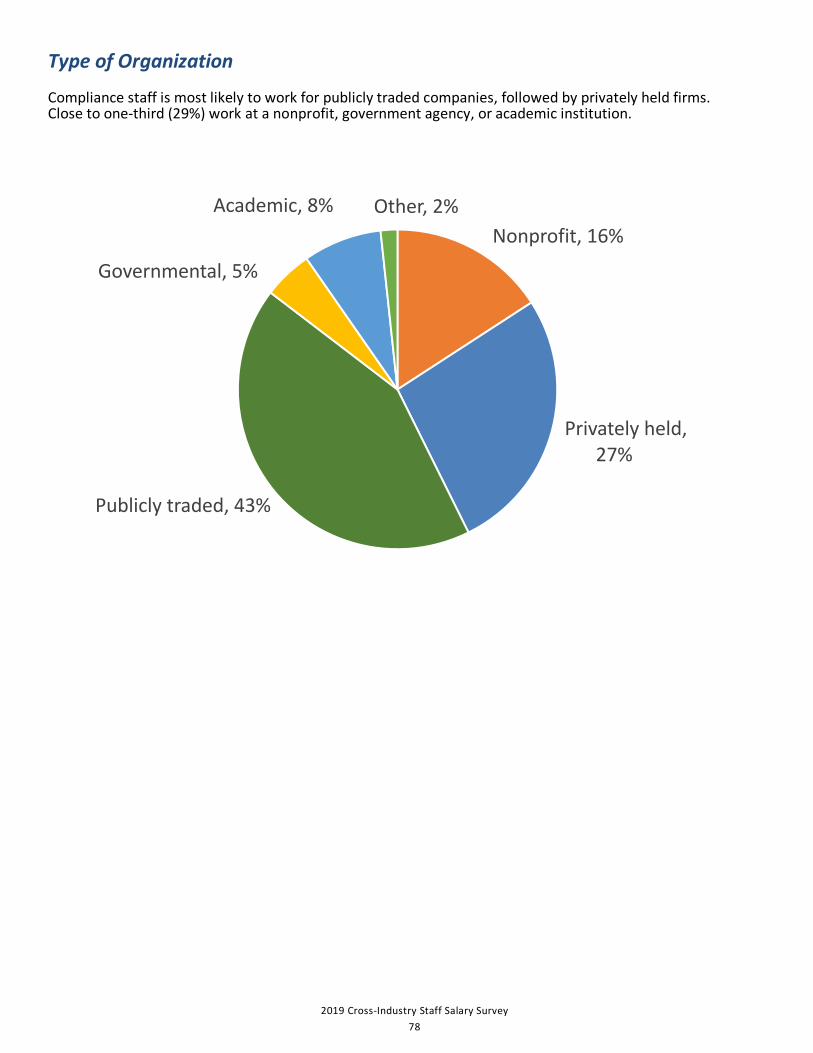
2019 Cross-Industry Staff Salary Survey 78
Type of Organization Compliance staff is most likely to work for publicly traded companies, followed by privately held firms. Close to one-third (29%) work at a nonprofit, government agency, or academic institution.
Nonprofit, 16%
Privately held, 27%
Publicly traded, 43%
Governmental, 5%
Academic, 8%
Other, 2%

2019 Cross-Industry Staff Salary Survey 79
Type of Industry As was also the case with CCOs, insurance is the most common industry for non-healthcare staff professionals, with other industries widely distributed.
15%1%1%1%1%1%1%1%1%1%1%1%1%1%1%1%1%
2%2%2%2%2%
3%3%3%3%
4%4%
6%7%
8%20%
Other
Real Estate/Mortgage
Administrative and Support Services
Electronics
Mining
Chemical/Polymers/Fibers
Construction
Personal Care and Service
Accounting/Auditing
Automotive/Motor Vehicles/Parts
Consulting Services
Engineering
Legal
Computer Software
Transportation/Warehousing
Consumer Products
Utilities
Research & Development
Aerospace/Aviation/Defense
Biotechnical and Pharmaceutical
Education/Training/Library
Banking
Telecommunications
Energy
Government/Policy
Information Technology
Retail/Wholesale
Financial Services
Manufacturing and Production
Higher Education
Pharma/Medical Device
Insurance
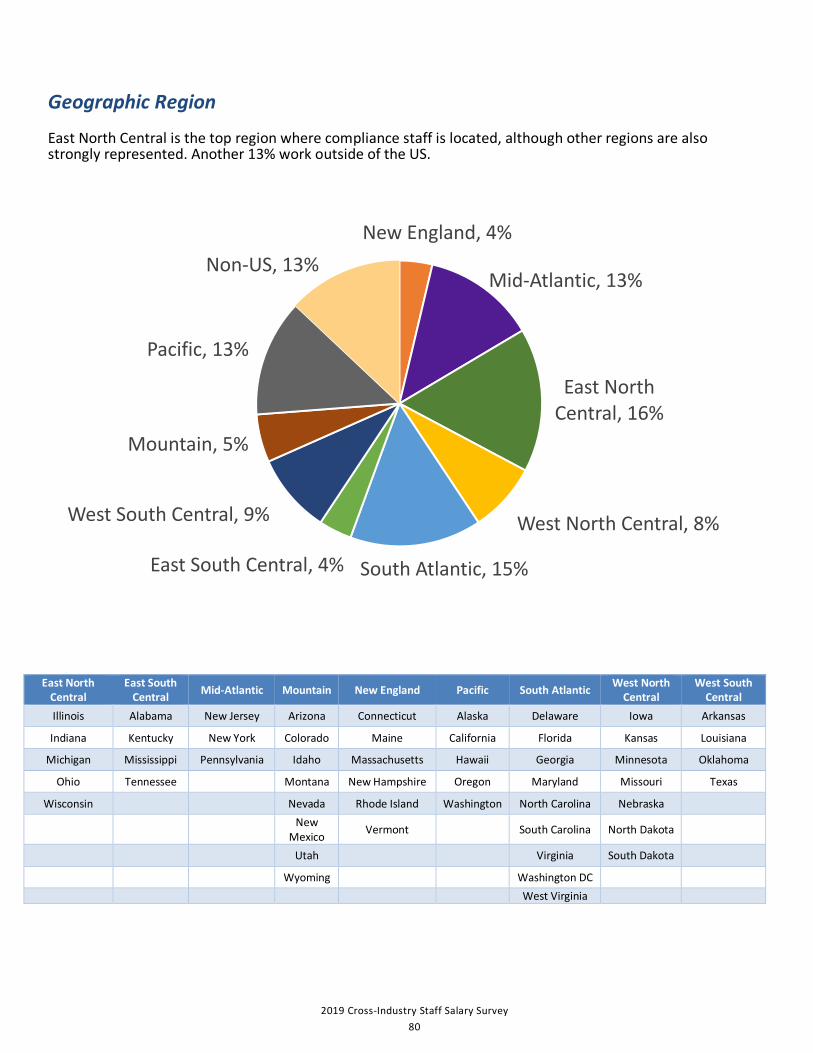
2019 Cross-Industry Staff Salary Survey 80
Geographic Region East North Central is the top region where compliance staff is located, although other regions are also strongly represented. Another 13% work outside of the US.
East North Central
East South Central Mid-Atlantic Mountain New England Pacific South Atlantic West North
Central West South
Central Illinois Alabama New Jersey Arizona Connecticut Alaska Delaware Iowa Arkansas
Indiana Kentucky New York Colorado Maine California Florida Kansas Louisiana
Michigan Mississippi Pennsylvania Idaho Massachusetts Hawaii Georgia Minnesota Oklahoma
Ohio Tennessee Montana New Hampshire Oregon Maryland Missouri Texas
Wisconsin Nevada Rhode Island Washington North Carolina Nebraska
New Mexico Vermont South Carolina North Dakota
Utah Virginia South Dakota
Wyoming Washington DC West Virginia
New England, 4%
Mid-Atlantic, 13%
East North Central, 16%
West North Central, 8%
South Atlantic, 15%East South Central, 4%
West South Central, 9%
Mountain, 5%
Pacific, 13%
Non-US, 13%

2019 Cross-Industry Staff Salary Survey 81
Elements of the Compliance Program That Staff Are Involved in Across titles, education, policies and procedures, and auditing are the top areas of responsibility for staff professionals. Compliance investigations, risk assessments, and measuring program effectiveness are also common responsibilities.
Vice President Director Manager Assistant/
Specialist
Compliance Education 90% 83% 80% 69%
Policies and Procedures 80% 92% 84% 83%
Compliance Auditing/Monitoring 75% 75% 71% 73%
Compliance Investigations 75% 67% 54% 51%
Compliance Risk Assessments 70% 75% 72% 54%
Measuring Program Effectiveness 70% 66% 63% 51%
Compliance Discipline/Incentives 60% 44% 30% 20%
Hot Line/Anonymous Reporting 55% 53% 42% 36%
Code of Conduct 55% 61% 57% 46%
Reporting to the Board 45% 42% 32% 23% *Note: due to small sample size, results for vice presidents are not included in the remaining Respondent Profile charts.

2019 Cross-Industry Staff Salary Survey 82
How Much of Your Company's Legal and Regulatory Risk Areas is the Compliance Department Responsible for Managing?
All three staff titles show relatively equal distributions when it comes to the extent of risk they’re involved in.
Director Manager Assistant/
Specialist 0-25% 21% 23% 20%
26%-50% 24% 26% 29%
51%-75% 29% 31% 29%
76%-100% 25% 20% 21%
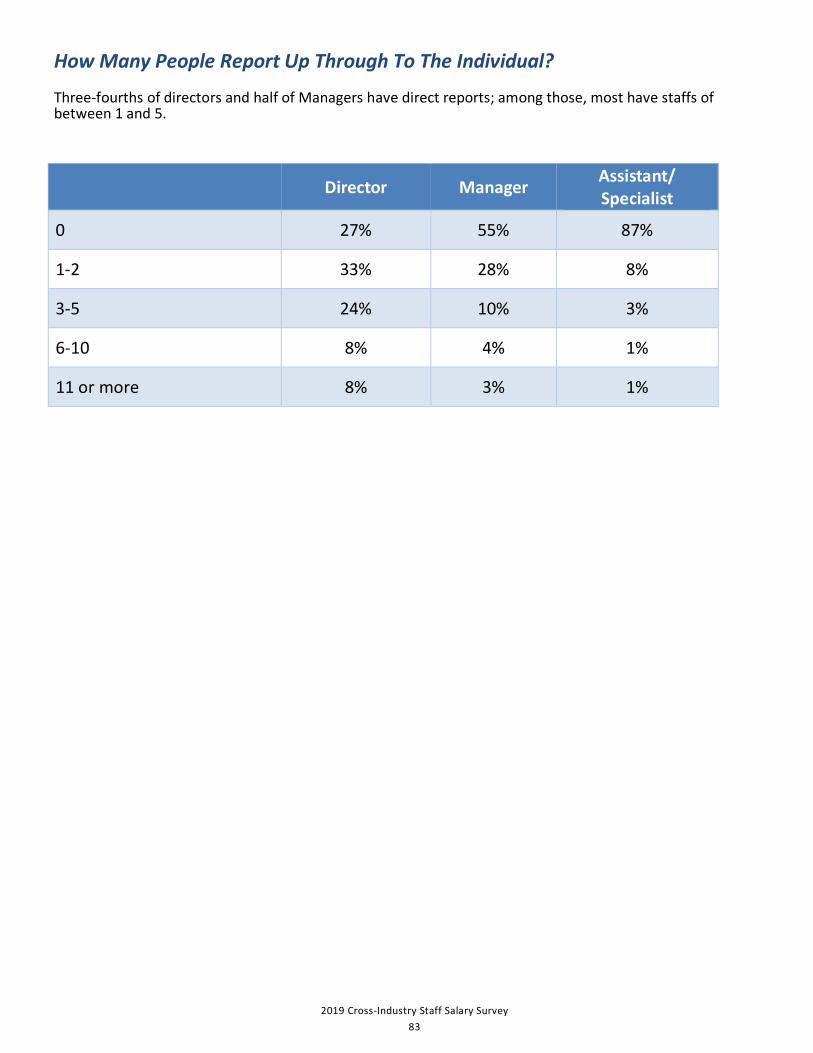
2019 Cross-Industry Staff Salary Survey 83
How Many People Report Up Through To The Individual? Three-fourths of directors and half of Managers have direct reports; among those, most have staffs of between 1 and 5.
Director Manager Assistant/
Specialist 0 27% 55% 87%
1-2 33% 28% 8%
3-5 24% 10% 3%
6-10 8% 4% 1%
11 or more 8% 3% 1%

2019 Cross-Industry Staff Salary Survey 84
Certifications The CCEPC is the most common certification among across staff titles. Note that about one-quarter have another certification not listed in the table below.
Director Manager Assistant/
Specialist Certified Compliance and Ethics Professional (CCEP) 39% 32% 27%
Certified in Healthcare Compliance (CHC) 16% 12% 14%
Certified Compliance and Ethics Professional-International (CCEP-I) 10% 9% 5%
Certified Fraud Examiner (CFE) 7% 5% 3%
Certified in Healthcare Privacy Compliance (CHPC) 6% 3% 2%
Certified Public Accountant (CPA) 4% 3% 2%
Certified Information Privacy Professional (CIPP) 2% 3% 1%
Other 28% 28% 28%
None 18% 22% 27%

2019 Cross-Industry Staff Salary Survey 85
Do You Have A Contract? From 15% to 19% of non-healthcare staff professionals, depending on title, have a contract.
Director Manager Assistant/ Specialist
Yes 19% 15% 19%
No 81% 85% 81%

2019 Cross-Industry Staff Salary Survey 86
Do You Have A Severance Clause in Your Contract? (Among Those with a Contract)
For those who do have a contract, directors are the most likely to say it includes a severance clause. Only about 1 in 3 managers and assistants/specialists report the same.
% Among Those With Contract Director Manager Assistant/
Specialist Yes 59% 28% 35%
No 41% 72% 65%
*Insufficient data

2019 Cross-Industry Staff Salary Survey 87
Highest Level of Education More than two-thirds of directors and 6 in 10 managers have advanced degrees.
Director Manager Assistant/ Specialist
Some college 5% 7% 13%
Bachelor’s degree 28% 35% 45%
MBA 11% 13% 11%
Master’s degree (non-MBA) 20% 28% 19%
JD 31% 17% 10%
PhD 5% 1% 3%

2019 Cross-Industry Staff Salary Survey 88
Gender Among directors, managers, and assistants, 7 in 10 or more of staff members are women.
Director Manager Assistant/ Specialist
Men 29% 30% 22%
Women 69% 70% 78%

2019 Cross-Industry Staff Salary Survey 89
Executive Summary

2019 Cross-Industry Staff Salary Survey 90
Average Total Compensation by Title/Level As one would expect, total compensation for staff members varies by title, with vice presidents* earning the most and assistant/specialists earning the least.
*Note: due to small sample size, results for vice presidents are not included in the remaining Executive Summary charts.
$238,370
$169,145
$105,393$81,709
Vice President Director Manager Assistant/Specialist

2019 Cross-Industry Staff Salary Survey 91
Average Total Compensation by Compliance Budget for Organization For directors and managers, compensation tends to increase significantly once one hits $500 million in revenue under the jurisdiction of the compliance department.
Compliance Budget for Organization Director Manager Assistant/ Specialist
<100,000 $174,857 $65,350 $40,051
$100,000–$249,000 $98,657 $85,609 $71,167
$250,000–$499,000 * $116,430 *
$500,000–$999,999 $207,025 $112,600 *
$1 million–$1.9 million $166,583 * *
$2 million or more $223,582 $152,758 *
*Insufficient data

2019 Cross-Industry Staff Salary Survey 92
Average Total Compensation by Annual Revenues in the Portion of the Organization That the Individual Works in Compliance for For directors and managers, compensation tends to increase significantly once one hits $500 million in revenue under the jurisdiction of the compliance department. Annual Revenue In Compliance Portion of Organization
Director Manager Assistant/ Specialist
Less than $5 million $134,791 $91,739 $82,792
$5–$14.9 million $83,035 $91,666 $80,774
$15–$29.9 million $145,167 $93,742 $102,722
$30–$49.9 million * $89,781 $66,301
$50–$99.9 million $124,833 $85,276 $76,327
$100–$499.9 million $140,531 $99,117 $67,516
$500 million–$999.9 million $143,786 $103,605 $93,302
$1 billion–$2.9 billion $190,722 $116,786 $80,177
$3 billion or more $210,784 $124,638 $83,650
*Insufficient data

2019 Cross-Industry Staff Salary Survey 93
Average Total Compensation by Number of Employees in the Portion of the Organization That the Individual Works in Compliance for For directors and managers, total compensation tends to increase with the number of employees in the compliance department. The relationship is less clear for assistants/specialists.
Employees In Compliance Portion of Organization Director Manager Assistant/
Specialist
Fewer than 100 $132,393 $98,171 $85,503
100–249 $109,531 $90,586 $71,326
250–499 $193,479 $100,584 $60,987
500–999 $128,364 $88,405 $67,395
1,000–1,999 $179,767 $100,738 $85,201
2,000–2,999 $127,417 $81,759 $111,248
3,000–4,999 $164,421 $97,469 $77,708
5,000–7,499 $176,276 $115,429 $73,302
7,500–14,999 $198,925 $122,865 $98,618
15,000 or More $200,342 $128,050 $84,024
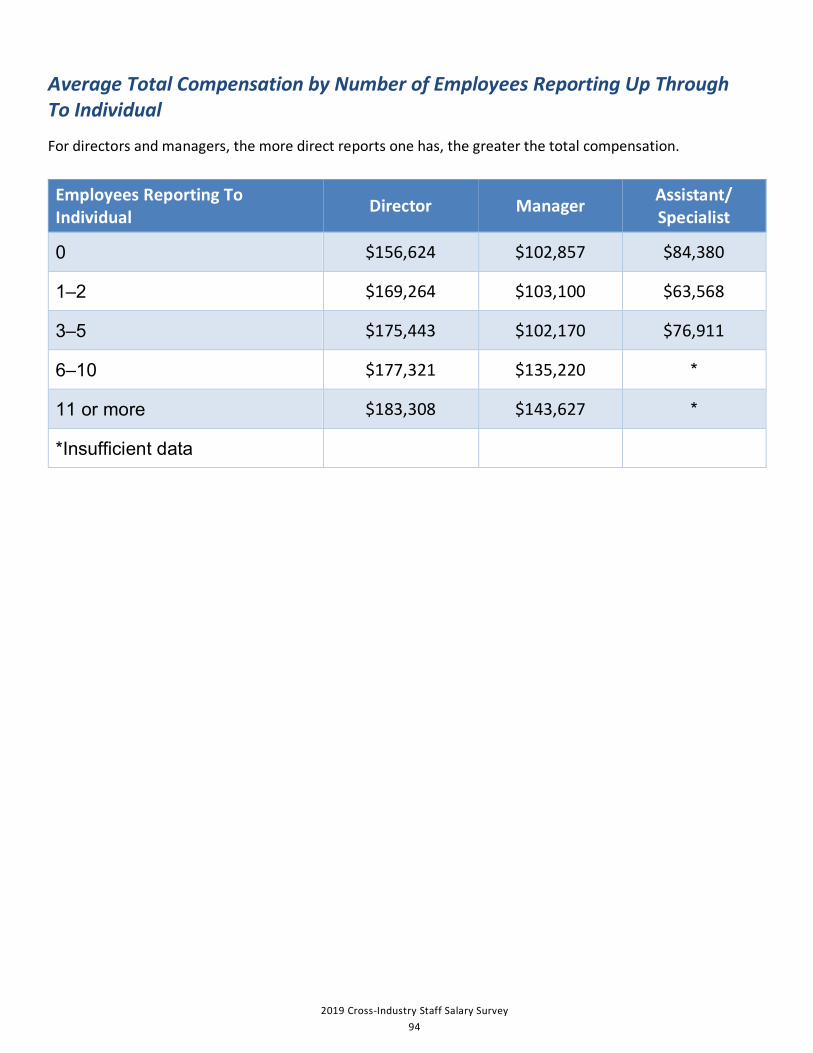
2019 Cross-Industry Staff Salary Survey 94
Average Total Compensation by Number of Employees Reporting Up Through To Individual For directors and managers, the more direct reports one has, the greater the total compensation.
Employees Reporting To Individual Director Manager Assistant/
Specialist
0 $156,624 $102,857 $84,380
1–2 $169,264 $103,100 $63,568
3–5 $175,443 $102,170 $76,911
6–10 $177,321 $135,220 *
11 or more $183,308 $143,627 *
*Insufficient data

2019 Cross-Industry Staff Salary Survey 95
Average Total Compensation by Type of Organization For directors and managers, total compensation is highest, by far, for those who work in publicly traded firms.
Type of Organization Director Manager Assistant/ Specialist
Publicly Traded $203,471 $121,574 $81,554
Privately Held $161,311 $95,632 $74,470
Non-Profit $127,833 $95,313 $102,642
Academic $105,197 $85,427 $67,496
Governmental * $52,168 $71,243
*Insufficient data

2019 Cross-Industry Staff Salary Survey 96
Average Total Compensation by Certifications Held For directors and managers, those with a CCEP certification have higher levels of compensation generally, although directors with CCEP-I are the most highly compensated of all.
Certifications Held Director Manager Assistant/ Specialist
Certified Compliance and Ethics Professional International (CCEP-I) $209,580 $76,923^ $45,313^
Certified Compliance and Ethics Professional (CCEP) $181,556 $115,422 $95,938
Certified Fraud Examiner (CFE) $174,277 $88,233 $102,671
Certified Public Accountant (CPA) $159,667 $81,077 $122,643
Certified in Healthcare Compliance (CHC) $145,790 $101,314 $86,377
Certified in Healthcare Privacy Compliance (CHPC) $139,920 $83,317 $120,539
Certified Information Privacy Professional (CIPP) * $90,293 *
Certified in Healthcare Research Compliance (CHRC) * $80,510 *
Certified Internal Auditor (CIA) * $76,463 $79,857
Other $167,190 $102,736 $84,876
None $160,246 $104,551 $72,150
*Insufficient data ^Three managers and eight assistants entered seemingly unrealistic salary figures of less than $5,000. When those are removed, total compensation would be $84,305 for managers with CCEP-I and $65,076 for assistants/specialists with CCEP-I, which are more in line with results from past waves of the survey.

2019 Cross-Industry Staff Salary Survey 97
Average Total Compensation by Elements of a Compliance Program the Individual Is Involved in For directors, we see a clear correlation between the number of compliance elements one is involved with and total compensation. Number of Compliance Elements Involved In
Director Manager Assistant/ Specialist
1–3 $139,857 $92,220 $86,344
4–6 $164,838 $113,812 $79,425
7–9 $168,684 $102,070 $82,072
All 10 $200,833 $108,107 $76,561

2019 Cross-Industry Staff Salary Survey 98
Average Total Compensation by Contract Status Director compensation does not vary by contract status; for other titles, those without a contract have higher compensation levels.
Contract Status Director Manager Assistant/ Specialist
Have contract $171,733 $87,606 $54,041
No contract $168,541 $108,522 $88,020
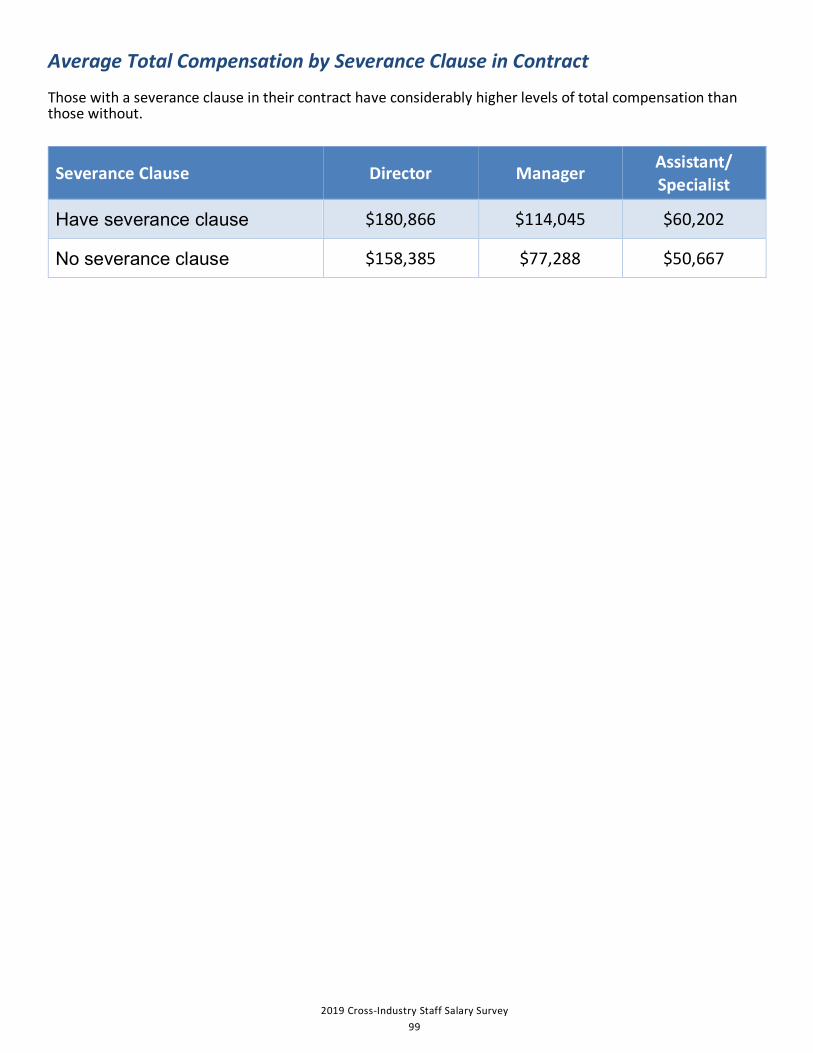
2019 Cross-Industry Staff Salary Survey 99
Average Total Compensation by Severance Clause in Contract Those with a severance clause in their contract have considerably higher levels of total compensation than those without.
Severance Clause Director Manager Assistant/ Specialist
Have severance clause $180,866 $114,045 $60,202
No severance clause $158,385 $77,288 $50,667

2019 Cross-Industry Staff Salary Survey 100
Average Total Compensation by Geographic Region
For directors and managers, total compensation tends to be highest in New England and the Pacific region.
Geographic Region Director Manager Assistant/ Specialist
New England $192,333 $115,099 $80,067
Pacific $186,361 $123,771 $86,377
Middle Atlantic $174,395 $110,959 $97,375
East North Central $168,744 $113,856 $99,171
South Atlantic $157,235 $114,643 $103,418
Mountain $150,375 $104,580 $76,521
West South Central $142,740 $110,398 $74,162
West North Central $141,983 $100,381 $75,516
East South Central * $88,947 $76,714
*Insufficient data
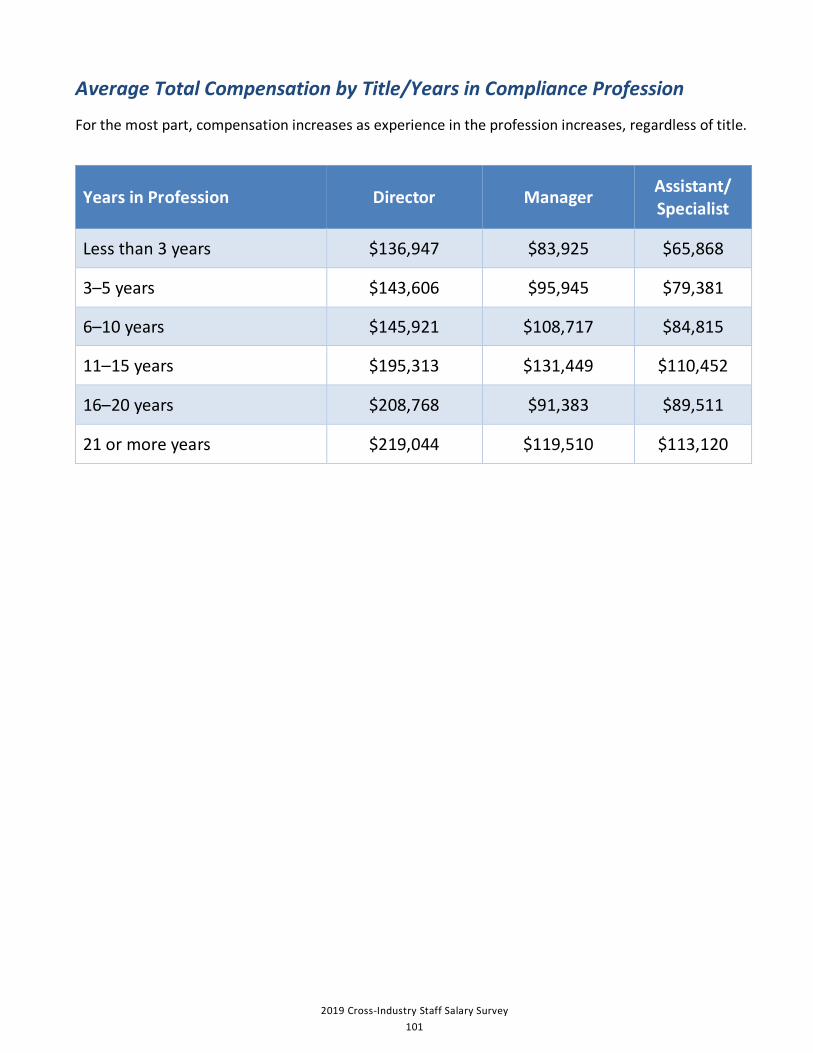
2019 Cross-Industry Staff Salary Survey 101
Average Total Compensation by Title/Years in Compliance Profession For the most part, compensation increases as experience in the profession increases, regardless of title.
Years in Profession Director Manager Assistant/ Specialist
Less than 3 years $136,947 $83,925 $65,868
3–5 years $143,606 $95,945 $79,381
6–10 years $145,921 $108,717 $84,815
11–15 years $195,313 $131,449 $110,452
16–20 years $208,768 $91,383 $89,511
21 or more years $219,044 $119,510 $113,120

2019 Cross-Industry Staff Salary Survey 102
Salary Data

2019 Cross-Industry Staff Salary Survey 103
Vice President Salary Results Non-Healthcare
Base Salary Total Compensation
Responses Average 25th Percentile Median 75th Percentile Average 25th Percentile Median 75th Percentile
All Respondents 20 $180,895 $130,500 $157,500 $236,000 $238,370 $140,250 $170,000 $345,250

2019 Cross-Industry Staff Salary Survey 104
Director Salary Results Non-Healthcare
Base Salary Total Compensation
Responses Average 25th
Percentile Median 75th
Percentile Average 25th
Percentile Median 75th
Percentile
All Respondents 169 $140,091 $110,000 $140,000 $171,000 $169,145 $122,000 $169,500 $203,000
Percentage of company's legal and regulatory risk areas compliance department involved in managing:
0%–25% 36 $137,365 $93,000 $139,500 $181,750 $168,840 $94,100 $152,000 $202,250
26%–50% 41 $128,663 $107,000 $130,000 $150,100 $153,748 $122,000 $164,000 $180,000
51%–75% 49 $156,875 $130,000 $154,642 $182,000 $192,688 $140,000 $186,000 $223,000
76%–100% 43 $134,144 $114,000 $125,000 $170,000 $157,254 $118,250 $136,600 $218,000
Number of employees in compliance and ethics group:
1 4
2 to 5 52 $133,318 $93,000 $130,000 $176,500 $159,802 $95,575 $147,500 $213,009
6 to 10 42 $131,788 $110,000 $133,000 $160,000 $153,038 $115,000 $145,000 $185,000
11 to 15 15 $128,397 $80,000 $120,000 $170,000 $150,863 $80,000 $146,000 $200,000
16 to 20 15 $156,906 $123,000 $150,100 $173,000 $193,773 $156,446 $178,950 $219,000
More than 20 41 $157,420 $127,700 $155,000 $182,000 $198,359 $145,700 $180,000 $240,000
Annual compliance budget:
< $100k 7 $126,286 $88,000 $140,000 $160,000 $174,857 $110,000 $150,000 $200,000
$100k–$249k 7 $93,500 $71,000 $89,000 $100,000 $98,657 $71,000 $94,100 $106,000
$250k–$499k 4 $158,250 $113,250 $156,000 $205,500 $206,500 $140,500 $203,500 $275,500
$500k–$999k 10 $169,232 $135,000 $159,159 $200,000 $207,025 $170,000 $183,000 $225,000
$1m–$1.9m 6 $149,167 $122,000 $151,500 $175,000 $166,583 $135,000 $158,750 $195,000
$2m+ 17 $169,406 $120,000 $170,000 $220,000 $223,582 $155,000 $219,000 $302,000
Number of employees in portion of organization that work in compliance for:
Less than 100 34 $115,210 $85,000 $125,000 $150,000 $132,393 $87,228 $134,000 $190,000
100–249 8 $100,250 $68,750 $103,000 $131,500 $109,531 $68,750 $105,625 $152,750
250–499 7 $149,764 $148,900 $150,000 $172,000 $193,479 $169,500 $178,950 $223,000
500–999 11 $116,455 $89,000 $120,000 $135,000 $128,364 $106,000 $131,000 $135,000
1,000–1,999 15 $142,400 $93,000 $150,000 $182,000 $179,767 $93,000 $175,000 $270,000
2,000–2,999 6 $122,667 $100,000 $115,000 $160,000 $127,417 $100,000 $118,750 $170,000
3,000–4,999 10 $132,970 $115,000 $124,300 $170,000 $164,421 $124,000 $137,050 $240,000
5,000–7,499 11 $147,513 $120,000 $160,000 $171,000 $176,276 $133,000 $180,000 $200,000
7,500–14,999 18 $154,925 $120,000 $155,723 $190,000 $198,925 $131,000 $175,750 $240,000
15,000+ 49 $163,549 $127,700 $160,000 $190,000 $200,342 $145,700 $192,000 $228,000

2019 Cross-Industry Staff Salary Survey 105
Base Salary Total Compensation
Responses Average 25th Percentile Median 75th
Percentile Average 25th Percentile Median 75th
Percentile
Annual revenues of portion of organization that part of compliance and ethics program oversees:
Less than $5 million 33 $115,785 $80,000 $119,762 $150,000 $134,791 $85,000 $136,600 $180,000
$5 million to less than $15 million 10 $79,410 $78,000 $84,000 $105,000 $83,035 $80,000 $87,500 $110,000
$15 million to less than $30 million 6 $137,500 $120,000 $132,500 $145,000 $145,167 $127,500 $138,750 $145,000
$30 million to less than $50 million 2
$50 million to less than $100 million 6 $107,000 $80,000 $97,500 $130,000 $124,833 $83,000 $115,000 $155,000 $100 million to less than $500 million 17 $128,244 $110,000 $130,000 $144,000 $140,531 $110,000 $130,000 $170,000
$500 million to less than $1 billion 7 $132,786 $120,000 $128,000 $154,500 $143,786 $122,000 $150,000 $169,500
$1 billion to less than $3 billion 23 $152,874 $123,000 $165,500 $182,000 $190,722 $137,500 $179,000 $240,000
$3 billion or more 65 $165,825 $140,000 $160,000 $190,000 $210,784 $170,000 $199,000 $230,000
Number of countries in which compliance is managed:
1 82 $123,299 $89,000 $120,250 $150,000 $140,309 $94,100 $131,500 $170,000
2 or more 87 $155,918 $127,700 $160,000 $185,000 $196,324 $155,000 $190,000 $230,000
Number of years worked in the compliance department:
1 or less 21 $156,643 $125,000 $154,500 $200,000 $181,167 $130,000 $168,000 $225,000
2 20 $162,745 $115,650 $164,000 $197,500 $212,495 $132,000 $190,000 $267,500
3 9 $114,928 $93,000 $120,000 $126,000 $125,283 $94,100 $122,000 $145,000
4 14 $148,360 $118,600 $153,223 $177,000 $176,246 $135,000 $165,000 $217,000
5 19 $137,366 $118,000 $148,950 $160,000 $170,274 $130,000 $178,900 $220,000
6–10 40 $136,381 $106,500 $134,000 $168,875 $159,541 $117,750 $161,000 $195,000
11–15 10 $137,647 $110,000 $129,963 $175,000 $168,791 $135,000 $158,589 $190,000
16 or more 36 $127,165 $103,750 $133,850 $160,000 $156,429 $112,000 $150,350 $198,000
Years in compliance profession:
<3 years 17 $113,947 $87,000 $106,000 $134,000 $136,947 $93,000 $126,200 $164,000
3–5 years 39 $124,774 $93,000 $130,000 $160,000 $143,606 $94,100 $135,000 $195,000
6–10 years 39 $127,638 $100,000 $132,000 $150,000 $145,921 $110,000 $146,000 $180,000
11–15 years 42 $152,056 $120,000 $152,821 $190,000 $195,313 $137,500 $190,000 $230,000
16–20 years 24 $170,268 $141,250 $165,000 $197,500 $208,768 $146,250 $185,500 $270,750
21+ years 8 $177,677 $148,013 $184,500 $211,250 $219,044 $173,638 $209,000 $283,500

2019 Cross-Industry Staff Salary Survey 106
Base Salary Total Compensation
Responses Average 25th Percentile Median 75th
Percentile Average 25th Percentile Median 75th
Percentile
Certifications:
Certified Public Accountant (CPA) 6 $140,833 $120,000 $145,000 $165,000 $159,667 $133,000 $162,500 $200,000 Certified Compliance and Ethics Professional (CCEP) 66 $149,829 $127,700 $152,750 $175,000 $181,556 $145,000 $183,000 $219,000
Certified Compliance and Ethics Professional–International (CCEP–I) 17 $161,325 $120,000 $170,000 $185,000 $209,580 $169,500 $219,000 $239,000
Certified in Healthcare Compliance (CHC) 27 $128,616 $93,000 $128,000 $165,500 $145,790 $106,000 $146,000 $171,500
Certified in Healthcare Research Compliance (CHRC) 4
Certified in Healthcare Privacy Compliance (CHPC) 10 $128,900 $115,000 $122,500 $145,000 $139,920 $118,000 $137,500 $170,000
Certified Fraud Examiner (CFE) 11 $138,459 $114,200 $148,900 $170,000 $174,277 $131,000 $178,950 $190,000
Certified Internal Auditor (CIA) 2
Certified Information Privacy Professional (CIPP) 4
Other 48 $137,605 $108,000 $137,500 $160,000 $167,190 $117,500 $155,723 $200,000
None 30 $135,725 $106,000 $137,500 $170,000 $160,246 $110,000 $142,500 $201,035
Type of organization:
Nonprofit 19 $112,557 $78,000 $100,000 $154,500 $127,833 $81,000 $100,000 $170,000
Privately held 54 $134,859 $106,000 $132,500 $165,500 $161,311 $122,000 $152,500 $200,000
Publicly traded 74 $160,823 $134,000 $161,000 $185,000 $203,471 $160,000 $190,000 $228,000
Governmental 4
Academic 14 $104,876 $79,000 $114,000 $120,000 $105,197 $79,000 $114,000 $122,000
Type of industry:
Chemical/Polymers/Fibers 1
Computer Software 2
Consulting Services 4
Education/Training/Library 4
Energy 4
Financial Services 7 $116,336 $87,000 $125,000 $150,000 $144,193 $105,000 $130,000 $192,000
Government/Policy 2
Higher Education 17 $119,427 $105,000 $119,762 $145,000 $127,339 $105,000 $119,762 $145,000
Information Technology 3
Insurance 25 $132,045 $118,600 $134,000 $150,100 $154,613 $133,000 $158,000 $173,000
Manufacturing and Production 12 $165,841 $171,000 $184,000 $197,500 $211,426 $179,250 $216,000 $281,250
Retail/Wholesale 6 $154,700 $114,200 $137,500 $180,000 $192,867 $131,000 $162,500 $230,000
Number of compliance elements involved in:
1–3 19 $116,109 $93,000 $125,000 $151,000 $139,857 $94,100 $164,000 $190,000
4–6 63 $138,720 $106,000 $145,000 $168,000 $164,838 $110,000 $158,000 $200,000
7–9 60 $140,924 $118,891 $137,500 $175,000 $168,684 $126,525 $157,500 $194,250
All 10 27 $158,315 $107,000 $165,500 $200,000 $200,833 $125,000 $204,000 $240,000

2019 Cross-Industry Staff Salary Survey 107
Base Salary Total Compensation
Responses Average 25th Percentile Median 75th
Percentile Average 25th Percentile Median 75th
Percentile
Geographic region:
New England 12 $162,083 $127,250 $161,500 $193,750 $192,333 $148,750 $188,000 $234,750
Mid-Atlantic 24 $147,721 $130,500 $148,925 $181,000 $174,395 $135,400 $175,177 $212,750
East North Central 37 $144,009 $106,000 $159,000 $171,000 $168,744 $124,000 $170,500 $200,000
West North Central 18 $120,817 $100,000 $126,850 $135,000 $141,983 $106,000 $145,350 $175,000
South Atlantic 20 $141,135 $112,441 $131,500 $178,750 $157,235 $116,941 $143,750 $200,500
East South Central 3
West South Central 13 $115,625 $105,000 $114,200 $125,000 $142,740 $105,000 $131,000 $138,925
Mountain 8 $129,000 $85,750 $131,000 $169,000 $150,375 $89,500 $143,500 $212,750
Pacific 12 $157,287 $136,250 $154,571 $166,575 $186,361 $138,750 $185,000 $200,776
Age:
Less than 30 1
30–34 14 $125,718 $114,000 $120,000 $134,000 $144,289 $123,000 $134,000 $164,000
35–39 28 $125,607 $81,250 $131,000 $161,250 $146,050 $83,050 $147,500 $196,500
40–44 27 $148,455 $120,000 $154,500 $183,000 $183,470 $138,925 $185,000 $225,000
45–49 36 $143,994 $120,000 $150,000 $168,875 $179,097 $123,750 $173,250 $226,000
50–54 28 $162,281 $135,000 $165,000 $190,000 $198,718 $151,250 $188,000 $234,000
55–59 20 $137,700 $101,500 $142,500 $181,000 $162,275 $109,750 $157,500 $214,500
60–64 9 $110,269 $80,000 $118,000 $129,000 $125,373 $83,000 $118,000 $150,000
65+ 5 $137,400 $125,000 $162,000 $165,000 $173,600 $131,000 $192,000 $195,000
Contract status:
Yes 32 $138,264 $119,822 $127,500 $169,500 $171,733 $122,250 $145,000 $214,750
No 137 $140,518 $110,000 $145,000 $172,000 $168,541 $118,250 $170,000 $203,000
Severance clause in contract:
Yes 19 $142,551 $119,762 $123,000 $184,000 $180,866 $120,000 $132,000 $280,000
No 13 $132,000 $120,000 $130,000 $155,000 $158,385 $130,000 $160,000 $180,000
How many people report up through to you?
0 45 $134,351 $103,000 $135,000 $173,000 $156,624 $110,000 $156,446 $201,000
1-2 56 $139,418 $115,750 $137,000 $169,500 $169,264 $119,188 $160,000 $212,750
3-5 41 $139,492 $110,000 $135,000 $170,000 $175,443 $130,000 $169,500 $203,000
6-10 14 $149,071 $120,000 $142,500 $185,000 $177,321 $131,000 $162,500 $215,000
11 or more 13 $155,077 $140,000 $165,500 $171,000 $183,308 $170,000 $173,000 $204,000

2019 Cross-Industry Staff Salary Survey 108
Manager Salary Results Non-Health-Care
Base Salary Total Compensation
Responses Average 25th Percentile
Median 75th Percentile
Average 25th Percentile
Median 75th Percentile
All Respondents 381 $94,173 $72,462 $96,000 $116,000 $105,393 $74,420 $101,000 $127,500
Percentage of company's legal and regulatory risk areas compliance department involved in managing:
0%–25% 88 $91,389 $72,000 $94,050 $123,000 $105,682 $72,050 $97,000 $137,000
26%–50% 100 $92,783 $70,000 $95,850 $110,000 $101,264 $72,000 $99,500 $122,750
51%–75% 117 $101,189 $85,000 $100,000 $120,000 $112,457 $88,250 $108,000 $135,000
76%–100% 76 $88,427 $72,191 $92,000 $110,750 $99,615 $72,500 $95,750 $119,250
Number of employees in compliance and ethics group:
1 23 $112,645 $72,462 $90,000 $120,000 $116,271 $72,462 $90,000 $128,768
2 to 5 159 $89,659 $72,000 $90,000 $108,000 $97,217 $72,000 $96,000 $116,000
6 to 10 62 $91,170 $72,000 $96,000 $117,000 $101,352 $80,000 $97,000 $125,000
11 to 15 40 $88,709 $70,000 $90,500 $115,250 $97,097 $76,375 $96,000 $123,250
16 to 20 18 $88,761 $65,000 $97,650 $116,000 $123,681 $65,500 $107,150 $141,000
More than 20 79 $104,239 $90,500 $104,633 $122,000 $121,884 $97,000 $113,137 $140,000
Annual compliance budget:
< $100k 22 $60,886 $12,000 $56,500 $108,000 $65,350 $14,000 $58,750 $108,000
$100k–$249k 11 $75,245 $60,000 $80,000 $101,200 $85,609 $60,000 $85,000 $115,200
$250k–$499k 10 $106,280 $82,000 $102,500 $136,800 $116,430 $87,000 $111,500 $143,800
$500k–$999k 5 $108,600 $104,000 $106,000 $125,000 $112,600 $106,000 $116,000 $125,000
$1m–$1.9m 4
$2m+ 12 $131,091 $110,250 $123,500 $143,850 $152,758 $115,000 $140,500 $184,250
Number of employees in portion of organization that work in compliance for:
Less than 100 84 $84,787 $58,500 $84,000 $109,375 $98,171 $64,250 $87,750 $119,781
100–249 32 $83,818 $60,000 $89,500 $105,750 $90,586 $61,250 $96,500 $117,875
250–499 19 $94,542 $80,000 $94,000 $105,000 $100,584 $87,000 $96,000 $107,000
500–999 29 $83,907 $70,000 $90,000 $109,000 $88,405 $70,000 $95,000 $115,000
1,000–1,999 29 $94,133 $85,000 $96,000 $104,633 $100,738 $90,000 $102,000 $113,633
2,000–2,999 18 $76,054 $70,000 $90,000 $105,000 $81,759 $70,000 $91,000 $105,000
3,000–4,999 37 $89,728 $72,000 $96,000 $125,000 $97,469 $72,000 $96,500 $131,600
5,000–7,499 22 $103,986 $90,000 $100,000 $125,000 $115,429 $95,000 $112,250 $137,500
7,500–14,999 42 $111,283 $84,000 $99,000 $123,500 $122,865 $89,000 $111,000 $137,500
15,000+ 69 $108,200 $95,000 $111,000 $128,000 $128,050 $101,200 $120,000 $150,000

2019 Cross-Industry Staff Salary Survey 109
Base Salary Total Compensation
Responses Average 25th Percentile Median 75th
Percentile Average 25th Percentile Median 75th
Percentile
Annual revenues of portion of organization that part of compliance and ethics program oversees:
Less than $5 million 59 $80,910 $60,000 $80,000 $97,000 $91,739 $60,000 $83,500 $106,000
$5 million to less than $15 million 27 $82,681 $70,000 $85,000 $98,000 $91,666 $70,000 $87,500 $110,000
$15 million to less than $30 million 24 $84,347 $68,750 $90,000 $103,750 $93,742 $80,767 $95,000 $109,000
$30 million to less than $50 million 20 $83,706 $56,325 $85,000 $108,000 $89,781 $62,075 $89,250 $115,800 $50 million to less than $100 million 18 $82,104 $65,000 $73,250 $108,137 $85,276 $71,000 $75,250 $110,000
$100 million to less than $500 million 44 $92,672 $62,500 $95,830 $109,750 $99,117 $63,250 $97,000 $117,375
$500 million to less than $1 billion 38 $95,808 $70,000 $97,567 $119,000 $103,605 $70,800 $109,500 $130,000
$1 billion to less than $3 billion 55 $106,208 $90,000 $105,000 $125,000 $116,786 $96,000 $115,000 $140,000
$3 billion or more 96 $105,605 $90,000 $103,588 $124,625 $124,638 $97,000 $113,887 $144,000
Number of countries in which compliance is managed:
1 213 $88,212 $72,000 $90,000 $106,400 $96,710 $72,000 $94,500 $115,200
2 or more 168 $101,732 $79,250 $100,000 $125,000 $116,401 $87,313 $112,500 $138,000
Number of years worked in the compliance department:
1 or less 71 $93,180 $80,200 $95,000 $120,000 $99,124 $87,000 $97,000 $127,500
2 38 $90,089 $82,317 $98,135 $115,000 $97,561 $87,800 $111,000 $120,000
3 34 $98,592 $55,000 $91,750 $119,000 $105,766 $55,000 $94,500 $129,000
4 40 $88,541 $67,750 $88,700 $109,375 $96,031 $67,750 $95,527 $123,750
5 28 $100,399 $85,250 $96,000 $115,500 $125,453 $90,500 $97,500 $119,250
6–10 77 $85,730 $68,000 $80,000 $104,633 $96,605 $70,800 $86,000 $117,000
11–15 48 $102,151 $92,000 $102,000 $125,495 $113,643 $95,250 $112,887 $146,245
16 or more 45 $102,923 $94,000 $105,000 $122,000 $123,690 $95,000 $114,000 $135,100
Years in compliance profession:
<3 years 49 $77,641 $60,000 $85,000 $102,000 $83,925 $61,000 $89,000 $108,000
3–5 years 99 $86,469 $67,000 $94,000 $110,000 $95,945 $68,000 $100,000 $125,000
6–10 years 118 $100,109 $80,000 $96,000 $117,000 $108,717 $86,000 $101,750 $127,714
11–15 years 73 $106,458 $89,000 $108,000 $125,000 $131,449 $94,500 $116,000 $141,000
16–20 years 32 $87,649 $72,000 $78,500 $104,908 $91,383 $72,625 $81,500 $112,725
21+ years 10 $112,610 $104,000 $106,000 $125,000 $119,510 $105,000 $114,000 $145,000
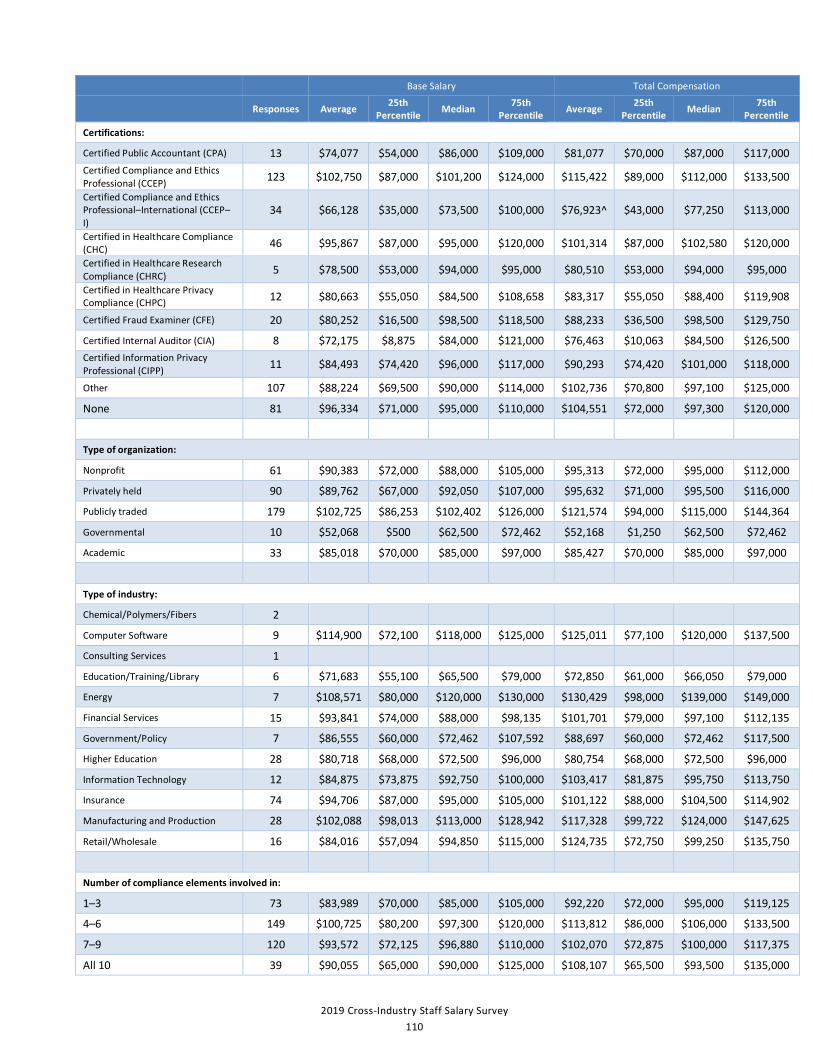
2019 Cross-Industry Staff Salary Survey 110
Base Salary Total Compensation
Responses Average 25th Percentile Median 75th
Percentile Average 25th Percentile Median 75th
Percentile
Certifications:
Certified Public Accountant (CPA) 13 $74,077 $54,000 $86,000 $109,000 $81,077 $70,000 $87,000 $117,000 Certified Compliance and Ethics Professional (CCEP) 123 $102,750 $87,000 $101,200 $124,000 $115,422 $89,000 $112,000 $133,500
Certified Compliance and Ethics Professional–International (CCEP–I)
34 $66,128 $35,000 $73,500 $100,000 $76,923^ $43,000 $77,250 $113,000
Certified in Healthcare Compliance (CHC) 46 $95,867 $87,000 $95,000 $120,000 $101,314 $87,000 $102,580 $120,000
Certified in Healthcare Research Compliance (CHRC) 5 $78,500 $53,000 $94,000 $95,000 $80,510 $53,000 $94,000 $95,000
Certified in Healthcare Privacy Compliance (CHPC) 12 $80,663 $55,050 $84,500 $108,658 $83,317 $55,050 $88,400 $119,908
Certified Fraud Examiner (CFE) 20 $80,252 $16,500 $98,500 $118,500 $88,233 $36,500 $98,500 $129,750
Certified Internal Auditor (CIA) 8 $72,175 $8,875 $84,000 $121,000 $76,463 $10,063 $84,500 $126,500 Certified Information Privacy Professional (CIPP) 11 $84,493 $74,420 $96,000 $117,000 $90,293 $74,420 $101,000 $118,000
Other 107 $88,224 $69,500 $90,000 $114,000 $102,736 $70,800 $97,100 $125,000
None 81 $96,334 $71,000 $95,000 $110,000 $104,551 $72,000 $97,300 $120,000
Type of organization:
Nonprofit 61 $90,383 $72,000 $88,000 $105,000 $95,313 $72,000 $95,000 $112,000
Privately held 90 $89,762 $67,000 $92,050 $107,000 $95,632 $71,000 $95,500 $116,000
Publicly traded 179 $102,725 $86,253 $102,402 $126,000 $121,574 $94,000 $115,000 $144,364
Governmental 10 $52,068 $500 $62,500 $72,462 $52,168 $1,250 $62,500 $72,462
Academic 33 $85,018 $70,000 $85,000 $97,000 $85,427 $70,000 $85,000 $97,000
Type of industry:
Chemical/Polymers/Fibers 2
Computer Software 9 $114,900 $72,100 $118,000 $125,000 $125,011 $77,100 $120,000 $137,500
Consulting Services 1
Education/Training/Library 6 $71,683 $55,100 $65,500 $79,000 $72,850 $61,000 $66,050 $79,000
Energy 7 $108,571 $80,000 $120,000 $130,000 $130,429 $98,000 $139,000 $149,000
Financial Services 15 $93,841 $74,000 $88,000 $98,135 $101,701 $79,000 $97,100 $112,135
Government/Policy 7 $86,555 $60,000 $72,462 $107,592 $88,697 $60,000 $72,462 $117,500
Higher Education 28 $80,718 $68,000 $72,500 $96,000 $80,754 $68,000 $72,500 $96,000
Information Technology 12 $84,875 $73,875 $92,750 $100,000 $103,417 $81,875 $95,750 $113,750
Insurance 74 $94,706 $87,000 $95,000 $105,000 $101,122 $88,000 $104,500 $114,902
Manufacturing and Production 28 $102,088 $98,013 $113,000 $128,942 $117,328 $99,722 $124,000 $147,625
Retail/Wholesale 16 $84,016 $57,094 $94,850 $115,000 $124,735 $72,750 $99,250 $135,750
Number of compliance elements involved in:
1–3 73 $83,989 $70,000 $85,000 $105,000 $92,220 $72,000 $95,000 $119,125
4–6 149 $100,725 $80,200 $97,300 $120,000 $113,812 $86,000 $106,000 $133,500
7–9 120 $93,572 $72,125 $96,880 $110,000 $102,070 $72,875 $100,000 $117,375
All 10 39 $90,055 $65,000 $90,000 $125,000 $108,107 $65,500 $93,500 $135,000
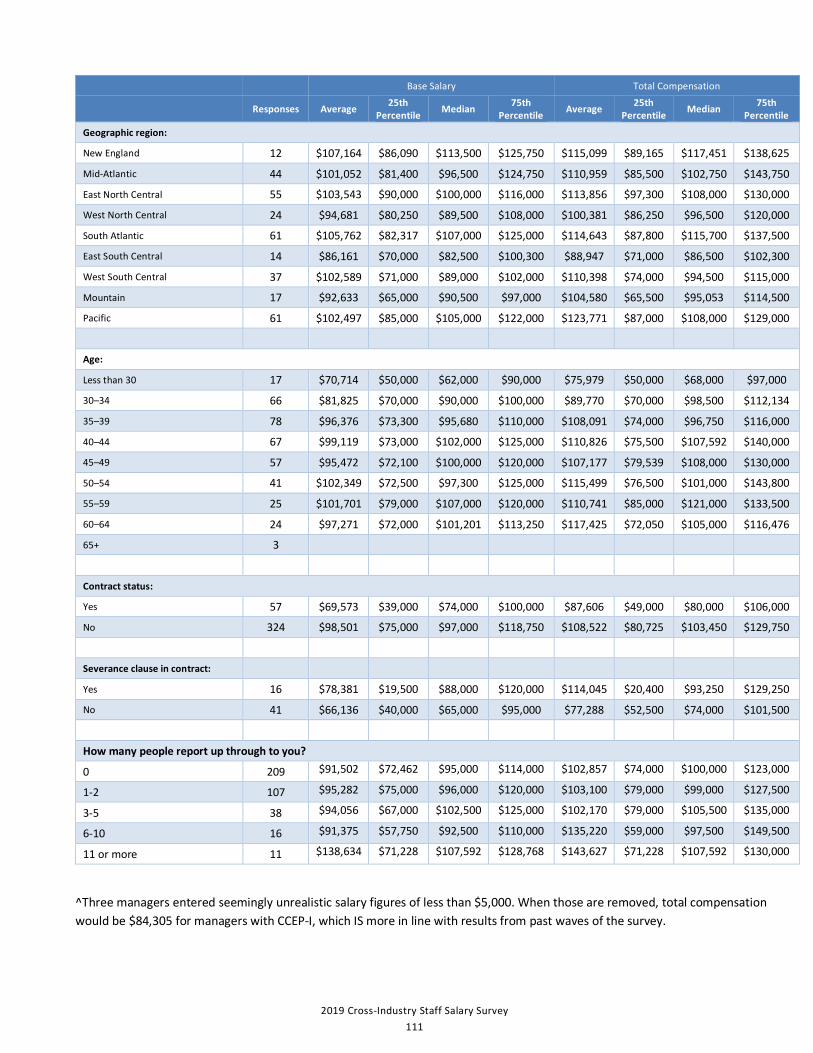
2019 Cross-Industry Staff Salary Survey 111
Base Salary Total Compensation
Responses Average 25th Percentile Median 75th
Percentile Average 25th Percentile Median 75th
Percentile
Geographic region:
New England 12 $107,164 $86,090 $113,500 $125,750 $115,099 $89,165 $117,451 $138,625
Mid-Atlantic 44 $101,052 $81,400 $96,500 $124,750 $110,959 $85,500 $102,750 $143,750
East North Central 55 $103,543 $90,000 $100,000 $116,000 $113,856 $97,300 $108,000 $130,000
West North Central 24 $94,681 $80,250 $89,500 $108,000 $100,381 $86,250 $96,500 $120,000
South Atlantic 61 $105,762 $82,317 $107,000 $125,000 $114,643 $87,800 $115,700 $137,500
East South Central 14 $86,161 $70,000 $82,500 $100,300 $88,947 $71,000 $86,500 $102,300
West South Central 37 $102,589 $71,000 $89,000 $102,000 $110,398 $74,000 $94,500 $115,000
Mountain 17 $92,633 $65,000 $90,500 $97,000 $104,580 $65,500 $95,053 $114,500
Pacific 61 $102,497 $85,000 $105,000 $122,000 $123,771 $87,000 $108,000 $129,000
Age:
Less than 30 17 $70,714 $50,000 $62,000 $90,000 $75,979 $50,000 $68,000 $97,000
30–34 66 $81,825 $70,000 $90,000 $100,000 $89,770 $70,000 $98,500 $112,134
35–39 78 $96,376 $73,300 $95,680 $110,000 $108,091 $74,000 $96,750 $116,000
40–44 67 $99,119 $73,000 $102,000 $125,000 $110,826 $75,500 $107,592 $140,000
45–49 57 $95,472 $72,100 $100,000 $120,000 $107,177 $79,539 $108,000 $130,000
50–54 41 $102,349 $72,500 $97,300 $125,000 $115,499 $76,500 $101,000 $143,800
55–59 25 $101,701 $79,000 $107,000 $120,000 $110,741 $85,000 $121,000 $133,500
60–64 24 $97,271 $72,000 $101,201 $113,250 $117,425 $72,050 $105,000 $116,476
65+ 3
Contract status:
Yes 57 $69,573 $39,000 $74,000 $100,000 $87,606 $49,000 $80,000 $106,000
No 324 $98,501 $75,000 $97,000 $118,750 $108,522 $80,725 $103,450 $129,750
Severance clause in contract:
Yes 16 $78,381 $19,500 $88,000 $120,000 $114,045 $20,400 $93,250 $129,250
No 41 $66,136 $40,000 $65,000 $95,000 $77,288 $52,500 $74,000 $101,500
How many people report up through to you?
0 209 $91,502 $72,462 $95,000 $114,000 $102,857 $74,000 $100,000 $123,000
1-2 107 $95,282 $75,000 $96,000 $120,000 $103,100 $79,000 $99,000 $127,500
3-5 38 $94,056 $67,000 $102,500 $125,000 $102,170 $79,000 $105,500 $135,000
6-10 16 $91,375 $57,750 $92,500 $110,000 $135,220 $59,000 $97,500 $149,500
11 or more 11 $138,634 $71,228 $107,592 $128,768 $143,627 $71,228 $107,592 $130,000
^Three managers entered seemingly unrealistic salary figures of less than $5,000. When those are removed, total compensation would be $84,305 for managers with CCEP-I, which IS more in line with results from past waves of the survey.

2019 Cross-Industry Staff Salary Survey 112
Assistant/Specialist Salary Results Non-healthcare
Base Salary Total Compensation
Responses Average 25th
Percentile Median 75th
Percentile Average 25th
Percentile Median 75th
Percentile
All Respondents 350 $77,725 $56,000 $69,935 $87,000 $81,709 $57,300 $71,000 $90,000
Percentage of company's legal and regulatory risk areas compliance department involved in managing:
0%–25% 69 $85,154 $63,000 $75,000 $92,000 $89,699 $63,000 $79,000 $93,000
26%–50% 103 $70,649 $56,000 $68,000 $88,773 $76,175 $57,300 $68,000 $92,000
51%–75% 103 $83,517 $55,000 $67,000 $90,000 $86,315 $55,000 $69,500 $91,800
76%–100% 75 $72,657 $52,000 $65,000 $81,000 $75,633 $52,000 $68,000 $82,200
Number of employees in compliance and ethics group:
1 13 $56,715 $42,000 $60,000 $69,000 $58,038 $44,000 $60,000 $70,000
2 to 5 143 $77,868 $60,000 $70,000 $84,000 $80,412 $60,000 $70,000 $86,400
6 to 10 70 $86,635 $52,000 $70,100 $93,022 $91,314 $53,000 $71,350 $95,000
11 to 15 33 $69,593 $53,000 $65,000 $78,000 $75,457 $54,500 $65,000 $87,683
16 to 20 14 $67,792 $61,200 $68,000 $85,000 $69,699 $62,000 $71,000 $89,000
More than 20 77 $78,200 $56,000 $78,200 $95,500 $84,247 $57,200 $80,987 $109,000
Annual compliance budget:
< $100k 11 $33,837 $2,653 $40,000 $55,000 $40,051 $5,553 $42,000 $56,100
$100k–$249k 6 $67,833 $34,000 $70,000 $110,000 $71,167 $35,000 $70,000 $110,000
$250k–$499k 2
$500k–$999k 4
$1m–$1.9m 4
$2m+ 4
Number of employees in portion of organization that work in compliance for:
Less than 100 104 $82,421 $52,000 $65,000 $83,500 $85,503 $54,100 $68,000 $86,875
100–249 20 $67,971 $54,500 $66,000 $79,980 $71,326 $56,500 $66,500 $80,555
250–499 20 $58,011 $41,250 $59,150 $71,450 $60,987 $45,234 $59,900 $73,700
500–999 40 $65,529 $55,250 $65,000 $81,875 $67,395 $55,250 $65,850 $81,875
1,000–1,999 26 $82,897 $55,000 $67,500 $78,000 $85,201 $56,100 $68,500 $81,000
2,000–2,999 15 $109,321 $60,000 $73,299 $86,000 $111,248 $62,000 $75,200 $87,500
3,000–4,999 23 $74,683 $62,000 $80,000 $95,000 $77,708 $62,500 $82,100 $99,596
5,000–7,499 24 $67,732 $62,125 $70,250 $82,400 $73,302 $62,125 $74,750 $86,875
7,500–14,999 26 $84,125 $60,000 $78,600 $100,000 $98,618 $65,000 $85,700 $135,000
15,000+ 52 $80,110 $61,119 $81,581 $95,000 $84,024 $65,000 $84,750 $102,375

2019 Cross-Industry Staff Salary Survey 113
Base Salary Total Compensation
Responses Average 25th
Percentile Median 75th
Percentile Average 25th
Percentile Median 75th
Percentile
Annual revenues of portion of organization that part of compliance and ethics program oversees:
Less than $5 million 84 $80,442 $53,000 $67,000 $80,375 $82,792 $57,050 $68,000 $83,875
$5 million to less than $15 million 34 $78,981 $54,000 $61,500 $70,000 $80,774 $55,000 $62,500 $70,000 $15 million to less than $30 million 24 $100,181 $50,500 $61,500 $85,750 $102,722 $53,500 $64,500 $85,800
$30 million to less than $50 million 20 $63,854 $42,750 $65,000 $81,500 $66,301 $44,500 $66,500 $84,250
$50 million to less than $100 million 21 $71,404 $60,000 $63,000 $86,000 $76,327 $60,000 $63,166 $93,000
$100 million to less than $500 million 32 $64,801 $49,750 $70,500 $88,943 $67,516 $50,025 $70,500 $90,750
$500 million to less than $1 billion 21 $88,183 $60,000 $81,000 $95,000 $93,302 $60,000 $86,000 $107,000
$1 billion to less than $3 billion 44 $73,023 $61,400 $74,503 $92,415 $80,177 $62,750 $80,988 $98,000
$3 billion or more 70 $77,744 $60,000 $77,000 $95,000 $83,650 $61,500 $78,900 $103,000
Number of countries in which compliance is managed:
1 235 $82,431 $57,314 $70,000 $85,000 $85,089 $58,000 $71,000 $89,000
2 or more 115 $68,110 $45,000 $69,870 $92,553 $74,804 $49,000 $72,250 $98,403
Number of years worked in the compliance department:
1 or less 83 $74,954 $52,000 $67,000 $81,500 $76,488 $52,000 $67,100 $82,200
2 59 $80,433 $54,000 $67,000 $82,000 $85,482 $56,000 $70,000 $87,500
3 47 $79,089 $50,000 $62,595 $92,500 $82,362 $50,000 $66,000 $93,000
4 19 $65,892 $55,000 $67,000 $80,000 $72,720 $56,000 $70,500 $83,500
5 23 $72,083 $61,200 $74,000 $92,000 $74,767 $65,000 $75,200 $95,000
6–10 58 $85,239 $57,538 $72,650 $92,000 $91,134 $57,838 $76,900 $102,000
11–15 35 $75,446 $62,000 $76,896 $95,000 $79,286 $62,000 $78,000 $95,481
16 or more 26 $77,912 $60,000 $72,110 $96,000 $83,582 $62,500 $75,610 $108,000
Years in compliance profession:
<3 years 97 $63,534 $50,000 $63,000 $79,000 $65,868 $52,000 $65,000 $80,000
3–5 years 128 $74,731 $56,000 $67,500 $80,000 $79,381 $56,400 $68,500 $85,850
6–10 years 63 $80,674 $55,000 $70,000 $90,000 $84,815 $56,000 $71,700 $95,000
11–15 years 36 $105,739 $68,575 $83,000 $98,875 $110,452 $69,625 $87,000 $101,420
16–20 years 9 $86,222 $60,000 $96,000 $101,000 $89,511 $62,500 $104,000 $108,000
21+ years 17 $106,503 $76,000 $95,596 $120,000 $113,120 $76,000 $99,596 $122,000

2019 Cross-Industry Staff Salary Survey 114
Base Salary Total Compensation
Responses Average 25th
Percentile Median 75th
Percentile Average 25th
Percentile Median 75th
Percentile
Certifications:
Certified Public Accountant (CPA) 7 $112,286 $77,000 $100,000 $113,000 $122,643 $81,000 $102,000 $121,000 Certified Compliance and Ethics Professional (CCEP) 96 $90,925 $67,500 $78,600 $95,000 $95,938 $70,400 $81,000 $102,375
Certified Compliance and Ethics Professional–International (CCEP–I)
19 $42,799 $2,055 $40,000 $83,162 $45,313^ $4,050 $41,000 $87,683
Certified in Healthcare Compliance (CHC) 49 $82,049 $60,974 $70,000 $86,000 $86,377 $62,000 $71,000 $91,800
Certified in Healthcare Research Compliance (CHRC) 3
Certified in Healthcare Privacy Compliance (CHPC) 8 $118,714 $53,116 $67,500 $84,500 $120,539 $53,291 $70,500 $87,225
Certified Fraud Examiner (CFE) 10 $94,661 $60,000 $87,500 $100,000 $102,671 $65,000 $90,500 $108,000
Certified Internal Auditor (CIA) 10 $75,283 $17,100 $74,460 $92,000 $79,857 $37,100 $76,610 $92,000 Certified Information Privacy Professional (CIPP) 2
Other 98 $79,725 $56,000 $71,000 $93,000 $84,876 $57,200 $74,800 $98,000
None 94 $69,613 $47,500 $62,875 $79,000 $72,150 $48,900 $62,875 $80,000
Type of organization:
Nonprofit 65 $99,792 $59,500 $70,000 $84,500 $102,642 $60,000 $73,000 $90,000
Privately held 94 $71,028 $42,000 $65,000 $80,000 $74,470 $48,500 $65,350 $81,000
Publicly traded 126 $75,023 $60,000 $74,503 $95,000 $81,554 $61,500 $80,988 $104,000
Governmental 32 $70,462 $57,250 $69,000 $83,500 $71,243 $58,425 $69,000 $83,500
Academic 26 $67,104 $57,300 $67,000 $76,896 $67,496 $57,300 $67,000 $77,300
Type of industry:
Chemical/Polymers/Fibers 4
Computer Software 1
Consulting Services 4
Education/Training/Library 8 $145,675 $56,250 $68,750 $88,974 $145,812 $57,075 $68,750 $88,974
Energy 12 $83,947 $24,000 $80,500 $118,250 $101,968 $50,950 $87,750 $152,500
Financial Services 12 $90,489 $60,500 $72,500 $139,675 $103,214 $63,000 $75,000 $172,025
Government/Policy 19 $76,479 $58,000 $74,000 $92,000 $77,016 $60,000 $75,000 $92,000
Higher Education 23 $67,506 $48,444 $70,000 $80,000 $67,910 $48,444 $70,000 $82,000
Information Technology 8 $81,732 $59,750 $88,900 $94,763 $84,042 $63,500 $89,650 $98,302
Insurance 86 $66,764 $56,000 $65,000 $78,000 $69,787 $57,200 $68,500 $81,000
Manufacturing and Production 15 $68,052 $30,000 $60,000 $85,000 $71,045 $35,000 $61,000 $86,500
Retail/Wholesale 11 $71,675 $73,000 $78,000 $92,700 $77,462 $78,000 $83,000 $102,500
Number of compliance elements involved in:
1–3 88 $82,529 $58,075 $65,500 $86,500 $86,344 $60,000 $68,000 $89,750
4–6 165 $75,403 $56,000 $70,000 $86,000 $79,425 $56,400 $70,000 $89,800
7–9 85 $78,709 $54,000 $73,920 $87,000 $82,072 $56,000 $75,000 $92,000
All 10 12 $67,467 $66,000 $74,003 $88,750 $76,561 $67,500 $83,856 $93,875

2019 Cross-Industry Staff Salary Survey 115
Base Salary Total Compensation
Responses Average 25th
Percentile Median 75th
Percentile Average 25th
Percentile Median 75th
Percentile
Geographic region:
New England 9 $76,289 $65,000 $73,000 $78,200 $80,067 $67,000 $74,500 $85,400
Mid-Atlantic 39 $93,261 $60,000 $74,005 $85,000 $97,375 $61,092 $79,000 $89,000
East North Central 51 $94,334 $60,000 $76,000 $92,553 $99,171 $62,000 $76,000 $98,000
West North Central 28 $71,948 $62,831 $68,500 $80,500 $75,516 $62,831 $70,000 $86,625
South Atlantic 49 $99,806 $62,500 $75,000 $92,000 $103,418 $65,000 $80,500 $92,000
East South Central 16 $74,334 $62,731 $71,000 $80,000 $76,714 $64,875 $73,720 $80,740
West South Central 30 $71,032 $58,000 $70,100 $81,000 $74,162 $60,000 $71,100 $88,000
Mountain 24 $74,761 $60,000 $69,000 $89,750 $76,521 $60,000 $69,000 $93,000
Pacific 44 $82,769 $60,500 $75,948 $100,000 $86,377 $60,500 $76,948 $104,500
Age:
Less than 30 53 $51,595 $42,800 $60,000 $67,000 $53,334 $44,100 $60,203 $68,000
30–34 78 $73,733 $47,500 $66,450 $91,800 $78,267 $49,000 $69,250 $95,000
35–39 60 $81,015 $52,500 $69,500 $84,125 $86,784 $53,750 $73,000 $89,500
40–44 40 $79,372 $62,500 $79,000 $89,000 $84,067 $63,500 $80,750 $94,565
45–49 38 $106,708 $60,974 $68,200 $95,000 $110,081 $62,000 $69,950 $98,000
50–54 35 $81,252 $60,000 $77,000 $93,000 $83,387 $62,500 $77,000 $101,517
55–59 28 $83,385 $66,250 $77,100 $99,747 $88,497 $68,500 $81,000 $100,747
60–64 15 $82,330 $58,300 $73,920 $100,000 $86,730 $62,500 $78,800 $103,000
65+ 1
Contract status:
Yes 65 $50,851 $3,100 $50,000 $77,000 $54,041 $6,500 $50,000 $80,000
No 285 $83,855 $60,000 $71,000 $88,773 $88,020 $61,500 $74,600 $92,000
Severance clause in contract:
Yes 23 $56,215 $3,000 $53,000 $75,000 $60,202 $7,000 $55,000 $75,000
No 42 $47,914 $3,100 $42,712 $80,000 $50,667 $5,000 $46,500 $82,100
How many people report up through to you?
0 306 $80,823 $58,000 $70,000 $87,000 $84,380 $60,000 $74,410 $91,000
1-2 27 $56,487 $6,000 $65,000 $77,000 $63,568 $34,560 $66,500 $83,000
3-5 11 $67,671 $1,855 $80,000 $95,000 $76,911 $3,055 $82,000 $101,517
6-10 3
11 or more 3
^Eight assistants entered seemingly unrealistic salary figures of less than $5,000. When those are removed, total compensation would be $65,076 for assistants/specialists with CCEP-I, which is more in line with results from past waves of the survey.

2019 Cross-Industry Staff Salary Survey 116
Detailed Results

2019 Cross-Industry Staff Salary Survey 117
Staff Detailed Results
Non-Healthcare
Title All Respondents VP Director Manager Assistant/ Specialist
Are your compliance responsibilities:
Responses 920 20 169 381 350 Broad, covering a range of compliance-related risks 78% 80% 84% 76% 76%
Focused on a particular risk area (i.e. privacy, safety) 22% 20% 16% 24% 24%
If focused, which legal and regulatory risk areas are you primarily focused on?
Responses 207 4 28 91 84
Privacy 17% 21% 16% 17%
IT 3% 4% 4% 2%
Occupational health and safety 2% 0% 1% 4%
Other 77% 75% 78% 77%
Percentage indicating involvement in the following compliance elements:
Responses 920 20 169 381 350
Compliance Auditing/Monitoring 73% 75% 75% 71% 73%
Compliance Education 77% 90% 83% 80% 69%
Compliance Investigations 56% 75% 67% 54% 51%
Hot Line/Anonymous Reporting 42% 55% 53% 42% 36%
Reporting to the Board 31% 45% 42% 32% 23%
Compliance Risk Assessments 66% 70% 75% 72% 54%
Compliance Discipline/Incentives 30% 60% 44% 30% 20%
Code of Conduct 53% 55% 61% 57% 46%
Policies and Procedures 85% 80% 92% 84% 83%
Measuring Program Effectiveness 59% 70% 66% 63% 51%
How much of your company’s legal and regulatory risk areas is the compliance department responsible for managing?
Responses 920 20 169 381 350
0%–25% 21% 10% 21% 23% 20%
26%–50% 27% 25% 24% 26% 29%
51%–75% 30% 35% 29% 31% 29%
76%–100% 22% 30% 25% 20% 21%
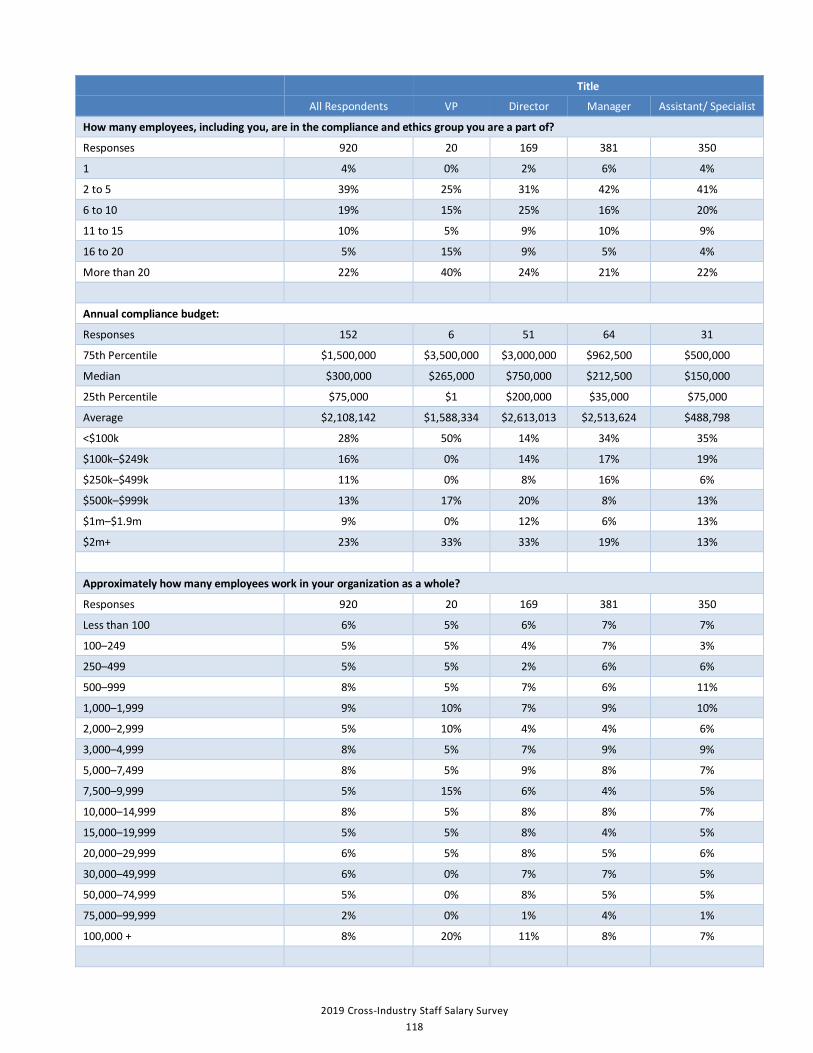
2019 Cross-Industry Staff Salary Survey 118
Title All Respondents VP Director Manager Assistant/ Specialist
How many employees, including you, are in the compliance and ethics group you are a part of?
Responses 920 20 169 381 350
1 4% 0% 2% 6% 4%
2 to 5 39% 25% 31% 42% 41%
6 to 10 19% 15% 25% 16% 20%
11 to 15 10% 5% 9% 10% 9%
16 to 20 5% 15% 9% 5% 4%
More than 20 22% 40% 24% 21% 22%
Annual compliance budget:
Responses 152 6 51 64 31
75th Percentile $1,500,000 $3,500,000 $3,000,000 $962,500 $500,000
Median $300,000 $265,000 $750,000 $212,500 $150,000
25th Percentile $75,000 $1 $200,000 $35,000 $75,000
Average $2,108,142 $1,588,334 $2,613,013 $2,513,624 $488,798
<$100k 28% 50% 14% 34% 35%
$100k–$249k 16% 0% 14% 17% 19%
$250k–$499k 11% 0% 8% 16% 6%
$500k–$999k 13% 17% 20% 8% 13%
$1m–$1.9m 9% 0% 12% 6% 13%
$2m+ 23% 33% 33% 19% 13%
Approximately how many employees work in your organization as a whole?
Responses 920 20 169 381 350
Less than 100 6% 5% 6% 7% 7%
100–249 5% 5% 4% 7% 3%
250–499 5% 5% 2% 6% 6%
500–999 8% 5% 7% 6% 11%
1,000–1,999 9% 10% 7% 9% 10%
2,000–2,999 5% 10% 4% 4% 6%
3,000–4,999 8% 5% 7% 9% 9%
5,000–7,499 8% 5% 9% 8% 7%
7,500–9,999 5% 15% 6% 4% 5%
10,000–14,999 8% 5% 8% 8% 7%
15,000–19,999 5% 5% 8% 4% 5%
20,000–29,999 6% 5% 8% 5% 6%
30,000–49,999 6% 0% 7% 7% 5%
50,000–74,999 5% 0% 8% 5% 5%
75,000–99,999 2% 0% 1% 4% 1%
100,000 + 8% 20% 11% 8% 7%

2019 Cross-Industry Staff Salary Survey 119
Title All Respondents VP Director Manager Assistant/ Specialist
Approximately how many employees work in the portion of the organization that you work in compliance for?
Responses 920 20 169 381 350
Less than 100 24% 10% 20% 22% 30%
100–249 7% 10% 5% 8% 6%
250–499 5% 5% 4% 5% 6%
500–999 9% 10% 7% 8% 11%
1,000–1,999 8% 10% 9% 8% 7%
2,000–2,999 4% 5% 4% 5% 4%
3,000–4,999 8% 5% 6% 10% 7%
5,000–7,499 6% 5% 7% 6% 7%
7,500–9,999 4% 15% 4% 4% 3%
10,000–14,999 6% 5% 7% 7% 4%
15,000–19,999 4% 5% 7% 3% 4%
20,000–29,999 4% 0% 7% 3% 3%
30,000–49,999 3% 0% 5% 4% 3%
50,000–74,999 3% 0% 6% 2% 2%
75,000–99,999 1% 5% 1% 2% 0%
100,000 + 4% 10% 4% 4% 3%
What are the annual revenues of the organization you work for?
Responses 920 20 169 381 350
Less than $5 million 8% 0% 4% 8% 11%
$5 million to less than $15 million 8% 5% 9% 7% 9%
$15 million to less than $30 million 5% 5% 3% 5% 7%
$30 million to less than $50 million 4% 0% 2% 5% 5%
$50 million to less than $100 million 6% 5% 4% 4% 7%
$100 million to less than $500 million 10% 25% 9% 10% 8%
$500 million to less than $1 billion 8% 5% 5% 9% 8%
$1 billion to less than $3 billion 16% 20% 13% 17% 16%
$3 billion or more 35% 35% 50% 34% 28%

2019 Cross-Industry Staff Salary Survey 120
Title All Respondents VP Director Manager Assistant/ Specialist
What are the annual revenues for the portion of the organization that your part of the compliance and ethics program oversees?
Responses 920 20 169 381 350
Less than $5 million 19% 5% 20% 15% 24%
$5 million to less than $15 million 8% 5% 6% 7% 10%
$15 million to less than $30 million 6% 10% 4% 6% 7%
$30 million to less than $50 million 5% 0% 1% 5% 6%
$50 million to less than $100 million 5% 10% 4% 5% 6%
$100 million to less than $500 million 10% 15% 10% 12% 9%
$500 million to less than $1 billion 7% 5% 4% 10% 6%
$1 billion to less than $3 billion 14% 20% 14% 14% 13%
$3 billion or more 26% 30% 38% 25% 20%
For how many countries do you work in compliance?
Responses 920 20 169 381 350
1 59% 50% 49% 56% 67%
2 to 5 16% 0% 20% 18% 12%
6 to 10 7% 10% 5% 9% 5%
11 or more 19% 40% 27% 17% 15%
Where do you work?
Responses 920 20 169 381 350
United States 87% 90% 91% 87% 84%
North America, other than the US 1% 0% 1% 1% 2%
South America 3% 0% 2% 2% 4%
Europe 4% 10% 4% 5% 4%
Asia 3% 0% 2% 3% 3%
Africa 2% 0% 0% 2% 3%
Australia 0% 0% 0% 0% 0%
Current age:
Responses 920 20 169 381 350
75th Percentile 50 48 54 49 48
Median 41 40 46 41 38
25th Percentile 34 36 39 35 32
Average 42.2 41.4 46.2 42.5 40.0
Gender:
Responses 918 20 168 380 350
Male 27% 50% 29% 30% 22%
Female 72% 50% 69% 70% 78%
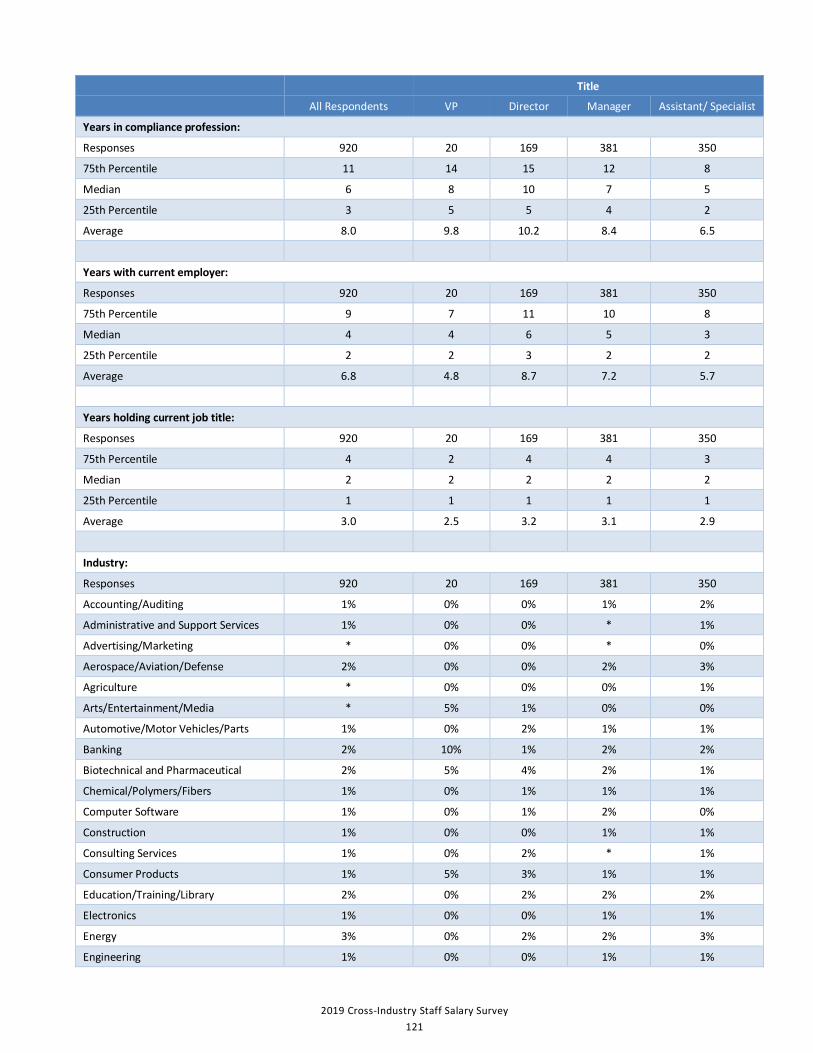
2019 Cross-Industry Staff Salary Survey 121
Title All Respondents VP Director Manager Assistant/ Specialist
Years in compliance profession:
Responses 920 20 169 381 350
75th Percentile 11 14 15 12 8
Median 6 8 10 7 5
25th Percentile 3 5 5 4 2
Average 8.0 9.8 10.2 8.4 6.5
Years with current employer:
Responses 920 20 169 381 350
75th Percentile 9 7 11 10 8
Median 4 4 6 5 3
25th Percentile 2 2 3 2 2
Average 6.8 4.8 8.7 7.2 5.7
Years holding current job title:
Responses 920 20 169 381 350
75th Percentile 4 2 4 4 3
Median 2 2 2 2 2
25th Percentile 1 1 1 1 1
Average 3.0 2.5 3.2 3.1 2.9
Industry:
Responses 920 20 169 381 350
Accounting/Auditing 1% 0% 0% 1% 2%
Administrative and Support Services 1% 0% 0% * 1%
Advertising/Marketing * 0% 0% * 0%
Aerospace/Aviation/Defense 2% 0% 0% 2% 3%
Agriculture * 0% 0% 0% 1%
Arts/Entertainment/Media * 5% 1% 0% 0%
Automotive/Motor Vehicles/Parts 1% 0% 2% 1% 1%
Banking 2% 10% 1% 2% 2%
Biotechnical and Pharmaceutical 2% 5% 4% 2% 1%
Chemical/Polymers/Fibers 1% 0% 1% 1% 1%
Computer Software 1% 0% 1% 2% 0%
Construction 1% 0% 0% 1% 1%
Consulting Services 1% 0% 2% * 1%
Consumer Products 1% 5% 3% 1% 1%
Education/Training/Library 2% 0% 2% 2% 2%
Electronics 1% 0% 0% 1% 1%
Energy 3% 0% 2% 2% 3%
Engineering 1% 0% 0% 1% 1%

2019 Cross-Industry Staff Salary Survey 122
Title All Respondents VP Director Manager Assistant/ Specialist
Environmental Services * 0% 0% 0% 0%
Finance/Economics * 0% 1% 0% 0%
Financial Services 4% 20% 4% 4% 3%
Forest Products * 0% 0% 1% 0%
Government/Policy 3% 0% 1% 2% 5%
Higher Education 7% 0% 10% 7% 7%
Hospitality/Tourism * 0% 1% 0% 0%
Human Resources/Recruiting * 0% 0% 1% 0%
Information Technology 3% 5% 2% 3% 2%
Insurance 20% 15% 15% 19% 25%
Internet/ECommerce * 0% 0% 0% 1%
Law Enforcement/Security Services * 0% 1% * 0%
Legal 1% 5% 2% * 1%
Manufacturing and Production 6% 0% 7% 7% 4%
Military * 0% 0% * 0%
Mining 1% 0% 1% * 1%
Operations Management * 0% 0% * 0%
Personal Care and Service 1% 0% 1% 1% 1%
Pharma/Medical Device 8% 10% 14% 9% 5%
Publishing/Printing * 0% 0% 0% *
Real Estate/Mortgage 1% 5% 0% 1% 0%
Research & Development 2% 0% 2% 2% 1%
Restaurant and Food Service * 0% 0% 1% *
Retail/Wholesale 4% 0% 4% 4% 3%
Science * 0% 1% * 0%
Supply Chain/Logistics * 0% 1% 1% 0%
Telecommunications 3% 0% 4% 3% 1%
Tobacco * 0% 0% 1% 0%
Transportation/Warehousing 1% 0% 1% 1% 2%
Veterinary Services * 0% 0% 0% *
Utilities 1% 0% 0% 2% 2%
Waste Management Services * 0% 1% 0% 0%
Other 10% 15% 10% 10% 11%
*=less than 1%

2019 Cross-Industry Staff Salary Survey 123
Title All Respondents VP Director Manager Assistant/ Specialist
How many years have you worked in the compliance department?
Responses 920 20 169 381 350
Average 5.3 5.8 6.4 5.8 4.3
1 20% 10% 12% 20% 25%
2 15% 10% 16% 11% 19%
3 11% 5% 5% 11% 14%
4 10% 5% 10% 9% 11%
5 12% 30% 12% 11% 11%
6 to 10 19% 35% 26% 21% 12%
11 to 15 10% 5% 14% 11% 6%
16 or more 4% 0% 5% 5% 3%
Type of organization:
Responses 920 20 169 381 350
Nonprofit 16% 5% 11% 16% 19%
Privately held 27% 35% 32% 24% 27%
Publicly traded 43% 60% 44% 47% 36%
Governmental 5% 0% 2% 3% 9%
Academic 8% 0% 8% 9% 7%
Other 2% 0% 2% 2% 2%

2019 Cross-Industry Staff Salary Survey 124
Title All Respondents VP Director Manager Assistant/ Specialist
Percentage holding the following certifications:
Responses 920 20 169 381 350 Leading Professional in Ethics & Compliance (LPEC) 2% 0% 1% 3% 2%
Certified Public Accountant (CPA) 3% 10% 4% 3% 2% Certified Compliance and Ethics Professional (CCEP) 31% 10% 39% 32% 27%
Certified Compliance and Ethics Professional-International (CCEP-I) 8% 5% 10% 9% 5%
Certified in Healthcare Compliance (CHC) 14% 25% 16% 12% 14%
Certified in Healthcare Research Compliance (CHRC) 1% 0% 2% 1% 1%
Certified in Healthcare Privacy Compliance (CHPC) 3% 5% 6% 3% 2%
Advanced Practitioner in Ethics and Compliance Certification (APEX) 1% 0% 0% 1% 1%
Certified Fraud Examiner (CFE) 5% 5% 7% 5% 3%
Certified Internal Auditor (CIA) 2% 0% 1% 2% 3% Certified Information Privacy Professional (CIPP) 2% 5% 2% 3% 1%
Professionals in Human Resources (PHR) 1% 0% 1% 2% 1%
Senior Professionals in Human Resources (SPHR) 1% 0% 1% 2% 0%
Health Ethics Trust Certified Compliance Professional (CCP) 0% 0% 0% 0% 0%
Health Ethics Trust Certified Compliance Executive (CCE) 0% 0% 0% 0% 0%
Accredited Healthcare Fraud Investigator (AHFI) 0% 0% 0% 0% 0%
Other 28% 35% 28% 28% 28%
None 23% 30% 18% 22% 27%
Highest level of education attained:
Responses 920 20 169 381 350
Some college 9% 0% 5% 7% 13%
Bachelor’s degree 37% 15% 28% 35% 45%
MBA 12% 15% 11% 13% 11%
Master’s degree (non-MBA) 23% 35% 20% 28% 19%
JD 17% 35% 31% 17% 10%
PhD 2% 0% 5% 1% 3%

2019 Cross-Industry Staff Salary Survey 125
Title All Respondents VP Director Manager Assistant/ Specialist
Amount of bonus eligible:
Responses 920 20 169 381 350
None 33% 15% 24% 31% 39%
0%–10% of your salary 35% 15% 15% 34% 46%
11%–20% of your salary 21% 25% 31% 27% 10%
21%–30% of your salary 6% 10% 21% 4% 1%
31%–40% of your salary 3% 30% 6% 2% 0%
41% or more of your salary 3% 5% 3% 2% 3%
If you receive a bonus, what is it based on?
Responses 713 19 146 302 246
Company performance 18% 5% 16% 19% 20%
Personal performance 11% 11% 8% 11% 12%
Both 71% 84% 75% 71% 68%
Do you have a contract?
Responses 920 20 169 381 350
Yes 17% 15% 19% 15% 19%
No 83% 85% 81% 85% 81%
If yes, do you have a severance clause in your contract?
Responses 157 3 32 57 65
Yes 38% 59% 28% 35%
No 62% 41% 72% 65%
If yes, what percent of your annual salary is it equivalent to?
Responses 60 2 19 16 23
<20% 7% 11% 13% 0%
20%–29% 3% 5% 0% 4%
30%–49% 2% 0% 6% 0%
50%+ 7% 16% 0% 4% My severance does not translate into this measure 82% 68% 81% 91%

2019 Cross-Industry Staff Salary Survey 126
Title All Respondents VP Director Manager Assistant/ Specialist
Geographic region:
Reponses 920 20 169 381 350
New England 4% 0% 7% 3% 3%
Mid-Atlantic 13% 42% 15% 12% 11%
East North Central 16% 11% 23% 15% 15%
West North Central 8% 5% 11% 6% 8%
South Atlantic 15% 21% 12% 16% 14%
East South Central 4% 0% 2% 4% 5%
West South Central 9% 5% 8% 10% 9%
Mountain 5% 0% 5% 5% 7%
Pacific 13% 5% 7% 16% 13%
Non-US 13% 10% 9% 13% 16%
How many people report up through to you?
Responses 920 20 169 381 350
0 61% 25% 27% 55% 87%
1-2 21% 25% 33% 28% 8%
3-5 10% 20% 24% 10% 3%
6-10 4% 10% 8% 4% 1%
11 or more 3% 20% 8% 3% 1%
Do you know your annual compliance budget?
Responses 920 20 169 381 350
Yes 17% 30% 30% 17% 9%
No 83% 70% 70% 83% 91%
Highest level of education attained:
Responses 920 20 169 381 350
Some college 9% 0% 5% 7% 13%
Bachelor’s Degree 37% 15% 28% 35% 45%
MBA 12% 15% 11% 13% 11%
Master’s Degree (non-MBA) 23% 35% 20% 28% 19%
JD 17% 35% 31% 17% 10%
PhD 2% 0% 5% 1% 3%

2019 Cross-Industry Staff Salary Survey 127
Number of Employees In Compliance/Ethics Group
All Respondents 1 2–5 6–10 11–15 1620 21–50 More than
50 Are your compliance responsibilities:
Responses 920 40 359 177 89 50 121 84 Broad, covering a range of compliance-related risks 78% 73% 85% 79% 70% 64% 74% 70%
Focused on a particular risk area (i.e. privacy, safety) 22% 28% 15% 21% 30% 36% 26% 30%
If focused, which legal and regulatory risk areas are you primarily focused on?
Responses 207 11 55 38 27 18 33 25
Privacy 17% 18% 16% 18% 11% 17% 27% 12%
IT 3% 0% 4% 3% 4% 0% 6% 4%
Occupational health and safety 2% 0% 0% 3% 0% 0% 6% 4%
Other 77% 82% 80% 76% 85% 83% 61% 80%
Percentage indicating involvement in the following compliance elements:
Responses 920 40 359 177 89 50 121 84 Compliance Auditing/Monitoring 73% 78% 74% 72% 69% 84% 73% 65%
Compliance Education 77% 80% 86% 75% 69% 64% 64% 71%
Compliance Investigations 56% 63% 62% 59% 57% 56% 44% 35%
Hot Line/Anonymous Reporting 42% 33% 54% 42% 45% 40% 22% 21%
Reporting to the Board 31% 40% 35% 24% 35% 24% 28% 26%
Compliance Risk Assessments 66% 70% 72% 63% 62% 54% 61% 60% Compliance Discipline/Incentives 30% 28% 36% 24% 22% 32% 26% 26%
Code of Conduct 53% 53% 66% 51% 49% 44% 36% 43%
Policies and Procedures 85% 95% 93% 82% 83% 74% 78% 74% Measuring Program Effectiveness 59% 60% 65% 55% 57% 46% 55% 61%
How much of your company’s legal and regulatory risk areas is the compliance department responsible for managing?
Responses 920 40 359 177 89 50 121 84
0–25% 21% 33% 25% 19% 20% 24% 12% 20% 26%–50% 27% 15% 27% 30% 25% 20% 26% 33% 51%–75% 30% 25% 26% 27% 29% 32% 45% 33% 76%–100% 22% 28% 22% 24% 26% 24% 17% 13%

2019 Cross-Industry Staff Salary Survey 128
Number of Employees In Compliance/Ethics Group
All Respondents 1 2–5 6–10 11–15 1620 21–50 More than
50 How many employees, including you, are in the compliance and ethics group you are a part of?
Responses 920 40 359 177 89 50 121 84
1 4% 100% 0% 0% 0% 0% 0% 0%
2 to 5 39% 0% 100% 0% 0% 0% 0% 0%
6 to 10 19% 0% 0% 100% 0% 0% 0% 0%
11 to 15 10% 0% 0% 0% 100% 0% 0% 0%
16 to 20 5% 0% 0% 0% 0% 100% 0% 0%
More than 20 22% 0% 0% 0% 0% 0% 100% 100%
Annual compliance budget:
Responses 152 9 77 18 13 11 19 5
75th Percentile $1,500,000 $150,000 $500,000 $1,000,000 $2,000,000 $6,000,000 $6,000,000 $7,000,000
Median $300,000 $25,000 $200,000 $350,000 $1,700,000 $5,000,000 $2,126,445 $3,000,000
25th Percentile $75,000 $5,000 $50,000 $80,000 $500,000 $2,500,000 $250,000 $500,000
Average $2,108,142 $93,667 $444,495 $800,278 $1,940,769 $4,167,182 $4,849,244 $22,100,000
<$100k 28% 56% 35% 28% 15% 0% 16% 20%
$100k–$249k 16% 33% 19% 17% 8% 9% 5% 0%
$250k–$499k 11% 11% 16% 11% 0% 0% 5% 0%
$500k–$999k 13% 0% 17% 17% 8% 9% 5% 20%
$1m–$1.9m 9% 0% 8% 17% 31% 0% 5% 0%
$2m+ 23% 0% 5% 11% 38% 82% 63% 60%
Approximately how many employees work in your organization as a whole?
Responses 920 40 359 177 89 50 121 84
Less than 100 6% 25% 11% 1% 2% 0% 1% 4%
100–249 5% 8% 9% 2% 0% 2% 2% 4%
250–499 5% 5% 8% 6% 3% 0% 1% 0%
500–999 8% 20% 10% 12% 3% 4% 3% 0%
1,000–1,999 9% 15% 8% 12% 6% 8% 14% 1%
2,000–2,999 5% 8% 5% 6% 3% 4% 5% 2%
3,000–4,999 8% 3% 11% 7% 8% 8% 10% 0%
5,000–7,499 8% 0% 7% 11% 11% 10% 8% 2%
7,500–9,999 5% 5% 5% 3% 8% 6% 5% 4%
10,000–14,999 8% 3% 5% 11% 8% 6% 12% 12%
15,000–19,999 5% 3% 5% 6% 7% 6% 6% 1%
20,000–29,999 6% 3% 4% 5% 11% 6% 7% 8%
30,000–49,999 6% 3% 4% 5% 9% 12% 7% 11%
50,000–74,999 5% 3% 3% 5% 10% 8% 4% 13%
75,000–99,999 2% 0% 1% 3% 2% 8% 5% 1%
100,000 + 8% 0% 3% 6% 8% 12% 10% 37%

2019 Cross-Industry Staff Salary Survey 129
Number of Employees In Compliance/Ethics Group
All Respondents 1 2–5 6–10 11–15 1620 21–50 More than
50 Approximately how many employees work in the portion of the organization that you work in compliance for?
Responses 920 40 359 177 89 50 121 84
Less than 100 24% 53% 26% 24% 20% 20% 20% 20%
100–249 7% 10% 10% 2% 3% 4% 6% 6%
250–499 5% 0% 6% 5% 3% 6% 4% 7%
500–999 9% 18% 9% 12% 3% 4% 7% 7%
1,000–1,999 8% 5% 7% 12% 8% 4% 11% 1%
2,000–2,999 4% 8% 5% 5% 3% 2% 4% 1%
3,000–4,999 8% 3% 10% 7% 9% 10% 7% 1%
5,000–7,499 6% 0% 5% 8% 7% 4% 11% 5%
7,500–9,999 4% 0% 5% 1% 6% 6% 2% 5%
10,000–14,999 6% 5% 3% 8% 6% 8% 9% 8%
15,000–19,999 4% 0% 4% 3% 7% 4% 7% 5%
20,000–29,999 4% 0% 3% 4% 6% 4% 5% 2%
30,000–49,999 3% 0% 3% 2% 6% 4% 4% 8%
50,000–74,999 3% 0% 1% 2% 7% 4% 1% 7%
75,000–99,999 1% 0% 0% 2% 2% 6% 1% 1%
100,000 + 4% 0% 2% 2% 4% 10% 3% 14%
What are the annual revenues of the organization you work for?
Responses 920 40 359 177 89 50 121 84
Less than $5 million 8% 13% 8% 7% 11% 8% 9% 5% $5 million to less than $15 million 8% 15% 10% 10% 8% 4% 4% 2%
$15 million to less than $30 million 5% 3% 6% 7% 7% 4% 4% 1%
$30 million to less than $50 million 4% 18% 6% 5% 1% 0% 2% 0%
$50 million to less than $100 million 6% 10% 7% 6% 6% 4% 3% 0%
$100 million to less than $500 million 10% 23% 14% 12% 4% 2% 2% 4%
$500 million to less than $1 billion 8% 5% 9% 8% 8% 8% 7% 1%
$1 billion to less than $3 billion 16% 5% 17% 15% 9% 18% 26% 10%
$3 billion or more 35% 10% 22% 31% 46% 52% 43% 77%

2019 Cross-Industry Staff Salary Survey 130
Number of Employees In Compliance/Ethics Group
All Respondents 1 2–5 6–10 11–15 1620 21–50 More than
50 What are the annual revenues for the portion of the organization that your part of the compliance and ethics program oversees?
Responses 920 40 359 177 89 50 121 84
Less than $5 million 19% 28% 19% 19% 24% 14% 17% 15% $5 million to less than $15 million 8% 13% 9% 7% 8% 8% 6% 5%
$15 million to less than $30 million 6% 3% 6% 9% 6% 6% 6% 2%
$30 million to less than $50 million 5% 15% 6% 6% 2% 0% 2% 1%
$50 million to less than $100 million 5% 8% 7% 5% 3% 4% 4% 1%
$100 million to less than $500 million 10% 20% 13% 12% 6% 6% 6% 5%
$500 million to less than $1 billion 7% 5% 8% 7% 9% 2% 8% 5%
$1 billion to less than $3 billion 14% 5% 14% 14% 6% 16% 21% 13%
$3 billion or more 26% 5% 18% 21% 37% 44% 30% 52%
For how many countries do you work in compliance?
Responses 920 40 359 177 89 50 121 84
1 59% 73% 61% 60% 49% 58% 62% 44%
2 to 5 16% 13% 17% 17% 13% 10% 15% 18%
6 to 10 7% 8% 6% 6% 12% 8% 6% 6%
11 or more 19% 8% 16% 16% 25% 24% 17% 32%
Where do you work?
Responses 920 40 359 177 89 50 121 84
United States 87% 85% 89% 87% 83% 88% 84% 83% North America, other than the US 1% 0% 2% 2% 0% 0% 2% 0%
South America 3% 8% 3% 2% 1% 2% 4% 4%
Europe 4% 8% 3% 4% 10% 6% 1% 8%
Asia 3% 0% 2% 4% 4% 2% 7% 1%
Africa 2% 0% 2% 1% 1% 2% 2% 4%
Australia 0% 0% 0% 0% 0% 0% 0% 0%
Current age:
Responses 920 40 359 177 89 50 121 84
75th Percentile 50 52 50 50 48 51 48 50
Median 41 43 41 42 41 42 41 41
25th Percentile 34 34 34 35 34 35 35 34
Average 42.2 43.4 41.9 42.3 42.4 42.9 42.0 42.2

2019 Cross-Industry Staff Salary Survey 131
Number of Employees In Compliance/Ethics Group
All Respondents 1 2–5 6–10 11–15 1620 21–50 More than
50 Gender:
Responses 918 40 358 176 89 50 121 84
Male 27% 18% 22% 32% 30% 34% 32% 29%
Female 72% 83% 78% 67% 70% 62% 68% 71%
Years in compliance profession:
Responses 920 40 359 177 89 50 121 84
75th Percentile 11 9 11 11 14 14 12 11
Median 6 6 5 6 6 8 7 7
25th Percentile 3 2 3 4 3 4 4 5
Average 8.0 6.7 7.3 8.0 8.6 9.7 9.0 8.7
Years with current employer:
Responses 920 40 359 177 89 50 121 84
75th Percentile 9 8 8 10 9 9 12 12
Median 4 3 4 4 5 5 5 6
25th Percentile 2 1 2 2 3 3 2 2
Average 6.8 5.1 6.3 7.0 7.1 6.7 7.8 8.1
Years holding current job title:
Responses 920 40 359 177 89 50 121 84
75th Percentile 4 4 3 4 3 4 4 4
Median 2 2 2 2 2 2 2 2
25th Percentile 1 1 1 1 1 1 1 1
Average 3.0 3.0 3.1 3.1 2.8 3.3 2.8 3.1
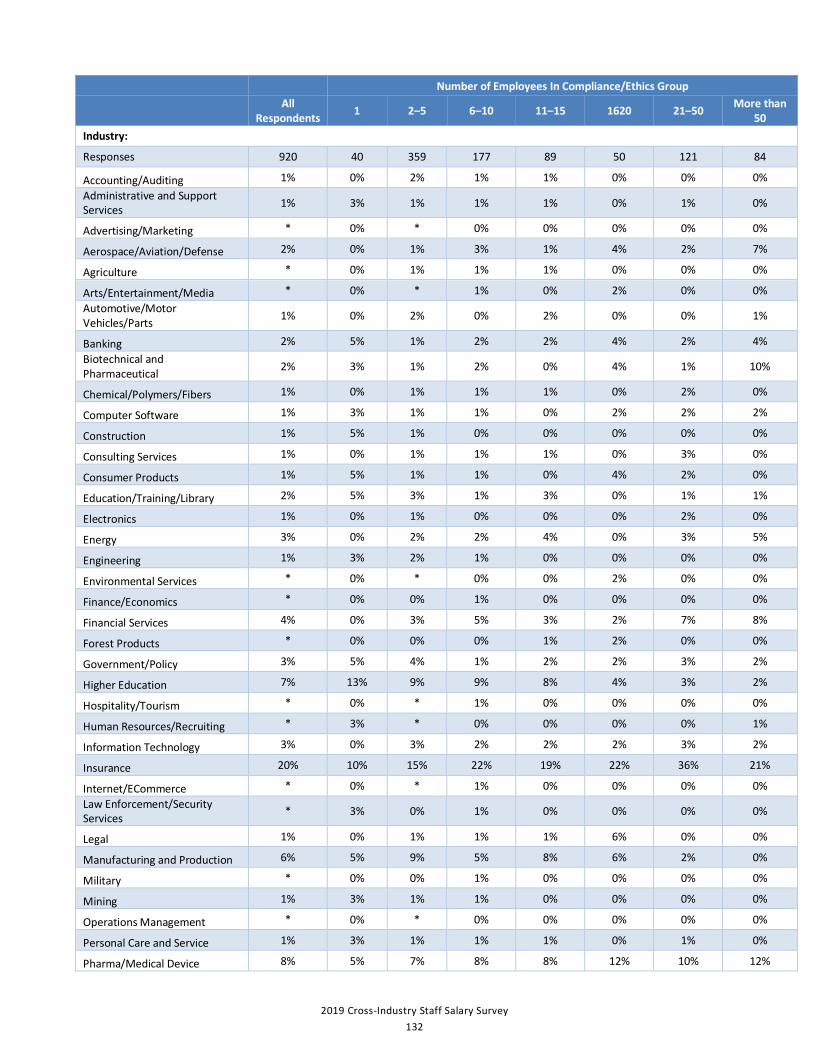
2019 Cross-Industry Staff Salary Survey 132
Number of Employees In Compliance/Ethics Group
All Respondents 1 2–5 6–10 11–15 1620 21–50 More than
50 Industry:
Responses 920 40 359 177 89 50 121 84
Accounting/Auditing 1% 0% 2% 1% 1% 0% 0% 0% Administrative and Support Services 1% 3% 1% 1% 1% 0% 1% 0%
Advertising/Marketing * 0% * 0% 0% 0% 0% 0%
Aerospace/Aviation/Defense 2% 0% 1% 3% 1% 4% 2% 7%
Agriculture * 0% 1% 1% 1% 0% 0% 0%
Arts/Entertainment/Media * 0% * 1% 0% 2% 0% 0% Automotive/Motor Vehicles/Parts 1% 0% 2% 0% 2% 0% 0% 1%
Banking 2% 5% 1% 2% 2% 4% 2% 4% Biotechnical and Pharmaceutical 2% 3% 1% 2% 0% 4% 1% 10%
Chemical/Polymers/Fibers 1% 0% 1% 1% 1% 0% 2% 0%
Computer Software 1% 3% 1% 1% 0% 2% 2% 2%
Construction 1% 5% 1% 0% 0% 0% 0% 0%
Consulting Services 1% 0% 1% 1% 1% 0% 3% 0%
Consumer Products 1% 5% 1% 1% 0% 4% 2% 0%
Education/Training/Library 2% 5% 3% 1% 3% 0% 1% 1%
Electronics 1% 0% 1% 0% 0% 0% 2% 0%
Energy 3% 0% 2% 2% 4% 0% 3% 5%
Engineering 1% 3% 2% 1% 0% 0% 0% 0%
Environmental Services * 0% * 0% 0% 2% 0% 0%
Finance/Economics * 0% 0% 1% 0% 0% 0% 0%
Financial Services 4% 0% 3% 5% 3% 2% 7% 8%
Forest Products * 0% 0% 0% 1% 2% 0% 0%
Government/Policy 3% 5% 4% 1% 2% 2% 3% 2%
Higher Education 7% 13% 9% 9% 8% 4% 3% 2%
Hospitality/Tourism * 0% * 1% 0% 0% 0% 0%
Human Resources/Recruiting * 3% * 0% 0% 0% 0% 1%
Information Technology 3% 0% 3% 2% 2% 2% 3% 2%
Insurance 20% 10% 15% 22% 19% 22% 36% 21%
Internet/ECommerce * 0% * 1% 0% 0% 0% 0% Law Enforcement/Security Services * 3% 0% 1% 0% 0% 0% 0%
Legal 1% 0% 1% 1% 1% 6% 0% 0%
Manufacturing and Production 6% 5% 9% 5% 8% 6% 2% 0%
Military * 0% 0% 1% 0% 0% 0% 0%
Mining 1% 3% 1% 1% 0% 0% 0% 0%
Operations Management * 0% * 0% 0% 0% 0% 0%
Personal Care and Service 1% 3% 1% 1% 1% 0% 1% 0%
Pharma/Medical Device 8% 5% 7% 8% 8% 12% 10% 12%

2019 Cross-Industry Staff Salary Survey 133
Number of Employees In Compliance/Ethics Group
All Respondents 1 2–5 6–10 11–15 1620 21–50 More than
50
Publishing/Printing * 0% 0% 1% 0% 0% 0% 0%
Real Estate/Mortgage 1% 0% 1% 0% 0% 0% 0% 0%
Research & Development 2% 5% 3% 1% 0% 0% 0% 1%
Restaurant and Food Service * 0% * 1% 1% 0% 0% 0%
Retail/Wholesale 4% 0% 3% 4% 4% 4% 2% 8%
Science * 0% 0% 1% 0% 0% 0% 1%
Supply Chain/Logistics * 0% 1% 0% 0% 0% 1% 0%
Telecommunications 3% 3% 2% 2% 2% 6% 3% 5%
Tobacco * 0% 1% 0% 0% 0% 0% 0%
Transportation/Warehousing 1% 0% 2% 2% 3% 0% 0% 0%
Veterinary Services * 0% * 0% 0% 0% 0% 0%
Utilities 1% 0% 2% 3% 0% 0% 0% 0%
Waste Management Services * 0% 0% 1% 0% 0% 0% 0%
Other 10% 15% 11% 12% 16% 10% 7% 5%
*=Less than 1%
How many years have you worked in the compliance department?
Responses 920 40 359 177 89 50 121 84
Average 5.3 3.6 4.9 5.6 5.9 5.3 5.4 6.3
1 20% 30% 24% 23% 18% 10% 13% 13%
2 15% 15% 18% 9% 11% 22% 18% 13%
3 11% 18% 12% 10% 11% 8% 9% 10%
4 10% 8% 9% 10% 10% 12% 13% 8%
5 12% 10% 9% 15% 13% 14% 12% 13%
6 to 10 19% 20% 14% 18% 19% 26% 23% 26%
11 to 15 10% 0% 11% 10% 9% 6% 7% 12%
16 or more 4% 0% 3% 6% 8% 2% 4% 5%
Type of organization:
Responses 920 40 359 177 89 50 121 84
Nonprofit 16% 28% 17% 15% 15% 16% 17% 6%
Privately held 27% 45% 34% 27% 21% 16% 20% 6%
Publicly traded 43% 8% 32% 40% 51% 58% 48% 83%
Governmental 5% 10% 5% 5% 2% 4% 7% 2%
Academic 8% 10% 9% 8% 11% 4% 6% 2%
Other 2% 0% 2% 5% 0% 2% 2% 0%

2019 Cross-Industry Staff Salary Survey 134
Number of Employees In Compliance/Ethics Group
All Respondents 1 2–5 6–10 11–15 1620 21–50 More than
50
Percentage holding the following certifications:
Responses 920 40 359 177 89 50 121 84 Leading Professional in Ethics & Compliance (LPEC) 2% 0% 3% 0% 2% 2% 4% 1%
Certified Public Accountant (CPA) 3% 3% 3% 2% 7% 2% 4% 2%
Certified Compliance and Ethics Professional (CCEP) 31% 20% 36% 27% 24% 32% 28% 37%
Certified Compliance and Ethics Professional-International (CCEP-I)
8% 3% 6% 6% 12% 10% 7% 15%
Certified in Healthcare Compliance (CHC) 14% 8% 9% 18% 21% 20% 17% 11%
Certified in Healthcare Research Compliance (CHRC) 1% 0% 1% 2% 0% 2% 2% 1%
Certified in Healthcare Privacy Compliance (CHPC) 3% 3% 4% 4% 3% 4% 2% 2%
Advanced Practitioner in Ethics and Compliance Certification (APEX)
1% 0% 1% 0% 0% 2% 2% 0%
Certified Fraud Examiner (CFE) 5% 0% 3% 4% 3% 16% 6% 10%
Certified Internal Auditor (CIA) 2% 0% 3% 1% 2% 2% 3% 2% Certified Information Privacy Professional (CIPP) 2% 0% 2% 1% 1% 2% 4% 2%
Professionals in Human Resources (PHR) 1% 3% 1% 1% 0% 2% 2% 0%
Senior Professionals in Human Resources (SPHR) 1% 3% 1% 1% 0% 2% 2% 0%
Health Ethics Trust Certified Compliance Professional (CCP) 0% 0% 0% 0% 0% 0% 1% 0%
Health Ethics Trust Certified Compliance Executive (CCE) 0% 0% 0% 1% 0% 0% 0% 0%
Accredited Healthcare Fraud Investigator (AHFI) 0% 0% 0% 0% 1% 0% 0% 0%
Other 28% 33% 30% 26% 25% 34% 26% 25% None 23% 38% 22% 25% 23% 18% 24% 17%
Highest level of education attained:
Responses 920 40 359 177 89 50 121 84
Some college 9% 10% 10% 7% 9% 4% 11% 6%
Bachelor’s degree 37% 28% 39% 37% 42% 38% 32% 35%
MBA 12% 5% 10% 14% 4% 16% 19% 14%
Master’s degree (non-MBA) 23% 43% 22% 18% 26% 24% 26% 21%
JD 17% 13% 16% 21% 18% 18% 11% 24%
PhD 2% 3% 3% 3% 1% 0% 1% 0%

2019 Cross-Industry Staff Salary Survey 135
Number of Employees In Compliance/Ethics Group
All Respondents 1 2–5 6–10 11–15 1620 21–50 More than
50 Amount of bonus eligible:
Responses 920 40 359 177 89 50 121 84
None 33% 53% 38% 37% 38% 26% 18% 8%
0%–10% of your salary 35% 33% 35% 31% 30% 28% 41% 40%
11%–20% of your salary 21% 10% 18% 21% 26% 20% 27% 29%
21%–30% of your salary 6% 5% 3% 7% 4% 18% 7% 12%
31%–40% of your salary 3% 0% 3% 2% 0% 4% 3% 5%
41% or more of your salary 3% 0% 3% 2% 1% 4% 3% 6%
If you receive a bonus, what is it based on?
Responses 713 20 265 131 73 40 106 78
Company performance 18% 25% 20% 22% 14% 30% 17% 5%
Personal performance 11% 20% 14% 11% 12% 5% 6% 6%
Both 71% 55% 67% 67% 74% 65% 77% 88%
Do you have a contract?
Responses 920 40 359 177 89 50 121 84
Yes 17% 20% 17% 15% 20% 12% 14% 24%
No 83% 80% 83% 85% 80% 88% 86% 76%
If yes, do you have a severance clause in your contract?
Responses 157 8 62 26 18 6 17 20
Yes 38% 13% 40% 42% 28% 33% 35% 50%
No 62% 88% 60% 58% 72% 67% 65% 50%
If yes, what percent of your annual salary is it equivalent to?
Responses 60 1 25 11 5 2 6 10
<20% 7% 4% 18% 0% 0% 10%
20%–29% 3% 4% 9% 0% 0% 0%
30%–49% 2% 4% 0% 0% 0% 0%
50%+ 7% 0% 0% 0% 33% 10% My severance does not translate into this measure 82% 88% 73% 100% 67% 80%
Number of compliance elements involved in:
Responses 920 40 359 177 89 50 121 84
1–3 20% 20% 11% 24% 24% 28% 26% 33%
4–6 41% 33% 37% 41% 45% 40% 53% 43%
7–9 30% 40% 41% 28% 20% 24% 15% 18%
All 10 9% 8% 11% 7% 11% 8% 7% 6%

2019 Cross-Industry Staff Salary Survey 136
Number of Employees In Compliance/Ethics Group
All Respondents 1 2–5 6–10 11–15 1620 21–50 More than
50 Geographic region:
Responses 920 40 359 177 89 50 121 84
New England 4% 5% 2% 5% 2% 8% 4% 4%
Mid-Atlantic 13% 13% 10% 13% 16% 25% 16% 7%
East North Central 16% 8% 15% 14% 18% 18% 19% 22%
West North Central 8% 8% 8% 9% 3% 2% 8% 13%
South Atlantic 15% 13% 15% 18% 16% 14% 12% 10%
East South Central 4% 5% 4% 4% 3% 2% 4% 2%
West South Central 9% 16% 8% 10% 10% 12% 6% 7%
Mountain 5% 5% 8% 4% 3% 2% 4% 2%
Pacific 13% 11% 18% 10% 9% 4% 10% 16%
Non-US 13% 15% 11% 13% 17% 12% 16% 17%
How many people report up through to you?
Responses 920 40 359 177 89 50 121 84
0 61% 90% 66% 60% 55% 56% 50% 58%
1-2 21% 3% 27% 20% 19% 10% 21% 18%
3-5 10% 0% 6% 11% 20% 12% 17% 12%
6-10 4% 3% 1% 7% 3% 8% 6% 4%
Do you know your annual compliance budget?
Responses 920 40 359 177 89 50 121 84
Yes 17% 23% 21% 10% 15% 22% 16% 6%
No 83% 78% 79% 90% 85% 78% 84% 94%
Highest level of education attained:
Responses 920 40 359 177 89 50 121 84
Some college 9% 10% 10% 7% 9% 4% 11% 6%
Bachelor’s Degree 37% 28% 39% 37% 42% 38% 32% 35%
MBA 12% 5% 10% 14% 4% 16% 19% 14%
Master’s Degree (non-MBA) 23% 43% 22% 18% 26% 24% 26% 21%
JD 17% 13% 16% 21% 18% 18% 11% 24%
PhD 2% 3% 3% 3% 1% 0% 1% 0%


Become Certifi ed
→ → → →Gain Work Experience
Earn & Submit CEUs
Apply to Take Exam
Schedule Your Exam
Take Exam
Follow these 5 steps to certifi cation:
Gain credibility, show dedication to excellence, and become a compliance resource for your company.
corporatecompliance.org/certifi cation

About SCCESCCE is a non-profit, member-based association for compliance and ethics professionals. Since 2004, we have been championing ethical practices and compli-ance standards to promote lasting success and integrity of organizations worldwide and across all industries. Headquartered in Minneapolis, MN, SCCE serves 7,600+ members in 100+ countries around the globe.
corporatecompliance.org