cross-epa nitrogen research & policy integration€¦ · discussion topics •sab’s...
TRANSCRIPT
Cross-EPA Nitrogen Research & Policy Integration Anne W. Rea, Ph.D. Office of Research & Development SAB/BOSC review July 10-11, 2012
Office of Research & Development - Office of Water - Office of Air & Radiation – EPA Regions

Discussion Topics
•SAB’s recommendations to EPA for science-
policy integration to achieve nitrogen loading
reductions
•Cross-EPA Roadmap for Integrating Nitrogen &
Co-Pollutant Research & Policy
1

Problems cannot be solved at the
same level of awareness that
created them.
– Albert Einstein
2
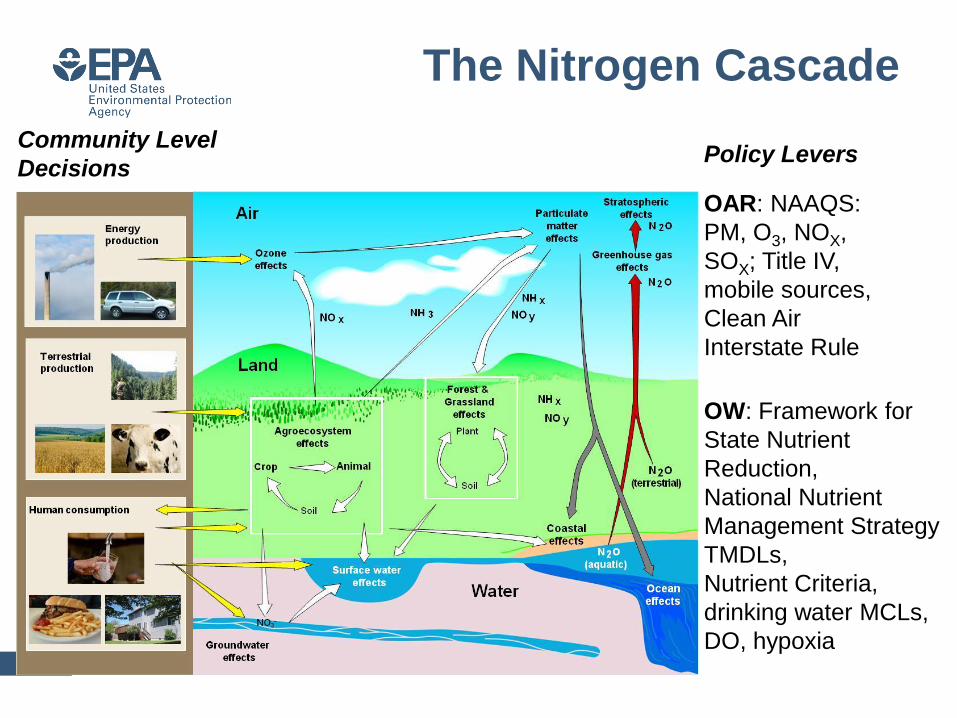
The Nitrogen Cascade
3
Policy Levers
OAR: NAAQS:
PM, O3, NOX,
SOX; Title IV,
mobile sources,
Clean Air
Interstate Rule
Community Level
Decisions
OW: Framework for
State Nutrient
Reduction,
National Nutrient
Management Strategy
TMDLs,
Nutrient Criteria,
drinking water MCLs,
DO, hypoxia
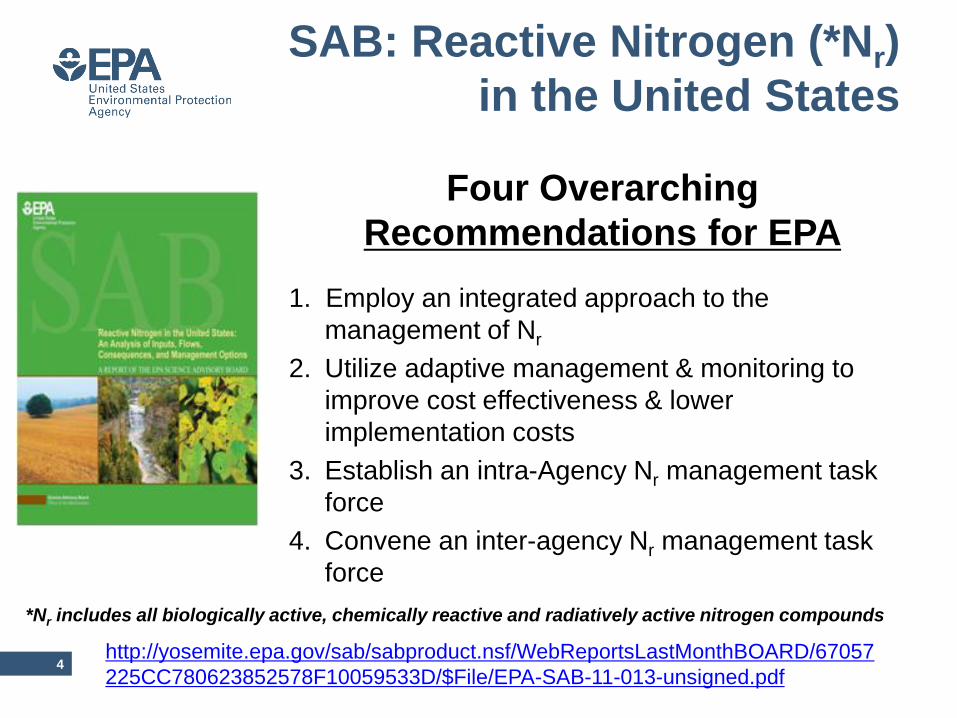
SAB: Reactive Nitrogen (*Nr)
in the United States
Four Overarching
Recommendations for EPA
1. Employ an integrated approach to the
management of Nr
2. Utilize adaptive management & monitoring to
improve cost effectiveness & lower
implementation costs
3. Establish an intra-Agency Nr management task
force
4. Convene an inter-agency Nr management task
force
4 http://yosemite.epa.gov/sab/sabproduct.nsf/WebReportsLastMonthBOARD/67057
225CC780623852578F10059533D/$File/EPA-SAB-11-013-unsigned.pdf
*Nr includes all biologically active, chemically reactive and radiatively active nitrogen compounds
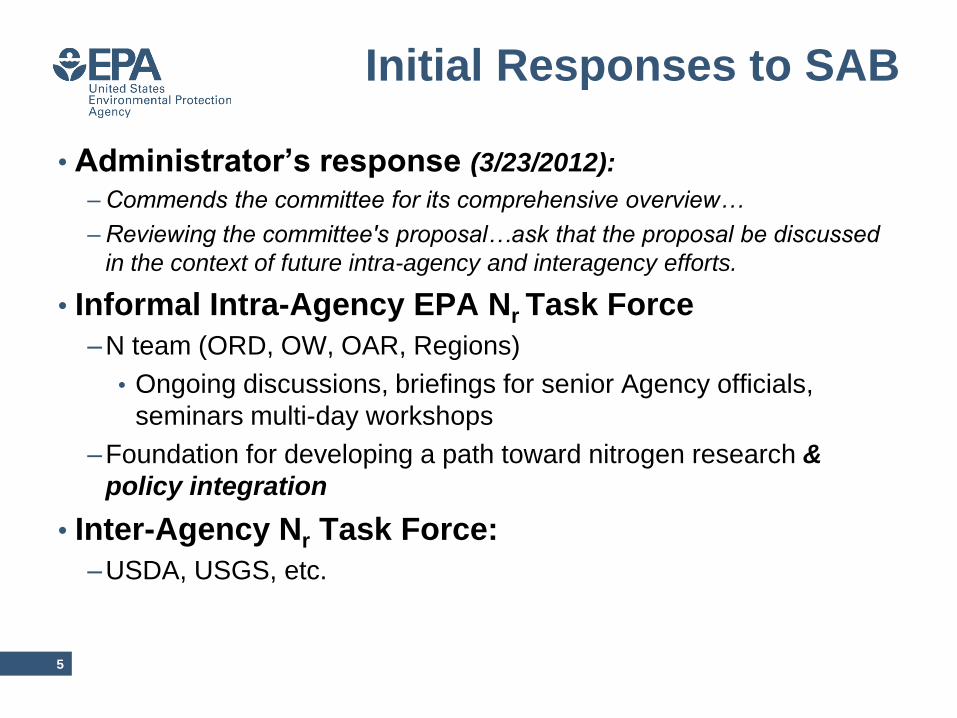
Initial Responses to SAB
• Administrator’s response (3/23/2012):
– Commends the committee for its comprehensive overview…
– Reviewing the committee's proposal…ask that the proposal be discussed
in the context of future intra-agency and interagency efforts.
• Informal Intra-Agency EPA Nr Task Force
–N team (ORD, OW, OAR, Regions)
• Ongoing discussions, briefings for senior Agency officials,
seminars multi-day workshops
–Foundation for developing a path toward nitrogen research &
policy integration
• Inter-Agency Nr Task Force:
–USDA, USGS, etc.
5
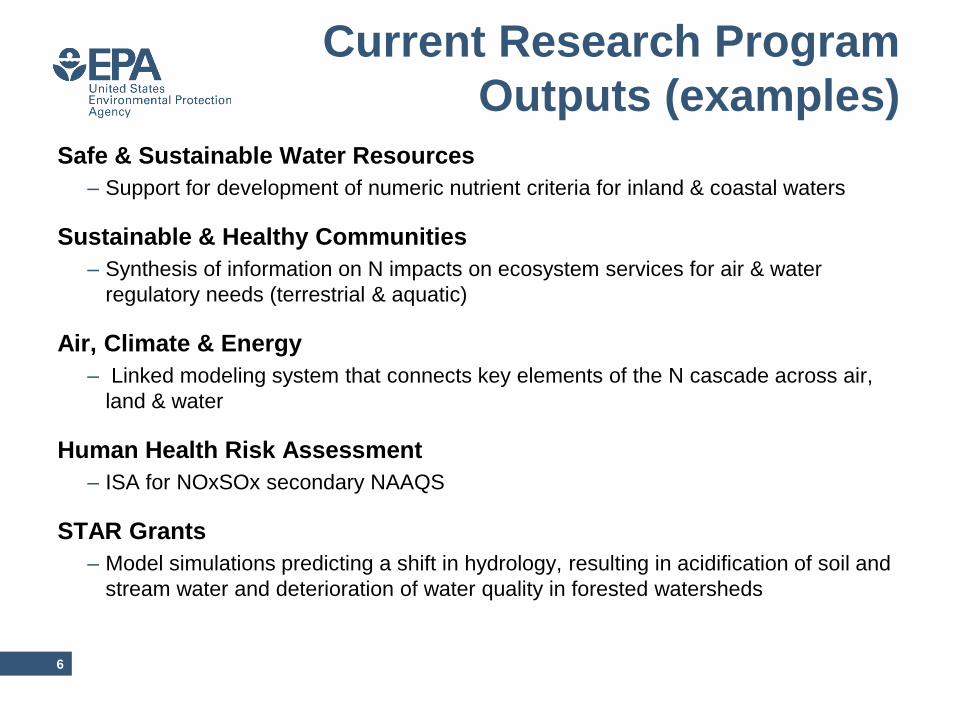
Current Research Program
Outputs (examples) Safe & Sustainable Water Resources
– Support for development of numeric nutrient criteria for inland & coastal waters
Sustainable & Healthy Communities
– Synthesis of information on N impacts on ecosystem services for air & water
regulatory needs (terrestrial & aquatic)
Air, Climate & Energy
– Linked modeling system that connects key elements of the N cascade across air,
land & water
Human Health Risk Assessment
– ISA for NOxSOx secondary NAAQS
STAR Grants
– Model simulations predicting a shift in hydrology, resulting in acidification of soil and
stream water and deterioration of water quality in forested watersheds
6

EPA N Roadmap: Integrating Research & Policy to Achieve Sustainable Nitrogen & Co-Pollutant Management
7 Office of Research & Development - Office of Water - Office of Air & Radiation– EPA Regions

Cross-EPA Nitrogen Research
& Policy Integration
Significant reductions in Nr loadings are necessary to meet air & water
quality goals.
• Key Question: What would be the most economically efficient, socially
acceptable & environmentally sound way to do this?
• Vision: A one-EPA perspective on sustainable nitrogen & co-pollutant
management
–Optimizes uses of nitrogen
–Reduces environmental & health impacts
–Maximizes benefits to society
• Needs: Variety of tools, range of scales,
cost effective & practical
8

Ecosystem Goods & Services
Social Systems
Economic Systems
Decisions
Stressors & Drivers
Environmental Systems
Assessment Scenarios
Sustainability: Triple Bottom-Line Environmental, Economic & Social Systems
9

Ecosystem Goods & Services
Social Systems
Economic Systems
Decisions
Stressors & Drivers
Environmental Systems
Policy Drivers
OW, Regions, States : TMDLs
USDA: BMPs, CRP, incentives
OAR, Regions: Emission
regulations
OAQPS/OTAQ: AQ standards
OW: Safe DW criteria
OAR & OW: Cost-Benefit
Analyses
OW-OST, States:
WQ criteria
Assessment Scenarios
10

Ecosystem Goods & Services
Social Systems
Economic Systems
Decisions
Stressors & Drivers
Environmental Systems
OW, Regions, States : TMDLs
USDA: BMPs, CRP, incentives
OAR, Regions: Emission
regulations
OW: Safe DW criteria
OAR & OW: Cost-Benefit
Analyses
OW-OST, States:
WQ criteria
Assessment Scenarios
ORD Research
Atlas and
Mapping
Deposition tools
N dep effects
on ecosystems
GOM nutrients
& hypoxia
Link condition
to EGS
Algal blooms,
HHWB Health and Well-
being Functions
Valuation
Functions EGS valuation
Air-land-water
Scenario models
Life Cycle
Assessment
Nutrient Mgmt
Toolbox
Nutrient
Removal
Technologies N mapping
tools
Streams in Ag
Regions Green
infrastructure
Narragansett
Bay & Watershed
Sustainability
OAQPS/OTAQ: AQ standards
Remote Sensing
Tools
Evolving Energy
Landscapes
11
model predictions
of WQ in forested
watersheds (STAR)
STAR Grants
ISA for NOxSOx
secondary
NAAQS
IRIS review
of ammonia
ACE
SHC
SSWR
HHRA
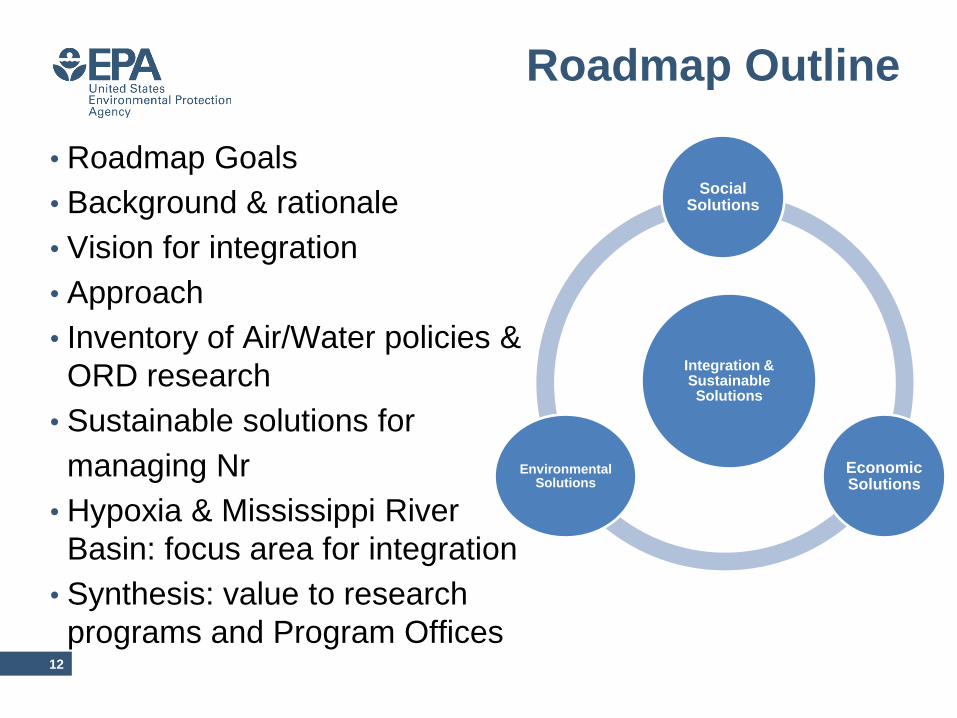
Roadmap Outline
• Roadmap Goals
• Background & rationale
• Vision for integration
• Approach
• Inventory of Air/Water policies &
ORD research
• Sustainable solutions for
managing Nr
• Hypoxia & Mississippi River
Basin: focus area for integration
• Synthesis: value to research
programs and Program Offices 12
Integration & Sustainable Solutions
Social Solutions
Economic Solutions
Environmental Solutions
8
Summary
•Recognized need for integration across EPA &
beyond
•Several ongoing projects w/in current research
programs address nitrogen & co-pollutant
issues
•Cross-EPA effort to develop N Roadmap
•External communications/collaborations needed
13
Appendix: Examples of Current N-related ORD Research
14
ACE
SHC
SSWR Safe & Sustainable Water Resources
Sustainable & Healthy Communities
Air, Climate & Energy
Human Health Risk Assessment
Note: A more extensive project list is found in the
Table of ORD nitrogen & co-pollutant research projects (provided)
HHRA
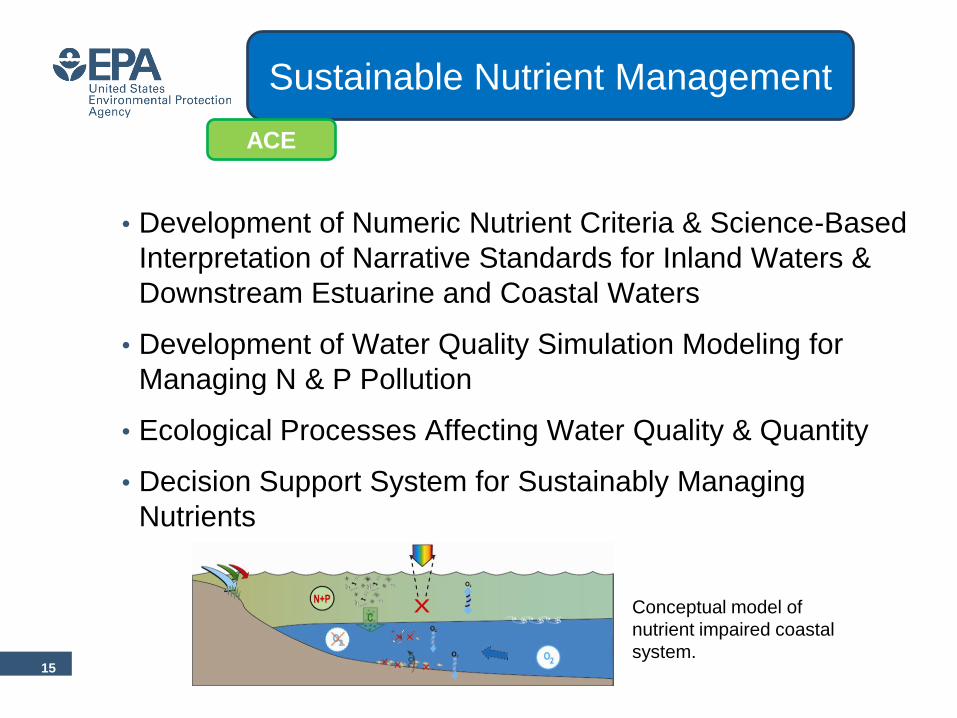
• Development of Numeric Nutrient Criteria & Science-Based
Interpretation of Narrative Standards for Inland Waters &
Downstream Estuarine and Coastal Waters
• Development of Water Quality Simulation Modeling for
Managing N & P Pollution
• Ecological Processes Affecting Water Quality & Quantity
• Decision Support System for Sustainably Managing
Nutrients
Sustainable Nutrient Management
Conceptual model of
nutrient impaired coastal
system. 15
ACE

• CSO mitigation through multi-scale implementation of GI in
communities
Develop effective integrated green & gray approaches at sewershed
scale to reduce Combined Sewer Overflows (CSOs)
• Place based & experimental monitoring of green & grey
infrastructure best management practices (BMPs)
Identify key data gaps regarding BMP performance
16
Determine Integration of Green
Infrastructure in Communities
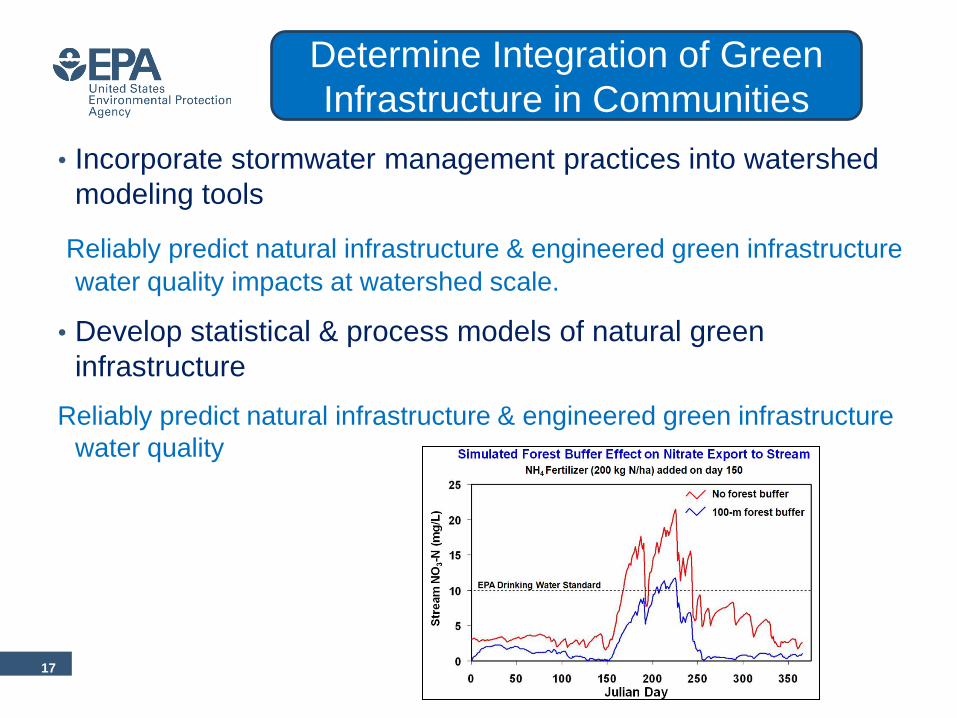
• Incorporate stormwater management practices into watershed
modeling tools
Reliably predict natural infrastructure & engineered green infrastructure
water quality impacts at watershed scale.
• Develop statistical & process models of natural green
infrastructure
Reliably predict natural infrastructure & engineered green infrastructure
water quality
17
Determine Integration of Green
Infrastructure in Communities

18
Goal: Informing more holistic & integrated nutrient management
decisions to maintain/improve human well-being & ecosystems
Narragansett Bay and Watershed
Sustainability - Demonstration Project SHC ACE
• Retrospective: A systems analysis of Narragansett Bay,
its watershed, and its stressors: the cumulative effects of
previous management decisions on current ecosystem
integrity.
• Contemporary: Determine how drivers of change &
disturbances/enhancements specifically related to
nutrients affect ecosystem structure & function.
• Prospective: A comprehensive systems management
approach to achieve a sustainable Narragansett Bay & its
resources (includes MA & RI components of the
watershed).
• R&D designed to inform key governance decisions
• Approach & decision support tools that can be
adapted for use elsewhere
19
• Southern New England Technology/Policy Innovation
Hub – title TBD
–Public-private forum to develop sustainable solutions to nutrient
pollution & estuarine restoration
–Promote innovative technologies for nutrient control & management
• Region 1/ORD Sustainability Pilot:
–Policy “triple value” simulation tool drawing from available models,
databases & stakeholder input (available autumn 2012)
–Systems analysis of scenarios assessing how combinations of
interventions (e.g., green infrastructure/low impact development,
wastewater treatment facilities, and bio-harvesting) affect
economic, social & environmental indicators over time
Other SSWR Nutrient-Related Projects

20
The triple value framework shown on the left examines relationships among economic, social & environmental systems helping users to consider holistic sets of interventions
• Indicators include economic, social, & environmental outcomes, for example:
• Employment, shellfish production • Beach visits, property values • Phytoplankton, eel grass levels
• Reducing both nitrogen loadings & stormwater runoff
• Exploring increased uptake of nitrogen through bio-harvesting of shellfish
• Managing future impacts of climate change & population growth
The tool includes a user friendly interface shown on the right that allow users to test a variety of “what-if” scenarios & trace directional impacts on indicators over time
ORD/R1 Narragansett Bay
Sustainability Pilot
21
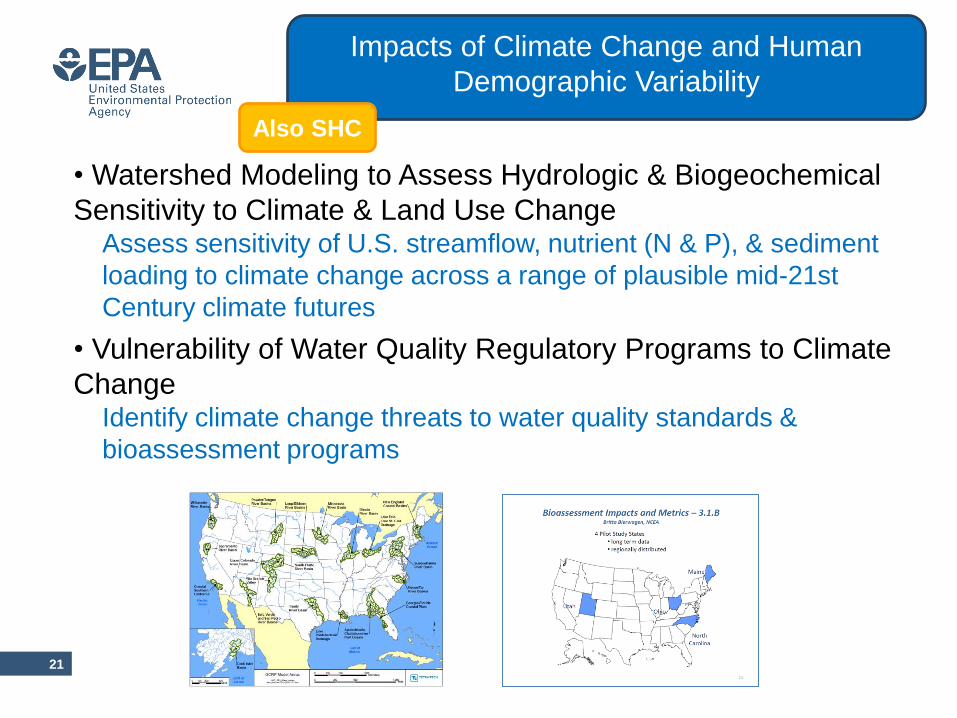
Impacts of Climate Change and Human
Demographic Variability
Also SHC
• Watershed Modeling to Assess Hydrologic & Biogeochemical
Sensitivity to Climate & Land Use Change Assess sensitivity of U.S. streamflow, nutrient (N & P), & sediment
loading to climate change across a range of plausible mid-21st
Century climate futures
• Vulnerability of Water Quality Regulatory Programs to Climate
Change Identify climate change threats to water quality standards &
bioassessment programs
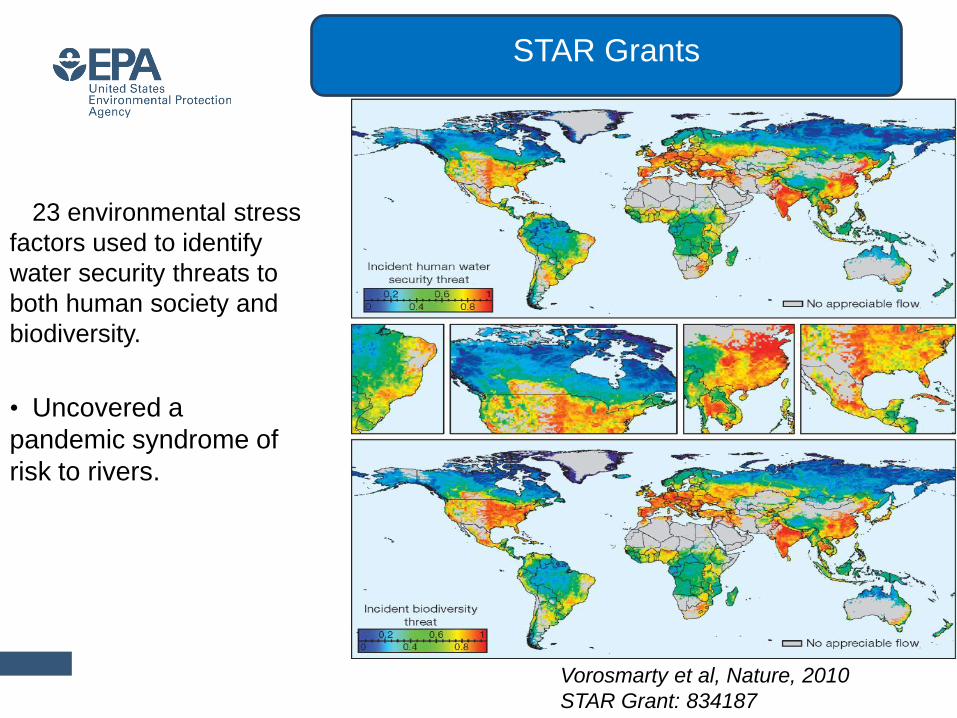
• 23 environmental stress
factors used to identify
water security threats to
both human society and
biodiversity.
• Uncovered a
pandemic syndrome of
risk to rivers.
Vorosmarty et al, Nature, 2010
STAR Grant: 834187
STAR Grants

Concentrations of Nitrate in Stream Water NOAA Geophysical Fluid Dynamics Laboratory model CM2.1, A1fi (fossil fuel-intensive)
Model simulations under climate change displayed a shift in hydrology characterized by later
snowpack development, earlier spring snowmelt, greater evapotranspiration, and a slight increase
in annual water yield. Under elevated temperature, net soil nitrogen mineralization and nitrification
was simulated to increase markedly, resulting in acidification of soil and stream water and altering
the quality of water draining from forested watersheds.
Pourmokhtarian et al., 2012
STAR Grant: 834188
STAR Grants
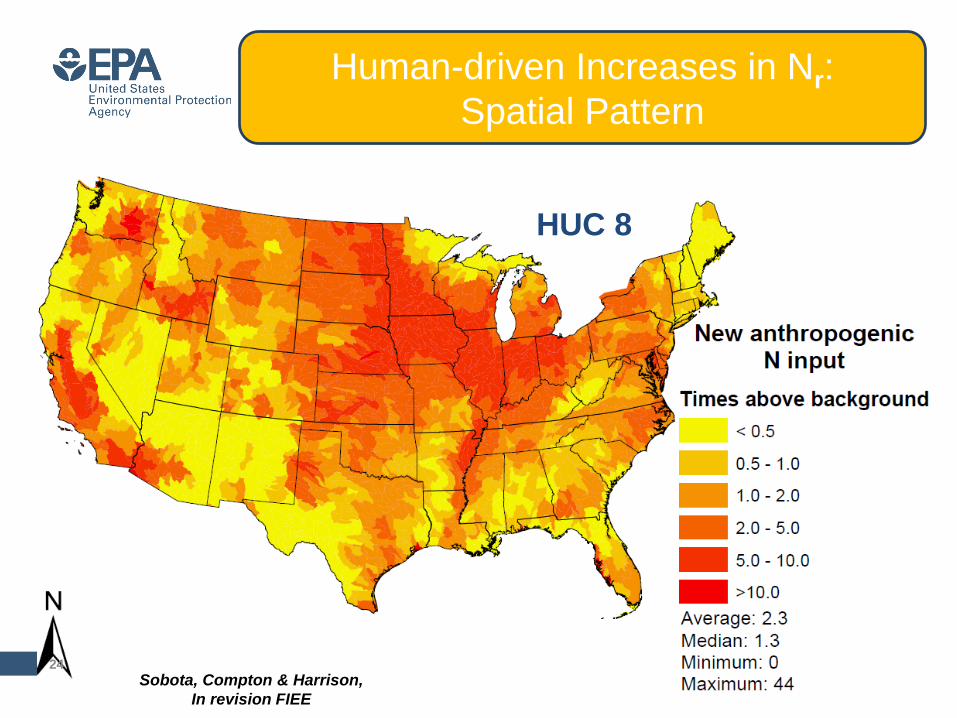
HUC 8
Sobota, Compton & Harrison,
In revision FIEE
24
Human-driven Increases in Nr:
Spatial Pattern
New anthropogenicN input
kg N ha-1
yr-1
0 - 5
5 - 10
10 - 50
50 - 100
>100
Average: 25Median: 14Minimum: <1Maximum: 129
Recycled N input
kg N ha-1
yr-1
0 - 5
5 - 10
10 - 50
50 - 100
>100
Average: 8Median: 5Minimum: <1Maximum: 76
a
b
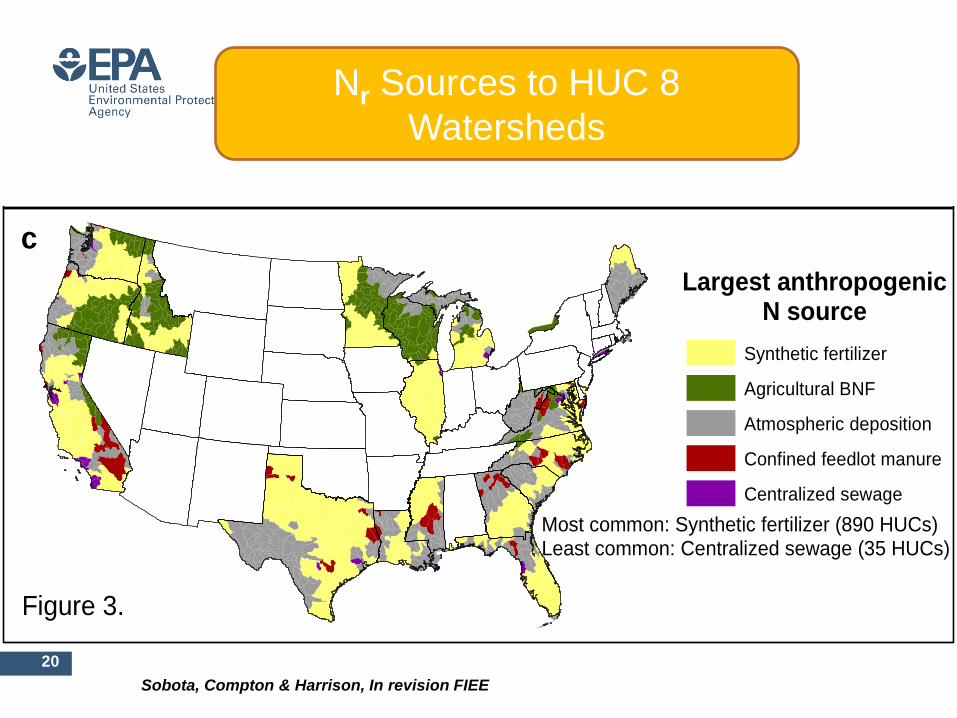
c
Largest anthropogenicN source
Synthetic fertilizer
Agricultural BNF
Atmospheric deposition
Confined feedlot manure
Centralized sewage
Most common: Synthetic fertilizer (890 HUCs)Least common: Centralized sewage (35 HUCs)
±
Figure 3.
Sobota, Compton & Harrison, In revision FIEE
Nr Sources to HUC 8
Watersheds
20
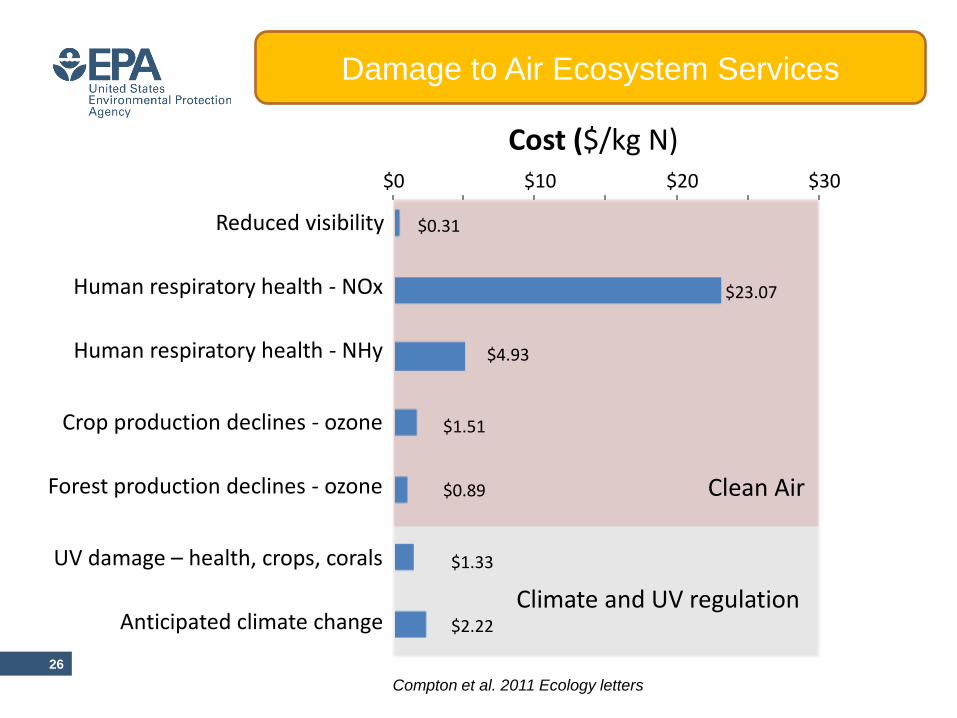
Reduced visibility
Human respiratory health - NOx
Human respiratory health - NHy
Crop production declines - ozone
Forest production declines - ozone
UV damage – health, crops, corals
Anticipated climate change
$0.31
$23.07
$4.93
$1.51
$0.89
$1.33
$2.22
$0 $10 $20 $30
Cost ($/kg N)
Clean Air
Climate and UV regulation
Compton et al. 2011 Ecology letters
26
Damage to Air Ecosystem Services
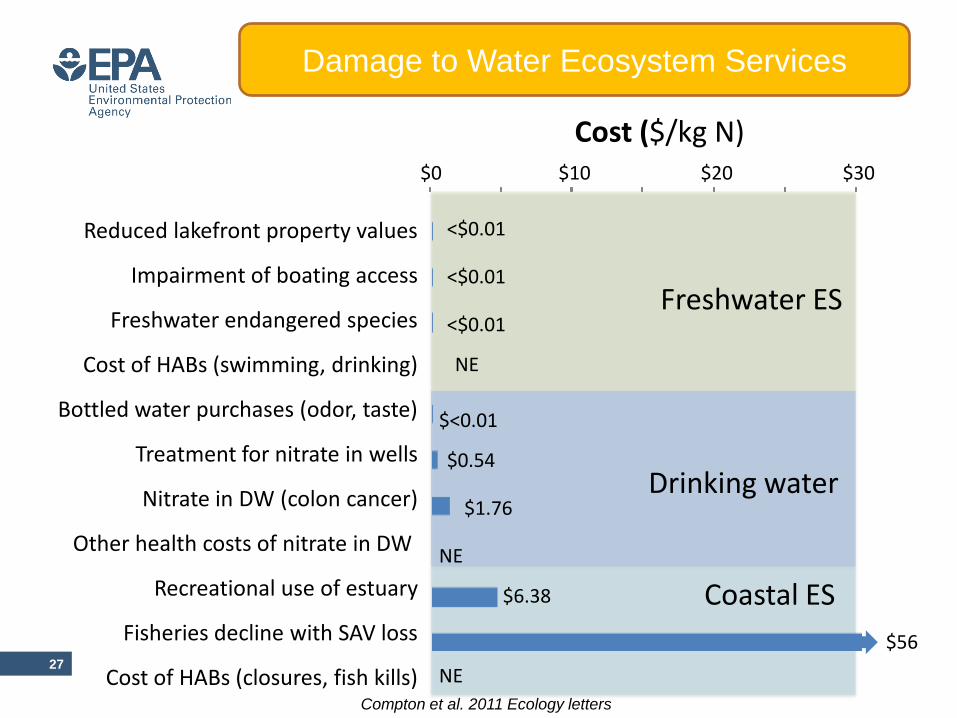
<$0.01
<$0.01
$<0.01
$0.54
$1.76
NE
$6.38
$0 $10 $20 $30
Cost ($/kg N)
<$0.01
NE
$56
Freshwater ES
Drinking water
Coastal ES
NE
Reduced lakefront property values
Impairment of boating access
Freshwater endangered species
Cost of HABs (swimming, drinking)
Bottled water purchases (odor, taste)
Treatment for nitrate in wells
Nitrate in DW (colon cancer)
Other health costs of nitrate in DW
Recreational use of estuary
Fisheries decline with SAV loss
Cost of HABs (closures, fish kills) 27
Damage to Water Ecosystem Services
Compton et al. 2011 Ecology letters

Class Area
(km2)
Mean Nr
load
(g/m2/yr)
Mean
efficiency
Total Nr
removal
(mT/yr)
Estuarine 18,501 17.75 0.333 133,550
Fresh
marsh
105,813 98.65 0.493 4,746,098
Swamp 210,564 8.62 0.627 923,493
Total 406,270 5,803,140
Total removal is ~20% of total anthropogenic load
Jordan et al. Ecosystems 2011
Nitrogen Removal by Major Classes
of Wetlands in the Contiguous US

29
CMAQ
Input
Process
Incorporated
In CMAQ
CMAQ
NH3
Bi-Dir
Flux
EPIC = Environmental Policy Integrated Climate Model
National Scale Fertilizer Application (USDA EPIC)
Coupled to NH3 Bi-directional Air-Surface Exchange
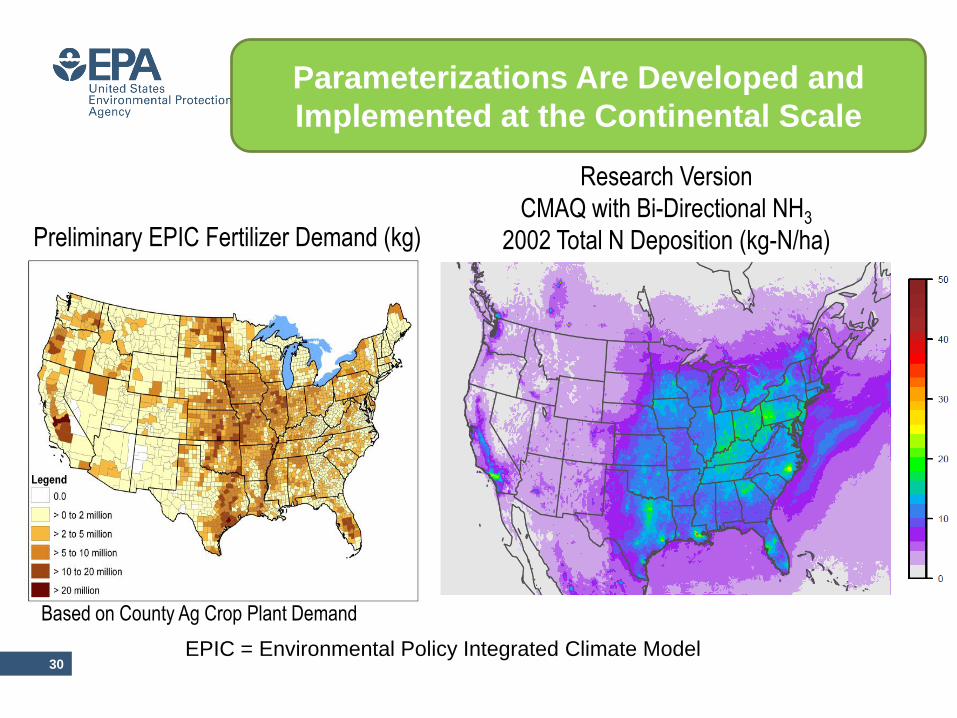
30
Preliminary EPIC Fertilizer Demand (kg)
Based on County Ag Crop Plant Demand
Research Version
CMAQ with Bi-Directional NH3
2002 Total N Deposition (kg-N/ha)
EPIC = Environmental Policy Integrated Climate Model
Parameterizations Are Developed and
Implemented at the Continental Scale
31
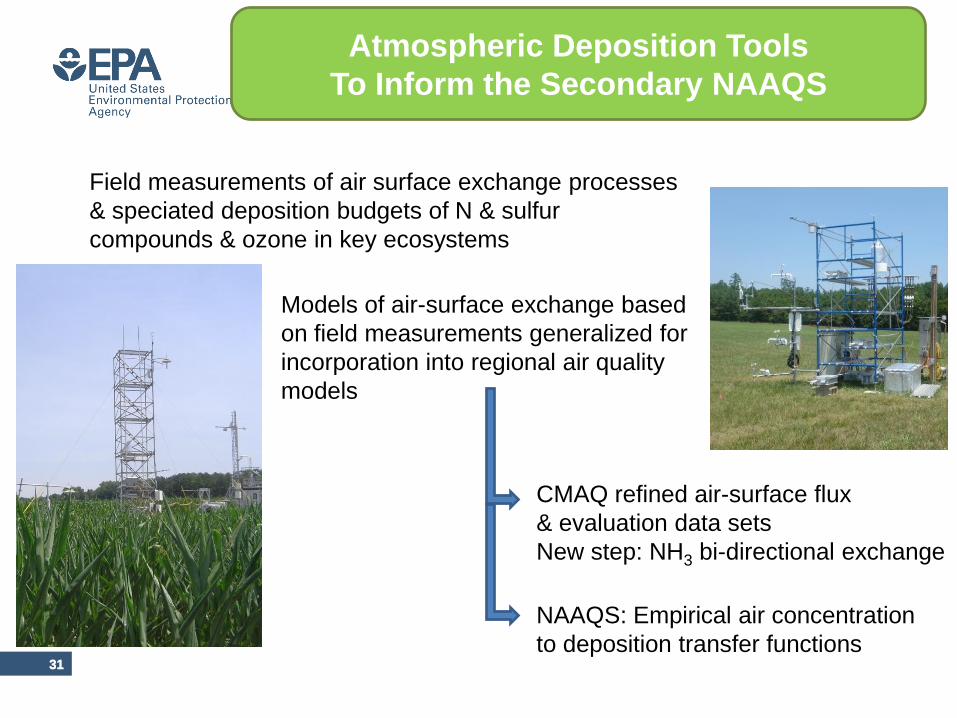
Atmospheric Deposition Tools
To Inform the Secondary NAAQS
31
CMAQ refined air-surface flux
& evaluation data sets
New step: NH3 bi-directional exchange
NAAQS: Empirical air concentration
to deposition transfer functions
Field measurements of air surface exchange processes
& speciated deposition budgets of N & sulfur
compounds & ozone in key ecosystems
Models of air-surface exchange based
on field measurements generalized for
incorporation into regional air quality
models
32
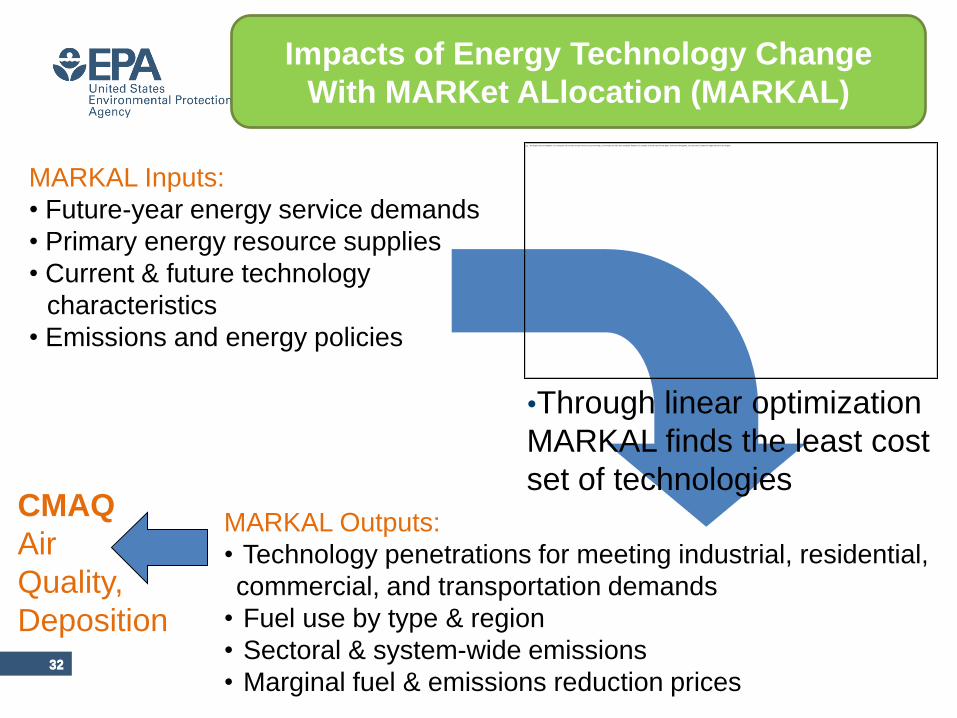
Impacts of Energy Technology Change
With MARKet ALlocation (MARKAL)
MARKAL Outputs:
• Technology penetrations for meeting industrial, residential,
commercial, and transportation demands
• Fuel use by type & region
• Sectoral & system-wide emissions
• Marginal fuel & emissions reduction prices
32
MARKAL Inputs:
• Future-year energy service demands
• Primary energy resource supplies
• Current & future technology
characteristics
• Emissions and energy policies
•Through linear optimization
MARKAL finds the least cost
set of technologies CMAQ
Air
Quality,
Deposition

• Development of Integrated Science
Assessments (ISA) for ecological and
human health effects of NOx.
– The ecological assessment includes review
and synthesis of published peer-reviewed
literature of the effects of N deposition on all
US ecosystems.
– These assessments provide scientific
support for the review of the primary (health
effects) and secondary (welfare effects)
National Ambient Air Quality Standards for
NOx
• Integrated Risk Information System
(IRIS) assessment of the human
health effects of Ammonia
33
Assessment