cross-cultural preferences in spatial reasoning
TRANSCRIPT

© Koninklijke Brill NV, Leiden, 2011 DOI: 10.1163/156853711X568662
Journal of Cognition and Culture 11 (2011) 1–21 brill.nl/jocc
Cross-Cultural Preferences in Spatial Reasoning
Markus Knauff a,* and Marco Ragnib
a Department of Psychology, University of Gießen, Otto-Behaghel-Strasse 10F, D-35394 Gießen, Germany
b Center for Cognitive Science, University of Freiburg, Freiburg, Germany* Corresponding author, e-mail: [email protected]
AbstractHow do people reason about spatial relations? Do people with different cultural backgrounds differ in how they reason about space? The aim of our cross-cultural study on spatial reasoning is to strengthen this link between spatial cognition and culture. We conducted two reasoning experiments, one in Germany and one in Mongolia. Topological relations, such as “A overlaps B” or “B lies within C”, were presented to the participants as premises and they had to find a conclusion that was consistent with the premises (“What is the relation between A and C?”). The problem description allowed multiple possible “conclusions”. Our results, however, indicate that the participants had strong preferences: They consistently preferred one of the possible conclusions and neglected other conclusions, although they were also logically consistent with the premises. The preferred and neglected conclusions were similar in Germany and Mongolia. We argue that the preferences are caused by universal cognitive principles that work the same way in the western culture and Mongolia.
KeywordsSpatial cognition, cross-cultural similarities, preferred mental models, Mongolia
Imagine the following conversation between two friends:
A says: “My bag is in your car.”B says: “My car is in my garage.”
It is easily inferable from these two statements that A’s bag must be in B’s garage. Now imagine the following conversation:
A says: “The green car is between the red car and the blue car.”B says: “The green car is beside the red car.”
What do you infer from these two statements? In fact, the cars can be in two different arrangements:

2 M. Knauff, M. Ragni / Journal of Cognition and Culture 11 (2011) 1–21
RED GREEN BLUE or BLUE GREEN RED
Now imagine that the two friends are talking about colored regions on a map. The colors might represent countries but, like in many atlases, they also can symbolize geological, topological, economical, or political information.
A says: “The green region is inside the red region.”B says: “The blue region overlaps the red region.”
What can be inferred from these two statements? There are, from a topological perspective, five possibilities how the three areas can be located on the map (cf., Fig. 1).
All three problems are typical examples of everyday life. In fact, we fre-quently use such spatial expressions that describe the topological relations between regions or solid objects, but we do not communicate metrical infor-mation such as the distances between regions or even the ordering of objects. We use the term “beside” but do not specify whether we want to indicate that the object is to the left or to the right of the other object. The second and third example problem (with the cars in a line and the regions on a map) demonstrate that this has important consequences. The given information
Figure 1. All possible models for the premises “The green region is inside the red region” and “The blue region overlaps the red region”. This figure is published in colour in the online edition of this journal, which can be accessed
via http://www.brill.nl/jocc
DC
POTPP
NTPP
EC
M. Knauff, M. Ragni / Journal of Cognition and Culture 11 (2011) 1–21 3
is indeterminate and we can imagine more than one situation consistent with the given information. The present paper is concerned with such problems! Can we take into account all possible spatial situations that are in agreement with the given information (e.g., all five arrangements in Fig. 1)? Or do we focus on a subset of possibilities and ignore others? Do people with different cultural backgrounds solve such problems similarly? Do they prefer and neglect the same possibilities? Are the differences depending from the cultural background?
In an interesting paper in this journal Høgh-Olesen (2006) described some remarkable findings on the spatial behaviour of six cross-cultural samples. In our paper we are more specific concerning the investigated spatial abilities and we also explored just two samples with different cultural backgrounds. How-ever, the intention is also to find possible universalisms that work the same way in different cultures. A second motivation is that reasoning about topo-logical relations is an important issue in spatial cognition research (Mark and Egenhofer, 1994; Knauff et al., 1997; Li, 2006), but only very little cognitive research has been done on possible cross-cultural similarities in human topo-logical reasoning. The aim of this paper is to strengthen this link between spatial cognition and culture.
Theoretically our research is motivated by two main research questions: First, we were interested in how individuals deal with problems for which the combination of two spatial relations results in more than one possible relation as conclusion. Knauff and colleagues were able to show in another domain (reasoning with ordering information) that whenever a composition (the tech-nical term for the combinations of relations) has multiple relations, human reasoners consistently prefer to infer only one of the relations and ignore others (Knauff et al., 1995, 1999; Knauff, 1999; Rauh et al., 2005; Ragni et al., 2005, 2006). In the present paper, we sought to explore whether such preferences also hold in reasoning about topological relations.
The second reason for our study was that we wanted to explore whether the way humans reason about topological relations depends on their cultural background. In general, there are two main theories on the connection between thinking and culture. Proponents of one theory have claimed that thinking in general is highly culturally determined. One reason might be that different geographical, cultural and social environments foster different thinking styles (Berry, 1976, 1997; Berry et al., 1997; Jahn et al., 2007). Another view is that thinking is inextricably linked to “language” and that people with different languages would also think differently (Levinson et al., 2002; Levinson and Meira, 2003).
The other theory postulates that some universal principles result in similar reasoning styles no matter which cultural background the individuals have.

4 M. Knauff, M. Ragni / Journal of Cognition and Culture 11 (2011) 1–21
For this approach, how we reason about space is an immediate result of the structure of our neuro-cognitive system (Knauff et al., 2003; Fangmeier et al., 2006; Knauff, 2007, 2009a,b). The cognitive processes rely on very elemen-tary functions of working memory and reasoning, and these are almost encap-sulated processes that are quite unaffected by cultural aspects (but see in specific cases Chan and Bergen, 2005; Spalek and Hammad, 2005).
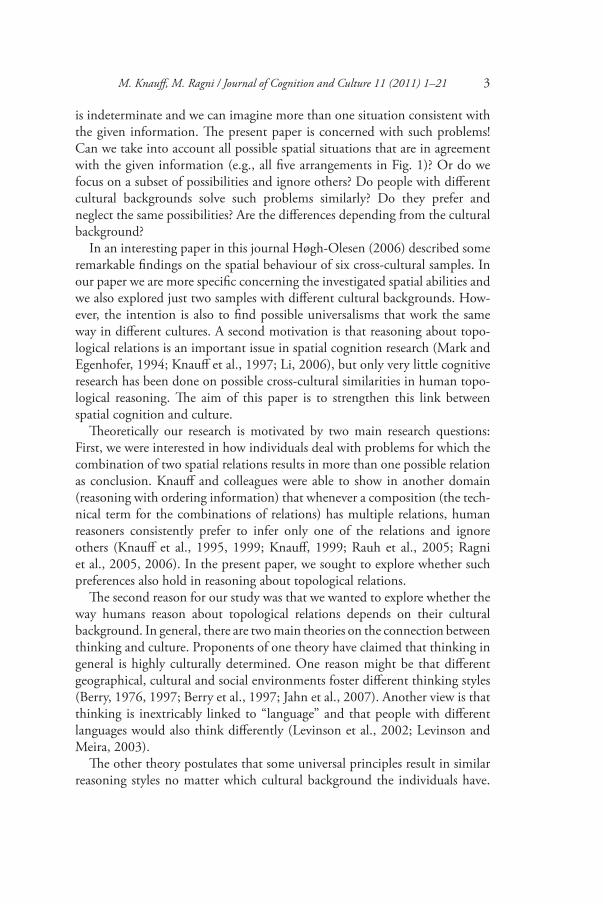
For our study it was necessary to be very clear which topological relations can hold between two objects or regions. Here an approach from computer science in the field of spatial cognition research was very helpful. As the basis of our research we use the RCC-8 system, which was developed by Randell et al. (1992b); see, e.g., also Egenhofer and Franzosa (1991). The technical details are not relevant in the present context. Important is just that, according to RCC-8, two regions can be in eight different topological relations (see Fig. 2). They can be disconnected (DC), i.e., both regions have no common point, two regions can be externally connected (EC), i.e., they have common points on the border, or two regions can partially overlap (PO), i.e., both regions share a proper subregion. Other possibilities are that the first region can be part of the second and the two borders touch each other we get tangentially proper part (TPP) or the first region can contain the second region (TPPI). If
Figure 2. Two-dimensional examples for the eight basic relations of RCC-8.
XDCY
XX X X
Y
Y
Y
Y
Y Y
YX
X X
X PO Y X EQ Y X NTPP Y X NTPPI Y
XECY X TPP Y X TPPI Y

M. Knauff, M. Ragni / Journal of Cognition and Culture 11 (2011) 1–21 5
one region contains the other and the borders do not touch, we get the non-tangentially proper part (NTTP) and the inverse relation (NTTPI). Finally, two regions can be equal (EQ). It is easy to show that by taking two regions in a two- or three-dimensional Euclidean space, the relation between these two regions can be expressed exactly by one of these eight base relations.
In the two experiments discussed here we used the RCC relations to con-struct a type of reasoning problems that is referred to as three-term-series-problems (3ts-problems) in cognitive research (e.g., Hunter, 1957; Johnson-Laird, 1972). In these tasks always two statements are used as premises and the task of the participants is to generate a statement that is consistent with the prem-ises – the conclusion.
Take for instance,
A overlaps B.B overlaps C.
Which relation can hold between A and C?
The set of all possible relations that has X r1 Y, Y r2 Z as its premise are denoted by the composition c(r1, r2). This is normally presented as a composition table (cf., Table 1).
For the above example the composition c(PO, PO) contains the following four relations: DC, PO, EQ, EC (cf., Fig. 2) Since RCC-8 consists of eight base relations, there are 64 possible compositions of two base relations. In other words, exactly 64 different three-term-series problems exist. If we omit all one-relation cases (cells in Table 1), it results in 37 multiple relation cases (shown in Table 1) out of the 64 possible compositions. The participants of our studies were confronted with these 37 problems and had to infer a relation (“conclusion”) about the first and the third region. Because we were interested in preferences, we only used the compositions with more than one relation and also dropped the (trivial) compositions that contained “equal” relations.
Experiment 1: Germany
Participants
We tested 20 undergraduate students from the University of Freiburg. They received course credits for their participation. Half of them were female and half were male; the youngest was 20 the oldest 35 years old. They were all native speakers of German.

6 M. Knauff, M. Ragni / Journal of Cognition and Culture 11 (2011) 1–21
Methods, Materials and Procedure
The experiment used the set of RCC-relations presented in Table 1. An unequivocal verbal description was developed for all these relations. The verbal translations were based on our experiences in earlier studies (Knauff et al., 1997). However, to make sure that the obtained data could be clearly related to the involved inference processes, a detailed “definition phase” had to be conducted by all participants prior to the main part of the experiment. In this definition phase the participants saw pictorial examples of the spatial rela-tions and also received a detailed verbal description of the “semantic” of each of the eight relations.
In the main part of the experiment all participants had to solve the same set of 37 3ts-problems. These were presented to each participant in a randomized order. Here is an example-problem:
Table 1The formal composition table
DC EC PO EQ TPP TPPI NTPP NTPPI
DC * DC, EC, PO, TPP, NTPP
DC, EC, PO, TPP, NTPP
DC DC, EC, PO, TPP, NTPP
DC DC, EC, PO, TPP, NTPP
DC
EC DC, EC, PO, TPPI, NTPPI
DC, EC, PO, TPP, TPPI, EQ
DC, EC, PO, TPP, NTPP
EC EC, PO, TPP, NTPP
DC, EC PO, TPP, NTPP
DC
PO DC, EC, PO, TPPI, NTPPI
DC, EC, PO, TPPI, NTPPI
* PO PO, TPP, NTPP
DC, EC, PO, TPPI, NTPPI
PO, TPP, NTPP
DC, EC, PO, TPPI, NTPPI
EQ DC EC PO EQ TPP TPPI NTPP NTPPITPP DC DC, EC DC, EC,
PO, TPP, NTPP
TPP TPP, NTPP
DC, EC, PO, TPP, TPPI, EQ
NTPP DC, EC, PO, TPPI, NTPPI
TPPI DC, EC, PO, TPPI, NTPPI
EC, PO, TPPI, NTPPI
PO, TPPI, NTPPI
TPPI PO, EQ, TPP, TPPI
TPPI, NTPPI
PO, TPP, NTPP
NTPPI
NTPP DC DC DC, EC, PO, TPP, NTPP
NTPP NTPP DC, EC, PO, TPP, NTPP
NTPP *
NTPPI DC, EC, PO, TPPI, NTPPI
PO, TPPI, NTPPI
PO, TPPI, NTPPI
NTPPI PO, TPPI, NTPPI
NTPPI PO, TPPI, TPP, EQ, NTPP, NTPPI
NTPPI
An asterisk (*) stands for the union of all relations. Taken from Randell et al. (1992a).

M. Knauff, M. Ragni / Journal of Cognition and Culture 11 (2011) 1–21 7
The blue circle is within the green circle.The green circle overlaps the red circle.Which relation does hold between the blue and the red circle?
From the 8 × 8 possible models we only used the 37 problems for which the composition consists of more than one relation and in which the equal rela-tion does not appear. The experiment was conducted as a group experiment, in which all participants sat in a lecture room and received the experimental materials on an experimental block. Each problem was presented on two pages. On the first page, the two premises were presented as centred sentences. On the second page, the participants were asked for the conclusion. They had to write into a gap between the two phrases “The blue circle . . . the red circle”. During the entire experiment a second paper was available on which they could check the exact wording of the verbal relations. The participants were not allowed to turn back the pages and they were also asked not to draw sketches or to use anything else that could help to externally solve the prob-lem. The complete inference had to be performed mentally.
Results and Discussion
Overall, 93% of the problems were correctly solved. The results regarding the preference effects are reported in Fig. 3 and Table 2. As shown in Table 2, out of the given 37 problems exactly 27 problems (73%) were solved with a clear preference for one relation. However, it is remarkable that several relations could have been chosen as a possible conclusion, but, in fact, the participants chose just one of them and their preferences also often corresponded. Table 2 shows the preferences for each of the compositions separately. In each cell, the first relation (in boldface) is the preferred relation. The percentages in the line below show the relative frequency of this relation, i.e., how often it was chosen by the participants. The first value is the mean of the two experiments reported here (Germany and Mongolia), the second refers to the present experiment (in German), and the third value refers to the second experiment in Mongolia (reported below). An inspection of the percentages for the present experiment shows how strong the preference effect is. The most impressive result can be observed for the DC-EC-problem, where 18 of the participants (90%) chose the DC relation as the conclusion, while only one participant used the rela-tions EC and PO, respectively (5% each), and no one chose the NTTP rela-tion (0%). Most of the results in the table are so pronounced that we do not need to report the statistical tests. It is clearly detectable that the probability to obtain these preferences purely by chance is between 0.34 (for cells with three relations) and 0.14 (for cells with all seven relations).

8 M. Knauff, M. Ragni / Journal of Cognition and Culture 11 (2011) 1–21
Figure 3. The overall preference effect for both experiments. The figure shows that in about 68% of the cases participants had a clear preference for a relation.
70
60
50
40
30
20
10
preference no preference
0
The reasoners chose sometimes a relation that is inconsistent with the prem-ises. These “errors” are the shaded values in Table 2. However, there were small differences between the tasks. For instance, if participants had to deal with inside, which is TPP, NTPP or the converse, then errors appeared. Conversely, if participants had to deal with the relations DC, EC or PO, no errors appeared. Our results indicate, first that humans perform well in solving topological reasoning problems based on the RCC-relations. The second finding is that there are strong preferences.
There is an unequivocal cognitive preference for DC, EC and PO. From 27 tasks DC had been generated 17 times as an answer, PO was inferred five times, NTPP and NTPPI two times and EQ once. There is obviously a clear difference between the relation DC and PO, which even holds in those cases where these relations are not logically valid, e.g., the composition EC and TPP. While some relations are inferred by most participants, other relations are generated very rarely or even completely neglected, like the relations TPP and NTTP. By analyzing (cf., Table 3) the chosen relations with respect to all consistent relations, the pattern can be described in the following way: If the relation DC is consistent, then it is chosen first, if not, then the relation EC. If there are compositions of TPP and TPPI or NTPP and NTPPI then par-ticipants choose EQ.
How can these findings be explained? The preferred relations of the experi-ment reveal that for humans it is easier to represent and reason with objects ‘distinct’ or ‘identical’ than objects ‘overlapping’ or ‘contained in’. The reason might be that if two objects are disjoint (or identical), the number of regions is smaller than when two regions share common subregions. For example, if

M. Knauff, M. Ragni / Journal of Cognition and Culture 11 (2011) 1–21 9Ta
ble 2
The “
cogn
itive
” co
mpo
sitio
n ta
ble
DC
EC
PO
TP
PT
PP
IN
TP
PN
TP
PI
DC
DC
(75%
, 80%
,
70%
)
DC
(87.5
%, 90%
,
85%
)
DC
(85%
, 80%
,
90%
)
DC
(80%
, 75%
,
85%
)
DC
(65%
, 60%
, 7
0%
)
EC
(7.5
%, 10%
,
5%
)
EC
(5%
, 5%
, 5%
)P
O (
10%
, 15%
,
5%
)
PO
(12.5
%, 15%
,
10%
)
PO
(17.5
%, 25%
, 0%
)
EQ
(7.5
%, 5%
,
10%
)
PO
(5%
, 5%
, 5%
)E
C (
5%
, 5%
, 5%
)E
C (
7.5
%, 10%
,
5%
)
EC
(12.5
%, 15%
,
10%
)
PO
(7.5
%, 5%
,
10%
)
NT
TP
(2.5
%, –,
5%
)
NT
PP
(2.5
%, –, 5%
)
NT
TP
I
(2.5
%, –, 5%
)
TP
PI
(2.5
%, –,
5%
)
EC
DC
(8
5%
, 80%
, 90%
)
DC
(70%
, 70%
,
70%
)
DC
(80%
, 85%
,
75%
)
EC (5
2.5
%, 30%
,
75%
)
DC
(62.5
%, 70%
,
55%
)
PO
(60%
, 60%
,
60%
)
EC
(7.5
%, 10%
,
5%
)
EC
(22.5
%, 20%
,
25%
)
PO
(12.5
%, 5%
,
20%
)
NT
PP
(17.5
%,
30%
, 5%
)
EC
(32.5
%, 25%
,
40%
)
NT
PP
(12.5
%,
20%
, 5%
)
PO
(5%
, 5%
, 5%
)E
Q (
5%
, 10%
, –)
EC
(5%
, 10%
, –)
TP
P (
12.5
%, 15%
,
10%
)
EQ
(2.5
%, 5%
, –)
EC
(12.5
%, 5%
,
20%
)
NT
TP
I
(2.5
%, 5%
, –)
NT
TP
(2.5
%,
–, 5%
)
NT
PP
(2.5
%, –,5
%)
PO
(2.5
%, 5%
, –)
TP
P (
2.5%
, –, 5
%)
TP
P (
2.5%
, –, 5
%)
DC
(7.5
%, 5%
, 10%
)
EC
(12.5
%, 5%
, 2
0%
)
NT
PP
I
(2.5
%, 5%
, –)
DC
(12.5
%, 10%
, 5%
)
PO
DC
(70%
, 65%
,
80%
)
DC
(77.5
%, 90%
,
65%
)
DC
(70%
, 65%
,
75%
)
PO
(40%
, 35%
,
45%
)
DC
(30%
, 30%
, 30%
)
PO
(45%
, 40%
,
50%
)
DC
(40%
, 55%
,
25%
)
EC
(10%
, 10%
,
10%
)
PO
(12.5
%, 5%
,
20%
)
PO
(17.5
%, 25%
,
10%
)
NT
PP
(30%
, 50%
,
10%
)
PO
(30%
, 35%
, 25%
)
NT
PP
(30%
, 35%
,
25%
)
EC
(30%
, 25%
,
35%
)

10 M. Knauff, M. Ragni / Journal of Cognition and Culture 11 (2011) 1–21D
CE
CP
OT
PP
TP
PI
NT
PP
NT
PP
I
PO
(5%
, 10%
, –)
EC
(5%
, 5%
, 5%
)E
C (
7.5
%, –,
15%
)
TP
P
(2.5
%, –, 5%
)
EC
(25%
, 25%
, 25%
)
TP
P (
5%
, 10%
,–)
PO
(27.5
%,
15%
, 40%
)
TP
P (
5%
, –, 10%
)N
TT
PI
(2.5
%, –, 5%
)
EQ
(5%
, 10%
, –)
DC
(17.5
%, 5%
, 30%
)
NT
PP
I
(5%
, 5%
, 5%
)
DC
(10%
,
5%
, 15%
)
TP
PI
(2.5
%, 5%
,–)
TP
P
(2.5
%, –, 5%
)
EC
(7.5
%, 5%
, 10%
)
TP
PI
(2.5
%, –
, 5%
)
NT
TP
I
(2.5
%, 5%
, –)
NT
PP
I
(2.5
%, 5%
, –)
EQ
(7.5
%, 5%
, 10%
)
TP
PI
(2.5
%, 5
%, –
)
EC
(2.5
%, –, 5%
)
EQ
(2.5
%, –,
5%
)
TP
PD
C (
67.5
%, 75%
,
60%
)
DC
(35%
, 50%
,
20%
)
NT
PP
(45%
,
55%
, 35%
)
EQ (4
0%
, 35%
,
45%
)
PO
(4
5%
, 60%
, 3
0%
)
EC
(30%
, 20%
,
40%
)
PO
(32.5
%, 25%
,
40%
)
TP
P (
25%
, 25%
,
25%
)
PO
(25%
, 20%
,
30%
)
DC
(22.5
%, 20%
,
25%
)
PO
(2.5
%, 5%
, –)
NT
PP
(10%
, –, 20%
)
DC
(17.5
%, 10%
,
25%
)
DC
(17.5
%, 30%
, 5%
)
NT
PP
I (1
0%
,
10%
, 10%
)
EC
(12.5
%, 10%
,
15%
)
NT
PP
I (1
0%
,
10%
, 10%
)
EC
(7.5
%, 10%
, 5%
)
EC
(2.5
%, –, 5%
)
TP
P
(2.5
%, 5%
, –)
EC
(2.5
%, –, 5%
)T
PP
I
(2.5
%, –, 5%
)
EQ
(10%
, 5%
,
15%
)
NT
PP
I
(12.5
%, 10%
, 5%
)
NT
PP
I
(7.5
%, 5%
, 10%
)
TP
P (
7.5
%, 5%
,
10%
)
NT
PP
(2.5
%, –, 5%
)
Tabl
e 2 (c
ont.)

M. Knauff, M. Ragni / Journal of Cognition and Culture 11 (2011) 1–21 11Ta
ble 2
(con
t.)
DC
EC
PO
TP
PT
PP
IN
TP
PN
TP
PI
TP
PI
DC
(80%
, 75%
,
85%
)
EC (4
7.5
%, 35%
,
60%
)
PO
(52.5
%, 30%
,
75%
)
EQ (
47.5
%, 60%
,
35%
)
NT
PPI
(37.5
%,
55%
, 20%
)
PO
(4
7.5
%, 55%
, 0%
)
PO
(7.5
%, 10%
,
5%
)
NT
PP
I (2
0%
,
30%
, 10%
)
TP
PI
(10%
, 15%
,
5%
)
PO
(20%
, 20%
,
20%
)
TP
PI
(15%
,
10%
, 20%
)
NT
PP
(15%
, 30%
, –
)
NT
TP
I (5
%, 5%
,
5%
)
PO
(20%
, 25%
,
15%
)
NT
PP
(5%
, 5%
,
5%
)
TP
PI
(2.5
%, –
, 5%
)T
PP
(5%
, 5%
, 5%
)
EQ
(15%
, –, 3
0%
)
EC
(5%
, 5%
, 5%
)T
PP
I (5
%, 5%
,
5%
)
NT
PP
I
(27.5
%, 45%
,
10%
)
TP
P (
5%
, 5%
, 5%
)N
TP
P
(5%
, 10%
, –)
DC
(10%
, 5%
,
15%
)
TP
PI
(2.5
%,
5%
, –)
DC
(7.5
%, 5%
,
10%
)
EC
(5%
, 5%
, 5%
)D
C (
12.5
%, 5%
,
20%
)
PO
(2.5
%, 5%
, –)
EC
(5%
, –, 10%
)
NT
PP
I (7
.5%
,
5%
, 10%
)
EC (1
5%
, –, 30%
)N
TP
PI
(5%
, 5%
, 5%
)
EC
(2.5
%, –, 5%
)D
C (
20%
, 15%
,
25%
)
TP
PI
(2.5
%, 5%
, –)
N
TP
P (
2.5
%,
5%
, –)
NT
PP
DC
(30%
, 20%
,
40%
)
PO
(55%
, 60%
,
50%
)
PO
(30%
, 40%
,
20%
)
EC
(30%
, 40%
,
20%
)
DC
(20%
, 15%
,
25%
)
EQ
(27.5
%, 15%
,
40%
)
PO
(22.5
%, 15%
,
30%
)
NT
PP
(7.5
%,
10%
, 5%
)
DC
(22.5
%, 25%
,
20%
)
NT
PP
(7.5
%, 10%
, 5%
)
EC
(5%
, –, 10%
)N
TP
PI
(12.5
%,
10%
, 15%
)
TP
P
(2.5
%, 5%
, –)
NT
PP
I (7
.5%
,
10%
, 5%
)
NT
PP
(7.5
%,
10%
, 5%
)

12 M. Knauff, M. Ragni / Journal of Cognition and Culture 11 (2011) 1–21
DC
EC
PO
TP
PT
PP
IN
TP
PN
TP
PI
EQ
(5%
, 5%
, 5%
)E
Q (
5%
, 5%
, 5%
)
NT
PP
I
(2.5
%, 5%
, –)
NT
PP
ID
C (5
7.5
%, 50%
,
65%
)
PO
(52.5
%, 55%
,
50%
)
PO
(37.5
%, 25%
,
50%
)
PO
(45%
, 40%
,
30%
)
EQ (4
2.5
%, 4
0%
,
45%
)
EC
(15%
, 10%
,
20%
)
NT
TP
I (2
0%
,
25%
, 15%
)
TP
PI
(7.5
%, 10%
,
5%
)
NT
PP
I (4
0%
,
45%
, 35%
)
NT
PP
I (2
7.5
%,
30%
, 25%
)
NT
PP
I (1
2.5
%,
25%
, –)
DC
(12.5
%, 10%
,
15%
)
DC
(10%
, 5%
, 15%
)E
Q (
5%
, 10%
, –)
PO
(5%
, 10%
, –)
PO
(10%
, 15%
,
5%
)
EC
(10%
, 10%
,
10%
)
TP
P (
5%
, 5%
,
5%
)
DC
(10%
, 5%
,
15%
)
NT
PP
(10%
, 10%
,
10%
)
TP
PI
(5%
, –,
10%
)
TP
P (
5%
, –, 10%
)E
Q (
2.5
%, –, 5%
)E
C (
5%
, –, 10%
)T
PP
(2.5
%, –,
5%
)
NT
PP
I (3
2.5
%,
55%
, 10%
)
NT
PP
(2.5
%, –,
5%
)
DC
(12.5
%, 10%
,
15%
)
TP
P (
2.5
%, –,
5%
)
The
rela
tion
in
bol
dfa
ce i
s th
e p
refe
rred
on
e, w
her
e th
e gr
ey s
had
ed v
alu
es a
re i
nco
rrec
t on
es b
ut
also
ch
osen
by
the
par
tici
pan
ts. Th
e tu
ple
giv
es fi
rst
the
mea
n o
ver
bot
h e
xper
imen
ts, th
e se
con
d t
he
per
cen
tage
of
the
firs
t ex
per
imen
t, a
nd
th
e th
ird
giv
es t
he
per
cen
tage
of
the
seco
nd
exp
erim
ent.
The
entr
ies
are
sort
ed w
ith
resp
ect
to t
he
mea
n v
alu
es.
Tabl
e 2 (c
ont.)

M. Knauff, M. Ragni / Journal of Cognition and Culture 11 (2011) 1–21 13
Tabl
e 3Th
e cho
sen re
latio
ns w
ith re
spec
t to
the s
et o
f con
siste
nt re
latio
ns fo
r the
first
(Ger
man
y) a
nd th
e sec
ond
(Mon
golia
) exp
erim
ent,
with
the p
erce
ntag
es in
par
enth
eses
Set
Rel
atio
n c
hos
en M
ongo
lia
Rel
atio
n c
hos
en G
erm
any
DC
EC
PO
TP
PT
PP
IN
TT
PN
TP
PI
EQ
DC
EC
PO
TP
PT
PP
IN
TP
PN
TP
PI
EQ
All
33 (
55.0
) 4 (
6.7
) 8 (
13.3
) 0 (
0)
0 (
0)
1 (
1.7
) 4 (
6.7
)10 (
16.7
) 34 (
56.7
) 2 (
3.3
) 14 (
23.3
) 0 (
0)
0 (
0)
2
(3.3
) 2 (
3.3
) 6 (
10)
DC
/EC
23 (
57.5
)16
(40.0
) 0 (
0)
1 (
2.5
) 0 (
0)
0 (
0)
0 (
0)
0 (
0)
29 (
72.5
) 9 (
22.5
) 1 (
2.5
) 0 (
0)
0 (
0)
0 (
0)
0 (
0)
1 (
2.5
)
DC
EC
PO
/(N
)TP
P
92 (
58.2
)18
(11.4
) 34 (
21.5
) 0 (
0)
1 (
0.6
) 9 (
5.7
) 2 (
1.3
) 2 (
1.3
) 99 (
61.9
)15 (
9.4
) 33 (
20.6
) 2 (
1.3
) 0 (
0)
4 (
2.5
) 5 (
3.1
) 2 (
1.3
)
DC
EC
PO
TP
P/T
PP
I
EQ
15 (
37.5
) 6
(15)
6 (
15)
0 (
0)
1 (
2.5
) 1 (
2.5
) 2 (
5.0
) 9 (
22.5
) 20 (
50)
6 (
15)
4 (
10)
0 (
0)
0 (
0)
0 (
0)
1 (
2.5
) 9 (
22.5
)
DC
EC
PO
(N)T
PP
I
94 (
58.8
)20
(12.5
) 26 (
16.3
) 5 (
3.1
) 3 (
1.9
) 1 (
0.6
) 6 (
3.8
) 5 (
3.1
) 96 (
60)
18 (
11.3
) 31 (
19.4
) 1 (
0.6
) 2 (
1.3
) 0 (
0)
10 (
6.3
) 2 (
1.3
)
EC
PO
(N)T
PP
2 (
10)
15
(75)
0 (
0)
2 (
10)
0 (
0)
1 (
5.0
) 0 (
0)
0 (
0)
1 (
5.0
) 6 (
30)
3 (
15)
3 (
15)
0 (
0)
6 (
30)
1 (
5)
0 (
0)
EC
PO
(N)T
PP
I
2 (
10)
12
(60)
3 (
15)
0 (
0)
1 (
5.0
) 0 (
0)
2 (
10)
0 (
0)
1 (
5.0
) 7 (
35)
5 (
25)
0 (
0)
1 (
5.0
) 0 (
0)
6 (
30)
0 (
0)
PO
EQ
TP
P/T
PP
I
4 (
20)
1
(5)
4 (
20)
1 (
5)
1 (
5)
0 (
0)
2 (
10)
7 (
35)
1 (
5)
0 (
0)
4 (
20)
1 (
5)
0 (
0)
1 (
5.0
) 1 (
5.0
)12 (
60.0
)
PO
TP
P
NT
PP
15 (
18.8
) 9
(11.3
) 39 (
48.8
) 1 (
1.3
) 0 (
0)
8 (
10)
1 (
1.3
) 7 (
8.8
) 5 (
6.3
) 2 (
2.5
) 38 (
47.5
) 3 (
3.8
) 2 (
2.5
)27 (
33.8
) 3 (
3.8
) 0 (
0)
PO
(N
)TP
PI
9 (
11.3
) 5
(6.3
) 41 (
51.3
) 4 (
5.0
) 2 (
2.5
) 4 (
5.0
)14 (
17.5
) 1 (
1.3
) 4 (
5.0
) 3 (
3.8
) 30 (
37.5
) 1 (
1.3
) 5 (
6.3
) 1 (
1.3
)34 (
42.5
) 2 (
2.5
)
PO
EQ
/(N
)
TP
PI/
(N)T
PP
3 (
15.0
) 0
(0)
0 (
0)
0 (
0)
1 (
5.0
) 2 (
10)
5 (
25)
9 (
45)
2 (
10)
0 (
0)
2 (
10)
0 (
0)
0 (
0)
2 (
10)
6 (
30)
8 (
40)
TP
P N
TP
P 5 (
25)
1 (
5)
0 (
0)
5 (
25)
0 (
0)
7
(35)
2 (
10)
0 (
0)
2 (
10)
0 (
0)
0 (
0)
5 (
25)
0 (
0)
11 (
55)
2 (
10)
0 (
0)
TP
PI
NT
PP
I 5 (
25)
6 (
30)
0 (
0)
1 (
5.0
) 4 (
20)
0
(0)
4 (
20)
0 (
0)
3 (
15)
0 (
0)
1 (
5)
1 (
5)
2 (
10)
2 (
10)
11 (
55)
0 (
0)
Tot
al302 (
40.9
)11
3 (
15.3
)161 (
21.8
)20 (
2.7
)14 (
1.9
)34 (
4.6
)44 (
6.0
)50 (
6.8
)297 (
40.1
)68 (
9.2
)166 (
22.4
)17 (
2.3
)12 (
1.6
)56 (
7.6
)82 (
11.1
)42 (
5.7
)
(N)T
PP
is
an a
bbre
viat
ion
for
th
e d
isju
nct
ion
NT
TP
an
d T
PP.

14 M. Knauff, M. Ragni / Journal of Cognition and Culture 11 (2011) 1–21
two objects A and B overlap then there are three regions to represent: a region A, a region B, and the ‘subregion’ C, where A and B overlap. In this case, sev-eral regions have to be represented mentally, so the load on working memory is increased. But why is DC then preferred over EQ? The reason might lie in the fact, that participants follow the unique names assumption (Russell and Norvig, 2003), i.e., different names indicate different objects. Accordingly, a reasoner has to represent in case of DC that two objects are distant, whereas in the case of EQ that two different objects lie identical. In other words, if two regions are represented separately then it already follows that these two cannot be identical. Conversely, if two regions share the same place then it does not follow logically that both regions are different. Therefore, in the second case additional information has to be processed. So the representation with DC is less complex than the representation with EQ.
Experiment 2: Mongolia
This experiment was conducted in Mongolia. 20 students (9 female and 11 male) of the National University of Mongolia (Ulaanbaatar) participated in the experiment. The youngest was 18 years the oldest 28. All were logically naïve reasoners. They were all native speakers of the Mongolian language.
Methods, Materials and Procedure
The methods and procedures were identical to those in Experiment 1. The only difference was that the material had to be translated into Mongolian. This was done by a student from Mongolia who studied at the University of Freiburg. The translations were double-checked by a second native speaker of Mongolian.
Mongolian is the primary language, i.e., it is spoken by the majority of Mongolian residents, and officially written in the Cyrillic alphabet. It is also spoken in some of the surrounding areas in China and Russia. Structurally, it has a rich number of morphemes enabling the speaker to construct rather complex words from a ‘simple’ root. A detailed description of the morphology, lexicon and syntax can be found in Janhunen (2003).
Results and Discussion
Overall, the performance of the Mongolian participants was poorer than the ones in Germany. Of 740 answers, 109 were incorrect and 631 correct. The mean number of correct conclusions was 85.2%. Again there were slight differences between the tasks. The participants made most mistakes with the relation DC (45 times), followed by EC (18 times) and EQ (15 times).

M. Knauff, M. Ragni / Journal of Cognition and Culture 11 (2011) 1–21 15
Again there were strong preferences. Out of the 37 problems exactly 23 problems (63%) were solved with a clear preference for DC. Here the most impressive result is that for the DC-EC problem, where 18 of the participants (90%) chose the DC relation as conclusion, while only 2 chose another rela-tion. The preferences for each composition separately are given in Table 2. Again, the results are so clear that we do not need to report statistical values.
EQ is always chosen if a relation and its converse appeared. This concurs with the unification principle described by Rauh and colleagues (2005). Here is as well a clear preference for DC, EC and PO. Unlike the first experiment, participants in the second experiment chose EC instead of EQ.
Overall analysis and cross-cultural comparison
The two experiments differed mainly in the groups of participants having dif-ferent cultural backgrounds. Nevertheless, in both experiments we found clear preferences. We did not treat the experiments as a single study with the two different groups of participants as a between-subjects factor, because the experimental setups were not absolutely identical, and a conjoint analysis would result in statistical problems (e.g., inhomogeneity of variance). How-ever, a direct comparison between the two groups can provide additional evi-dence in support of our preference account and, in particular, is directly related to the question whether the way human reason with topological relations depend on the cultural background of the individuals. In the following we therefore report an overall analysis of the two experiments. All together, out of 740 (20 × 37 = 740) answers 55 were incorrect and 685 were correct (error rate of about 7%). The relations that were given most frequently as an answer were: DC, PO, NTPPI and NTTP. Even in those tasks in which DC had not been expected it was given nevertheless as an answer. If one compares the analyses of both experiments, it can be seen that the wrong answers were given within the same tasks. Most subjects had no difficulties with relations like “disconnected”, “touched”, but with relations like TPP, NTPP, NTPPI. In both experiments we have the relations DC, EC and PO. A difference is that Mongolians more often chose relations like EC (see Table 2), whereas German participants did not use this relation often. Likewise, in the second experiment the relation NTPP was chosen only 44 times, while in the first experiment the relation NTTP was chosen 82 times.
General Discussion
We reported two major findings. First, we found that human reasoners do not draw all inferences that are possible from a formal point of view. They only

16 M. Knauff, M. Ragni / Journal of Cognition and Culture 11 (2011) 1–21
choose a subset of compositions from the formal composition table. These preferences seem not to be affected by cultural aspects, since there was no significant difference in the preferences of the different relations by the Mon-golian and German participants. The second finding is that humans prefer those relations which have the smallest overlapping complexity. In the follow-ing we discuss both findings.
There is an impressive similarity between the preferences in Germany and Mongolia. This finding has two theoretical consequences. The first is that our results present serious problems for the idea that the way humans reason with topological relations might depend on the cultural background of the individuals. The German and Mongolian languages are quite dissimilar and the theory of linguistic relativity would have predicted strong differences between the German and Mongolian participants. The same would have been the prediction of accounts that claim that different geographical, cultural, and social environments foster different thinking styles. We did not find such dif-ferences. Instead, we found strong universalities. Our interpretation is that the preferences are an immediate result of the structure of our neuro-cognitive system (Knauff et al., 2003; Fangmeier et al., 2006; Knauff, 2007, 2009 a,b). They rely on very elementary functions of working memory and reasoning and these are almost encapsulated processes that are quite unaffected by cul-tural aspects (but see in specific cases Chan and Bergen, 2005; Spalek and Hammad, 2005; Jahn et al., 2007).
This is related to the second corollary from our study. If the reasoners draw the same inferences they seem to use the same cognitive strategy to solve the problems. We believe that they all construct, inspect and validate preferred mental models. The preferred models account has been developed in our group in the last years (Knauff et al., 1995, 2005; Ragni et al., 2005, 2006). The main assumption is that the major strategy employed in spatial reasoning is the successive construction of a simulation, or model of the “state of affairs”, which contains all the information given in the premises in an integrated representation. New information, such as a reasoning problem’s conclusion, is generated or evaluated by inspecting and varying the possible models (Johnson-Laird and Byrne, 1991). In the domain of reasoning with spatial relations, the theory of mental models has received much empirical support. For example, the process of integrating the second premise into the mental model has been directly demonstrated by an increased demand on processing resources during this stage of problem presentation (Maybery et al., 1986). The preferred models theory describes the reasoning process in three distinct phases (Johnson-Laird and Byrne, 1991). In the construction phase, reasoners construct a mental model that reflects the information from the premises. If

M. Knauff, M. Ragni / Journal of Cognition and Culture 11 (2011) 1–21 17
new information is encountered during the reading of the premises it is imme-diately used in the construction of the model. During the inspection phase, this model is inspected to find new information that is not explicitly given in the premises. Finally, in the variation phase alternative models are searched that refute this putative conclusion. The main difference from the other ver-sions of the mental model theory is that the empirical data do not support the notion that people construct several models. Instead, people only construct one model and then vary this model by a process of local transformation. This model, which is called the preferred mental model (PMM) is easier to con-struct and to maintain in working memory compared to all other possible models (Knauff et al., 1998; Ragni et al., 2006). In the model variation phase this PMM is varied to find alternative interpretations of the premises (e.g., Rauh et al., 2005). In the present context that means that our participants only constructed the preferred model for the problems they were confronted with. As there was no need to find alternative interpretations of the premises – we asked for a possible relation, not a logically necessary one – they stopped as soon as they had constructed the first model that was consistent with the premises. This preferred model is the computationally the cheapest as it is less demanding in terms of processing and in terms of representational costs (see Ragni et al., 2005, 2006). From this model they could “read off ” just one of the formally possible relations and this resulted in the preference for that spe-cific relation or conclusion, respectively. The preferred model leads to a specific relation and this in turn results in the preferred conclusion. In the following we explain why some models (relations) could be preferred over others.
An Approach to Explain the Preferences
The starting point of our account to explain the preferences in reasoning is to set the preferred relations in Table 2 in relation with all consistent relations (Table 3). Whenever the relation DC is consistent, participants (both Mongo-lian and Germans) have preferred this relation (cf., Table 3). Otherwise, they chose the relation EC or EQ. But the latter is chosen only if a relation and its converse is composed (cf., Table 2). Then a cultural difference appears: Mon-golians prefer the relation PO over NTPPI (Fig. 4) and Germans NTPPI over PO (Fig. 5). However, in both samples the sequence of preferred relations (DC, EC) avoids the overlapping of regions (cf., Fig. 4).
It is remarkable that the sequence of relations in both cultures (Figs. 4 and 5) adhere to a principle of “overlapping avoidance”. The reason why EQ is chosen (cf., Table 2) in the case where (N)TPP and (N)TPPI are composed

18 M. Knauff, M. Ragni / Journal of Cognition and Culture 11 (2011) 1–21
Figure 4. Human preferences (Mongolia) in reasoning with RCC-8 relations for Experiment 2 (cf., Table 3). If DC is consistent, then participants prefer this relation, if not, they choose EC or EQ. Both relations are preferred over PO and NTPPI. There are 5 cases not consistent with this preferences namely
the cells corresponding to EC;NTPP, and (N)TPP;(N)TPPI.
Figure 5. Human preferences (Germany) in reasoning with RCC-8 relations for Experiment 2 (cf., Table 3). If DC is consistent, then participants tend to use this relation, if not, they choose EC or EQ. Both relations are preferred over NTPPI and PO. In contrast to Fig. 4 the sequence of PO and NTPPI
is reversed.
X
X
Y
Y
Y
Y
Y
X
XX
DC
EQ
EC
PO NTPPI
X
X
Y
Y
Y
Y
Y
X
XX
DC
EQ
EC
PONTPPI

M. Knauff, M. Ragni / Journal of Cognition and Culture 11 (2011) 1–21 19
can be easily explained by the so-called unification principle (Rauh et al., 2005). This principle claims that if participants compose a relation and its converse then they generally tend to choose the equal relation. Since TPP and NTTP are very similar this unification principle is applied for both rela-tions together.
It seems to be the case that representations of separated regions are preferred over those representations where regions share a common subregion. We think that is a cross-cultural and universal principle that might go back to the fact that the mental representation and chunking is easier in the first case, since only two separate regions have to be stored and not three kinds of regions, both original regions and a common subregion.
Conclusion
The aim of our study was to strengthen the link between spatial cognition and culture. We conducted two reasoning experiments, one in Germany and one in Mongolia, in which the participants had to reason with topological rela-tions such as “A overlaps B”, “B lies within C”. Our results indicate that the participants had strong preferences and that the preferred and neglected con-clusions were similar in Germany and Mongolia. We believe that these prefer-ences are caused by universal cognition principles that work the same way in the western culture and Mongolia. In some cases, there might be cultural differences in the way how people reason about space (Levinson et al., 2002; Levinson and Meira, 2003). However, our preferences seem to be very ele-mentary and universal. Our results show that people from different parts of the world have similar preferences whenever they are confronted with spatial reasoning problems for which more than one solution exists. In the future, we will test this hypothesis with samples from other countries and continents.
Acknowledgements
We thank Bolormaa Tseden for running the experiment in Mongolia. She was our student at the time of our study. The authors would like to thank Bernhard Nebel, Stefan Wölfl and Andreas Bittner for comments, suggestions and proof-reading of an earlier version of this paper.

20 M. Knauff, M. Ragni / Journal of Cognition and Culture 11 (2011) 1–21
References
Allen, J. F. (1983). Maintaining knowledge about temporal intervals. Communications of the ACM 26, 832-843.
Berry, J. W. (1976). Human ecology and cognitive style: Comparative studies in cultural and psycho-logical adaptation. Sage/Halstead/Wiley, New York, NY.
——. (1993). An ecological approach to understanding cognition across cultures. In Altarriba, J. (Ed.), Cognition and culture: A cross-cultural approach to cognitive psychology, pp. 361-375. North-Holland, Amsterdam.
Berry, J. W., Saraswathi, T. S. and Dasen, P. R. (Eds.) (1997). Handbook of cross-cultural Psychol-ogy, Vol. II: Basic processes and human development. Allyn and Bacon, Boston, MA.
Byrne, R. M. J. and Johnson-Laird, P. N. (1989). Spatial reasoning. Journal of Memory and Lan-guage 28, 564-575.
Chan, T. T. and Bergen, B. (2005). Writing direction influences spatial cognition. In Bara, B., Barsalou, L. W. and Bucciarelli, M. (Eds), Proceedings of the 27th Annual Conference of the Cognitive Science Society, pp. 412-417. Lawrence Erlbaum, Mahwah, NJ.
Cohn, A. G. (1997). Qualitative spatial representation and reasoning techniques. In Brewka, G., Habel, C. and Nebel, B. (Eds), KI-97: Advances in Artificial Intelligence, pp. 1-30. Springer, Berlin.
Egenhofer, M. J. (1991). Reasoning about binary topological relations. In Günther, O. and Schek, H. J. (Eds), Proceedings of the Second Symposium on Large Scaled Spatial Databases, pp. 143-160. Springer, Berlin.
Egenhofer, M. J. and Franzosa, R. (1991). Point-set topological spatial relations. International Journal of Geographical Information Systems 5, 133-152.
Egenhofer, M. J., Clementini, E. and Di Felice, P. (1994). Topological relations between regions with holes. International Journal of Geographical Information Systems 8, 129-144.
Fangmeier, T., Knauff, M., Ruff, C. C. and Sloutsky, V. (2006). FMRI evidence for a three-stage model of deductive reasoning. Journal of Cognitive Neuroscience 18, 320-334.
Høgh-Olesen, H. (2008). Human Spatial Behaviour: The Spacing of People, Objects and Ani-mals in Six Cross-Cultural Samples. Journal of Cognition and Culture 8, 245-280.
Hunter, I. M. L. (1957). The solving of three-term series problems. British Journal of Psychology 48, 286-298.
Jahn, G., Knauff, M. and Johnson-Laird, P. N. (2007). Preferred Mental Models in Linear Rea-soning. Memory and Cognition 35, 2075-2087.
Janhunen, J. (Ed.) (2003): The Mongolic languages. Routledge, London. Johnson-Laird, P. N. (1972). The three-term series problem. Cognition 1, 57-82.——. (1983). Mental models. Towards a cognitive science of language, inference, and consciousness.
Harvard University Press, Cambridge, MA.——. (2001). Mental models and deduction. Trends in Cognitive Sciences 5, 434-442.Johnson-Laird, P. N. and Byrne, R. M. J. (1991). Deduction. Lawrence Erlbaum, Hove.Knauff, M. (1999). The cognitive adequacy of Allen’s interval calculus for qualitative spatial
representation and reasoning. Spatial Cognition and Computation 1, 261-290.——. (2007). How our brains reason logically. Topoi 26, 19-36.——. (2009a). Reasoning. In: Binder, M. D., Hirokawa, N. and Windhorst, U. (Eds), Encyclo-
pedia of Neuroscience, pp. 3377- 3382. Springer, Berlin.——. (2009b). A neuro-cognitive theory of deductive relational reasoning with mental models
and visual images. Spatial Cognition and Computation 9, 109-137.Knauff, M., Rauh, R. and Schlieder, C. (1995). Preferred mental models in qualitative spatial
reasoning: A cognitive assessment of Allen’s calculus. In Moore, J. D. and Lehman, J. F. (Eds),

M. Knauff, M. Ragni / Journal of Cognition and Culture 11 (2011) 1–21 21
Proceedings of the Seventeenth Annual Conference of the Cognitive Science Society, pp. 200-205. Lawrence Erlbaum, Mahwah, NJ.
Knauff, M., Fangmeier, T., Ruff, C. C. and Johnson-Laird, P. N. (2003). Reasoning, models, and images: Behavioral measures and cortical activity. Journal of Cognitive Neuroscience 15, 559-573.
Levinson, S. C. and Meira, S. (2003). ‘Natural concepts’ in the spatial topological domain. Language 79, 485-516.
Levinson, S., Kita, S., Haun, D. and Rasch, B. (2002). Returning the tables: Language affects spatial reasoning. Cognition 84, 155-188.
Li, S. (2006). A complete classification of topological relations using the 9-intersection method. International Journal of Geographical Information Science 20, 589-610.
Manktelow, K. I. (1999). Reasoning and Thinking. Psychology Press, Hove.Mark, D. and Egenhofer, M. (1994). Modeling spatial relations between lines and regions: com-
bining formal mathematical models and human subjects testing. Cartography and Geographic Information Systems 21, 195-212.
Mark, D., Comas, D., Egenhofer, M., Freundschuh, S., Gould, J. and Nunes, J. (1995). Evaluat-ing and refining computational models of spatial relations through cross-linguistic human-subjects testing. In Frank, A. and Kuhn, W. (Eds), Spatial Information Theory: a theoretical basis for GIS, pp. 553-568. Springer, Berlin.
Ragni, M. and Wölfl, S. (2005). On Generalized Neighborhood Graphs. In Furbach, U. (Ed.), KI 2005: Advances in Artificial Intelligence, 28th Annual German Conference on AI, pp. 64-78. Springer, Berlin.
Ragni, M., Knauff, M. and Nebel, B. (2005). A Computational Model for Spatial Reasoning with Mental Models. In Bara, B. G., Barsalou, L. and Bucciarelli, M. (Eds), Proceedings of the 27th Annual Cognitive Science Conference, pp. 1064-1070. Lawrence Erlbaum, Mahwah, NJ.
Ragni, M., Fangmeier, T., Webber, L. and Knauff, M. (2006). Complexity in Spatial Reasoning. In Sun, R. and Miyake, N. (Eds) Proceedings of the 28th Annual Cognitive Science Conference, pp. 1981-1999. Lawrence Erlbaum, Mahwah, NJ.
Randell, D. A., Cohn, A. G. and Cui, Z. (1992a). Computing transitivity tables: A challenge for automated theory provers (Proceedings of the 11th CADE). Springer, Berlin.
Randell, D. A., Cui, Z. and Cohn, A G. (1992b). A spatial logic based and regions and connec-tion. In Nebel, B., Swarthout, W. and Rich, C. (Eds), Proceedings of the third Conference on Principles of Knowledge Representation and Reasoning, pp. 165-176. Morgan Kaufmann, Cam-bridge, MA.
Rauh, R., Hagen, C., Knauff, M., Kuß, T., Schlieder, C. and Strube, G. (2005). Preferred and alternative mental models in spatial reasoning. Spatial Cognition and Computation 5, 239-269.
Schlieder, C. and Berendt, B. (1998). Mental model construction in spatial reasoning: A com-parison of two computational theories. In Schmid, U., Krems, J. F. and Wysotzki, F. (Eds), Mind modelling: A cognitive science approach to reasoning, pp. 133-162. Pabst Science Publish-ers, Lengerich.
Spalek, T. M. and Hammad, S. (2005). The left-to-right bias in inhibition of return is due to the direction of reading. Psychological Science 16, 15-18.
