cross-correlations of american baby names - pnas · cross-correlations of american baby names ......
TRANSCRIPT

Cross-correlations of American baby namesPaolo Baruccaa,1,2, Jacopo Rocchia,1, Enzo Marinaria,b, Giorgio Parisia,b,2, and Federico Ricci-Tersenghia,b
aDipartimento di Fisica, Sapienza Universitá di Roma, I-00185 Rome, Italy; and bSezione di Roma 1, Istituto Nazionale di Fisica Nucleare, I-00185 Rome, Italy
Contributed by Giorgio Parisi, April 27, 2015 (sent for review October 11, 2014; reviewed by R. Alexander Bentley)
The quantitative description of cultural evolution is a challengingtask. The most difficult part of the problem is probably to find theappropriate measurable quantities that can make more quantita-tive such evasive concepts as, for example, dynamics of culturalmovements, behavioral patterns, and traditions of the people. Astrategy to tackle this issue is to observe particular features ofhuman activities, i.e., cultural traits, such as names given tonewborns. We study the names of babies born in the UnitedStates from 1910 to 2012. Our analysis shows that groups ofdifferent correlated states naturally emerge in different epochs,and we are able to follow and decrypt their evolution. Althoughthese groups of states are stable across many decades, a suddenreorganization occurs in the last part of the 20th century. Weunambiguously demonstrate that cultural evolution of society canbe observed and quantified by looking at cultural traits. We thinkthat this kind of quantitative analysis can be possibly extended toother cultural traits: Although databases covering more than onecentury (such as the one we used) are rare, the cultural evolutionon shorter timescales can be studied due to the fact that manyhuman activities are usually recorded in the present digital era.
clustering | cultural evolution | cultural traits | complex systems
Cultural traits are behavioral patterns shared by the membersof social communities. Traditions, religions, beliefs, lan-
guage, and values are some examples. Far from being static andisolated, they are continuously evolving and interacting with theexternal environment, e.g., other communities and mass media,and they can be transmitted among members of communities ontimescales that are much shorter than those characterizing cul-tural movements. Although changes in cultural movements mayoccur over decades or centuries, changes in cultural traits may beobserved from a daily to a yearly basis, depending on the trait.An accurate analysis of existing, public data can teach a lot abouttheir reciprocal influence. A cultural trait may promote or pre-vent the popularity rise of others, a past cultural trait may havean influence on current and future ones, and finally the rise orfall of a cultural trait in a certain area may influence culturaltraits in other areas. Cultural traits can be considered as thefundamental blocks of the culture of communities, and theirevolution can be used to describe the evolution of society.Some of the most important progress in the understanding of
the evolutionary process of cultures is described in a number oftexts that are at this point classic references: Among them arerefs. 1–3. Also many cultural traits have been studied in the past.Among them are those that have negligible differences amongeach other, in terms of intrinsic costs and benefits, which areusually referred to as neutral traits. They play a special role in ourstudy, as we explain below. Some of these traits are skirt lengths(4), pop songs (5), dog breeds (6), and pottery decorations in thearchaeological record (7). Also keywords in academics vocabularyhave been the focus of recent interest (8). Data about names givento newborns have been investigated for similar reasons (9, 10), andthey are the focus of our investigation.Names come and go in society, as does any other cultural trait.
Most of them have a popularity peak and then disappear. Theycarry important information on the transformation of the socialstructure (11, 12). Several quantitative approaches to analyzewhat can be learned from names have been proposed, and we
briefly describe them in the following lines. Compared with otherrelevant traits, neutral traits and, in particular, names appearvery appropriate to study cultural changes, because the success ofa name depends mainly on the influence that the surroundingculture wields on the parents of the newborns. Other traits suf-fer, for example, the influence of external forces, such as that dueto the producers, which may artificially shape the tastes of con-sumers. This is particularly evident in the fashion market and inthe music market (13).The frequency distributions of names given to newborns have
fat tails, typical of many complex physical problems (14). Fat-tailed distributions can be generated by different mechanisms (7,15, 16), and in the case of names they have been given severalexplanations. A scale-free network was used to study a fashiondiffusion process where each node could take one of many values(9), imitating “popular” nodes and avoiding “nonpopular” nodes.A stochastic model for cultural evolution has been proposed re-cently. Here names were chosen according to both individualpreferences and social influence (10). These different mechanismsare all able to reproduce a fat-tailed distribution and were shownto reproduce several features of the real data. The popularity of aname was also shown to be correlated with the popularity ofsimilar names in previous years (13). Furthermore, names wereanalyzed in terms of activation and inhibition processes (17), toexplain their popularity. The rates of the rise and of the fall of thepopularity of names were found to be correlated in refs. 11 and 18.The same phenomena are also being studied in the context ofcollective behavior (19, 20), where limited attention seems to playa crucial role (21, 22), and in the context of citation dynamics (23),where a universal temporal pattern is found.Some very interesting phenomena on the dynamics of Amer-
ican baby names have been recently discussed in ref. 24, wherethe authors introduced a new model for the choice of names. The
Significance
Societal and cultural transformations are very general anddebated topics, both by scientists (e.g., sociologists) and bypublic opinion (e.g., artists, music producers, brand manufac-turers, and advertising agencies). Although almost everyonewould be able to express a position on such arguments, it ismuch more difficult to support such an opinion based on sci-entific evidence. In this work we analyze the case of Americanbaby names and describe the evolution of tastes of parentsregarding the choice of the name during the years of the lastcentury. Using quantitative methods we find that a deeptransformation occurred at the end of the 20th century andsuggest that this might be studied from a quantitative socio-logical point of view.
Author contributions: E.M., G.P., and F.R.-T. designed research; P.B. and J.R. performedresearch; P.B. and J.R. analyzed data; and P.B., J.R., E.M., G.P., and F.R.-T. wrote the paper.
Reviewers included: R.A.B., Bristol University.
The authors declare no conflict of interest.1P.B. and J.R. contributed equally to this work.2To whom correspondence may be addressed. Email: [email protected] [email protected].
This article contains supporting information online at www.pnas.org/lookup/suppl/doi:10.1073/pnas.1507143112/-/DCSupplemental.
www.pnas.org/cgi/doi/10.1073/pnas.1507143112 PNAS | June 30, 2015 | vol. 112 | no. 26 | 7943–7947
SOCIALSC
IENCE
SST
ATIST
ICS
model is defined in terms of a population of agents (babies), eachof which holds a single variant (name), and where names of thenew generations are given mainly by copying from the last gen-erations but also, sometimes, by inventing new names. Comparingreal world data with the model in ref. 24 unveils a considerableincrease in the innovation of names in the last part of the century.This is consistent with the main findings of this paper, as we dis-cuss further in the following.The mechanisms behind the spreading of cultural traits are still
debated. The original hypothesis of Simmel (25) was that a fashionarises because individuals of lower social status copy those ofperceived higher status. This is the idea used for the analysis donein ref. 9. This approach is different from the neutral model pro-posed in ref. 26, where naming was considered in close connectionwith the infinite-allele model of population genetics with a ran-dom genetic drift. A preference model of fashion (18) where in-dividuals can copy preferences of other agents, was said to betterreproduce the empirical features of American baby names. Thesestudies on names were mainly focused on global distributions, but
not on the relations between local distributions of names in dif-ferent states of the United States (i.e., distributions in singlestates). We believe that much can be learned, for example, fromthe relations between local distributions of names in differentstates. Our main working hypothesis is that local changes of namesconvey a large body of information on the mutual cultural in-fluences that communities (states) wield on each other.We focus our correlation analysis on different states of the
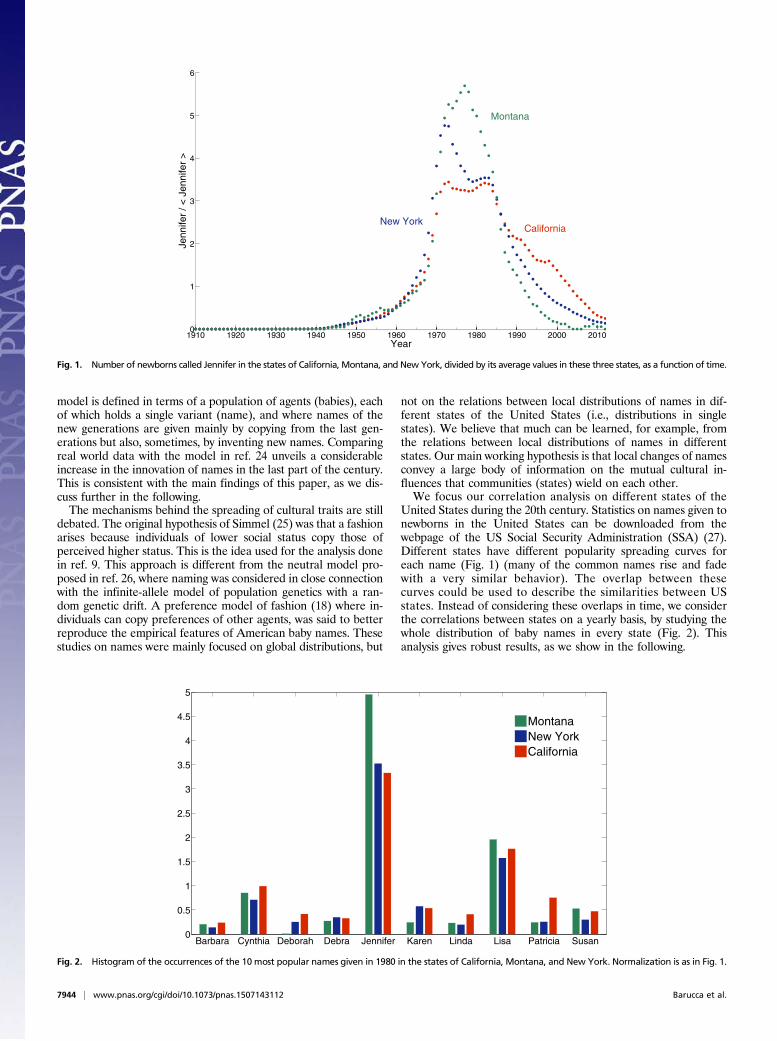
United States during the 20th century. Statistics on names given tonewborns in the United States can be downloaded from thewebpage of the US Social Security Administration (SSA) (27).Different states have different popularity spreading curves foreach name (Fig. 1) (many of the common names rise and fadewith a very similar behavior). The overlap between thesecurves could be used to describe the similarities between USstates. Instead of considering these overlaps in time, we considerthe correlations between states on a yearly basis, by studying thewhole distribution of baby names in every state (Fig. 2). Thisanalysis gives robust results, as we show in the following.
1910 1920 1930 1940 1950 1960 1970 1980 1990 2000 20100
1
2
3
4
5
6
Year
Jenn
ifer
/ < J
enni
fer
>
Montana
CaliforniaNew York
Fig. 1. Number of newborns called Jennifer in the states of California, Montana, and New York, divided by its average values in these three states, as a function of time.
Barbara Cynthia Deborah Debra Jennifer Karen Linda Lisa Patricia Susan0
0.5
1
1.5
2
2.5
3
3.5
4
4.5
5
MontanaNew YorkCalifornia
Fig. 2. Histogram of the occurrences of the 10 most popular names given in 1980 in the states of California, Montana, and New York. Normalization is as in Fig. 1.
7944 | www.pnas.org/cgi/doi/10.1073/pnas.1507143112 Barucca et al.

MethodsFor all available years [that range, in the SSA archives (27), from 1910 to 2012]we study how names given in a state i are correlated to names given in astate j. The distribution of these names has already been analyzed (28) and itis further described in SI Text (Figs. S1 and S2). For each pair of states i and j,with i, j= 1, . . . ,M= 51 (the federal district of Washington, DC is consideredby itself), we evaluate a correlation coefficient Cij, computed as follows. Letus consider a generic year y and let nSðqÞ be the number of girls named qborn in the state S in the year y (we limit ourselves to describing the girls’case as we have verified that analyzing baby boys’ names leads to the sameconclusions). In each year, we have a Nf ×M rectangular matrix, whereNf = 19,492 is the total number of different girl names present in the database,and M= 51 the number of US states. The entries of the matrix, nSðqÞ, are theoccurrences of the baby girl names, with q= 1, . . . ,Nf and S= 1, . . . ,M. Be-cause the information provided by the SSA includes only names that occur atleast five times, if the name q has been used less than five times in the state Sin the year y, then we have nSðqÞ= 0. These matrices are sparse, and only anaverage of 3% of the entries are different from zero. The frequency fSðqÞ ofthe name q in the state S is given by
fSðqÞ= nSðqÞXNf
q=1nSðqÞ
. [1]
The average frequency of the name q over the states is
fðqÞ= 1M
XMS=1
fSðqÞ . [2]
It is useful to define the quantities
~fSðqÞ= fSðqÞ− fðqÞ , [3]
which are related to fluctuations of the frequencies of the names over thestates. The average of ~f SðqÞ over all of the names is zero in each state S, ascan be explicitly seen from their definition
Æ~fSðqÞæq = 1Nf
XNf
q=1
~fSðqÞ=1Nf
−1Nf
= 0 , [4]
given that in each state S,P
qfSðqÞ= 1. To compute how the names in thestate i are correlated with the names in the state j, we analyzed, year afteryear, the Pearson correlation between the variables ~f i and ~f j, which is theM×M square matrix
Cij =
XNf
n=1~f iðnÞ~f jðnÞffiffiffiffiffiffiffiffiffiffiffiffiffiffiffiffiffiffiffiffiffiffiffiffiffiXNf
n=1~f2
i ðnÞr ffiffiffiffiffiffiffiffiffiffiffiffiffiffiffiffiffiffiffiffiffiffiffiffiffiXNf
n=1~f2
j ðnÞr . [5]
This matrix can be used to capture the emergence of complex correlationsbetween clusters of states and to study their evolution in time. However,separating the interesting information from the underlying noise is a non-trivial problem. Similar issues have already been faced when analyzing bi-ological problems (29–32) and financial stock markets (33–36) as well as inInternet traffic analysis (37) and in the statistics of atmospheric correlations(38). The main point is that even though the empirical correlation matrix isnoisy, it does have stable properties (Figs. S3 and S4). We checked theseproperties, such as the eigenvalue spectrum and eigenvector localization,and compared them to the ones implied by a null hypothesis, i.e., to theproperties of random matrices (Fig. S5).
Here we apply two general methods for the analysis of correlation ma-trices, i.e., principal component analysis (PCA) and hierarchical clustering
Fig. 3. The colors assigned to the states reflect the similarity in their distributions of names. We use a notion of similarity based on the principal componentanalysis of thematrices of states correlations Cij, defined in the text. Details are provided inMethods. A difference between the central decades of the 20th centuryand its last decades is clearly visible. Northern and southern states were very correlated among them andwere forming two separated, uncorrelated entities until 1960.A new configuration emerges at the end of the 20th century and eventually ends up with a patchy situation where central and coastal states are correlated amongthem (with very long-range correlations covering thousands of miles of physical distance) and are roughly part of two different cultural areas. Data shown in this figurehave been obtained looking at baby girl names. Movies provide an animated visualization of the cultural transition both for girls (Movie S1) and boys (Movie S2).
Barucca et al. PNAS | June 30, 2015 | vol. 112 | no. 26 | 7945
SOCIALSC
IENCE
SST
ATIST
ICS

(HC). PCA is based on the selection of the eigenvectors corresponding to thelargest eigenvalues of the cross-correlation matrix. This choice relies on thehypothesis that smaller eigenvalues are related to noise whereas larger onesare related to the true system dynamics. HC, on the other hand, starts fromMclusters formed of one state each and allows one to set up a hierarchy ofclusters by merging clusters according to their distances, which can be de-fined in several ways from their mutual correlations. These two methodsgive very similar results, both for male and for female names, year after yearand for different choices of the metrics in the HC algorithm. These methodsare further described in SI Text.
ResultsBoth our algorithms show a clear division of the different statesin a number of homogeneous groups. A group of states is quali-tatively defined as states that share some level of similarity in theirdistributions of names, and it is natural to associate them to acommon cultural area. In Fig. 3, states in the same group areassigned similar colors. This group structure is robust over time-scales of the order of a few years: It is thus worth looking at theirevolution over larger timescales. In the beginning of the 20thcentury states were divided into a group of northern states and agroup of southern ones, and this separation remains stable acrossmany years. This structure suddenly breaks down in the last de-cades of the 20th century, and a new configuration of groupsemerges. The evolution of these groups of states is clear in Fig. 3.In the new stable configuration that emerges at the end of the
20th century, some states of the Atlantic and of the Pacific coastsshare common features and belong to the same group, differentfrom that to which many of the central states belong. To betteridentify these groups of states we used a hierarchical clusteringalgorithm. A better visualization of this transition can be observedin Movies S1–S4. This method allows a precise and quantitative
definition of the groups mentioned above and leads to the for-mation of clusters, identified by different colors in Fig. 4 (see alsoFig. S6). The two different methods give the same answer andmake manifest a very interesting social cross-fertilization. Thisapproach is able to describe the emergence of clusters of statesthrough the analysis of the mutual correlations of their newbornsnames and extracts interesting information on the evolution ofthese clusters (Figs. S7 and S8).
DiscussionThe study of name distributions at the state level enabled us toavoid the effects of strong fluctuations on smaller scales due tolocal socioeconomic factors, such as for instance economic seg-regation or ethnicity (39), and to capture macroscopic changes inthe structure of mutual correlations. We do not discuss here theorigin of these correlations or the mechanisms according to whichnames are given to newborn babies. Some steps in this directionhave been taken in refs. 10 and 24. We also do not study thereasons why there is a reorganization of clusters in the last decadesof the 20th century, compared with the relatively stable situationof the first half of the century. These are two very interesting issuesthat deserves a more specific study. Irregularities in the retardedcross-correlations between the total distributions of the Americannames were found in ref. 10 to appear in the 1970s; this effect isvery probably connected to the reorganization of the clusteringof the states that we unveil here. As suggested by the authors inref. 10, this effect is probably due to the deep cultural trans-formation that occurred in the United States after the VietnamWar. The authors also proposed a model for the generation ofnames, showing, very interestingly, that in recent years the in-equality between names has been decreasing. The decrease in time
Fig. 4. Hierarchical clustering of the states. This analysis clearly shows that groups of states form well-separated clusters. Details on the clustering method areprovided in SI Text. The social evolution of geographical correlation is very clear. This figure has been obtained looking at baby girl names. Movies provide ananimated visualization of the cultural transition both for girls (Movie S3) and for boys (Movie S4).
7946 | www.pnas.org/cgi/doi/10.1073/pnas.1507143112 Barucca et al.

of the probability that two individuals chosen at random from a setof newborn babies share the same name (and the correspondingincrease in the diversity of names) is shown in ref. 9 to be related tothe shorter timescale of the name’s lifetime, whereas the authors ofref. 10 explained how the weakening of social influence could alsobe a relevant factor. This effect is very closely related to the in-crease of innovation found by Bentley and Ormerod (24), whichdetected a steep increase in the coefficient that regulates theamount of invention of new names, compared with the number ofnames copied by previous generations. One of the possible expla-nations of this fact is the much deeper interconnectedness of thesociety of the last decades, compared with that of the last century,whose culture sources were mainly represented by mass media.Much more should be said on this, but this would take us far from
the main aims of this work. We mention only that our analysis canbe adapted to capture which states influence a given state andwhich ones are influenced by the same state. This amounts toidentifying a directed network, which may be relevant for studyingtime correlations and culture propagation. In the Internet era onecan get high statistical data about an extremely large number ofbehaviors and cultural traits: Using our approach on the combinedensemble of such abundant datasets should allow one to organize aprecise quantitative understanding about the functioning of cul-tural influences and their evolution.
ACKNOWLEDGMENTS. The research leading to these results has receivedfunding from the Italian Research Ministry through the Futuro in RicercaProject RBFR086NN1.
1. Feldman MW, Cavalli-Sforza LL (1981) Cultural Transmission and Evolution: A Quan-titative Approach (Princeton Univ Press, Princeton, NJ), Vol 16.
2. Boyd R, Richerson PJ (1985) Culture and the Evolutionary Process (Univ of ChicagoPress, Chicago).
3. Mesoudi A (2011) Cultural Evolution: How Darwinian Theory Can Explain HumanCulture and Synthesize the Social Sciences (Univ of Chicago Press, Chicago).
4. Belleau BD (1987) Cyclical fashion movement: Women’s day dresses: 1860-1980. ClothText Res J 5(2):15–20.
5. Bentley RA, Lipo CP, Herzog HA, Hahn MW (2007) Regular rates of popular culturechange reflect random copying. Evol Hum Behav 28(3):151–158.
6. Herzog HA, Bentley RA, Hahn MW (2004) Random drift and large shifts in popularityof dog breeds. Proc Biol Sci 271(Suppl 5):S353–S356.
7. Neiman FD (1995) Stylistic variation in evolutionary perspective: Inferences fromdecorative diversity and interassemblage distance in Illinois woodland ceramic as-semblages. Am Antiq •••:7–36.
8. Bentley RA (2008) Random drift versus selection in academic vocabulary: An evolu-tionary analysis of published keywords. PLoS ONE 3(8):e3057.
9. Krawczyk MJ, Dydejczyk A, Kulakowski K (2014) The Simmel effect and babies’ names.Physica A Stat Mech Appl 395:384–391.
10. Xi N, et al. (2014) Cultural evolution: The case of babies’ first names. Physica A StatMech Appl 406:139–144.
11. Berger J, Le Mens G (2009) How adoption speed affects the abandonment of culturaltastes. Proc Natl Acad Sci USA 106(20):8146–8150.
12. Goldstone RL, Gureckis TM (2009) Collective behavior. Top Cogn Sci 1(3):412–438.13. Berger J, Bradlow ET, Braunstein A, Zhang Y (2012) From Karen to Katie: Using baby
names to understand cultural evolution. Psychol Sci 23(10):1067–1073.14. Jensen HJ (1998) Self-Organized Criticality: Emergent Complex Behavior in Physical
and Biological Systems (Cambridge Univ Press, Cambridge, UK), Vol 10.15. Albert R, Barabási AL (2002) Statistical mechanics of complex networks. Rev Mod Phys
74(1):47.16. Feldman MW, Cavalli-Sforza LL (1981) Further remarks on Darwinian selection and
“altruism”. Theor Popul Biol 19(2):251–260.17. Zanette DH (2012) Dynamics of fashion: The case of given names. arXiv:1208.0576.18. Acerbi A, Ghirlanda S, Enquist M (2012) The logic of fashion cycles. PLoS ONE 7(3):
e32541.19. Onnela JP, Reed-Tsochas F (2010) Spontaneous emergence of social influence in on-
line systems. Proc Natl Acad Sci USA 107(43):18375–18380.20. Gleeson JP, Cellai D, Onnela JP, Porter MA, Reed-Tsochas F (2014) A simple generative
model of collective online behavior. Proc Natl Acad Sci USA 111(29):10411–10415.21. Wu L, Flammini A, Vespignani A, Menczer F (2012) Competition among memes in a
world with limited attention. Sci Rep 2:335.22. Wu F, Huberman BA (2007) Novelty and collective attention. Proc Natl Acad Sci USA
104(45):17599–17601.
23. Wang D, Song C, Barabási AL (2013) Quantifying long-term scientific impact. Science342(6154):127–132.
24. Bentley RA, Ormerod P (2012) Accelerated innovation and increased spatial diversityof us popular culture. Adv Complex Syst 15:1150011.
25. Simmel G (1904) Fashion. Am J Sociol 62(6):541–558.26. Hahn MW, Bentley RA (2003) Drift as a mechanism for cultural change: An example
from baby names. Proc Biol Sci 270(Suppl 1):S120–S123.27. US Social Security Administration, The Official Website of the US Social Security Ad-
ministration. Available at www.ssa.gov.28. Li W (2012) Analyses of baby name popularity distribution in us for the last 131 years.
Complexity 18(1):44–50.29. Sporns O, Chialvo DR, Kaiser M, Hilgetag CC (2004) Organization, development and
function of complex brain networks. Trends Cogn Sci 8(9):418–425.30. Luo F, Zhong J, Yang Y, Scheuermann RH, Zhou J (2006) Application of randommatrix
theory to biological networks. Phys Lett A 357(6):420–423.31. Luo F, et al. (2007) Constructing gene co-expression networks and predicting func-
tions of unknown genes by random matrix theory. BMC Bioinformatics 8(1):299.32. Jalan S, Solymosi N, Vattay G, Li B (2010) Random matrix analysis of localization
properties of gene coexpression network. Phys Rev E Stat Nonlin Soft Matter Phys81(4 Pt 2):046118.
33. Laloux L, Cizeau P, Bouchaud JP, Potters M (1999) Noise dressing of financial corre-lation matrices. Phys Rev Lett 83(7):1467.
34. Plerou V, Gopikrishnan P, Rosenow B, Amaral LAN, Stanley HE (1999) Universal andnon-universal properties of cross correlations in financial time series. Phys Rev Lett83(7):1471.
35. Plerou V, et al. (2002) Random matrix approach to cross correlations in financial data.Phys Rev E Stat Nonlin Soft Matter Phys 65(6 Pt 2):066126.
36. Conlon T, Ruskin HJ, Crane M (2009) Cross-correlation dynamics in financial time se-ries. Physica A Stat Mech Appl 388(5):705–714.
37. Barthélemy M, Gondran B, Guichard E (2002) Large scale cross-correlations in Internettraffic. Phys Rev E Stat Nonlin Soft Matter Phys 66(5 Pt 2):056110.
38. Santhanam MS, Patra PK (2001) Statistics of atmospheric correlations. Phys Rev E StatNonlin Soft Matter Phys 64(1 Pt 2):016102.
39. Fryer RG, Levitt SD (2004) The causes and consequences of distinctively Black names.The Quarterly Journal of Economics 119(3):767–805.
40. Edelman A (1988) Eigenvalues and condition numbers of random matrices. SIAM JMatrix Anal Appl 9(4):543–560.
41. Cizeau P, Bouchaud JP (1994) Theory of Lévy matrices. Phys Rev E Stat Phys PlasmasFluids Relat Interdiscip Topics 50(3):1810–1822.
42. Johnstone IM (2007) High dimensional statistical inference and random matrices.Proceedings of the International Congress of Mathematicians Madrid, August 22–30,2006, eds Sanz-Solé M, Soria J, Varona JL, Verdera J (EMS Publishing House, Zürich) pp307–333.
Barucca et al. PNAS | June 30, 2015 | vol. 112 | no. 26 | 7947
SOCIALSC
IENCE
SST
ATIST
ICS