crop-livestock intensification in southern africa: drivers, opportunities and crop residue...
DESCRIPTION
Presentation at the 10th African Crop Science Society Conference, 10-13. October 2011, Maputo, Mozambique.TRANSCRIPT
CROP-LIVESTOCK INTENSIFICATION IN SOUTHERN AFRICA: DRIVERS, OPPORTUNITIES AND CROP RESIDUE UTILIZATION
SABINE HOMANN-KEE TUI; JONATHAN TANGANYIKA; FELISBERTO MAUTE; DANIEL NKOMBONI; NKULULEKO MPOFU;TIMOTHY GONDWE; PAULA DIAS;
SHADRECK NCUBE; ANDRE F. VAN ROOYEN
SLP project :Optimizing livelihood and environmental benefits from crop residues in smallholder crop-livestock systems in sub-Saharan Africa and South Asia (www.vslp.org)
10th African Crop Science Society
Conference 10-13 October 2011
in Maputo
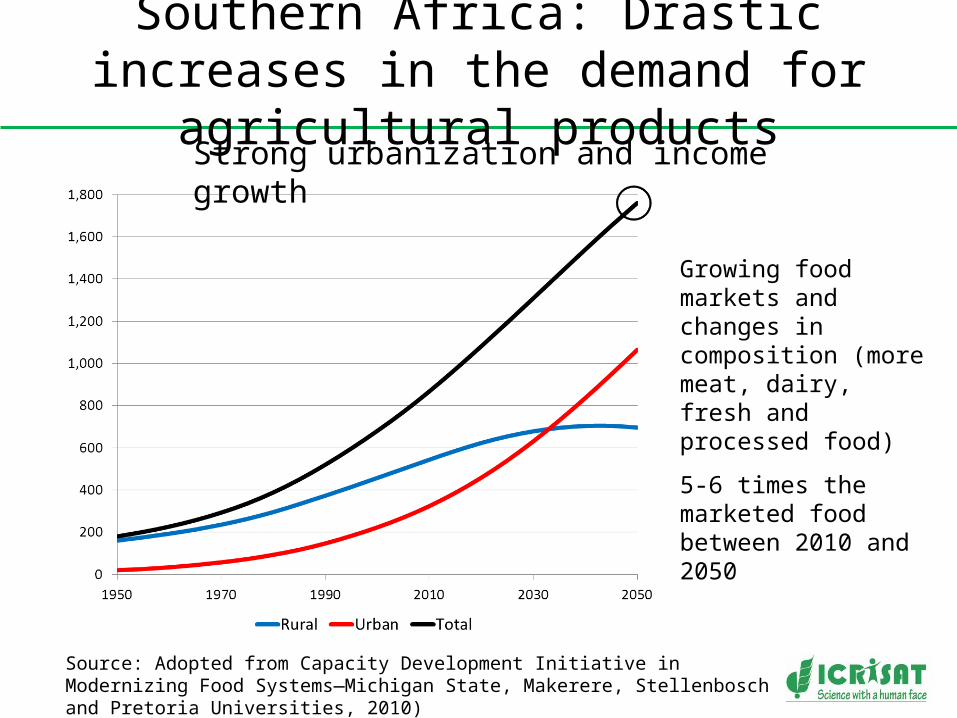
Southern Africa: Drastic increases in the demand for agricultural products
Source: Adopted from Capacity Development Initiative in Modernizing Food Systems—Michigan State, Makerere, Stellenbosch and Pretoria Universities, 2010)
Strong urbanization and income growth
Growing food markets and changes in composition (more meat, dairy, fresh and processed food)
5-6 times the marketed food between 2010 and 2050
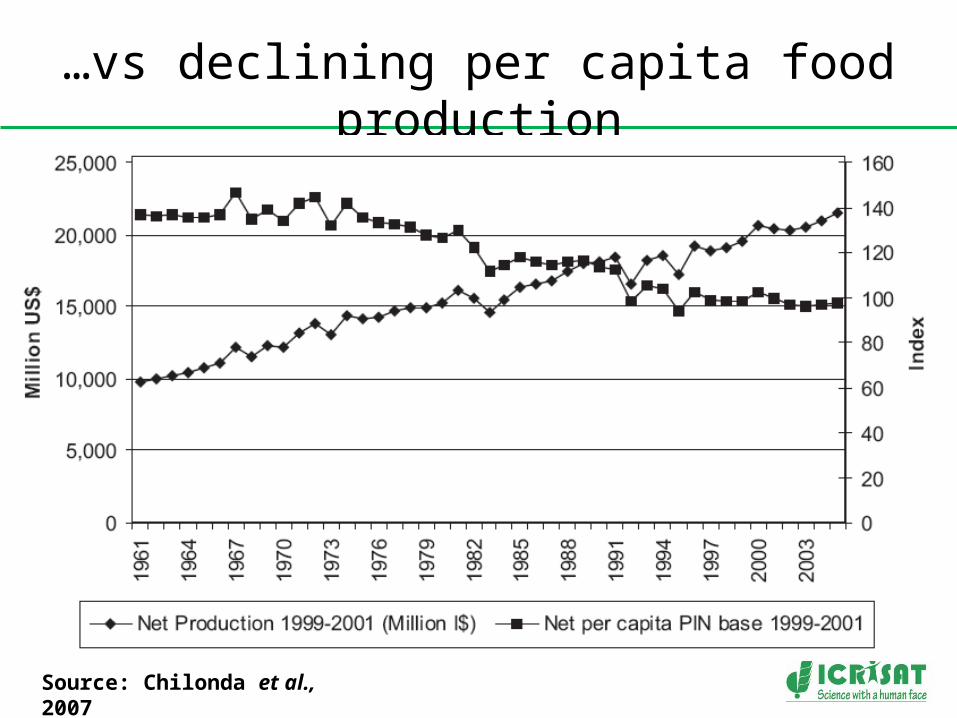
…vs declining per capita food production
Source: Chilonda et al., 2007
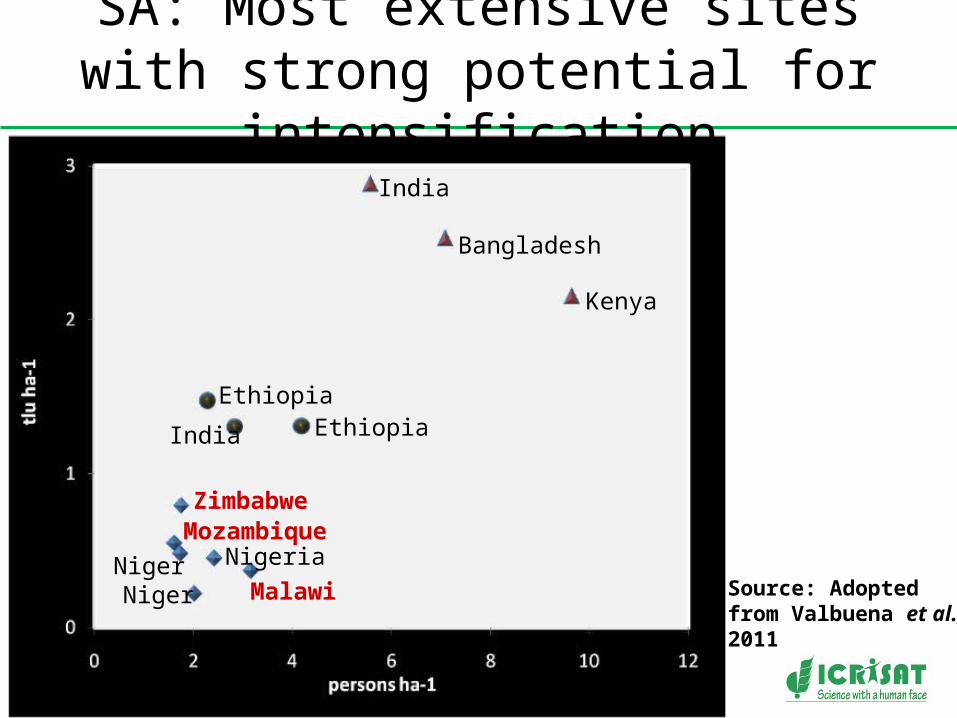
SA: Most extensive sites with strong potential for intensification
India
Bangladesh
Kenya
India
EthiopiaEthiopia
Zimbabwe
Nigeria
Malawi
Mozambique
NigerNiger
Source: Adopted from Valbuena et al., 2011
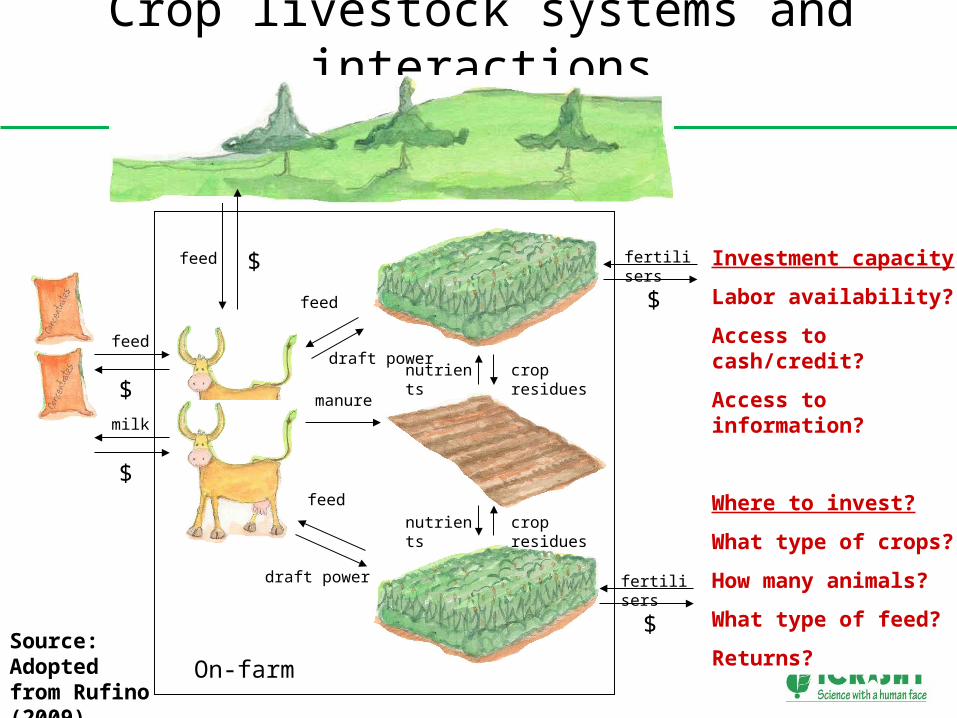
Crop livestock systems and interactions
milk
feed
$
feed $
$
feed
crop residuesnutrients
$
fertilisers
On-farm
feed
crop residuesnutrients
$
fertilisers
manure
Investment capacity
Labor availability?
Access to cash/credit?
Access to information?
Where to invest?
What type of crops?
How many animals?
What type of feed?
Returns?
Source: Adopted from Rufino (2009)
draft power
draft power
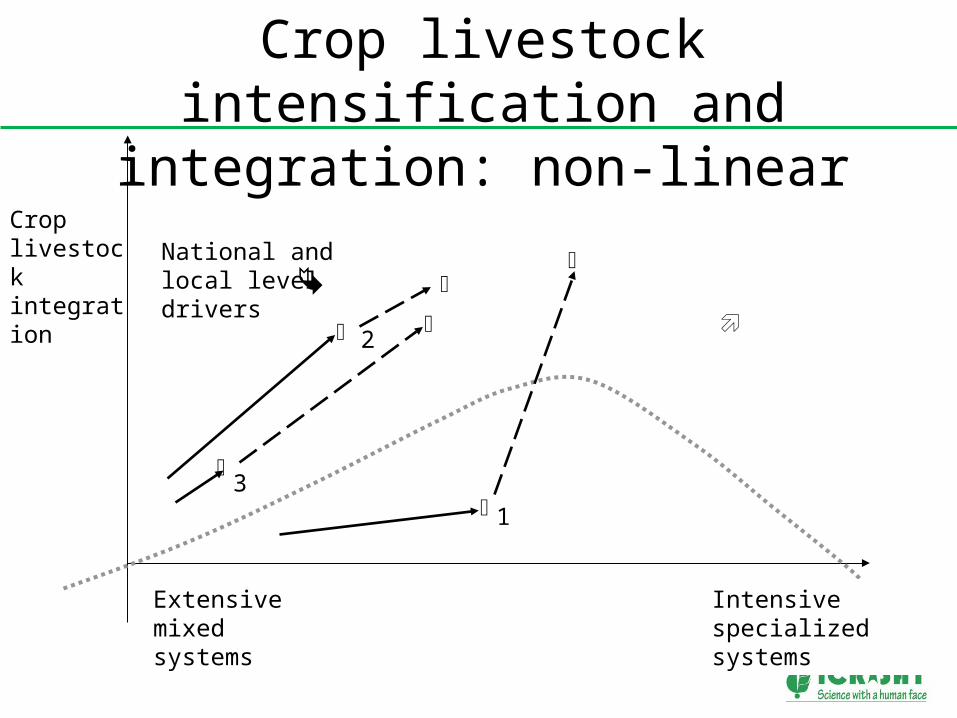
Crop livestock intensification and integration: non-linear
Extensive mixed systems
Intensive specialized systems
Crop livestock integration
National and local level drivers
1
3
2
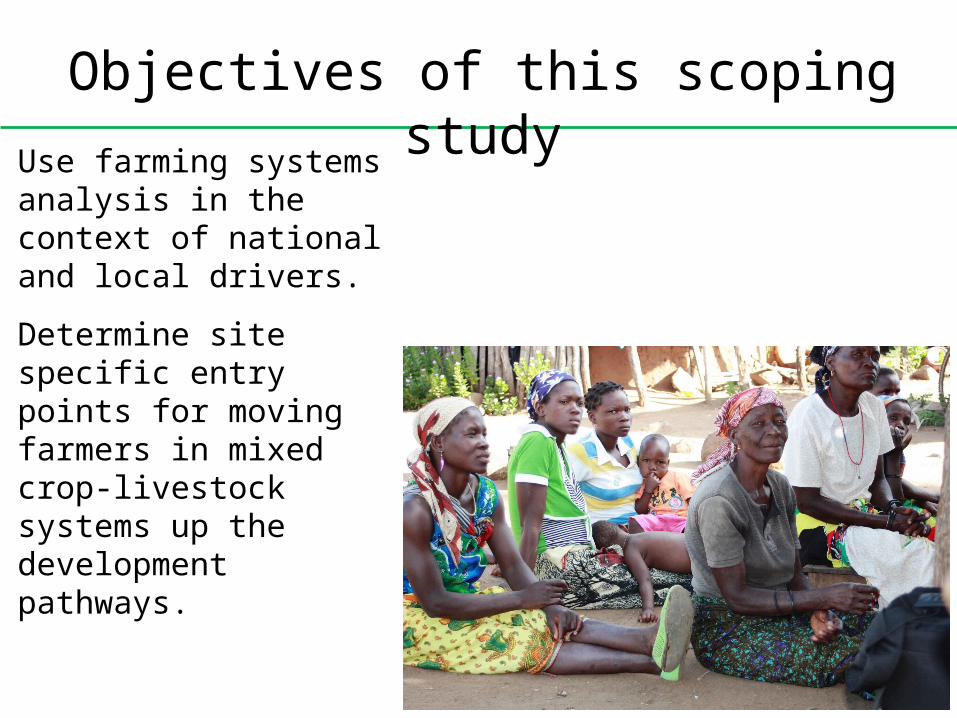
Objectives of this scoping study
Use farming systems analysis in the context of national and local drivers.
Determine site specific entry points for moving farmers in mixed crop-livestock systems up the development pathways.
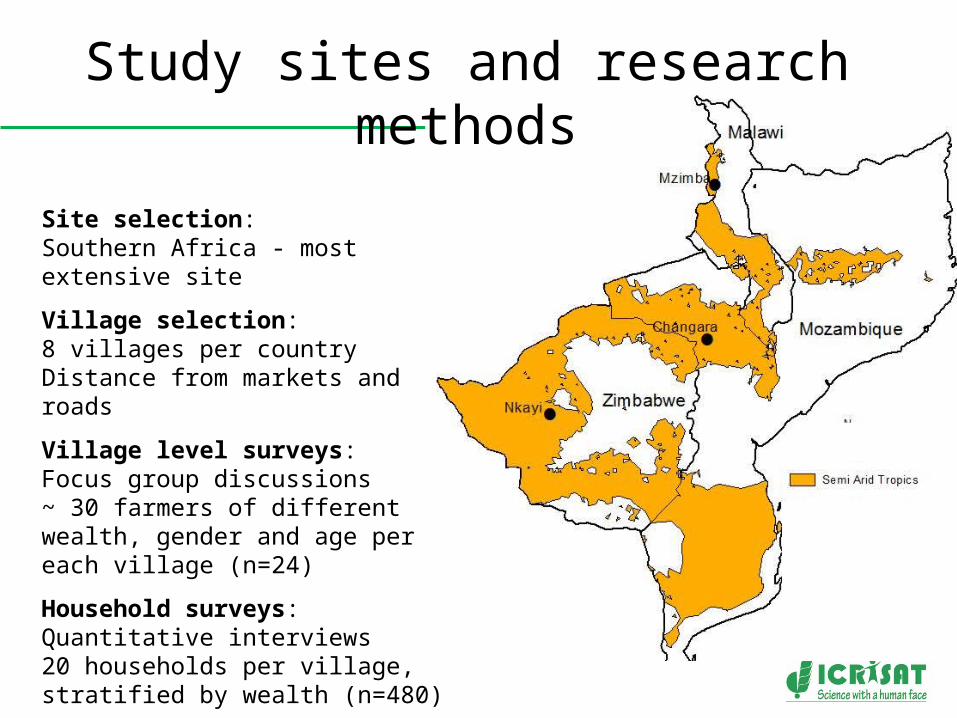
Study sites and research methods
Site selection: Southern Africa - most extensive site
Village selection: 8 villages per country Distance from markets and roads
Village level surveys: Focus group discussions ~ 30 farmers of different wealth, gender and age per each village (n=24)
Household surveys: Quantitative interviews20 households per village, stratified by wealth (n=480)
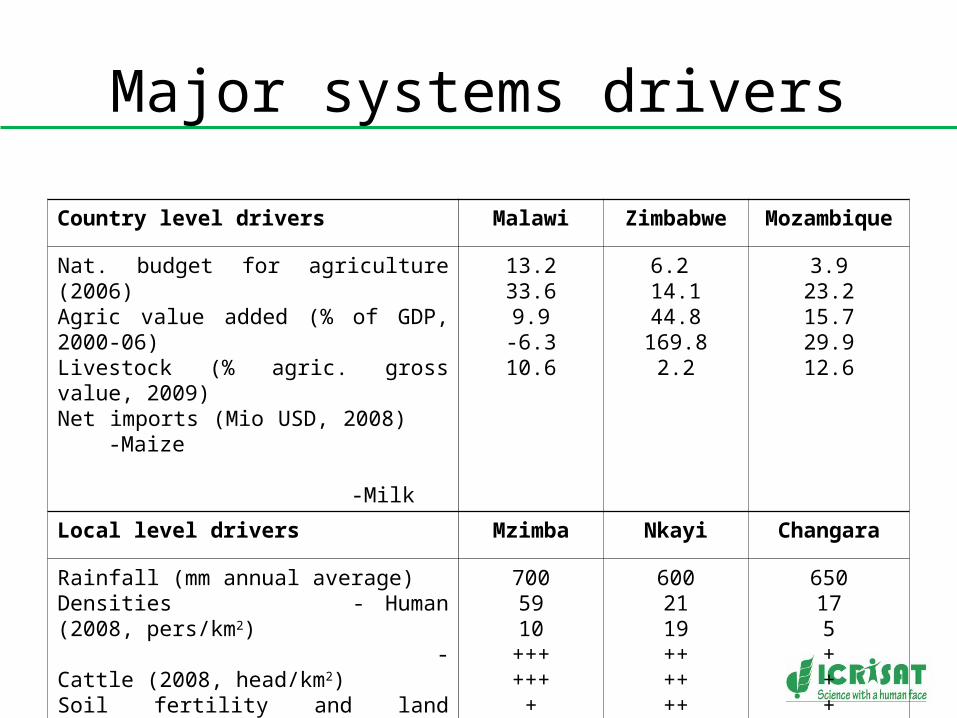
Major systems drivers
Country level drivers Malawi Zimbabwe Mozambique
Nat. budget for agriculture (2006) Agric value added (% of GDP, 2000-06)Livestock (% agric. gross value, 2009)Net imports (Mio USD, 2008) -Maize -Milk
13.233.69.9-6.310.6
6.2 14.144.8
169.82.2
3.923.215.729.912.6
Local level drivers Mzimba Nkayi Changara
Rainfall (mm annual average) Densities - Human (2008, pers/km2) - Cattle (2008, head/km2)Soil fertility and land managementExtension support Market development
7005910
++++++
+
6002119++++++
650175+++
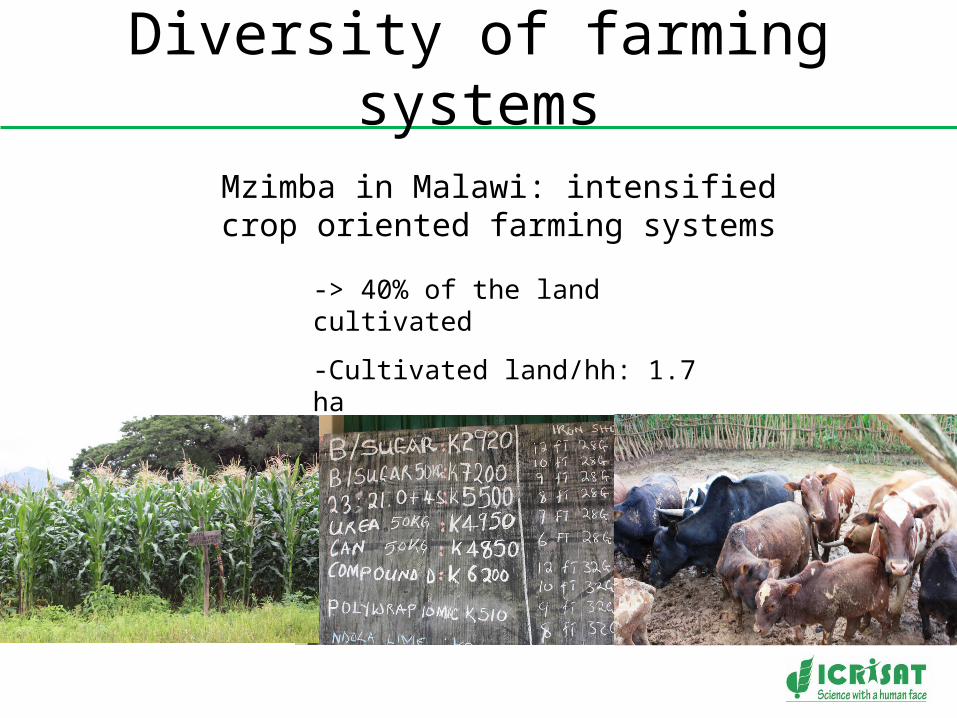
Diversity of farming systems
Mzimba in Malawi: intensified crop oriented farming systems
-> 40% of the land cultivated
-Cultivated land/hh: 1.7 ha
-Herd size: 1.9 TLU
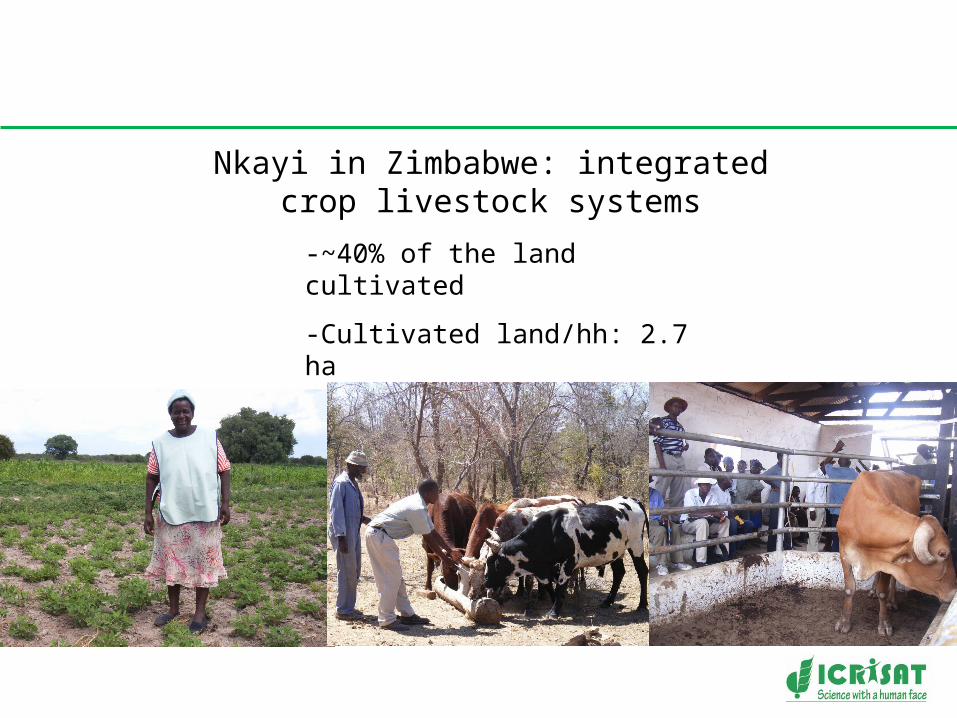
Nkayi in Zimbabwe: integrated crop livestock systems
-~40% of the land cultivated
-Cultivated land/hh: 2.7 ha
-Herd size: 3.9 TLU
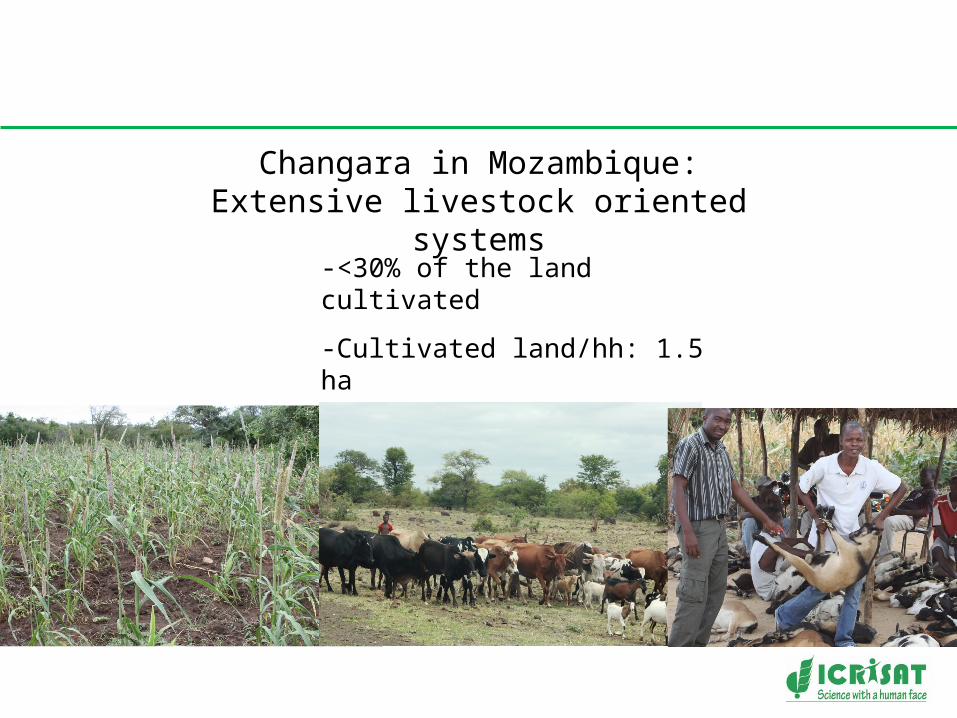
Changara in Mozambique: Extensive livestock oriented systems
-<30% of the land cultivated
-Cultivated land/hh: 1.5 ha
-Herd size: 3.6 TLU
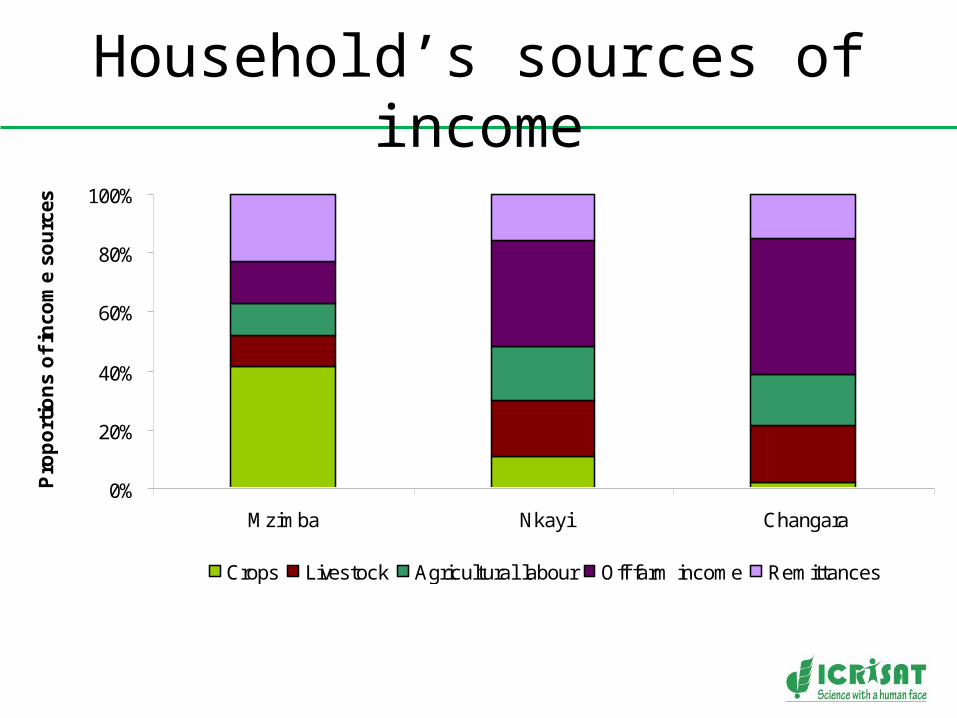
Household’s sources of income
0%
20%
40%
60%
80%
100%
Mzimba Nkayi Changara
Pro
po
rtio
ns
of
inco
me
sou
rces
Crops Livestock Agricultural labour Off farm income Remittances
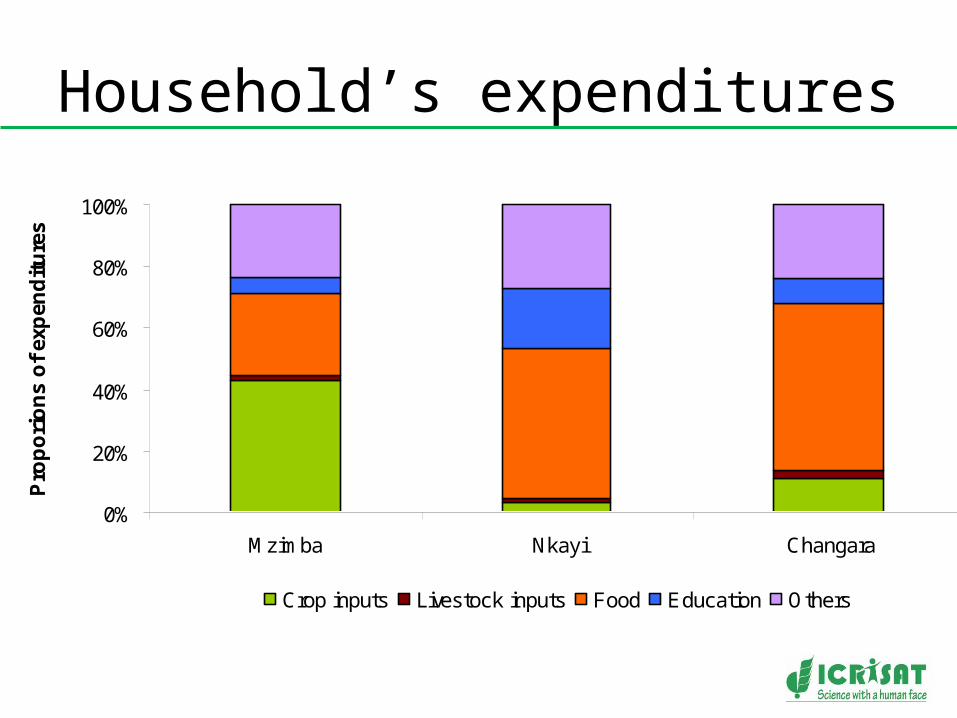
Household’s expenditures
0%
20%
40%
60%
80%
100%
Mzimba Nkayi Changara
Pro
po
rio
ns
of
exp
end
itu
res
Crop inputs Livestock inputs Food Education Others
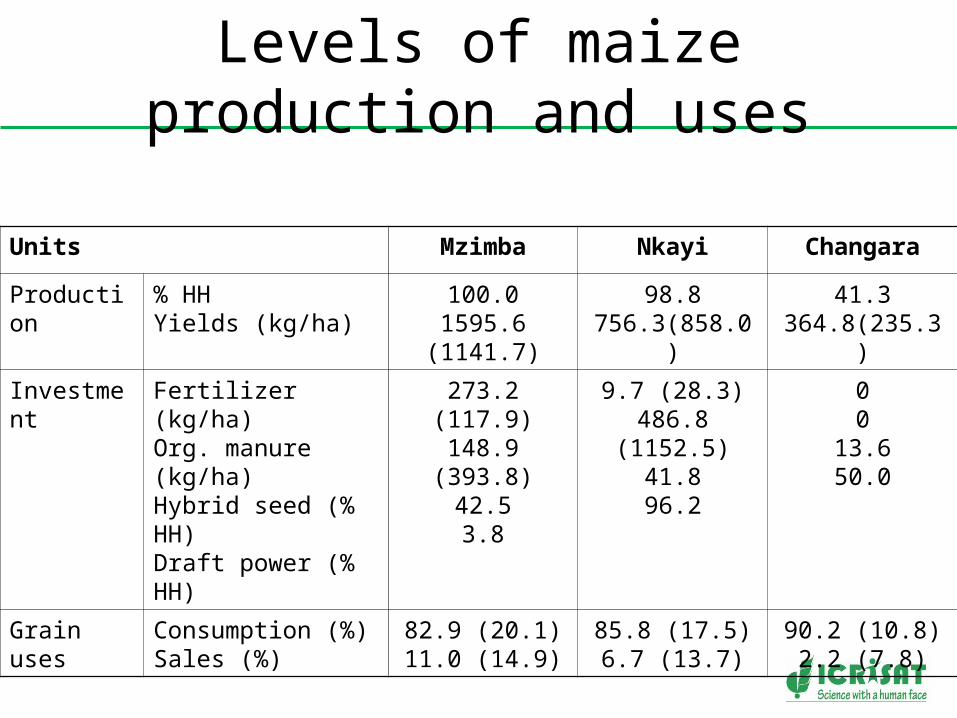
Levels of maize production and uses
Units Mzimba Nkayi Changara
Production % HHYields (kg/ha)
100.01595.6 (1141.7)
98.8756.3(858.0)
41.3364.8(235.3)
Investment Fertilizer (kg/ha)Org. manure (kg/ha)Hybrid seed (% HH)Draft power (% HH)
273.2 (117.9)148.9 (393.8)
42.53.8
9.7 (28.3)486.8 (1152.5)
41.896.2
00
13.650.0
Grain uses Consumption (%)Sales (%)
82.9 (20.1)11.0 (14.9)
85.8 (17.5)6.7 (13.7)
90.2 (10.8)2.2 (7.8)
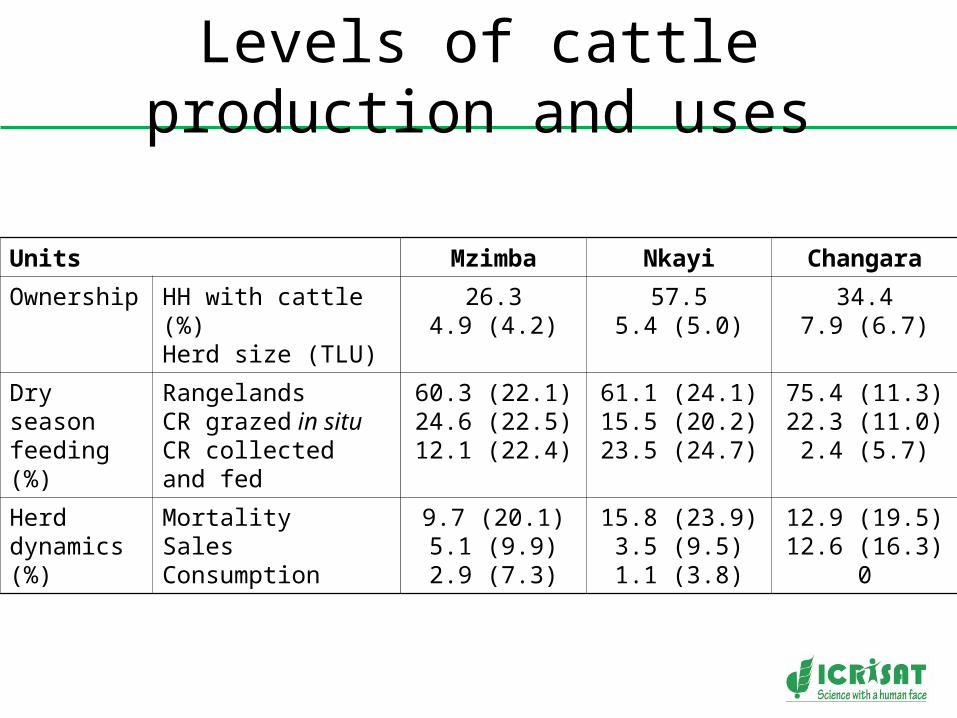
Levels of cattle production and uses
Units Mzimba Nkayi Changara
Ownership HH with cattle (%)Herd size (TLU)
26.34.9 (4.2)
57.55.4 (5.0)
34.47.9 (6.7)
Dry season feeding(%)
RangelandsCR grazed in situCR collected and fed
60.3 (22.1)24.6 (22.5)12.1 (22.4)
61.1 (24.1)15.5 (20.2)23.5 (24.7)
75.4 (11.3)22.3 (11.0)2.4 (5.7)
Herd dynamics(%)
MortalitySales Consumption
9.7 (20.1)5.1 (9.9)2.9 (7.3)
15.8 (23.9)3.5 (9.5)1.1 (3.8)
12.9 (19.5)12.6 (16.3)
0
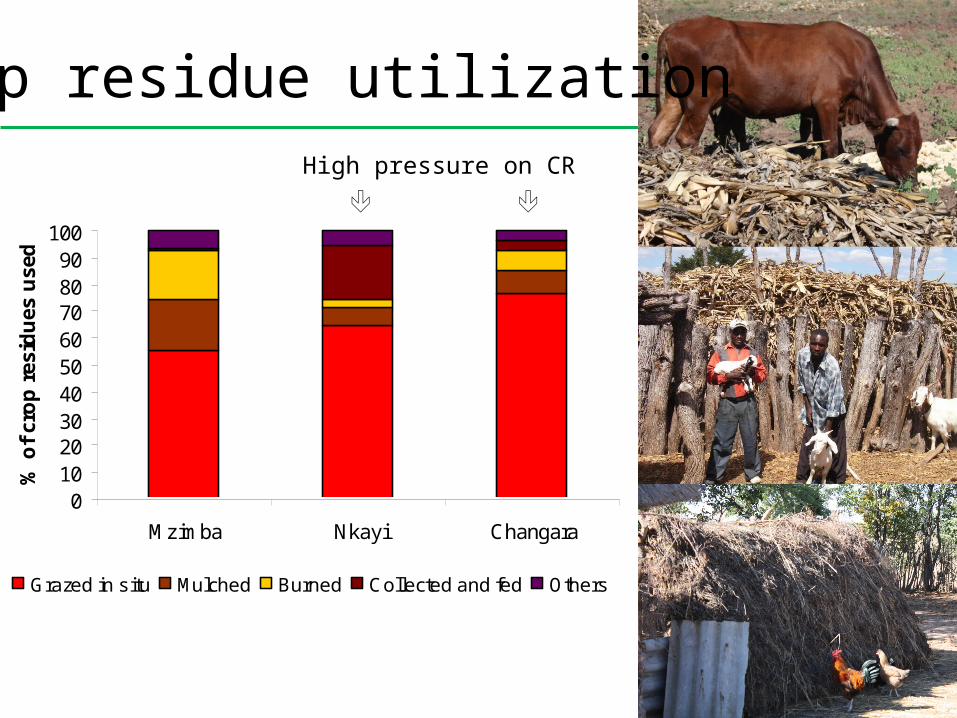
Crop residue utilization
0102030405060708090
100
Mzimba Nkayi Changara
% o
f cr
op
res
idu
es u
sed
Grazed in situ Mulched Burned Collected and fed Others
High pressure on CR
Site-specific opportunities and entry points for interventions
Mzimba: Greater integration of crop and livestock
Invest in the livestock sector – investments in inputs pay off
More efficient crop residue utilization –livestock feeding and soil amendment
Product market development - crops, livestock, feed
Nkayi: Strengthen crop livestock intensificationCost effective supply of crop and livestock inputs – lessons from Malawi
Feed technologies for higher biomass - dual purpose species, crop residue processing
Improve product markets - livestock to finance crop inputs; private sector engagement
Changara: Strong growth potential in livestockNational programs for crop and livestock production - infrastructure and service supply
Livestock market development and commercialization to enhance impact
Crop improvement to increase crop yields, biomass and feed quality
Conclusions• Extensive mixed crop livestock systems in southern Africa are a
function of the interplay of national drivers and local factors– Each site has its own opportunities and specific entry points for sustainable
forms of intensification.
• Lessons for R&D – Place farming systems analysis in the context of these drivers– Ensure that interventions are aligned with these influences– Address household resource endowments and farmers aspirations
• Work in progress – Farming systems typologies and household diversity– Technical, institutional and policy options and trade-offs– New approaches that combine stakeholder involvement with economic and
bio-physical modeling
Thank you!