cromwell european reit · this presentation shall be read in conjunction with cromwell european...
TRANSCRIPT

CROMWELLEUROPEAN REITRESULTS PRESENTATIONFOR THE THIRD QUARTER ENDED 30 SEPTEMBER 2018 AND THE FINANCIAL PERIOD FROM 30 NOVEMBER 2017 TO 30 SEPTEMBER 2018
14 November 2018

RESULTS PRESENTATION FOR THE THIRD QUARTER ENDED 30 SEPTEMBER 2018 AND THE FINANCIAL PERIOD FROM 30 NOVEMBER 2017 TO 30 SEPTEMBER 2018
2
Disclaimer
This presentation shall be read in conjunction with Cromwell European REIT’s (“CEREIT”) financial results announcement dated 14 November 2018 publishedon SGX Net.
This presentation is for information purposes only and does not constitute or form part of an offer, invitation or solicitation of any offer to purchase or subscribefor any securities of CEREIT in Singapore or any other jurisdiction nor should it or any part of it form the basis of, or be relied upon in connection with, anycontract or commitment whatsoever. The value of units in CEREIT (“Units”) and the income derived from them may fall as well as rise. The Units are notobligations of, deposits in, or guaranteed by Cromwell EREIT Management Pte. Ltd, as manager of CEREIT (the “Manager”), Perpetual (Asia) Limited (astrustee of CEREIT) or any of their respective affiliates. The past performance of CEREIT is not necessarily indicative of the future performance of CEREIT.
This presentation may contain forward-looking statements that involve risks and uncertainties. Actual future performance, outcomes and results may differmaterially from those expressed in forward-looking statements as a result of a number of risks, uncertainties and assumptions. These forward-lookingstatements speak only as at the date of this presentation. No assurance can be given that future events will occur, that projections will be achieved, or thatassumptions are correct. Representative examples of these factors include (without limitation) general industry and economic conditions, interest rate trends,cost of capital and capital availability, competition from similar developments, shifts in expected levels of property rental income, changes in operatingexpenses, including employee wages benefits and training, property expenses, governmental and public policy changes and the continued availability offinancing in the amounts and the terms necessary to support future business.
Prospective investors and unitholders of CEREIT (“Unitholders”) are cautioned not to place undue reliance on these forward-looking statements, which arebased on current view of the Manager on future events. No representation or warranty, express or implied, is made as to, and no reliance should be placed on,the fairness, accuracy, completeness or correctness of the information, or opinions contained in this presentation. None of the Manager, the trustee of CEREITor any of their respective advisors, representatives or agents shall have any responsibility or liability whatsoever (for negligence of otherwise) for any losshowsoever arising from any use of this presentation or its contents or otherwise arising in connection with this presentation. The information set out herein maybe subject to updating, completion, revision, verification and amendment and such information may change materially. An investment in Units is subject toinvestment risks, including possible loss of principal amount invested.
Unitholders have no right to request that the Manager redeem or purchase their Units while the Units are listed. It is intended that Unitholders may only deal intheir Units through trading on Singapore Exchange Securities Trading Limited (the “SGX-ST”). Listing of the Units on the SGX-ST does not guarantee a liquidmarket for the Units.
______________________
NOTES:
All figures in this presentation are as at 30 September 2018 and stated in Euro (“EUR”), unless otherwise stated

RESULTS PRESENTATION FOR THE THIRD QUARTER ENDED 30 SEPTEMBER 2018 AND THE FINANCIAL PERIOD FROM 30 NOVEMBER 2017 TO 30 SEPTEMBER 2018
3
Cromwell European REIT Investment Case – Focus on Yield and Growth
Effective 7.9% Annualised Distribution Yield (at current Unit price)1
Cromwell European REIT (“CEREIT”) successfully debuted on 30 November 2017 and has delivered above the IPO Forecast2
€1.4 billion Diversified and Balanced Pan-European Exposure 75 predominantly office and light industrial/logistics assets with significant scale
and diversification across approximately 1.2 million square metres net lettable area with over 700 tenants
Internationally recognised Sponsor and Real Estate Manager Cromwell Property Group (CMW.ASX) operates in 12 European countries with
over 200 real estate and finance professionalsOpportunities for Income and Net Asset Value Growth Increased resilience from enlarged portfolio size and enhanced geographical
diversification, from 5 countries to 7 countries, with the inclusion of Finland and Poland in the recent announced acquisition of 3 portfolios, as well as potential upside in reversionary yield5
European economic growth underpinning tenant demand and rental uplifts Active asset enhancement initiatives underway
Balanced Asset Class Exposure3
Diversified Geography Exposure3
43%
47%
10%
Light Industrial / LogisticsOfficeOthers
6%8%
23%
30%
33%
Denmark Germany France
Italy Netherlands4
______________________
1. Based on €0.545, the last traded price on Singapore Exchange Securities Trading Limited (“SGX-ST”) on 2nd November 2018.2. The Prospectus of CEREIT dated 22 November 2017 (“Prospectus”) disclosed a 1-month profit forecast for the period from 1
December 2017 to 31 December 2017 (“December 2017 Forecast”), and a full-year profit projection from 1 January 2018 to 31December 2018 (the “FY2018 Projection”). The FY2018 Projection disclosed in the Prospectus was derived from four separatequarterly projections which in aggregate formed the FY2018 Projection. The “IPO Forecast” figures referred to in this presentationwere, where not expressly disclosed in the Prospectus, derived from the December 2017 Forecast and the first, second and thirdquarterly projections for the period from 1 January 2018 to 30 September 2018 which had been used by the Manager to form theFY2018 Projection.
3. Based on valuations as at 31 March 2018 and 1 April 2018 (for Ivrea).4. Others include three government-let campuses, one retail property and one hotel in Italy on master lease.5. Subject to completion of the acquisition of 3 portfolios – see the announcement dated 30 October 2018 titled Announcement – (i)
Acquisition of a Portfolio of 16 Office Assets in Netherlands, Finland, and Poland; (ii) Acquisition of Two Office Assets in Italy; and(iii) Binding Offer to Acquire Four Logistics Assets and Option to Acquire One Retail Big Box in France

RESULTS PRESENTATION FOR THE THIRD QUARTER ENDED 30 SEPTEMBER 2018 AND THE FINANCIAL PERIOD FROM 30 NOVEMBER 2017 TO 30 SEPTEMBER 2018
4
1 Key Highlights
2 Financial Performance
4 Asset Management Update
5 Announced Proposed Acquisition of 3 Portfolios
Agenda
6 Key Takeaways and Priorities
3 Portfolio Overview and Investment Strategy
7 Appendix

Key Highlights

RESULTS PRESENTATION FOR THE THIRD QUARTER ENDED 30 SEPTEMBER 2018 AND THE FINANCIAL PERIOD FROM 30 NOVEMBER 2017 TO 30 SEPTEMBER 2018
6
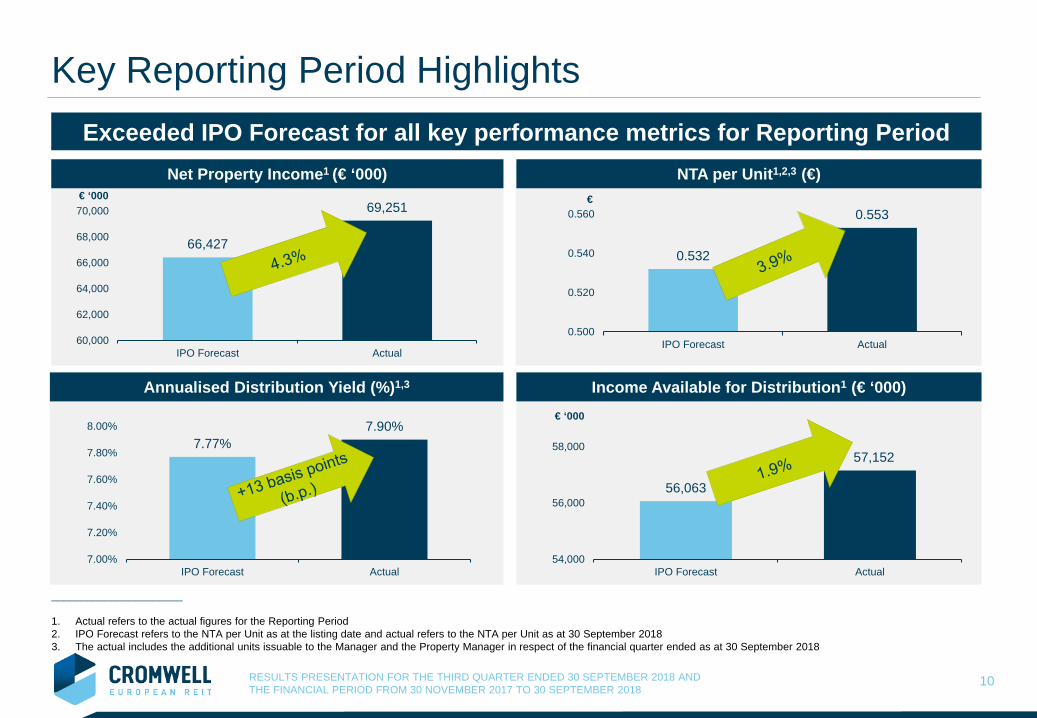
Key Reporting Period1 HighlightsOngoing focus on meeting and exceeding IPO Forecast2
Higher income, resulting in higher returns Gross revenue up 2.0%2
Net property income up 4.3%2
Total return attributable to Unitholders up 1.9%2
Annualised distribution yield of 7.9%3
Strong portfolio performance Portfolio occupancy is 89.6%4
Better leasing outcomes through “barbell approach” to portfolio management with growth provided by light industrial/logistics sector and stability provided by office sector
Robust balance sheet Aggregate leverage is 34.9%5
NTA is 55.3 Euro cents per unit6______________________
1. Reporting Period refers to the financial period from 30 November 2017 to 30 September 20182. As compared to amounts as stated in Prospectus dated 22 November 20173. Based on IPO Issue price of 55 Euro cents4. As compared to occupancy of 87.7% as stated in Prospectus5. Refers to “aggregate leverage” defined under the Property Funds Appendix as compared to the Prospectus pro-forma balance sheet aggregate leverage as at listing date stated at 36.8%6. As compared to NTA of 53.2 Euro cents as at listing date
RESULTS PRESENTATION FOR THE THIRD QUARTER ENDED 30 SEPTEMBER 2018 AND THE FINANCIAL PERIOD FROM 30 NOVEMBER 2017 TO 30 SEPTEMBER 2018
7
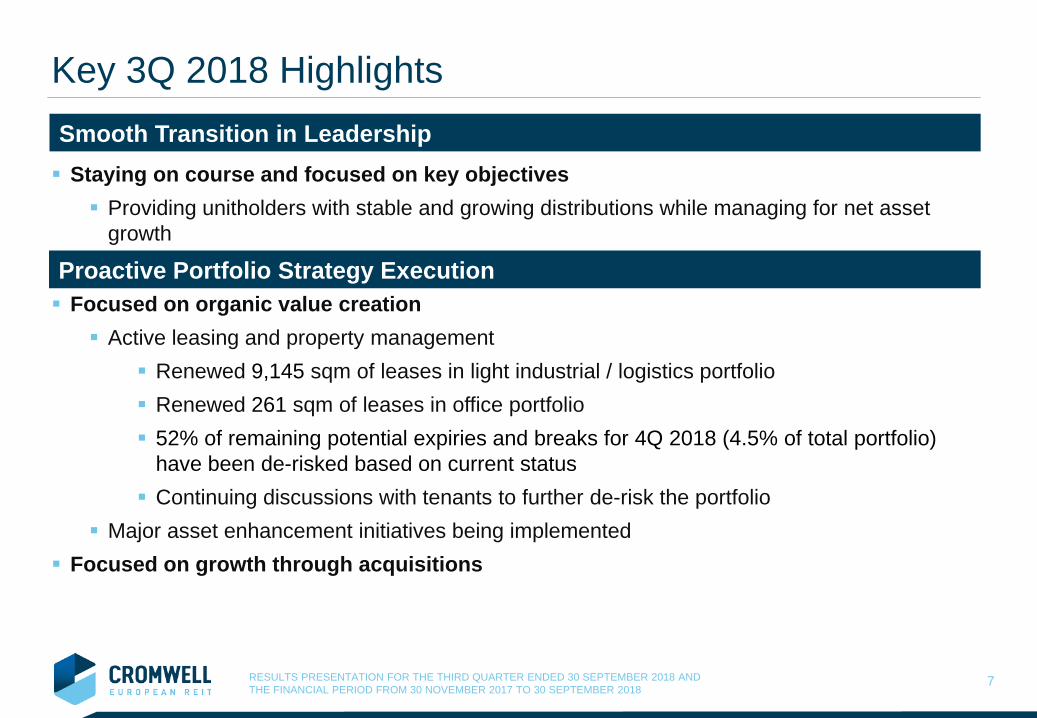
Smooth Transition in Leadership
Key 3Q 2018 Highlights
Focused on organic value creation Active leasing and property management
Renewed 9,145 sqm of leases in light industrial / logistics portfolio Renewed 261 sqm of leases in office portfolio 52% of remaining potential expiries and breaks for 4Q 2018 (4.5% of total portfolio)
have been de-risked based on current status Continuing discussions with tenants to further de-risk the portfolio
Major asset enhancement initiatives being implemented Focused on growth through acquisitions
Proactive Portfolio Strategy Execution
Staying on course and focused on key objectives Providing unitholders with stable and growing distributions while managing for net asset
growth

RESULTS PRESENTATION FOR THE THIRD QUARTER ENDED 30 SEPTEMBER 2018 AND THE FINANCIAL PERIOD FROM 30 NOVEMBER 2017 TO 30 SEPTEMBER 2018
8
Key 3Q 2018 HighlightsBest Practice Approach to Sustainability GRESB Sustainability Benchmark
In CEREIT’s inaugural Global Real Estate Sustainability Benchmark (“GRESB”) assessment, it achieved an overall score of 47 with encouraging results compared to its peer group in four of the seven categories, including ‘Building Certifications’, ‘Performance Indicators’, and ‘Risk and Opportunities’ The Manager was marked particularly highly in the ‘management’ category, scoring a
maximum of 100 points Building on the resilient sustainability framework of the sponsor Cromwell Property Group,
who has been reporting into GRESB since 2009 and is a GRESB member since 2012, CEREIT has adopted the target of achieving a minimum of 5% annual improvement on the 2018 baseline performance
Key Sustainability Initiatives Piazza Affari, Milan: Replacement and upgrades of the cooling and heating plants have an
estimated energy saving of 30%. The works will have a positive impact on the Energy Performance Certificate (“EPC”) improving the label from E to D CEREIT is currently conducting a Client Engagement Survey, and expects to publish
results by the end of Q1 2019

Financial Performance
RESULTS PRESENTATION FOR THE THIRD QUARTER ENDED 30 SEPTEMBER 2018 AND THE FINANCIAL PERIOD FROM 30 NOVEMBER 2017 TO 30 SEPTEMBER 2018
10
Net Property Income1 (€ ‘000)
Income Available for Distribution1 (€ ‘000)
0.532
0.553
0.500
0.520
0.540
0.560
IPO Forecast Actual
66,427
69,251
60,000
62,000
64,000
66,000
68,000
70,000
IPO Forecast Actual
€€ ‘000
56,063
57,152
54,000
56,000
58,000
IPO Forecast Actual
7.77%7.90%
7.00%
7.20%
7.40%
7.60%
7.80%
8.00%
IPO Forecast Actual
€ ‘000
______________________
1. Actual refers to the actual figures for the Reporting Period2. IPO Forecast refers to the NTA per Unit as at the listing date and actual refers to the NTA per Unit as at 30 September 20183. The actual includes the additional units issuable to the Manager and the Property Manager in respect of the financial quarter ended as at 30 September 2018
NTA per Unit1,2,3 (€)
Annualised Distribution Yield (%)1,3
Key Reporting Period HighlightsExceeded IPO Forecast for all key performance metrics for Reporting Period

RESULTS PRESENTATION FOR THE THIRD QUARTER ENDED 30 SEPTEMBER 2018 AND THE FINANCIAL PERIOD FROM 30 NOVEMBER 2017 TO 30 SEPTEMBER 2018
11
Total Return and Distribution Exceed IPO Forecast All key performance metrics exceed IPO Forecast for the Reporting Period
30-Nov-17 to 31-Mar-18
1-Apr-18 to 30-Jun-18
1-Jul-18 to 30-Sep-18
Total 30-Nov-17 to
30-Sep-18
IPO Forecast30-Nov-17
to 30-Sep-18Variance
Gross Revenue (€’000) 41,033 31,812 31,453 104,298 102,254 2.0%
Net Property Income (€’000) 27,004 20,739 21,508 69,251 66,427 4.3%
Net Income before tax and fair value changes (€’000) 21,014 16,103 16,956 54,073 53,313 1.4%Total return for the period attributable to Unitholders (€’000) 30,660 18,700 12,214 61,574 42,413 45.2%
Income Available for Distribution to Unitholders (€’000) 22,797 17,265 17,090 57,152 56,063 1.9%
Gross revenue €104.3 million since IPO, up 2.0% compared to IPO Forecast €31.5 million for 3Q 2018, up 1.6% compared to IPO Forecast for the same period
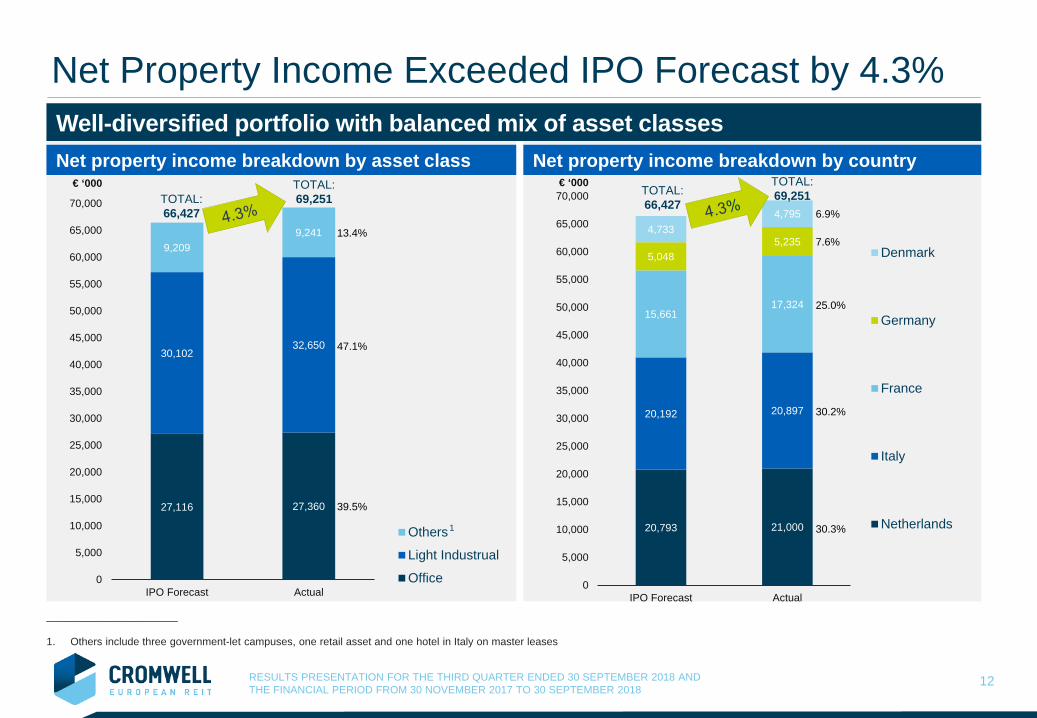
Net property income €69.3million since IPO, up 4.3% compared to IPO Forecast €21.5million for 3Q 2018, up 6.9% compared to IPO Forecast for the same period
Distributable income €57.2 million since IPO, equating to a DPU of 3.61 Euro cents, 1.9% above IPO Forecast Annualised distribution yield of 7.9% (based on the IPO issue price) €17.1 million for 3Q 2018 equating to DPU of 1.08 Euro cents, in line with the IPO Forecast for the same period
RESULTS PRESENTATION FOR THE THIRD QUARTER ENDED 30 SEPTEMBER 2018 AND THE FINANCIAL PERIOD FROM 30 NOVEMBER 2017 TO 30 SEPTEMBER 2018
12
27,116 27,360
30,10232,650
9,2099,241
0
5,000
10,000
15,000
20,000
25,000
30,000
35,000
40,000
45,000
50,000
55,000
60,000
65,000
70,000
IPO Forecast Actual
Others
Light Industrual
Office
20,793 21,000
20,192 20,897
15,66117,324
5,0485,235
4,7334,795
0
5,000
10,000
15,000
20,000
25,000
30,000
35,000
40,000
45,000
50,000
55,000
60,000
65,000
70,000
IPO Forecast Actual
Denmark
Germany
France
Italy
Netherlands
Net property income breakdown by asset class€ ‘000
TOTAL: 66,427
TOTAL: 69,251
Net property income breakdown by country€ ‘000
______________________
1. Others include three government-let campuses, one retail asset and one hotel in Italy on master leases
TOTAL: 66,427
TOTAL: 69,251
Well-diversified portfolio with balanced mix of asset classes
1
13.4%
47.1%
39.5%
6.9%
25.0%
30.3%
30.2%
7.6%
Net Property Income Exceeded IPO Forecast by 4.3%

RESULTS PRESENTATION FOR THE THIRD QUARTER ENDED 30 SEPTEMBER 2018 AND THE FINANCIAL PERIOD FROM 30 NOVEMBER 2017 TO 30 SEPTEMBER 2018
13
Balance Sheet Liquidity position remains strong
As at 30-Sep-18€’000
As at 30-Jun-18€’000 Variance
Current Assets 43,479 74,080 (41.3%)
Non-Current Assets 1,402,807 1,397,401 0.4%
TOTAL ASSETS 1,446,286 1,471,481 (1.7%)
Current Liabilities 38,059 47,960 (20.6%)
Non-Current Liabilities 536,103 525,621 2.0%
TOTAL LIABILITIES 574,162 573,581 0.1%
NET ASSETS ATTRIBUTABLE TO UNITHOLDERS 872,124 897,900 (2.9%)
Number of Units in Issue (‘000) 1,577,294 1,573,990 0.2%
NTA per Unit €0.553 € 0.570 (3.0%)
Aggregate leverage is 34.9% NTA is 55.3 Euro cents per unit Cash and cash equivalents stand at €33.9 million Distributable Income of €57.2 million for the Reporting Period, of which €39.9 million has been distributed

RESULTS PRESENTATION FOR THE THIRD QUARTER ENDED 30 SEPTEMBER 2018 AND THE FINANCIAL PERIOD FROM 30 NOVEMBER 2017 TO 30 SEPTEMBER 2018
14
Responsible Capital/Liquidity Management
______________________
1. Refers to “aggregate leverage” defined under the Property Funds Appendix (post distribution payment).2. Based on annualised Net Property Income as at 30 September 2018 (less property management fee payable in units) and net finance costs (excluding amortisation of debt issuance costs) over
the annualised interest as at 30 September 2018. Projected ICR as per IPO based on Projection Year 2018 Net Property Income and net finance costs.
Well-managed debt book delivering low debt cost and significant interest cover
As at 30-Sep-18 As per Prospectus Variance
Total Gross Debt €504.3 million €494.4 million + 2.0%
Proportion of Hedged and Fixed Rate Debt 84.4% 85.5% -110 bps
Aggregate Leverage1 34.9% 36.8% - 190 bps
Interest Coverage Ratio (“ICR”) 9.2x2 9.6x2 - 0.4x
Weighted Average Term to Maturity 3.1 years 4.0 years - 0.9 years
Aggregate leverage stands at 34.9%1, well below the regulatory requirement of 45.0% Annualised cost of debt stands at ~ 1.57% p.a. Interest coverage ratio is significant at 9.2x Embedded hedging arrangements allow CEREIT to take full advantage of negative interest rate environment
in the Eurozone, at the same time limiting hedge breakage costs in case of potential debt refinancing

RESULTS PRESENTATION FOR THE THIRD QUARTER ENDED 30 SEPTEMBER 2018 AND THE FINANCIAL PERIOD FROM 30 NOVEMBER 2017 TO 30 SEPTEMBER 2018
15
Debt Maturity Profile
283.72
95.0 82.443.2
0
50
100
150
200
250
300
2018 2019 2020 2021 2022 2023 2024 2025 2026
€ million
Asset Financing FacilitiesTotal: €461.1 million
Unsecured Revolving Credit Facility (Drawn)Total: €43.2 million
% ofTotalDebt
9% 56% 19% 16%
Weighted average term to maturity is 3.1 years1
______________________
1. Weighted average term to maturity is 3.1 years including the drawn portion of the Revolving Credit Facility (“RCF”). The RCF was upsized from €75.0 million to €100.0 million on the same terms.2. Expiring by November 2020 and the potential refinancing of these facilities is part of the ongoing assessment of the future capital (debt) structure of CEREIT.
• Italy - €150.0m• France - €50.0m• Netherlands - €57.5m• Denmark - €26.2m
Pan-European facility including Germany,
France and Netherlands
Fixed-rate loan against three core
assets in the Netherlands
Pan-European debt facilities are well-diversified across lenders and jurisdictions, allowing for full operationalflexibility
Weighted Average Debt Expiry (“WADE”) of 3.1 years as at 30 September 2018 reflects secured debtarrangements in the medium term

Portfolio Overview and Investment Strategy

RESULTS PRESENTATION FOR THE THIRD QUARTER ENDED 30 SEPTEMBER 2018 AND THE FINANCIAL PERIOD FROM 30 NOVEMBER 2017 TO 30 SEPTEMBER 2018
17
Portfolio Overview as at 30 September 2018
NetherlandsProperties 15Lettable Area (sqm) 206,304Valuation (€ million) 469.6% of Portfolio 33.7%Average Reversionary Yield 5.0%
FranceProperties 21Lettable Area (sqm) 332,959Valuation (€ million) 313.7% of Portfolio 22.6%Average Reversionary Yield 7.3%
Unique opportunity to invest in scale and diversification across EuropeDenmark
Properties 13Lettable Area (sqm) 151,490Valuation (€ million) 81.4% of Portfolio 5.8%Average Reversionary Yield 7.6%
Properties1 75
Occupancy Rate (by lettable area)1,2 89.6%
Valuation (€ million)3 1,390.4
WALE1 / WALB1 4.9 years / 4.0 years
% Freehold4 88%
Average Reversionary Yield3,5 5.9%
____________________
1. As at 30 September 20182. Assumes Milano Piazza Affari is 100% leased in view of the rental guarantee3. Valuations are as at 31 March 2018 and 1 April 2018 (for Ivrea)4. % Freehold and continuing / perpetual leasehold by value5. A proxy to present cap rate. Reversionary Yield provided by the external valuer is the net market rental value per annum (net of non-recoverable running costs and ground rent) payable on final reversion date expressed as a percentage
of the gross capital value. The Reversionary Yield for the portfolio and sub portfolios is an average Reversionary Yield weighted by the valuation.
GermanyProperties 11Lettable Area (sqm) 166,458Valuation (€ million) 107.8% of Portfolio 7.8%Average Reversionary Yield 6.4%
ItalyProperties 15Lettable Area (sqm) 308,766Valuation (€ million) 417.9% of Portfolio 30.1%Average Reversionary Yield 5.5%

RESULTS PRESENTATION FOR THE THIRD QUARTER ENDED 30 SEPTEMBER 2018 AND THE FINANCIAL PERIOD FROM 30 NOVEMBER 2017 TO 30 SEPTEMBER 2018
18
Total No. of Leases as at 30 September 2018 795
Total. No. of Tenants as at 30 September 2018 716
Tenant Retention Rate from 1 July 2018 to 30 September 20185 61%
High-Quality and Diversified Tenant Base Diversified tenant mix with top 10 tenants representing 40.4% of portfolio
Top 10 Tenants
# Tenant Country % of Total Headline Rent1
1 Agenzia del Demanio (Italian State Property Office) Italy 16.7%
2 Nationale-Nederlanden Netherlands 7.0%
3 Kamer van Koophandel Netherlands 3.0%
4 Holland Casino2 Netherlands 2.5%
5 Chicago Bridge & Iron Company (“CB&I”) Netherlands 2.3%
6 Anas Italy 2.1%
7 A. Manzoni & c. S.p.A.3 Italy 2.1%
8 Coolblue BV Netherlands 2.0%
9 LA POSTE (French Post) France 1.4%
10 Nilfisk-Advance A/S Denmark 1.3%
40.4%
18.2%
15.3%
9.7%
9.1%7.2%
6.9%
6.4%
5.2%
5.2%
4.8%4.2%
7.8%
Public Administration Wholesale - Retail
Financial - Insurance Manufacturing
Professional - Scientific Transportation - Storage
It - Communication Administrative
Entertainment Construction
Real Estate Others 4
Tenant trade sector breakdown by headline rent1
______________________
1. As at 30 September 20182. Nationale Stichting tot Exploitatie van Casinospelen in the Netherlands3. GEDI Gruppo Editoriale4. Others comprise Accommodation / Utility / Education / Rural / Human Health / Mining / Other Service Activities / Residential / Water / Miscellaneous Services5. Tenant retention rate by Estimated Rental Value (“ERV”) – is the % quantum of ERV retained over a reference period with respect to Terminable Leases. Terminable Leases is defined as leases that either expire or in
respect of which the tenant has a right to break over a relevant reference period. Q3 retention includes a sub-tenant taking a direct lease.
RESULTS PRESENTATION FOR THE THIRD QUARTER ENDED 30 SEPTEMBER 2018 AND THE FINANCIAL PERIOD FROM 30 NOVEMBER 2017 TO 30 SEPTEMBER 2018
19
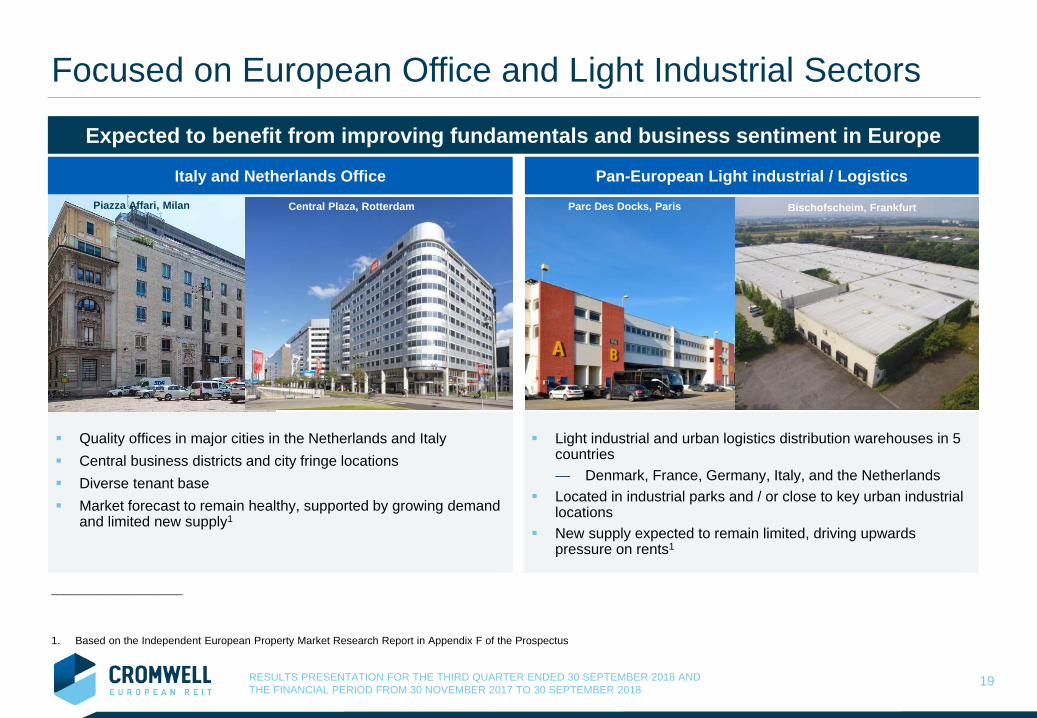
Focused on European Office and Light Industrial Sectors
Quality offices in major cities in the Netherlands and Italy Central business districts and city fringe locations Diverse tenant base Market forecast to remain healthy, supported by growing demand
and limited new supply1
Light industrial and urban logistics distribution warehouses in 5 countries— Denmark, France, Germany, Italy, and the Netherlands
Located in industrial parks and / or close to key urban industrial locations
New supply expected to remain limited, driving upwards pressure on rents1
Expected to benefit from improving fundamentals and business sentiment in Europe
Italy and Netherlands Office Pan-European Light industrial / LogisticsPiazza Affari, Milan Central Plaza, Rotterdam Parc Des Docks, Paris Bischofscheim, Frankfurt
______________________
1. Based on the Independent European Property Market Research Report in Appendix F of the Prospectus

Asset Management Update

RESULTS PRESENTATION FOR THE THIRD QUARTER ENDED 30 SEPTEMBER 2018 AND THE FINANCIAL PERIOD FROM 30 NOVEMBER 2017 TO 30 SEPTEMBER 2018
21
______________________
1. As compared to occupancy of 87.7% as stated in Prospectus; occupancy was 89.6% as at 30 September 20182. WALE is defined as weighted average lease expiry by headline rent based on the final termination date of the agreement (assuming the tenant does not terminate the lease on any of the
permissible break date(s), if applicable)3. WALB is defined as the weighted average lease break by headline rent based on the earlier of the next permissible break date at the tenant’s election or the expiry of the lease
6.5% 10.1% 8.0% 8.4%
67.0%
11.6% 11.7% 12.0% 10.9%
53.7%
2018 2019 2020 2021 2022 andBeyond
% by WALE % by WALB
[•]% of expiries and breaks have been extended
Occupancy driven higher due to stronger leasing outcomesPortfolio occupancy up 1.9 p.p. to 89.6%1
Better leasing outcomes through “barbell approach” to portfolio management with growth provided by lightindustrial/logistics sector and stability provided by office sector
Committed leases spanning over 1 million sqmStable WALE2
4.9-year WALE profile on a total portfolio basis as at 30 September 2018, with top 10 tenants also having a 4.7-yearWALE profile as at 30 September 2018
De-risking the portfolio As at the end of 3Q 2018, 52% of remaining potential expiries and breaks for 4Q 2018 (4.5% of total portfolio) have
been de-risked based on current statusLease expiry profile
3
4.5%11.5% 7.5% 9.1%
67.4%
4.5%15.5% 11.7% 12.5%
55.8%
2018 2019 2020 2021 2022 andBeyond
% by WALE % by WALB
52% of remaining expiries and breaks have been de-risked on current status

RESULTS PRESENTATION FOR THE THIRD QUARTER ENDED 30 SEPTEMBER 2018 AND THE FINANCIAL PERIOD FROM 30 NOVEMBER 2017 TO 30 SEPTEMBER 2018
22
______________________
1. Tenant retention rate by ERV – is the % quantum of ERV retained over a reference period with respect to Terminable Leases, defined as leases that either expire or in respect of which the tenanthas a right to break over a relevant reference period
2. Tenant reversion rate is defined by the fraction the numerator of which is the new headline rent of all modified, renewed or new leases over a reference period and the denominator of which is thesum of (i) the last passing rent with respect to the modified or renewed leases and (ii) the ERV with respect to new leases
3. Reflect total proportion of portfolio based on current valuation that is freehold and continuing / perpetual leasehold
Stable sector performance across Dutch and Italian office portfolios
30-Nov-17 to 31-Mar-18
1-Apr-18 to 30-Jun-18
1-Jul-18 to 30-Sep-18
Total 30-Nov-17 to
30-Sep-18
No. of New Leases Signed 2 5 - 7
No. of Leases Renewed 2 5 2 9
Tenant Retention Rate1 97% 85% 100% 89%
Total No. of Leases as at 30-Sep-18 68
Total. No. of Tenants as at 30-Sep-18 55
Reversion Rate2 -
% Freehold (on valuations) 3 76%
Generally stable performance across the office sector over the quarter and continuation of strong overallleasing outcomes for the Italian office portfolio since November 2017
Office Sector – Overview

RESULTS PRESENTATION FOR THE THIRD QUARTER ENDED 30 SEPTEMBER 2018 AND THE FINANCIAL PERIOD FROM 30 NOVEMBER 2017 TO 30 SEPTEMBER 2018
23
Occupancy WALE1 WALB2
30-Jun-18 30-Sep-18 Variance 30-Jun-18 30-Sep-18 Variance 30-Jun-18 30-Sep-18 Variance
Italy 98.3% 98.3% - 5.7 years 5.5 years (0.2) years 5.1 years 5.0 Years (0.1) years
Netherlands 94.3% 94.4% 0.1 p.p. 6.3 years 6.0 years (0.3) years 6.3 years 6.0 years (0.3) years
TOTAL 96.1% 96.1% - 6.0 years 5.8 years (0.2) years 5.8 years 5.6 years (0.2) years
Office Sector – Occupancies and Leases
Lease Expiry Profile
6.4% 0.2% 7.3% 11.8%
74.3%
6.4% 0.2% 8.0% 12.9%
72.6%
2018 2019 2020 2021 2022 andBeyond
% by WALE % by WALB
82% of remaining expiries and breaks have been de-risked on current status
Stable sector performance across Dutch and Italian office portfolios Key focus on Haagse Poort to mitigate the departure of CB&I across 3,295 sqm on 31 December 2018. On-
going discussions with Nationale-Nederlanden for expansion plans across this asset Finalisation of fit out for mezzanine floor at Piazza Affari expected in Q4 with current tenant, Be Consulting,
expanding into this space
______________________
1. WALE is defined as weighted average lease expiry by headline rent based on the final termination date of the agreement (assuming the tenant does not terminate the lease on any of thepermissible break date(s), if applicable)
2. WALB is defined as the weighted average lease break by headline rent based on the earlier of the next permissible break date at the tenant’s election or the expiry of the lease

RESULTS PRESENTATION FOR THE THIRD QUARTER ENDED 30 SEPTEMBER 2018 AND THE FINANCIAL PERIOD FROM 30 NOVEMBER 2017 TO 30 SEPTEMBER 2018
24
Office Sector – Leasing & Asset Enhancement InitiativesNetherlands Central Plaza, Rotterdam: New Coolblue lease for existing 9,796 sqm at a
headline rent of approximately €2 million comes into effect from 1 January 2019 for 7.5 years
Haagse Poort, The Hague: Upgrade of climate control commenced in Q3 2018 with completion in Q2 2019 at a total cost of €6.1 million over the period
Italy Piazza Affari, Milan: Works to replace and upgrade the cooling and heating
mechanical plants and install new multi-purpose pumps to commence in 4Q 2018 at an estimated cost of €0.6 million. Works are expected to drive considerable savings to building power consumption and costs for the tenants.
Piazza Affari, Milan: Refurbishment works across the mezzanine floor (approximately 850 sqm) on track with an expected completion in 4Q 2018
Milanofiori, Assago: Refurbishment works across the vacancy (c. 1100 sqm) completed in 3Q 2018
No. of Assets
Net Lettable Area Valuation Reversionary
Yield
Italy 9 102,551 sqm € 265,650,000 5.0%
Netherlands 5 123,990 sqm € 395,550,000 4.7%
TOTAL 14 226,541 sqm € 661,200,000 4.9%
Overview as at 30-Sep-18
______________________
1. As per CBRE press release dated 29th of May 2018

RESULTS PRESENTATION FOR THE THIRD QUARTER ENDED 30 SEPTEMBER 2018 AND THE FINANCIAL PERIOD FROM 30 NOVEMBER 2017 TO 30 SEPTEMBER 2018
25
30-Nov-17 to 31-Mar-18
1-Apr-18 to 30-Jun-18
1-Jul-18 to 30-Sep-18
Total 30-Nov-17 to
30-Jun-18
No. of New Leases Signed 26 36 17 79
No. of Leases Renewed 13 27 12 52
Tenant Retention Rate1 39% 53% 60% 50%
Total No. of Leases as at 30-Sep-18 716
Total. No. of Tenants as at 30-Sep-18 657
Reversion Rate2 5%
% Freehold (on valuations) 3 99%
Strong performance from light industrial portfolio
Light Industrial / Logistics Sector – Overview
______________________
1. Tenant retention rate by ERV – is the % quantum of ERV retained over a reference period with respect to Terminable Leases. Terminable Leases is defined as leases that either expire or inrespect of which the tenant has a right to break over a relevant reference period. Q3 retention includes a sub-tenant taking a direct lease.
2. Tenant reversion rate is defined by the fraction the numerator of which is the new headline rent of all modified, renewed or new leases over a reference period and the denominator of which isthe sum of (i) the last passing rent with respect to the modified or renewed leases and (ii) the ERV with respect to new leases.
3. Reflect total proportion of portfolio based on current valuation that is freehold and continuing / perpetual leasehold.
Light industrial portfolios in France and the Netherlands continue to deliver strong NPI performance withresults to Q3 of 10.6% and 15.5% above IPO Forecast respectively due to historical positive leasing activity.Germany’s light industrial portfolio is expected to provide further growth in NPI as the full impact of the newmajor lease at Gewerbe-und Logistikpark Stuttgart-Frickenhausen will be reflected in 4Q2018.

RESULTS PRESENTATION FOR THE THIRD QUARTER ENDED 30 SEPTEMBER 2018 AND THE FINANCIAL PERIOD FROM 30 NOVEMBER 2017 TO 30 SEPTEMBER 2018
26
4.3%24.5%
10.0% 9.7%
51.5%
4.3%
33.1%18.4% 16.1%
28.1%
2018 2019 2020 2021 2022 andBeyond% by WALE % by WALB
Light Industrial / Logistics Sector – Occupancies and Leases
Occupancy WALE WALB
30-Jun-18 30-Sep-18 Variance 30-Jun-18 30-Sep-18 Variance 30-Jun-18 30-Sep-18 Variance
Denmark 73.6% 73.6% - 2.4 years 2.4 years - 2.1 years 2.1 years -
France 86.3% 85.8% (0.5) p.p. 4.8 years 4.8 years - 1.8 years 2.0 years 0.2 years
Germany 80.7% 87.5% 6.8 p.p. 5.4 years 5.0 years (0.4) years 5.1 years 4.7 years (0.4) years
Italy 100.0% 100.0% - 4.1 years 3.9 years (0.2) years 4.1 years 3.9 years (0.2) years
Netherlands 93.3% 94.3% 1.1 p.p. 2.6 years 2.7 years 0.1 years 2.6 years 2.6 years -
TOTAL 83.8% 85.2% 1.4 p.p. 4.2 years 4.2 years - 2.5 years 2.6 years 0.1 years
Lease Expiry Profile
Light industrial portfolio in Germany benefited from better-than-expected leasing outcomes particularly inrelation to Stuttgart where the significant drop in vacancy experienced in Q2 was offset and enhanced by anew lease for over 13,000 sqm in Q3
Strong leasing performance from light industrial portfolio
15% of remaining expiries and breaks have been de-risked on current status

RESULTS PRESENTATION FOR THE THIRD QUARTER ENDED 30 SEPTEMBER 2018 AND THE FINANCIAL PERIOD FROM 30 NOVEMBER 2017 TO 30 SEPTEMBER 2018
27
Light Industrial / Logistics Properties Sector
No. of Assets
Net Lettable Area Valuation Reversionary
Yield
Denmark 13 151,490 sqm € 81,402,000 7.6%
France 21 332,959 sqm € 313,650,000 7.3%
Germany 11 166,458 sqm € 107,800,000 6.4%
Italy 1 29,638 sqm € 12,300,000 6.8%
Netherlands 10 82,314 sqm € 74,000,000 6.4%
TOTAL 56 762,859 sqm € 589,152,000 7.0%
Overview as at 30-Sep-18
France Parc du Bois du Tambour, Nancy Gondreville: enhancement works related to a
new major lease of c. €1.5m are continuing with an expected completion in 4Q 2018
Germany Gewerbepark Duisburg, Duisburg: enhancement works related to a new major
lease of c. € 1.0m were completed during the quarter with the space handed over to two tenants for occupation
Gewerbepark Duisburg, Duisburg: New lease signed across 4,262 sqm at a headline rent of approximately €205,000
Gewerbe-und Logistikpark Stuttgart-Frickenhausen: Major lease signed across 13,204 sqm mitigating the drop in vacancy for this asset across Q2 at a headline rent of approximately €650,000
Denmark Priorparken 800, Brondby: signed a new lease with the existing sub tenant for
approximately 8,169 sqm at a headline rent of approximately €500,000
Naverland 8, Glostrup: new lease signed across 1,040 sqm at a headline rent of approximately €65,000
Leasing & Asset Enhancement Initiatives

Announced Proposed Acquisition of 3 Portfolios

29
Announced Proposed Acquisition of 3 Portfolios
Financing € 224.1 million from rights issue Remaining from debt financing
Rights Issue
38 Rights Units for every 100 Units held € 0.373 for each Rights Unit 31.6% discount to closing price of € 0.545 on 30 October 2018 25.0% discount to theoretical ex-rights price (“TERP”) of € 0.498
Undertaking for Cromwell Singapore Holdings Pte Ltd and its related corporations to subscribe 35.31% Tang Gordon @ Tang Yigang, Celine Tang @ Chen Huaidan and Hillsboro Capital, Ltd. to sub-underwrite
245,420,360 Rights Units(2)
Underwritten by UBS, DBS, Morgan Stanley and Daiwa
Notes:(1) Net Initial Yield means the average of the Independent Valuers’ annualised current passing rental income net of non-recoverable property expenses, divided by the Property Purchase Price(2) This is made up of the GTCT Base Sub-Underwriting Units of 82,908,770 Rights Units; GTCT Additional Sub-Underwriting Units of 24,329,000 Rights Units; Hillsboro Base Sub-Underwriting Units of
69,091,590 Rights Units; and Hillsboro Additional Sub-Underwriting Units of 69,091,000 Rights Units. GTCT refers to Tang Gordon @ Tang Yigang and Celine Tang @ Chen Huaidan
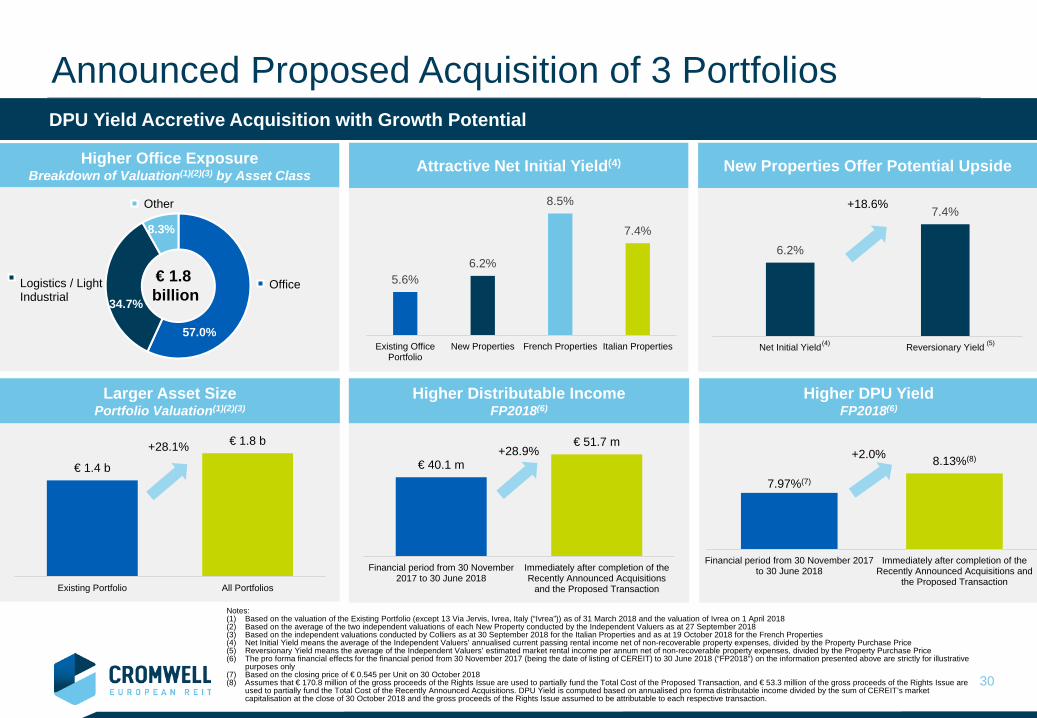
On 30 October 2018 CEREIT announced proposed Acquisition of 3 portfolios with 23 properties to be funded by rights issue and debt financing
2 office properties
Purchase Price: € 37.5 million Net Initial Yield(1): 7.4%
4 logistics properties and 1 DIY home improvement centre
Purchase Price: € 34.4 million Net Initial Yield(1): 8.5%
16 predominantly office properties in the Netherlands, Finland and Poland
Purchase Price: € 312.5 million Net Initial Yield(1): 6.2% Subject to Unitholders’ approval
1. New Properties 2. French Properties 3. Italian Properties
Total Purchase Price: € 384.4 million
1. New Properties 2. French Properties 3. Italian Properties
30
€ 1.4 b
€ 1.8 b
Existing Portfolio All Portfolios
Announced Proposed Acquisition of 3 Portfolios
+28.1%€ 40.1 m
€ 51.7 m
Financial period from 30 November2017 to 30 June 2018
Immediately after completion of theRecently Announced Acquisitions
and the Proposed Transaction
7.97%(7)
8.13%(8)
Financial period from 30 November 2017to 30 June 2018
Immediately after completion of theRecently Announced Acquisitions and
the Proposed Transaction
Larger Asset SizePortfolio Valuation(1)(2)(3)
Higher Office ExposureBreakdown of Valuation(1)(2)(3) by Asset Class
Notes:(1) Based on the valuation of the Existing Portfolio (except 13 Via Jervis, Ivrea, Italy (“Ivrea”)) as of 31 March 2018 and the valuation of Ivrea on 1 April 2018(2) Based on the average of the two independent valuations of each New Property conducted by the Independent Valuers as at 27 September 2018(3) Based on the independent valuations conducted by Colliers as at 30 September 2018 for the Italian Properties and as at 19 October 2018 for the French Properties(4) Net Initial Yield means the average of the Independent Valuers’ annualised current passing rental income net of non-recoverable property expenses, divided by the Property Purchase Price(5) Reversionary Yield means the average of the Independent Valuers’ estimated market rental income per annum net of non-recoverable property expenses, divided by the Property Purchase Price(6) The pro forma financial effects for the financial period from 30 November 2017 (being the date of listing of CEREIT) to 30 June 2018 (“FP2018”) on the information presented above are strictly for illustrative
purposes only(7) Based on the closing price of € 0.545 per Unit on 30 October 2018(8) Assumes that € 170.8 million of the gross proceeds of the Rights Issue are used to partially fund the Total Cost of the Proposed Transaction, and € 53.3 million of the gross proceeds of the Rights Issue are
used to partially fund the Total Cost of the Recently Announced Acquisitions. DPU Yield is computed based on annualised pro forma distributable income divided by the sum of CEREIT’s market capitalisation at the close of 30 October 2018 and the gross proceeds of the Rights Issue assumed to be attributable to each respective transaction.
DPU Yield Accretive Acquisition with Growth Potential
+28.9% +2.0%
Higher Distributable Income FP2018(6)
Higher DPU YieldFP2018(6)
OfficeLogistics / Light Industrial
Other
€ 1.8 billion
57.0%
34.7%
8.3%
5.6%6.2%
8.5%
7.4%
Existing OfficePortfolio
New Properties French Properties Italian Properties
Attractive Net Initial Yield(4)
6.2%
7.4%
Net Initial Yield Reversionary Yield
+18.6%
New Properties Offer Potential Upside
(4) (5)

31
CEREIT Post Acquisitions
The NetherlandsProperties 17Lettable Floor Area (sq m) 260,205Valuation (€ million) 596.5% of Portfolio (by Valuation) 33.5%
FranceProperties 26Lettable Floor Area (sq m) 375,527Valuation (€ million) 350.4% of Portfolio (by Valuation) 19.7%
DenmarkProperties 13Lettable Floor Area (sq m) 151,490Valuation (€ million) 81.4% of Portfolio (by Valuation) 4.6%
Properties 98
Lettable Floor Area (sq m) 1,385,990
Occupancy Rate(1)(2) (by Lettable Floor Area) 88.7%
Valuation(3) (€ million) 1,780.5
WALE(4) / WALB(4) 4.9 / 4.1 years
% Freehold(5) 90.4%
Notes:(1) Occupancy rate as at 30 June 2018 for Existing Portfolio; 31 August 2018 for New Properties excluding Willemsplein 2; and 1 September 2018 for Willemsplein 2(2) Assumes Milano Piazza Affari is 100% leased in view of the rental guarantee(3) Valuation as at 31 March 2018 for Existing Portfolio except Ivrea; 1 April 2018 for Ivrea; 27 September 2018 for New Properties; 30 September 2018 for Italian Properties; and 19 October 2018 for
French Properties(4) WALE as at 30 June 2018 for Existing Portfolio; 31 August 2018 for New Properties, French Properties, and Italian Properties(5) % Freehold and continuing / perpetual leasehold by value
GermanyProperties 11Lettable Floor Area (sq m) 166,458Valuation (€ million) 107.8% of Portfolio (by Valuation) 6.1%
ItalyProperties 17Lettable Floor Area (sq m) 335,977Valuation (€ million) 455.4% of Portfolio (by Valuation) 25.6%
FinlandProperties 11Lettable Floor Area (sq m) 61,972Valuation (€ million) 116.8% of Portfolio (by Valuation) 6.5%
PolandProperties 3Lettable Floor Area (sq m) 34,362Valuation (€ million) 72.1% of Portfolio (by Valuation) 4.0%
Unique opportunity to invest in scale and diversification across Europe
New Countries

Key Takeaways and Priorities

RESULTS PRESENTATION FOR THE THIRD QUARTER ENDED 30 SEPTEMBER 2018 AND THE FINANCIAL PERIOD FROM 30 NOVEMBER 2017 TO 30 SEPTEMBER 2018
33
Key Results Takeaways
Experienced real estate team is executing on asset strategy and delivering operating results aboveforecasts
Increased resilience from enlarged portfolio size and enhanced geographical diversification, from 5countries to 7 countries, with the inclusion of Finland and Poland in the recently announced acquisition of 3portfolios, as well as potential upside in reversionary yield
Stable office sector with 100% tenant retention rate, whilst leasing in light industrial in France andNetherlands has increased WALE/ WALB over the quarter
______________________
1. Refers to aggregate leverage as at 30 September 2018
Consistently Exceeding IPO Forecast Distributable Income per Unit of 3.61 Euro cents for the Reporting Period is 1.9% above IPO Forecast Outperformed all key performance metrics
Providing resilient income through diversified and well-leased up portfolio
Responsible capital management Aggregate leverage ratios to remain well below the regulatory requirement of 45%, currently at 34.9%1
Prudent hedging strategies to minimise exposure to market volatility and maximise risk-adjusted returns toUnitholders

RESULTS PRESENTATION FOR THE THIRD QUARTER ENDED 30 SEPTEMBER 2018 AND THE FINANCIAL PERIOD FROM 30 NOVEMBER 2017 TO 30 SEPTEMBER 2018
34
Active engagement with investors to further promote CEREIT’s performance Organic growth of the IPO Portfolio Inflation-linked leases provide built-in rental-growth mechanism Active leasing and asset enhancements to further improve portfolio occupancy
Increase occupancy in the IPO Portfolio Decrease of non-recoverables Increase of net property income margin
Inorganic growth for the future Deep pool of acquisition opportunities including those accessed through the Sponsor’s extensive pan-
European platform
Key Management Priorities for the Year Ahead
Providing clear visibility for investors to our path to growth
Delivering on IPO Forecast through effective business strategy execution Meeting and exceeding IPO Forecast Onboarding the €384.4 million acquisition1 of 3 portfolios and driving up the occupancy and net operating
income of CEREIT, as per the valuers’ assessment of reversionary yield of 7.4% from current net initialyield of 6.2%
Unlocking asset value through proactive approach to acquisitions and divestments
______________________
1. The proposed acquisition of 16 properties in the Netherlands, Finland and Poland is subject to unitholders’ approval at the Extraordinary General Meeting to be held on 15 November 2018

Appendix

Portfolio Overview and Outlook by Country
______________________
NOTE: All figures are as at 30 September 2018 unless otherwise stated
• Netherlands• Italy• France• Germany • Denmark• Poland• Finland
Appendix A

RESULTS PRESENTATION FOR THE THIRD QUARTER ENDED 30 SEPTEMBER 2018 AND THE FINANCIAL PERIOD FROM 30 NOVEMBER 2017 TO 30 SEPTEMBER 2018
37
Portfolio Overview – The NetherlandsOccupancy
(as at 30 September 2018) NPI1 (€ million) Last Valuation (as at 31 March 2018)
Weighted Reversionary Yield(as at 31 March 2018)
Number of Leases (as at 30 September 2018)
94.4% 21.0 469.6 5.0% 240
______________________
1. For the Reporting Period

RESULTS PRESENTATION FOR THE THIRD QUARTER ENDED 30 SEPTEMBER 2018 AND THE FINANCIAL PERIOD FROM 30 NOVEMBER 2017 TO 30 SEPTEMBER 2018
38
Indicator 2018 2019 2020 Outlook (vs
2019)GDP 2.8% 1.7% ↘
Industrial Production 0.1% 1.0% ↗
Consumer Prices, average 1.7% 1.8% ↗
Population (000s) 17,249 17,343 ↗
Population 0.6% 0.5% ↗
Unemployment Rate 4.8% 4.6% ↗
Annual % change unless specified
Netherlands – Office Market Outlook
GDP growth in 2018 is expected to reach 2.8% underpinned by solid domestic conditions.
With unemployment at 4.8%, the tight labour market should support further wage growth.
The strong recovery in the housing market is beginning to raise concerns about whether the market is heading for a correction.
The supportive fiscal policies as more capital is invested in to education, defence and social security.
Occupier activity slowed over the summer due to the lack of good quality space which is hampering higher levels of take-up, although 582,000 sq.m was let or sold (for owner occupation) in H1. Nationwide vacancy has fallen to 12.1% (Q2 2018) – this includes some structural vacancy that is being worked through with the continued conversion of older office stock into alternative uses.
New deliveries are not compensating for the loss, so overall stock levels are declining with many regional governments still pursuing restrictive policies. The lack of space has put pressure on those occupiers wanting to expand and/or upgrade their office accommodation as rents are under upward pressure as incentives are slowly being pared back.
The scarcity of supply is more prevalent in the larger cities of Amsterdam, Utrecht and Eindhoven. Companies with larger requirements in particular, are encountering difficulties in finding suitable relocation options and so demand, to some extent, is being redirected to locations that can offer larger floorplates such as Amstelveen, Hoofddorp and Amersfoort.
The office market, historically the most sought after by investors, has been surpassed by residential trading volumes in 2018, driven mainly by the shortage of supply in the office sector as investors look to place capital.
€3.08 billion was invested into the Dutch office market in H1 2018. The G5 markets (Amsterdam, the Hague, Utrecht, Rotterdam and Eindhoven) remain popular (58% of deals) but as product dries up in the better locations interest increases in alternative locations. Yields have stabilised over the last quarter but have tightened over the last 12 months.
The favourable economic indicators and robust real estate fundamentals continue to support an active Dutch market for both occupiers and investors, leading to supply pressures and, with strong demand, yields are seeing further compression.
Cities such as Arnhem, Breda, Den Bosch, Zwolle and Amersfoort will become more attractive as product in the larger cities is harder to come by and, with pricing tightening over the last two years or so, these locations can still satisfy the appetite for yield and balance out some investor risk. Secondary (fringe, Grade A) areas where yields are 5.00% and prime major provincial towns (5.75%) still hold a premium over the prime CBD areas of key cities where yields are as low as 3.75%.
Companies seeking larger floorplates are, in particular, experiencing difficulties in finding suitable space to meet their needs. With demand outweighing supply positive rental growth in some locations will become more evident. Amsterdam, for example, is expected to see 5% p.a growth over the next two years, indicating the peak of the cycle is not yet near.
Economic growth is supporting the expansion of small and medium sized firms who are looking for additional office space. Energy-efficient buildings are likely to fare better and tenants are coming round to the realisation that they will need to pay a premium for it, and are prepared to do so.
Sources: Colliers – Sector Update August 2018
Savills – Netherlands Market In Minutes August 2018Real Capital Analytics
Oxford Economics - Country Economic Forecast Netherlands 10 September 2018
0
5,000
10,000
15,000
20,000
25,000
Retail Office Industrial
Hotel Dev Site Apartment
Netherlands Investment Volumes (€ mn)Real Estate Market
Economy Outlook

RESULTS PRESENTATION FOR THE THIRD QUARTER ENDED 30 SEPTEMBER 2018 AND THE FINANCIAL PERIOD FROM 30 NOVEMBER 2017 TO 30 SEPTEMBER 2018
39
Netherlands – Logistics/Industrial Market Outlook
Economy
Netherlands Investment Volumes (€ mn) Overall demand levels for industrial space continues apace with H1 2018 seeing 915,300
sq.m of take-up, surpassing those of the comparative period in 2017. Significant demand drivers are still the strong expansion of e-commerce alongside retailers restructuring their supply chains, looking for efficiency gains and/or positioning themselves as truly omni-channel platforms to service ever demanding consumers.
The primary logistics hubs of Tilburg, Venlo and Eindhoven are suffering from a lack of available built space, as well as, a limited number of development plots. Interest in secondary locations for opportunities is rising as a result. The local municipalities of Tiel, Zaltbommel, Haarlemmermeer (Schiphol) and Bleiswijk are releasing more land parcels for development where developers are starting construction on a speculative basis but space is often absorbed with relative ease as demand spills over.
Build-to-suit is a popular route to market as healthy levels of occupier take-up have eroded levels of quality supply and with development lagging, there is not enough suitable space. Declines in the volume of occupier activity were noted and higher levels of take-up are simply being hindered by the lack of suitable space.
€1.12 billion was invested into the Dutch industrial sector in H1 2018. This lags H1 2017, however the market is still active, with a weight of capital looking for opportunities despite the yield compression that has taken place over the last few years. The Dutch industrial sector is an attractive proposition for both domestic and international capital supported by a stable political environment, good infrastructure and a favourable tax framework.
Demand is expected to remain healthy for logistics space as e-commerce continues to go from strength to strength. Currently there is notable interest in large warehouses, but overtime, as time to market becomes even more important, this is expected to shift to urban distribution centres. While e-commerce penetration is still low (9.7% of the total retail industry in 2017), it is almost twice as much as it was five years ago.
Robust demand, a national vacancy rate of below 4% and limited new deliveries are contributing to a positive rental growth environment. However, land and construction costs have risen, and developers need to be careful not price themselves out of the market as competition is slowly intensifying providing more choice for occupiers.
Foreign and domestic capital are targeting the industrial sector. H1 2018 saw local buyers responsible for 44% of acquisitions, double that of the 22% in 2017. European investors (ex domestic Dutch) accounted for 24% of H1 trading volumes while truly global money accounted for 23% over the same period.
Supply continues to dry up and is not yet being counterbalanced by new completions. Following a period of decreasing yields, a further compression is expected but the pace will slow as yields are already at historic lows across the main logistics hot spots. Alongside this, investors’ focus are likely to increasingly shift to core+ investment opportunities.
Real Estate Market
Outlook
0
5,000
10,000
15,000
20,000
25,000
Retail Office Industrial
Hotel Dev Site Apartment
Sources: Colliers – Sector Update August 2018
Savills – Netherlands Market In Minutes August 2018Real Capital Analytics
Oxford Economics - Country Economic Forecast Netherlands 10 September 2018
GDP growth in 2018 is expected to reach 2.8% underpinned by solid domestic conditions.
Trade tensions and slowing global trade have impacted German factories which will have a knock on effect on their Dutch suppliers.
With unemployment at 4.8%, the tight labour market should support further wage growth.
The supportive fiscal policies as more capital is invested in to education, defence and social security.
Indicator 2018 2019 2020 Outlook (vs
2019)GDP 2.8% 1.7% ↘
Industrial Production 0.1% 1.0% ↗
Consumer Prices, average 1.7% 1.8% ↗
Population (000s) 17,249 17,343 ↗
Population 0.6% 0.5% ↗
Unemployment Rate 4.8% 4.6% ↗
Annual % change unless specified
RESULTS PRESENTATION FOR THE THIRD QUARTER ENDED 30 SEPTEMBER 2018 AND THE FINANCIAL PERIOD FROM 30 NOVEMBER 2017 TO 30 SEPTEMBER 2018
40
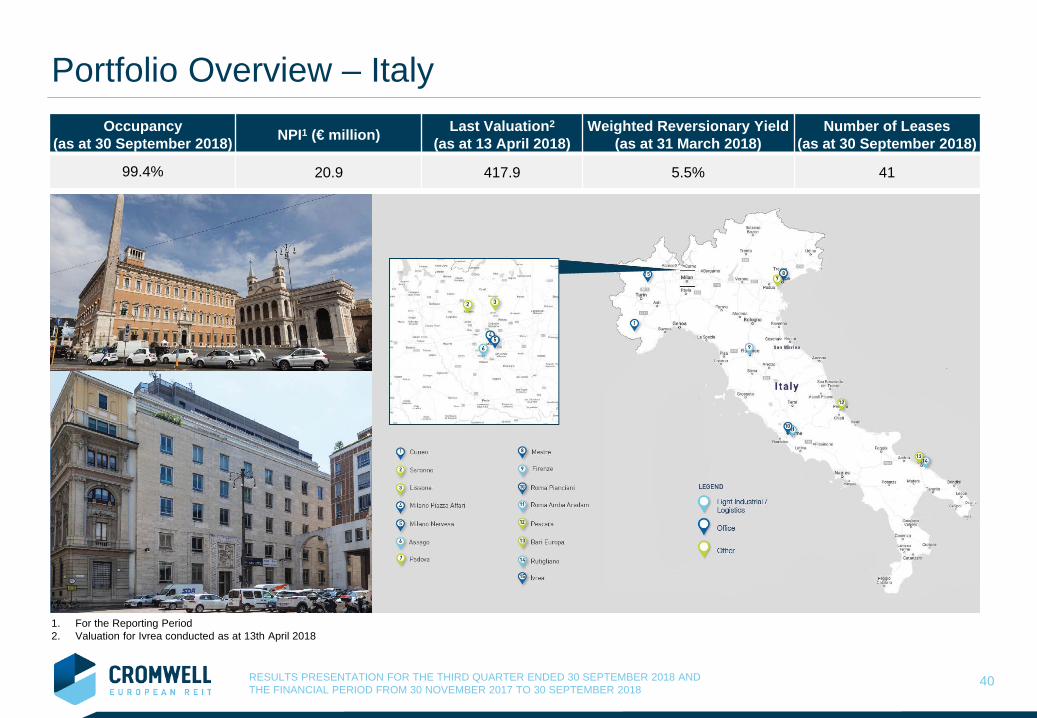
Portfolio Overview – Italy
______________________
1. For the Reporting Period2. Valuation for Ivrea conducted as at 13th April 2018
Occupancy (as at 30 September 2018) NPI1 (€ million) Last Valuation2
(as at 13 April 2018)Weighted Reversionary Yield
(as at 31 March 2018)Number of Leases
(as at 30 September 2018)
99.4% 20.9 417.9 5.5% 41
RESULTS PRESENTATION FOR THE THIRD QUARTER ENDED 30 SEPTEMBER 2018 AND THE FINANCIAL PERIOD FROM 30 NOVEMBER 2017 TO 30 SEPTEMBER 2018
41
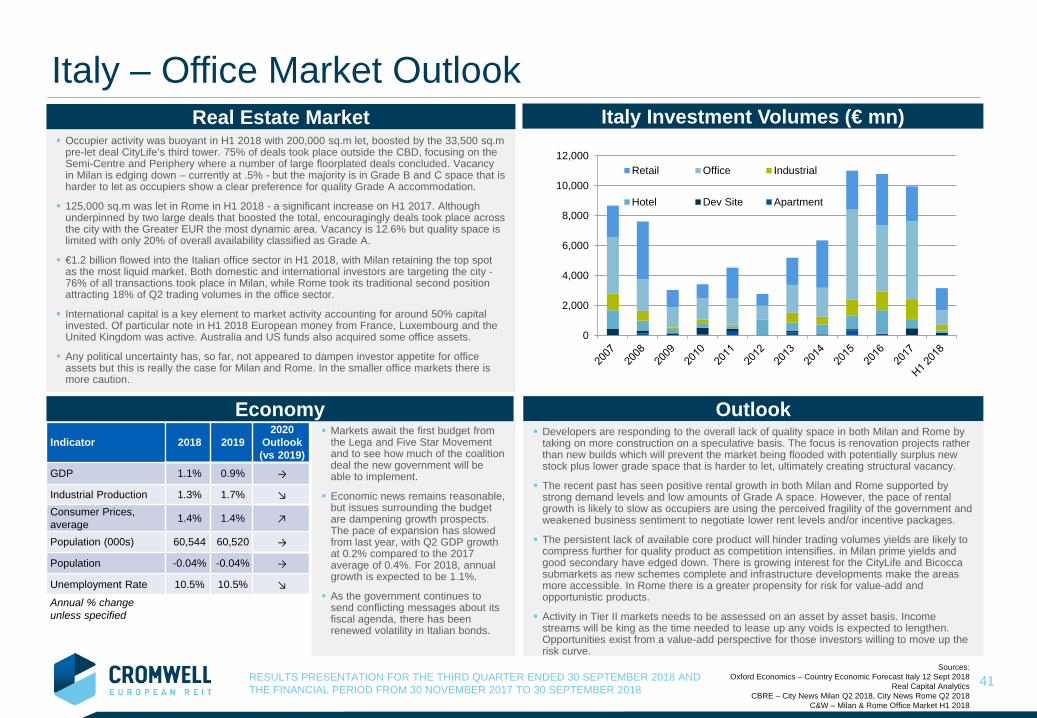
Italy – Office Market OutlookReal Estate Market Italy Investment Volumes (€ mn)
Outlook Markets await the first budget from
the Lega and Five Star Movement and to see how much of the coalition deal the new government will be able to implement.
Economic news remains reasonable, but issues surrounding the budget are dampening growth prospects. The pace of expansion has slowed from last year, with Q2 GDP growth at 0.2% compared to the 2017 average of 0.4%. For 2018, annual growth is expected to be 1.1%.
As the government continues to send conflicting messages about its fiscal agenda, there has been renewed volatility in Italian bonds.
Indicator 2018 20192020
Outlook (vs 2019)
GDP 1.1% 0.9% →
Industrial Production 1.3% 1.7% ↘Consumer Prices, average 1.4% 1.4% ↗
Population (000s) 60,544 60,520 →
Population -0.04% -0.04% →
Unemployment Rate 10.5% 10.5% ↘
Annual % change unless specified
Occupier activity was buoyant in H1 2018 with 200,000 sq.m let, boosted by the 33,500 sq.m pre-let deal CityLife’s third tower. 75% of deals took place outside the CBD, focusing on the Semi-Centre and Periphery where a number of large floorplated deals concluded. Vacancy in Milan is edging down – currently at .5% - but the majority is in Grade B and C space that is harder to let as occupiers show a clear preference for quality Grade A accommodation.
125,000 sq.m was let in Rome in H1 2018 - a significant increase on H1 2017. Although underpinned by two large deals that boosted the total, encouragingly deals took place across the city with the Greater EUR the most dynamic area. Vacancy is 12.6% but quality space is limited with only 20% of overall availability classified as Grade A.
€1.2 billion flowed into the Italian office sector in H1 2018, with Milan retaining the top spot as the most liquid market. Both domestic and international investors are targeting the city -76% of all transactions took place in Milan, while Rome took its traditional second position attracting 18% of Q2 trading volumes in the office sector.
International capital is a key element to market activity accounting for around 50% capital invested. Of particular note in H1 2018 European money from France, Luxembourg and the United Kingdom was active. Australia and US funds also acquired some office assets.
Any political uncertainty has, so far, not appeared to dampen investor appetite for office assets but this is really the case for Milan and Rome. In the smaller office markets there is more caution.
Developers are responding to the overall lack of quality space in both Milan and Rome by taking on more construction on a speculative basis. The focus is renovation projects rather than new builds which will prevent the market being flooded with potentially surplus new stock plus lower grade space that is harder to let, ultimately creating structural vacancy.
The recent past has seen positive rental growth in both Milan and Rome supported by strong demand levels and low amounts of Grade A space. However, the pace of rental growth is likely to slow as occupiers are using the perceived fragility of the government and weakened business sentiment to negotiate lower rent levels and/or incentive packages.
The persistent lack of available core product will hinder trading volumes yields are likely to compress further for quality product as competition intensifies. in Milan prime yields and good secondary have edged down. There is growing interest for the CityLife and Bicocca submarkets as new schemes complete and infrastructure developments make the areas more accessible. In Rome there is a greater propensity for risk for value-add and opportunistic products.
Activity in Tier II markets needs to be assessed on an asset by asset basis. Income streams will be king as the time needed to lease up any voids is expected to lengthen. Opportunities exist from a value-add perspective for those investors willing to move up the risk curve.
Sources: Oxford Economics – Country Economic Forecast Italy 12 Sept 2018
Real Capital AnalyticsCBRE – City News Milan Q2 2018, City News Rome Q2 2018
C&W – Milan & Rome Office Market H1 2018
Economy
0
2,000
4,000
6,000
8,000
10,000
12,000Retail Office Industrial
Hotel Dev Site Apartment

RESULTS PRESENTATION FOR THE THIRD QUARTER ENDED 30 SEPTEMBER 2018 AND THE FINANCIAL PERIOD FROM 30 NOVEMBER 2017 TO 30 SEPTEMBER 2018
42
Portfolio Overview – FranceOccupancy
(as at 30 September 2018) NPI1 (€ million) Last Valuation (as at 31 March 2018)
Weighted Reversionary Yield(as at 31 March 2018)
Number of Leases (as at 30 September 2018)
85.8% 17.3 313.7 7.3% 341

RESULTS PRESENTATION FOR THE THIRD QUARTER ENDED 30 SEPTEMBER 2018 AND THE FINANCIAL PERIOD FROM 30 NOVEMBER 2017 TO 30 SEPTEMBER 2018
43
The Greater Paris region recorded a healthy 1.36 million sq.m of occupier activity over the first six months of 2018. This was not only a 15% increase on H1 2017 but the best performance the office sector has seen since 2007.
Office vacancy fell to 5.6% across the Greater Paris region and to around 2.5% within the city proper, tipping the market even further in favour of landlords, supporting the withdrawal of incentives and supporting positive rental growth. Some occupiers are deciding to exchange Central Paris for the capital’s suburbs where rents are lower and choices are more, although not necessarily plentiful – a trend that will slow the recent CBD rent rises.
Investment wise H1 2018 was exceptional for the French market with €13.4 bn transacted, although a proportion of this was the conclusion of several large deals - 35 deals in excess of €100 million. The office sector was, overwhelmingly, the sector of choice, accounting for 64% of investor activity, equivalent to €8.5 billion in H1. Paris and the Greater Paris region was the most active capturing almost 90% of trading volumes in H1.
Domestic investors are important (55%) but international capital also has a significant role to play in the office sector. Across H1, European investors accounted for 24%, while truly global capital was 21%. US investors were particularly active (€1.5 bn) and Asian capital continued to increase its exposure to French real estate with South Korean Hyundai Investments purchasing the Balthazar building in Saint-Denis for €252 mn. The weight of capital which is outweighing opportunities has compressed yields to historic lows of 3.00% in Paris’ CBD and to between 3.90% - 4.50% in key regional cities such as Lyon, Lille, Nice and Nantes.
Vacancy is at its lowest since 2009 and pre-let deals are rising due to the lack of space. This is of particular note in Greater Paris where construction is restrained leading to 51% of the current 2.4 mn sq.m under development due for completion by the end of 2021 pre-let.
The breadth and depth of occupiers against a low vacancy rate has seen a positive upswing in headline rents, especially in Paris, over the last 12 months – an attraction of the French market as while yields are low, investors can see capital value growth materialise via positive rental growth.
Paris will retain the top spot for French investment for both domestic and international capital, underpinned by the size of the market, good levels of liquidity and large lot sizes. Prime yields will remain under pressure for large assets, although the tipping point appears to be for lots in excess of €200 mn where demand begins to peter.
Investors are trying to find their way in a competitive market where borrowing costs are exceptionally low and an ECB rate rise is not expected before late 2019 and will undoubtedly proceed very gradually. Investors seeking higher yields will look to key regional cities such as Lille, Nice, Nates and Lyon although yields here too have come under pressure as investors willing to take on some more, albeit measured risk, that these smaller markets can offer look for deals.
France – Office Market OutlookReal Estate Market France Investment Volumes (€ mn)
Outlook GDP growth slowed to 0.2% in Q2
reflecting a drop-off in exceptional items such as aircraft sales and the impact of higher taxes and inflation on consumer purchasing power.
Business sentiment has been dented by concerns about new US tariffs on steel and the potential for a further escalation in tensions continues to drag on export orders.
Solid employment - 350,000 new jobs created in 2017 - saw unemployment drop in Q2 to 8.7%. However, labour market improvements have not yet led to significant upward pressure on wages.
Indicator 2018 20192020
Outlook (vs 2019)
GDP 1.6% 1.7% →
Industrial Production 1.1% 1.6% →Consumer Prices, average 1.9% 1.5% ↘
Population (000s) 67,358 67,597 ↗
Population 0.3% 0.4% ↗
Unemployment Rate 8.6% 8.1% ↘
Annual % change unless specified
Sources: Oxford Economics – Country Economic Forecast France 27 September 2018
Real Capital AnalyticsBNP Paribas - At A Glance Investment in France H1 2018
BNP Paribas – At A Glance Regional office market H1 2018JLL – The Office Market in the Greater Paris Region H1 2018
Economy
0
5,000
10,000
15,000
20,000
25,000
30,000
35,000
40,000
45,000Retail Office Industrial
Hotel Dev Site Apartment

RESULTS PRESENTATION FOR THE THIRD QUARTER ENDED 30 SEPTEMBER 2018 AND THE FINANCIAL PERIOD FROM 30 NOVEMBER 2017 TO 30 SEPTEMBER 2018
44
70% of take-up was for Grade A space, reconfirming occupier enthusiasm for good quality, functional yet flexible space, allowing companies to introduce new processes in terms of both mechanisation and robotics to current workflows with limited disruption.
Given the strength of performance in 2016 and 2017, Paris has seen a notable drop off in activity as a large number of requirements have been fulfilled. There is still demand but for now rents are likely to stabilise. However, considering the volume of deals in the pipeline the blip is only expected to be temporary and 2019 should see a pick-up in activity.
There is restrained supply in the regional hubs of Lyon, Lille and Marseille along the French logistics axis and with development lagging, pending authorisations and the challenges of redeveloping brownfield sites, there is room for an uplift in rental values. This is supported by the need, by retailers in particular, to supplement their supply chains with urban logistics schemes in order to satisfy the ever shorter delivery times demanded by consumers.
There is restricted land supply in the Greater Paris region partly linked to major infrastructure projects such as the Grand Paris project and the 2024 Olympics. All this has led to some rental increases in the more sought-after logistics zones, and have also contributed to maintaining rents in secondary locations. Incentives are slowly being withdrawn – particularly for quality space.
France – Logistics/Industrial Market Outlook
Economy
France Investment Volumes (€ mn) 1.5 mn sq.m of occupier activity was recorded in H1 2018 - down on 2017 which was a
record breaking year. Retailers are particularly active as they continue to reposition their real estate looking for efficiency gains and portfolio optimisation, with some choosing to outsource the logistics element to specialists, supporting levels of activity.
Despite a slow down in activity along the north-south axis (apart from Lyon) this remains the core of the French industrial sector accounting for 60% (870,000 sq.m) of H1 take-up.
The shortage of sought-after large prime assets combined with healthy, record breaking take-up in recent years, has strengthened investor confidence in the underlying fundamentals of the French market. This has renewed developer confidence as well and H1 2018 was characterised by an increase in construction starts despite the consequential rise in availability to 3.4 mn sq.m nationwide, of which half is Grade A as at June 2018.
A number of large portfolios sales such as the six property portfolio sold by Tristan Capital Partners to Gramercy for €175 mn, contributed to the €1.5 bn that transacted in the French industrial sector in H1 2018.
The appetite of foreign investors is evident with involvement in 75% of all deals since the beginning of 2018 with US funds leading, although Germany and UK investors were active too. The weight of capital targeting core and core + is outweighing product, compressing prime yields to historic lows, evidenced by the continued compression (25 bps) of prime distribution yields to 4.50% over Q2 2018.
Sources: Oxford Economics – Country Economic Forecast France 27 September 2018
Real Capital AnalyticsBNP Paribas – At A Glance Warehouses In France Q2 2018
CBRE – France Logistics Q2 2018
Real Estate Market
Outlook
0
5,000
10,000
15,000
20,000
25,000
30,000
35,000
40,000
45,000Retail Office Industrial
Hotel Dev Site Apartment
Indicator 2018 20192020
Outlook (vs 2019)
GDP 1.6% 1.7% →
Industrial Production 1.1% 1.6% →Consumer Prices, average 1.9% 1.5% ↘
Population (000s) 67,358 67,597 ↗
Population 0.3% 0.4% ↗
Unemployment Rate 8.6% 8.1% ↘
Annual % change unless specified
GDP growth slowed to 0.2% in Q2 reflecting a drop-off in exceptional items such as aircraft sales and the impact of higher taxes and inflation on consumer purchasing power.
Business sentiment has been dented by concerns about new US tariffs on steel and the potential for a further escalation in tensions continues to drag on export orders.
Solid employment - 350,000 new jobs created in 2017 - saw unemployment drop in Q2 to 8.7%. However, labour market improvements have not yet led to significant upward pressure on wages.

RESULTS PRESENTATION FOR THE THIRD QUARTER ENDED 30 SEPTEMBER 2018 AND THE FINANCIAL PERIOD FROM 30 NOVEMBER 2017 TO 30 SEPTEMBER 2018
45
Portfolio Overview – GermanyOccupancy
(as at 30 September 2018) NPI1 (€ million) Last Valuation (as at 31 March 2018)
Weighted Reversionary Yield(as at 31 March 2018)
Number of Leases (as at 30 September 2018)
87.5% 5.2 107.8 6.4% 54
______________________
1. For the Reporting Period

RESULTS PRESENTATION FOR THE THIRD QUARTER ENDED 30 SEPTEMBER 2018 AND THE FINANCIAL PERIOD FROM 30 NOVEMBER 2017 TO 30 SEPTEMBER 2018
46
As some pent up demand is satisfied, availability will continue to fall as replacement space lags take-up. While this will continue to support some rental growth, it will also hold back higher levels of take-up as occupiers continue to face a lack of choice when looking at alternative accommodation options, especially those in expansion mode.
The solid fundamentals in the occupational market are feeding the positivity surrounding the investment sector which is expected to be lively over the remainder of 2018. Global headwinds appear not to have deterred investor appetite for German real estate, indeed quite the opposite with Germany a large market offering liquidity and an element of security not found is some other European markets.
However, with prime yields at historic lows across the main investment markets, careful due diligence is needed with acknowledgement that rental growth will be the most likely element of capital value growth as opposed to yield compression.
Tier I locations will continue to attract the bulk of interest with the smaller Tier II locations possibly seeing a decline in activity, unable to offer an adequate volume of larger lots that many investors are looking for. Four buyer groups account for 55% of deals; special-purpose funds (19%); pension funds (12.4%); investment/asset managers (12.3%); REITs/Listed real estate companies (11.5%). The breadth of investor type emphasises the positive attitude to German real estate.
Germany – Office Market Outlook Germany Investment Volumes (€ mn)
OutlookIndicator 2018 2019 2020
Outlook (vs 2019)
GDP 1.8% 1.6% ↘
Industrial Production 1.9% 1.9% ↘
Consumer Prices, average
1.9% 1.8% →
Population (000s) 83,042 83,263 ↗
Population 0.4% 0.3% ↗
Unemployment Rate 5.2% 4.9% ↗
Annual % change unless specified
Investor sentiment is positive with €11 bn traded in H1 2018 underpinned by the strong real estate fundamentals. Tier I locations such as Berlin, Frankfurt, Munich, Hamburg, Dusseldorf, Stuttgart and Cologne, continue to attract capital with an 85% deal share in H1. Frankfurt took the top spot, just edging Munich into second place. Most deals (90%) are single asset investments due to the lack of portfolios being brought to the market.
Domestic capital remains a key element but international investors are significant too with a 40% share - once again skewed to the ‘safer-haven’ markets of Germany’s top locations. Despite the weight of capital looking for a home and competing for the limited product coming to the market, yields held firm in Q2 2018 but have declined over the past twelve months to historic lows in most locations. Investors appear to have accepted the expense of buying German offices, and for some, acts as the counterbalance to diversifying to some more risky markets.
Employment continues to grow with a positive impact on the real estate market, although some companies are reporting challenges in securing the right space, in the right location and at the right price for their needs. This is shifting some of the demand to either more peripheral locations of the Tier I cities or more central locations of Tier II cities.
1.85 mn sq.m was let in H1 2018 and with robust demand and measured construction the nationwide vacancy rate is around 5%. No surprise that this continues to support rental rises, although the pace of growth is showing signs of slowing as occupier tolerance is tested.
Sources: Oxford Economics – Country Economic Forecast Germany 8 October 2018
Real Capital AnalyticsBNP Paribas – Office Market Germany Q2 2018
BNP Paribas – Office Investment Market Germany Q2 2018
Real Estate Market
Economy Q3 GDP growth slowed to 0.2% as
mounting pressure from a slowing, albeit temporary, automotive sector, weaker global trade and rising protectionism took their toll on the Germany economy. Indications are already for a pick-up in industry in Q4 and an easing in headwinds, maintaining the 1.8% growth forecast for 2018.
Domestic demand is robust supported by strong wage and employment growth. The performance of the labour market has been one of the stand-out features of this cycle with employment growth steady at 1.3% y/y in August as unemployment falls to a new record low of 5.1% in September.
0
10,000
20,000
30,000
40,000
50,000
60,000
70,000
80,000Retail Office Industrial
Hotel Dev Site Apartment

RESULTS PRESENTATION FOR THE THIRD QUARTER ENDED 30 SEPTEMBER 2018 AND THE FINANCIAL PERIOD FROM 30 NOVEMBER 2017 TO 30 SEPTEMBER 2018
47
The breadth of investors with a solid interest in the German logistics sector continues apace, with demand outweighing supply and competition strong for the limited number of core product, further yield compression at the prime end of the market is likely. A rising number of investors will begin to look up the risk curve in search of yield, diversifying by investigating options in Tier II and III locations and value-add products as well.
Occupiers continue to focus on wanting to occupy new, efficient space. However, one of the lingering challenges in the German industrial market is the lack of good quality space meeting the needs of today’s occupiers. This is true on a multiple levels including location, size and fit-out. There is 690,000 sq.m in the pipeline, but with 75% of this already under pre-let agreements, upon completion only a limited amount of speculative space will be delivered. This is seeing a trend in owner occupiers developing out their own space as they seek a quicker route to market in a scheme suitable to their needs.
Everything points to demand remaining lively over the rest of the year. Both the current economic environment and the ongoing restructuring, particularly in the retail sector, are boosting the demand for additional logistics and warehouse space. The shortage of space and land, particularly in the major locations, may have a limiting effect however. Nevertheless there is a realistic chance that the 6 million sq.m mark (of occupier activity) will be exceeded for the third time in a row, although it remains to be seen whether a new record can be achieved as several major deals would be necessary for this to happen.
Germany – Industrial Market Outlook Real Estate Market
Economy
Germany Investment Volumes (€ mn)
Outlook
International capital has traditionally been very comfortable with German real estate and H1 2018 has not been an exception. Of the €3 bn invested 75% of activity this year (to June) is attributed to foreign investors with Asian and North American players particularly interested. The strong demand for space, fuelled by the dynamic growth in e-commerce on the one hand, and by the strong economic situation on the other, played important roles.
The weight of capital looking for a home in German real estate, plus the lack of product coming to the market have seen yields compress over the last twelve months to today’s historic lows in the majority of locations. The lowest yield is in Munich at 4.50%, with all the remaining significant logistics locations ranging from 4.60% in Frankfurt to 4.90% in Leipzig.
Robust demand for industrial space characterised Q1 2018 and Q2 has not disappointed. The first six months of 2018 was record breaking for the German occupational market with close to 3.4 mn sq.m let across warehousing and logistics space (including owner occupier and leasing deals). This is 5% above the comparative period in 2017.
A salient factor supporting the robust levels of occupier activity is still the transformation in the retail sector as the growth in e-commerce marches on, reflected in the corresponding rise in demand for logistics space. 36% of take-up was generated by companies in the distribution/logistics sector with retail a comfortable second accounting for 31% of take-up as they reconfigure their supply chain in order to satisfy the ever increasing demands of consumers. Manufacturing companies took the third spot with 19% of take-up.
Sources: Oxford Economics – Country Economic Forecast Germany 8 October 2018
Real Capital AnalyticsBNP Paribas - Logistics Market Germany Q2 2018
JLL – Logistics and Industrial Market Overview Q2 2018
0
10,000
20,000
30,000
40,000
50,000
60,000
70,000
80,000Retail Office Industrial
Hotel Dev Site Apartment
Indicator 2018 2019 2020 Outlook (vs 2019)
GDP 1.8% 1.6% ↘
Industrial Production 1.9% 1.9% ↘
Consumer Prices, average
1.9% 1.8% →
Population (000s) 83,042 83,263 ↗
Population 0.4% 0.3% ↗
Unemployment Rate 5.2% 4.9% ↗
Annual % change unless specified
Q3 GDP growth slowed to 0.2% as mounting pressure from a slowing automotive sector, weaker global trade and rising protectionism took their toll on the Germany economy. Indications are for a pick-up in industry in Q4 and an easing in headwinds, maintaining the 1.8% growth forecast for 2018.
The automotive sector had a stronger than anticipated headwind with Q3 production down sharply which was scaled back linked to slowing demand and the failure to fully comply with new standards for emission tests. The effect is expected to be transitory, but given the importance of the sector and its associated supply chain in Germany, it weighed heavily on industrial production.

RESULTS PRESENTATION FOR THE THIRD QUARTER ENDED 30 SEPTEMBER 2018 AND THE FINANCIAL PERIOD FROM 30 NOVEMBER 2017 TO 30 SEPTEMBER 2018
48
Portfolio Overview – DenmarkOccupancy
(as at 30 September 2018) NPI1 (€ million) Last Valuation (as at 31 March 2018)
Weighted Reversionary Yield(as at 31 March 2018)
Number of Leases (as at 30 September 2018)
73.6% 4.8 81.4 7.6% 119
______________________
1. For the Reporting Period

RESULTS PRESENTATION FOR THE THIRD QUARTER ENDED 30 SEPTEMBER 2018 AND THE FINANCIAL PERIOD FROM 30 NOVEMBER 2017 TO 30 SEPTEMBER 2018
49
Denmark – Logistics/Industrial Market OutlookReal Estate Market
Economy
Denmark Investment Volumes (€ mn)
Outlook The first half of the year has been a
disappointing one for Danish economic growth and there is limited momentum being carried into H2.
However, growth is still expected to be 1.5% in 2018, before picking up again in 2019 as economic fundamentals are showing signs of improvement.
The level of employment has reached record levels and with labour markets already tight, wages should rise and boost household incomes.
If the Eurozone’s slow start to the year leads to weak growth in 2018 this may drag on demand for Danish exports for a period of time.
Indicator 2018 2019 2020 Outlook (vs 2019)
GDP 1.5% 2.2% ↘
Industrial Production 1.2% 2.2% ↘
Consumer Prices, average
1.1% 1.2% ↗
Population (000s) 5,787 5,812 ↗
Population 0.4% 0.4% ↗
Unemployment Rate 4.0% 4.0% →
Annual % change unless specified
The growth of e-commerce and need to realign and reposition supply chains is the main driver of activity in the Danish industrial sector. While large facilities with long leases and multi let units are attractive to investors looking to spread risk, urban logistics are seeing rising levels of interest from both occupiers and investors in the search for the optimal balance between efficient ways to combine quick access to their customer base with warehouse networks, while protecting margins.
Over the first six months of 2018 €2.9 billion was invested into the Danish real estate market overall. Of this, approximately 10% targeted the industrial sector. H1 2018 volumes were a huge 146% rise on the comparative period in 2017 boosted by some portfolio deals that concluded.
Domestic investors continue to be an active element of overall trading volumes however, international investors are the dominant source of capital in the Danish industrial sector. While neighbouring Nordic countries have been looking for opportunities, British and US investors were active of note over H1 2018.
Prime yields for logistics in Copenhagen are in the region of 5.75% and 25 basis points higher in the Triangle area in Jutland. While there has been no movement in values over 2018, there has been a 50 basis point downward shift over the last twelve months to June 2018.
Prime yields are at historic lows although in some locations continue to offer a discount of 30 basis points over the Nordics average prime logistics yield of 5.45%. The expectation is for prime yields to remain flat during 2018 but possibly come under upward pressure in 2019 as rising interest rates exert pressure on property yields.
With robust demand levels over the recent past some of the major logistics hubs are running out of space and access to labour, with unemployment at historic lows of 4.0%. The likelihood is that this will see a shift in occupier demand alongside development activity to some of the smaller logistics hubs that still have room to grow, while at the same time, offering shared services and therefore an element of economies of scale. It will however, be critical of any developments, to assess multiple factors relating to site accessibility from both a labour perspective and a transport one. Even new schemes that do not meet these criteria will struggle to let.
Retailers on the whole have been active in modernising their warehouse networks and exploring online channels - this has supported growth in occupier demand, a trend that is expected to continue as 2018 runs its course.
The rise in population in some urban areas will be focal points for users and developers of last mile logistics as online sales volumes continue to increase and consumer demand for shorter delivery times indicate that providers need efficient, lean operations.
Sources:Oxford Economics – Country Economic Forecast Denmark 13 September 2018
CBRE - Real Estate Market Outlook Denmark 2018C&W/RED – Market Report Issue I – Feb 2018
Real Capital Analytics
-
1,000
2,000
3,000
4,000
5,000
6,000
7,000
8,000
9,000Retail Office Industrial
Hotel Dev Site Apartment

RESULTS PRESENTATION FOR THE THIRD QUARTER ENDED 30 SEPTEMBER 2018 AND THE FINANCIAL PERIOD FROM 30 NOVEMBER 2017 TO 30 SEPTEMBER 2018
50
Poland – Office Market OutlookReal Estate Market
Economy
Investment Volume (€ bn)
Outlook The economy expanded by 4.6% in
2017, making it the strongest year since 2011 and well above the Eurozone average of 2.5%. Domestic demand is forecast to be
the main driver of GDP growth over the medium term with net exports acting as a drag on growth. The outlook is underpinned by strong consumption growth of 4.4% in 2018 before a slight reduction in growth to 3% in 2019, as higher oil prices erode consumer purchasing power.
The labour market remains very healthy with low unemployment, while inflation remains moderate at a time when EU structural fund spending has increased.
In Poland, Warsaw remains the hub of office activity, although the regional office markets are gathering momentum. With limited new space expected to be delivered, strong demand evident and decreasing vacancy across key cities, rents are expected to show upward momentum over the next 12-18 months.
Due to the relatively low volume of new office completions over the last 18 months and the limited amount scheduled for delivery in H2 2018 and in 2019 (206,000 sqm), the Warsaw office market is experiencing a short-term supply shortage. most of Warsaw’s new office completions in 2020 will secure a pre-let, which should minimise the impact of a peak in new supply and moderate any increase in the vacancy rate.
In 2017 approximately 62% of the total office volume (or €840 million) involved offices outside Warsaw and 32% (or €432 million) involved older, secondary buildings. Therefore, the liquidity of regional offices may be judged as good in the context of the Polish market but demand for older assets less so, although even here the volume was up 20% on the previous year's €361 million.
The low availability of prime product combined with healthy demand from international investors has resulted in the compression of yields for prime offices to below 5.00% in Warsaw and approximately 6.00% in the main regional cities. Non-prime products are expected to achieve 7%+ yields or even 8%+ especially for short WAULT (below 5 years) and high vacancy.
Poland’s positive economic outlook coupled with further expansion of business service sector, notably Business Process Offshoring and Shared Service Centres, should support strong leasing activity in Warsaw of more than 750,000 sqm in 2018 and above average take-up (600,000 sqm p.a. over 2008-2017) in both 2019 and 2020. Following the 2009 slowdown caused by the GFC gross take-up recorded in Tricity started
to increase and over the last three years (2015 – 2017) the annual volume of deals has exceeded 90,000 sqm. However, in H1 2018 total leasing activity was just 26,000 sqm due to the lack of available office space on the market. Nevertheless, given the number of schemes due to complete in remaining part of 2018, the total leasing activity should exceed 60,000 sqm by year end.
In the near term some upward pressure on prime rents is expected as a result of limited new supply and strong demand. Robust demand for office space is supporting rising capital values particularly in Central Warsaw that is benefitting from both positive rental growth and yield compression. Yields are under pressure across the board given the weight of capital looking to invest in the Polish office sector.
Sources:Cushman & Wakefield, Independent Market Research Report, September 2018
0.0
0.5
1.0
1.5
2.0
2.5
2008
2009
2010
2011
2012
2013
2014
2015
2016
2017
H1
2018
€ bn
Transaction VolumeWarsaw Poland

RESULTS PRESENTATION FOR THE THIRD QUARTER ENDED 30 SEPTEMBER 2018 AND THE FINANCIAL PERIOD FROM 30 NOVEMBER 2017 TO 30 SEPTEMBER 2018
51
Finland – Office Market OutlookReal Estate Market
Economy
Investment Volume (€ bn)
Outlook Finland’s economy is growing strongly
as solid international demand and improving competitiveness help to support exports. GDP growth for 2018 as a whole is expected at 2.7%, similar to last year’s performance of 2.8%, which was the strongest since 2010 when the economy expanded by 3.0%.
Private consumption is expected to positively contribute to GDP performance supported by employment growth and rising income.
Unemployment is above the EU average, but trending down. It has already reached the lowest level in more than 5 years - attributed to government reforms called ‘The Competitiveness Pact’.
Demand for office premises in the Helsinki CBD is strong and traditional occupiers such as financial, legal and consultancy companies is still common. However, some finance HQ’s have moved to the outskirts of the CBD while other types of occupiers in the CBD have started to emerge, such as tech companies.
Due to high demand and lower vacancy rates, Helsinki CBD rents have been increasing, while other office submarkets have remained stable over the last few years. However, rental growth was evident between H2 2017 and H1 2018 in multiple key office areas due to increased occupier demand, such as Helsinki’s CBD, Keilaniemi, and Aviapolis. The overall vacancy remained stable in the HMA in Q2 2018 however, the demand for modern buildings with excellent transport/infrastructure connections has increased.
The share of the international investors has been increasing rather steadily since 2009. In the HMA office market overseas buyers represented over 80% (€3.2 billion) of transaction in 2017 with new players entering the market, among them were international real estate funds, life insurance companies, and pension funds, such as AEW and CIC.
Nordic properties have become a popular target for many Asian real estate investors, and other international funds targeting Finnish real estate are expected. In H1 2018 multiple historic deals have been struck, such as the sale of the iconic Bookstore property and the sale of the KPMG HQ in Helsinki. Over €800 million of office transactions have closed in the first half of 2018, which is higher than the €500 million in the same period 2017.
The positive economic outlook and increasing private spending suggests rising demand for office space in the future. As most rental agreements are bound to inflation, the rental development of old contracts is expected to increase by around 1% in 2018 and 1.5% in 2019.
The trend of finding efficient office premises (greater workspace density) is expected to continue going forward. A few years ago the move to efficient premises was mainly driven by cost savings. However, more recently occupiers are not only looking for cost savings, indeed the premises may be more expensive (on a €/sqm basis), but efficient space. The majority of occupiers are looking for open layout or multifunctional offices (premises for silent work, lounges for informal meetings, etc.), which support the efficiency of the premises.
The strong Finnish economy together with the low interest rates support the market and encourage real estate investments, especially as the low interest environment offers few other investment alternatives.
In terms of capital growth, the forecast for year-end 2018 is still positive (14.1% increase) supported by a combination of yield compression evidenced in the first half of the year and rental growth. However, in 2019 the capital growth is forecasted to remain stable and turn negative in 2020 as yields rise.
Sources:Cushman & Wakefield, Independent Market Research Report, September 2018
0
1
2
3
4
5
2008
2009
2010
2011
2012
2013
2014
2015
2016
2017 H1
2018
€ bn
Office Transaction VolumeHelsinki MA Finland

European Update and OutlookAppendix B

RESULTS PRESENTATION FOR THE THIRD QUARTER ENDED 30 SEPTEMBER 2018 AND THE FINANCIAL PERIOD FROM 30 NOVEMBER 2017 TO 30 SEPTEMBER 2018
53
Commentary on the European Economy
Source: Oxford Economics
The Eurozone economy is expected to expand by 2.0% in 2018. The pace of job creation is robust, driving the unemployment rate down to 8.1% - a decade low.
However, employment growth is showing signs of having peaked and the gradual pick-up in wage growth will provide a boost to household spending.
The last twelve months has seen sustained occupier demand for commercial real estate in Europe, although the declining labour capacity is starting to hinder corporate expansions.
Coupled with rising input costs, notably via higher oil prices and pressure on wages, the cost of doing business is becoming more challenging.
The European Central Bank is still expected to end its QE purchases in December as no new policy announcements were made at the September ECB meeting.
The first interest rate hike is not expected until well into the second half of 2019, with a gradual pace of tightening thereafter.
The adverse external environment and rising political risks in Europe are posing an increasing threat to the outlook and indications are for a slower third quarter.
European PMI readings, the EU 28 industrial production index, employment intentions and GDP forecasts are all showing signs of cooling.

RESULTS PRESENTATION FOR THE THIRD QUARTER ENDED 30 SEPTEMBER 2018 AND THE FINANCIAL PERIOD FROM 30 NOVEMBER 2017 TO 30 SEPTEMBER 2018
54
European Commercial Real Estate - Recent Performance €59 bn was invested into European commercial real estate in Q2 2018,
bringing the half year total to €118 bn and the 12 months to June to €305 bn (7% up on 12 months to June 2017).
Offices were the most targeted sector - 41% of all deals over H1 2018. Retail took the second spot (20%), pipping residential into third (17% in H1 2018).
Global uncertainties, encouragingly, do not seem to be deterring investors away from European real estate as they look through the noise to the relative strength of the economy and healthy occupier markets.
Office yields are at, or close to, historic lows in the majority of European markets following sustained downward pressure, with stability now expected over the remainder of 2018.
The weight of capital searching for yield has seen investors look further than core European cities, supporting higher volumes in some more peripheral European economies, as well as secondary locations, although the yield gap between prime and secondary is narrowing.
There is more balance between international and domestic capital with a 50:50 split in H1 2018.
Asian capital is more active - from sub 10% in 2015 to 20% in 2017. Singapore and Korean investors continue to buy into European real estate and while Chinese buying is evident, is somewhat curtailed by capital controls.
Impending rate rises will also have an impact on investor strategies, but it is unlikely yields will be materially impacted across Europe over the next 12 months.
Sources: Real Capital Analytics
CBRE – Europe Investment Market Snapshot Q2 2018Colliers - EMEA Capital Flows Q3 2018
42%
23%
12%
11%
7%5%
Investment by Sector(12 months to June 2018)
Office
Retail
Apartment
Industrial
Hotel
Dev Site
UK, 74.2
Germany, 63.2France, 42.2
Netherlands, 23.2
Spain, 17.5
Finland, 10.4
Sweden, 9.4Poland, 7.9
Italy, 7.8 Denmark, 7.4
Top 10 European Destinations€ billion, 12 months to June 2018
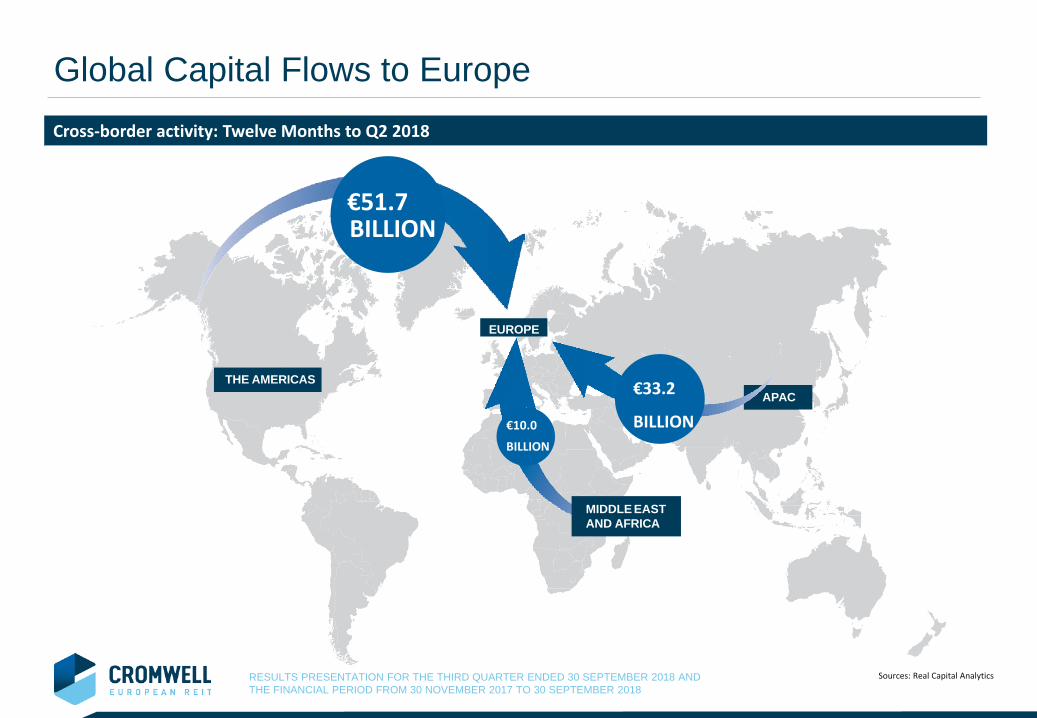
RESULTS PRESENTATION FOR THE THIRD QUARTER ENDED 30 SEPTEMBER 2018 AND THE FINANCIAL PERIOD FROM 30 NOVEMBER 2017 TO 30 SEPTEMBER 2018
THE AMERICASAPAC
€51.7BILLION
EUROPE
€33.2
BILLION
MIDDLE EAST AND AFRICA
€10.0
BILLION
Cross-border activity: Twelve Months to Q2 2018
Global Capital Flows to Europe
Sources: Real Capital Analytics

RESULTS PRESENTATION FOR THE THIRD QUARTER ENDED 30 SEPTEMBER 2018 AND THE FINANCIAL PERIOD FROM 30 NOVEMBER 2017 TO 30 SEPTEMBER 2018
56
10.8%
7.9%
1.4%
4.3%3.2%
2.5% 2.5%
6.3%
CEREIT 2018PFDPU Yield
CEREIT CurrentDPU Yield
Europe 10-YearGovernment Bond
FTSE EPRAEurozone Index
US Government10-Year Bond
Monetary Authorityof Singapore10-Year Bond
Central ProvidentFund
FTSE StraitsTimes REIT Index
Cromwell European REIT – Distribution YieldCEREIT Current DPU Yield of 7.9%2 compares favourably to other global yield investment products
Source: Bloomberg, European Commission, data as at 30 October 20181 Based on €0.545, the last traded price on Singapore Exchange Securities Trading Limited (“SGX-ST”) on 2nd November 2018.2 Assumes that € 170.8 million of the gross proceeds of the Rights Issue are used to partially fund the Total Cost of the Proposed Transaction, and € 53.3 million of the gross proceeds of the Rights Issue are used to partially fund the Total Cost of the Recently
Announced Acquisitions. DPU Yield is computed based on annualised pro forma distributable income divided by the sum of CEREIT’s market capitalisation at the close of 30 October 2018 and the gross proceeds of the Rights Issue assumed to be attributable to each respective transaction.
3 Based on the monthly averages (non-seasonally adjusted data) of the yields of the 10-year government bonds of the countries in the Eurozone. They refer to central government bond yields on the secondary market, gross of tax, with a residual maturity ofaround 10 years. The bond or the bonds of the basket have to be replaced regularly to avoid any maturity drift. This definition is used in the convergence criteria of the Economic and Monetary Union for long-term interest rates, as required under Article 121 of the Treaty of Amsterdam and the Protocol on the convergence criteria. Data are presented in raw form.
4 Based on Bloomberg’s estimated DPU yield for the year ended 31 December 2018 for FTSE EPRA Eurozone Index. FTSE EPRA Eurozone Index is a market capitalisation weighted index consisting of listed real estate companies and REITs in the Eurozone.5 Based on Bloomberg’s bid yield to maturity of bond.6 Based on Bloomberg’s bid yield to maturity of bond.7 Based on the legislated minimum interest of 2.5% per annum earned in Central Provident Fund (“CPF”) Ordinary Account. CPF is a mandatory social security savings scheme in Singapore. The interest rate on the CPF Ordinary Account is reviewed quarterly and
is the higher of the legislated minimum interest of 2.5% per annum or the 3-month average of major local banks’ interest rates.8 Based on Bloomberg’s estimated DPU yield for the year ended 31 December 2018 for FTSE Straits Times Real Estate Investment Trust Index. The FTSE Straits Times Real Estate Investment Trust Index is a market capitalisation weighted index consisting of
listed REITs in Singapore.
Europe Benchmarks US BenchmarkCEREIT Curent DPU
Yield Spreadto Benchmarks +6.7% +3.8% +5.6% +5.6% +1.8%
Singapore Benchmarks
+4.9%
1 26
7 83 4 5

CEREIT’s Sponsor StrengthAppendix C

RESULTS PRESENTATION FOR THE THIRD QUARTER ENDED 30 SEPTEMBER 2018 AND THE FINANCIAL PERIOD FROM 30 NOVEMBER 2017 TO 30 SEPTEMBER 2018
58
Legend:
Markets with Cromwell presence
Sponsored by Cromwell Property Group
A$2.1billionMarket Capitalisation2
3,800+tenants
A$11.5billion AUM1
380+people
4.0 millionsqm
A$204.1 millionProfit for the financial year3
320+properties
Cromwell Property Group (“Cromwell”) is a real estate investor and manager operating on three continents with a global investor base
_____________________
1. Total assets for Cromwell as at 30 June 2018 including attributable AUM of Phoenix Portfolios (45%) and Oyster Group (50%) as at 30 June 20182. Market capitalisation as at 25 October 20183. Profit for the financial year ended 30 June 2018
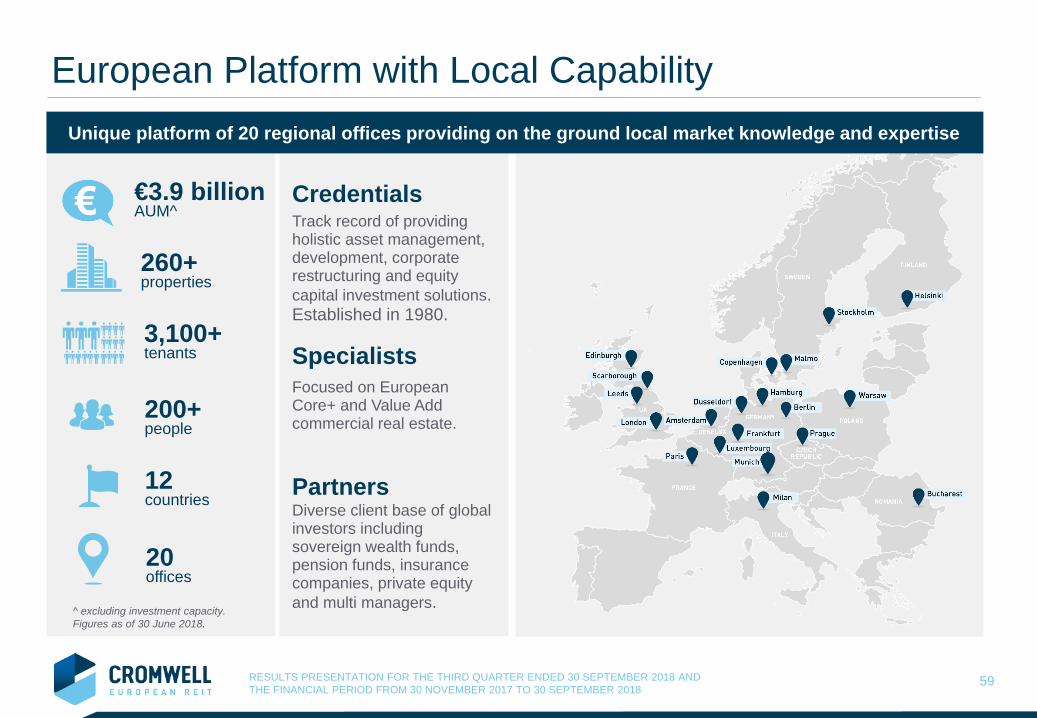
RESULTS PRESENTATION FOR THE THIRD QUARTER ENDED 30 SEPTEMBER 2018 AND THE FINANCIAL PERIOD FROM 30 NOVEMBER 2017 TO 30 SEPTEMBER 2018
59
European Platform with Local Capability Unique platform of 20 regional offices providing on the ground local market knowledge and expertise
260+properties
3,100+tenants
€3.9 billion AUM^
^ excluding investment capacity. Figures as of 30 June 2018.
200+people
12countries
20offices
CredentialsTrack record of providing holistic asset management, development, corporate restructuring and equity capital investment solutions. Established in 1980.
Diverse client base of global investors including sovereign wealth funds, pension funds, insurance companies, private equity and multi managers.
SpecialistsFocused on European Core+ and Value Add commercial real estate.
Partners

RESULTS PRESENTATION FOR THE THIRD QUARTER ENDED 30 SEPTEMBER 2018 AND THE FINANCIAL PERIOD FROM 30 NOVEMBER 2017 TO 30 SEPTEMBER 2018
Cromwell has been reporting in accordance with the Global Report Initiative sustainability guidelines since 2009
CEREIT was awarded the GRESB Sustainability Benchmark
Benchmarks property performance against Global Real Estate Sustainability Framework
Targeting inclusion into the Dow Jones Sustainability index
In 2016 Cromwell launched its global sustainability framework to introduce common benchmarks and consistent disclosure
Partnered with Qantas in 2017 to offset emissions resulting from corporate air travel globally
Appointed Chief Sustainability Officer in 2018, with a direct reporting line to Group CEO
Sponsor and Manager Dedicated to SustainabilityCromwell is committed to acting responsibly and proactively, to understand, measure, manage and communicate the impacts of our activities

RESULTS PRESENTATION FOR THE THIRD QUARTER ENDED 30 SEPTEMBER 2018 AND THE FINANCIAL PERIOD FROM 30 NOVEMBER 2017 TO 30 SEPTEMBER 2018
Urbanisation
As urbanisation increases, real estate will need to meet additional demand for working and living in cities
TechnologyTechnology is changing the real estate landscape by improving production inefficiencies, reducing labour costs andmaximising income
DemographicsChanging consumer behaviour, supply chains should deliver on the omni-channel offering to consumers
Sustainability is increasingly influencing occupier demand, asset management strategies and investors appetite for real estate
Sustainability
Country level macro economic, political and real estate analysis
First cut of city selection
Target citiesranked
Comprehensive in-depth desktop appraisal: 200+ criteria
In-house local, on-the-ground market appraisal
Sector-level analysis & asset selection
Detailed and continuous research process• Target cities in each sector
identified for investment opportunity sourcing
• Process combines statistical and economic analysis, taking into account macro-trends and themes as well as geopolitical risks
• Top-down findings combined with bottom-up on-the-ground experience and expertise of local teams
Macro Trends
• Investment strategies are increasingly overlapping as investment returns continue to compress
• A thorough understanding of macro and local market dynamics, capital risk/return appetite, as well as occupier trends and requirements are all essential in formulating and implementing a successful strategy
Research-backed Investment Strategies
E-Commerce
Changes in demographics will drive demand and influence the type, functionality andlocation of assets
Rigorous selection process to ensure investments are focused on the right cities, sectors and trends
61

Thank You
If you have any queries, kindly contact:Cromwell EREIT Management Pte. Ltd., Chief Operating Officer & Head of Investor Relations, Ms Elena Arabadjieva at [email protected], Tel: 6920 7539 or Newgate Communications at [email protected].