critical technologies necessary for big data … technologies necessary for big data exploitation...
TRANSCRIPT

1
Critical Technologies Necessary For Big Data Exploitation
Stephen Brobst Chief Technology Officer
Teradata Corporation [email protected]
© 2015 Teradata Confidential
2
UNIFIED DATA ARCHITECTURE
Security, Workload ManagementERP
SCM
CRM
Images
Audio
and Video
Machine
Logs
Text
Web and
Social
SOURCES
Marketing
Executives
Operational
Systems
Frontline
Workers
Customers
Partners
Engineers
Data
Scientists
Business
AnalystsMath
and Stats
Data
Mining
Business
Intelligence
Applications
Languages
Marketing
USERS
ANALYTIC TOOLS &
APPS
Search
Marketing
Executives
Operational
Systems
Knowledge
Workers
Customers
Partners
Engineers
Data
Scientists
Business
Analysts
USERS
INTEGRATED DATA
WAREHOUSE
DATA RESERVOIR
DISCOVERY
Security, Workload ManagementREAL-TIME STREAM PROCESSING
Analytic Ecosystem
2
3
Critical Success Factors
Success
=
Technology
+
Governance
4
Technology
Technology

3
5
Multi-Temperature Data Managementwith a scalable and hierarchically organized storage system.
� Cost effectively manage extremely large data volumes.
1
2
3
Polymorphic File Systemswith co-existence of relational and non-relational data types.
� Native storage in a form most suitable for processing.
Late Bindingwith data access capabilities that go beyond traditional SQL.
� Useable by a data scientist who does not need to be a computer scientist.
Key Technologies for Big Data Exploitation
6
Trends in Data Acquisition
Want more data!
Want it faster!
Appetite for data is
outpacing Moore’s Law.
4
7
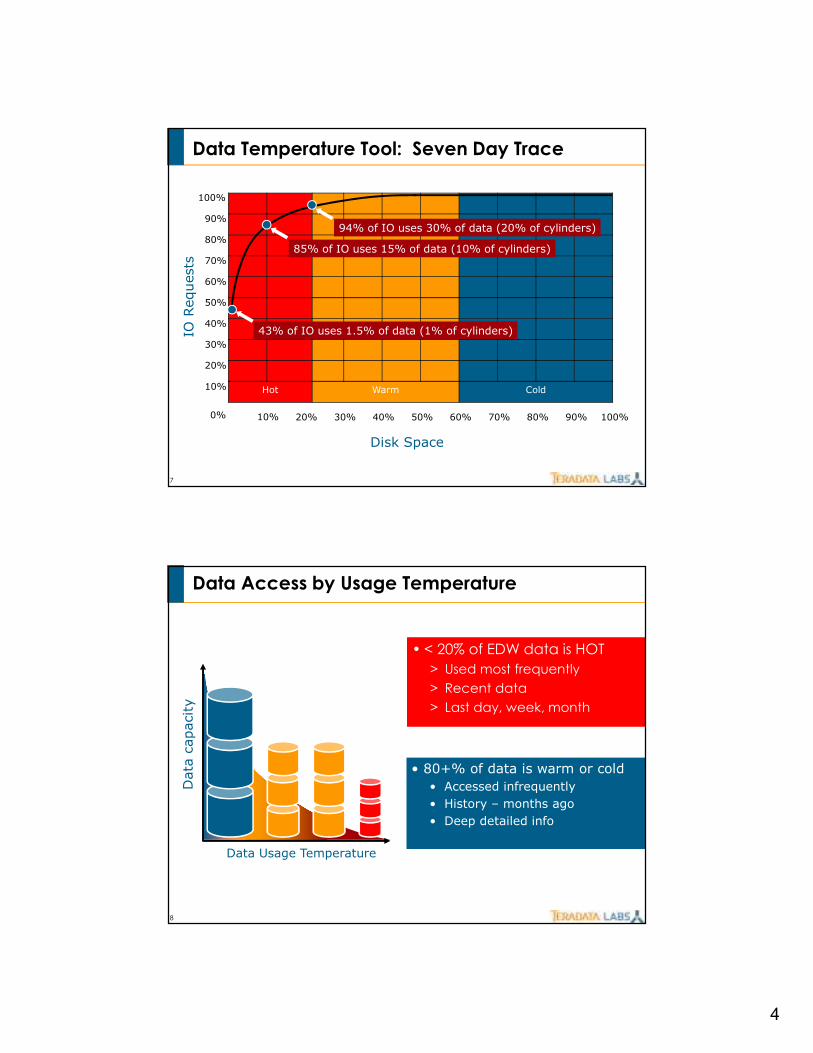
Data Temperature Tool: Seven Day Trace
Hot Warm Cold
10% 20% 30% 40% 50% 60% 70% 80% 90% 100%0%
10%
20%
30%
40%
50%
60%
70%
80%
90%
100%IO Requests
Disk Space
43% of IO uses 1.5% of data (1% of cylinders)
85% of IO uses 15% of data (10% of cylinders)
94% of IO uses 30% of data (20% of cylinders)
8
Data Access by Usage Temperature
• < 20% of EDW data is HOT
> Used most frequently
> Recent data
> Last day, week, month
• 80+% of data is warm or cold
• Accessed infrequently
• History – months ago
• Deep detailed info
Data capacity
Data Usage Temperature

5
9
600GB Fibre
Channel Drives
Mulit-TBSATA Drives
FlashMemory
Traditional Performance
On-LineCompliance /Archival
ExtremePerformance
Auto
-mig
rate
MPP for XLDB
In-Memory (DRAM)
Multi-Temperature Data Management
10
Multi-TBSATADrives
Flash Memory
MPP XLDB
Auto
-mig
rate
Extreme Data
Appliance
Extreme Performance
Appliance In-Memory (DRAM)
Multi-Temperature Data Management

6
11
Polymorphism: The ability to change shapes so as to adapt to new situations.
A polymorphic file system has the ability to “change shapes” to accommodate different kinds of data for analysis:
•Relational (column or row store)
•Graphs
•Key/value pairs
•Text
•XML, JSON
•Rich media
•Etc.
Native storage of data in appropriate file structures leads to *much* more efficient processing.
Polymorphic File System
12
Social Network Metrics
• Identity confidence
• Group detection
• Degree
> First/second
> On-net/off-net
> Peak/off-peak
> Etc.
• Centrality
• Betweeness
• Closeness
• Triangles
• Authority
• Cohesion
• Prestige and trust
• Many more...

7
13
LinkedIn Analytics: Globalization of 10B+ LinkedIn Connections
14
173.58.239.217 - - [18/Jan/2015:13:22:55 -0400] "GET /forum/113-user-written-plugins/48569-merged-
topic-kunenadiscuss-plugin-for-k-15x HTTP/1.1" 200 12266
"http://www.google.com/search?hl=en&source=hp&q=kunena+discuss+plugin&aq=3&aqi=g5&aql=&oq=
kunena+discu&gs_rfai=CkRlj5bzFTILQIIWaiwPGifzWBwAAAKoEBU_Qlg5U" "Mozilla/4.0 (compatible;
MSIE 7.0; Windows NT 6.0; SLCC1; .NET CLR 2.0.50727; Media Center PC 5.0; .NET CLR 1.1.4322;
InfoPath.1; .NET CLR 3.5.30729; .NET CLR 3.0.30729; .NET4.0C)"
93.38.93.220 - - [18/Jan/2015:13:22:56 -0400] "GET /components/com_community/assets/script-1.2.js
HTTP/1.1" 304 187 "http://www.kunena.com/forum/136-k-15-templates-and-design/36646-options-for-
customizing-subforums" "Mozilla/4.0 (compatible; MSIE 8.0; Windows NT 5.1; Trident/4.0; .NET CLR
2.0.50727; .NET CLR 3.0.04506.30; .NET CLR 3.0.4506.2152; .NET CLR 3.5.30729; InfoPath.2)"
93.38.93.220 - - [18/Jan/2015:13:22:56 -0400] "GET
/components/com_community/templates/default/css/style.css HTTP/1.1" 304 187
"http://www.kunena.com/forum/136-k-15-templates-and-design/36646-options-for-customizing-
subforums" "Mozilla/4.0 (compatible; MSIE 8.0; Windows NT 5.1; Trident/4.0; .NET CLR 2.0.50727;
.NET CLR 3.0.04506.30; .NET CLR 3.0.4506.2152; .NET CLR 3.5.30729; InfoPath.2)"
“Raw” Web Log Data
“Unstructured” Data

8
15
IP Time URL User Client …
93.84.67.1 Jan-18-2015 5:37:32
/ user1 IE
197.204.1.1 Jan-18-2015 5:38:01
/community user2 FF
97.67.2.21 Jan-18-2015 5:39:35
/forum user3 Chrome
Transform from “unstructured” data to “structured”
data using traditional ETL tools and methodologies.
The Traditional ETL Approach
16
IP Time URL User Client … “semi-structured”
93.84.67.1 Jan-18-2015 5:37:32
/ user1 IE hl=en&source=hp&aq=3&aqi=g5&aql=&gs_rfai=CkRlj5bzFTILQIIWaiwPGifzWBwAAAKoEBU_Qlg5U
197.204.1.1 Jan-18-2015 5:38:01
/community user2 FF Source=aq&guid=124678&apl=1&
97.67.2.21 Jan-18-2015 5:39:35
/forum user3 Chrome hl=en&source=aq&aq=4&aqi=aq&aql=&gs_rfai=NET CLR 3.0.4506.2152
The “Semi-Structured” approach extracts known and
frequently used data into well-defined columns and leaves the
rest in a CLOB for use with the late-binding technique.
A Hybrid Approach using ETL and NoETL

9
17
Start_dt Guid Sess_id Page_id Soj
2015-01-18 1234 1 15 {Soj: {Language : “English”,Source :: “hp”,“item_list” : [ {item: ”i1”},
{item: “i2”}, {item: “i3”}, {item: “i4”}, {item: “i5”} ] …}}
SELECT start_dt, guid, sess_id, page_id,
name_value_list(e.soj, ‘item’) AS item_list
FROM event e
WHERE e.start_dt = ‘2015-01-18’
AND e.page_id = 3286 /* Search Results */
Start_dt Guid Sess_id Page_id Item_list
2015-01-18 1234 1 15 i1,i2,i3,i4,i5
4+ trillion records (300-400 trillion items)
in a single table.
Late Binding Approach
18
WITH event (start_dt, item_list) AS (<previous SQL>)
SELECT
start_dt,
item_id, /* Individual Item */
count(*)
FROM TABLE ( /* Normalize comma delimited list */
normalize_list( start_dt, item_list, ‘,’)
RETURNS(start_dt, idx, item_id)
)
GROUP BY 1, 2
ORDER BY 3 DESC
Start_dt Item_id Count(*)
2015-01-18 i1 555
2015-01-18 i2 444
2015-01-18 i3 333
2015-01-18 i4 222
2015-01-18 i5 111
*syntax simplified
Late Binding Approach

10
19
Event Table
~ 8 Billion rows per Day
~ 4 Trillion rows in ~640 (daily) partitions (no indexes)
~ 10,000 Tags (volatile)
~ 40 Billion Search impressions per day
~ 135 Million unique items shown in search results per day
~ 2 PB compressed database space
~ 12 PB raw, uncompressed data
Start_dt Item_id Count(*)
2015-01-18 i1 ~70,000
2015-01-18 i2 xxx
2015-01-18 i3 xxx
2015-01-18 i4 xxx
2015-01-18 i5 xxx
Late Binding Approach
~135 MillionItems
32 Seconds
20
• Data Modeling
> No need to build out a complex model.
> Less vulnerable to changes in the model.
• ETL
> Simplified coding; less maintenance.
> Less vulnerable to changes.
> Fewer transformations.
> Faster loads.
> Better compression.
• Processing
> Eliminating joins (NVP = pre-joined!).
> Having the context (rows) of “denormalized table” in one row available for processing.
> Potentially reduce the number of path over the data using a UDF vs. like Ordered Analytics.
> Some cost to extract values of interest from CLOBs.
Benefits of Late Binding

11
21
With the late binding, we defer the mapping of the data to a
defined structure until we know the question that is being asked:
Schema on Read
vs.
Schema on Load
Waiting to map the data until a question has been asked means
more flexibility and agility when acquiring data into the analytic
environment (at the cost of some performance efficiency).
Big Problem: Today’s BI tools do not know how to deal with data
that is not structured at load time!
The Problem with Late Binding
22
Governance
Governance
12
23
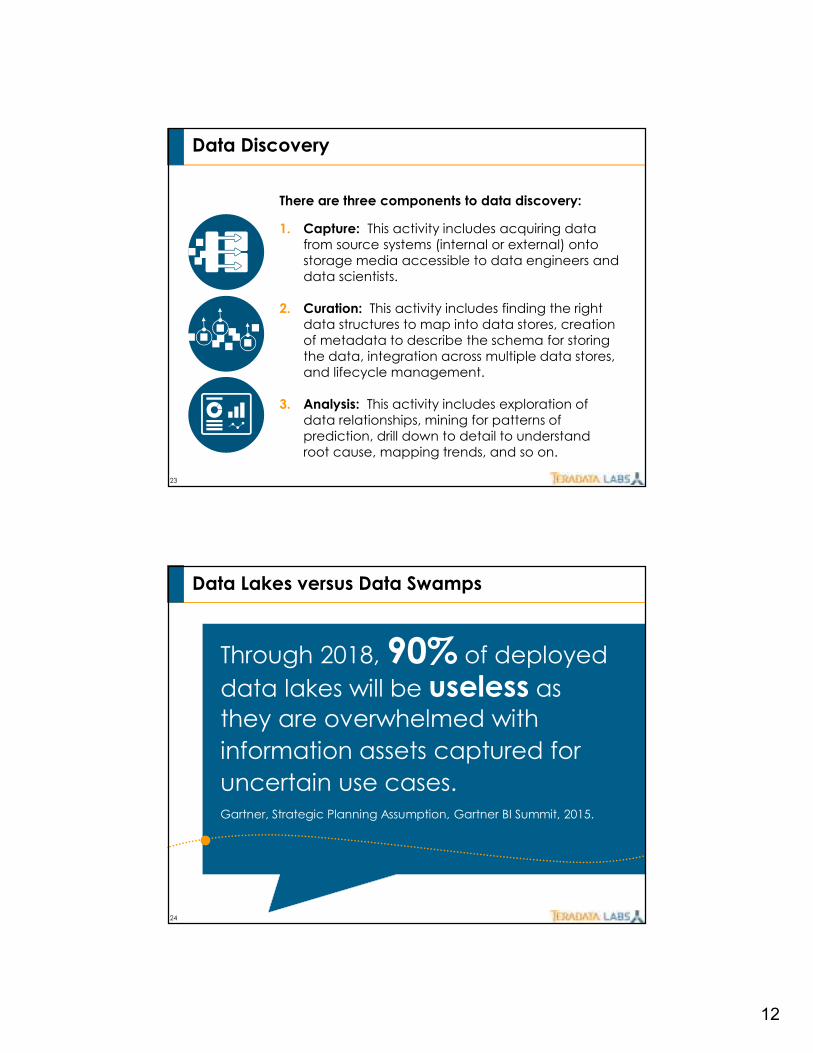
There are three components to data discovery:
1. Capture: This activity includes acquiring data
from source systems (internal or external) onto
storage media accessible to data engineers and
data scientists.
2. Curation: This activity includes finding the right
data structures to map into data stores, creation
of metadata to describe the schema for storing
the data, integration across multiple data stores,
and lifecycle management.
3. Analysis: This activity includes exploration of
data relationships, mining for patterns of
prediction, drill down to detail to understand
root cause, mapping trends, and so on.
Data Discovery
24
Data Lakes versus Data Swamps
Through 2018, 90% of deployed
data lakes will be useless as they are overwhelmed with
information assets captured for
uncertain use cases.Gartner, Strategic Planning Assumption, Gartner BI Summit, 2015.

13
25
Data Reservoirs versus Data Swamps
Through 2018, 90% of deployed
data lakes will be useless as they are overwhelmed with
information assets captured for
uncertain use cases.Gartner, Strategic Planning Assumption, Gartner BI Summit, 2015.
On which data asset would you rather bet your career?
Data Reservoir …or… Data Swamp
26
Data Curation
Curation is all about the care and feeding
of the data asset.
One of the most neglected aspects of
curation is the keeping track of the provenance
(aka audit trail, lineage, or pedigree) of both
internal and external data – as well as the manipulations to
used create derived data assets.
Lack of provenance associated with data results in distrust in
quality and rampant re-copying (and re-manipulation) of
data – leading to extremely inefficient use of resources (e.g.,
data swamp).
Without sufficient information about how a data asset is
created, its value is diminished significantly.

14
27
Basic Questions of Provenance
• Who created the data asset and when?
• What is the source of the raw data used to create the asset?
• What processes were used to create the data asset?
• What are the known defects associated with the data asset?
• What algorithms were used to manipulate data?
Without provenance it is hard
(sometimes impossible) to:
• Reproduce results,
• Solve problems collaboratively,
• Validate results with different input data,
• Understand the process used to solve a particular problem,
• Re-use the knowledge involved in the data analysis process.
Source: Hansen, Johnson, Pascucci, and Silva. Visualization for Data Intensive Science. The Fourth Paradigm. 2009. pp. 154-163.
01010
28
The New World: Ecosystem Wins!
• Ecosystem approach is
becoming an industry standard
and best practice.
• The new worlds of Hadoop,
Open Source, and Cloud are
industry movements.
• Technical requirements:
> Data Movement,
Synchronization, and
Ecosystem Management.
> Cloud offers (DWaaS).
> Extreme Scale (deep cold
storage).
15
29