critical raw material control in drug substance and its ... · presented by eran j. benjamin, ph.d....
TRANSCRIPT

Critical Raw Material Control in Drug Substance and its Impact on Drug Product Comparability
Emerging Strategies in Drug Product Comparability and Process ValidationJuly 18 – 19, 2016, Gaithersburg, MD USA
Presented by Eran J. Benjamin, Ph.D. Bio-Product R&D, Eli Lilly and Company
Bio-Product R&D, Eli Lilly and Co.
CASSS CMC Strategy Forum

2
♦ LP541 is a PEGylated Protein intended for Diabetes therapy♦ Presentation:
♦ The drug substance is a frozen solution (≤-10°C)♦ The drug product is a refrigerated multi-use product (2-8°C)
Drug Product
(Refrigerated)Cartridges & Vials
~23 mg/mL
Drug Substance Purification and
Isolation(Frozen Solution)
~ 45 gram/Liter
Purified Protein Intermediate
(Bulk Powder)
PEGylation reagent
(Bulk Powder)
Buffer SectionCompendial Excipients
Program Overview

♦ 20 kDa PEG uses Paranitrophenyl carbonate activation♦ Specific to a Lysine side chain residue♦ Generates a stable Urethane bond
Structural Formula (n = approx. 450 subunits):
♦ It defines the time-action profile that the patient would experience
♦ To allow commercialization, 3 suppliers were needed♦ However:
♦ PEG is polymeric distribution♦ Each supplier manufactures PEG with slightly different quality attributes
3
20 kDa PEG is a critical raw material

PEG Mw (weight average molecular weight)
♦ Molecular weight (Mw) is a critical quality attribute of PEG♦ Mw is defined as the weighted average♦ PEG suppliers were using GCP to measure Mw
Mw (Weighted Average Molecular Weight)
Mass analysis of 20 kD PEG sample
4
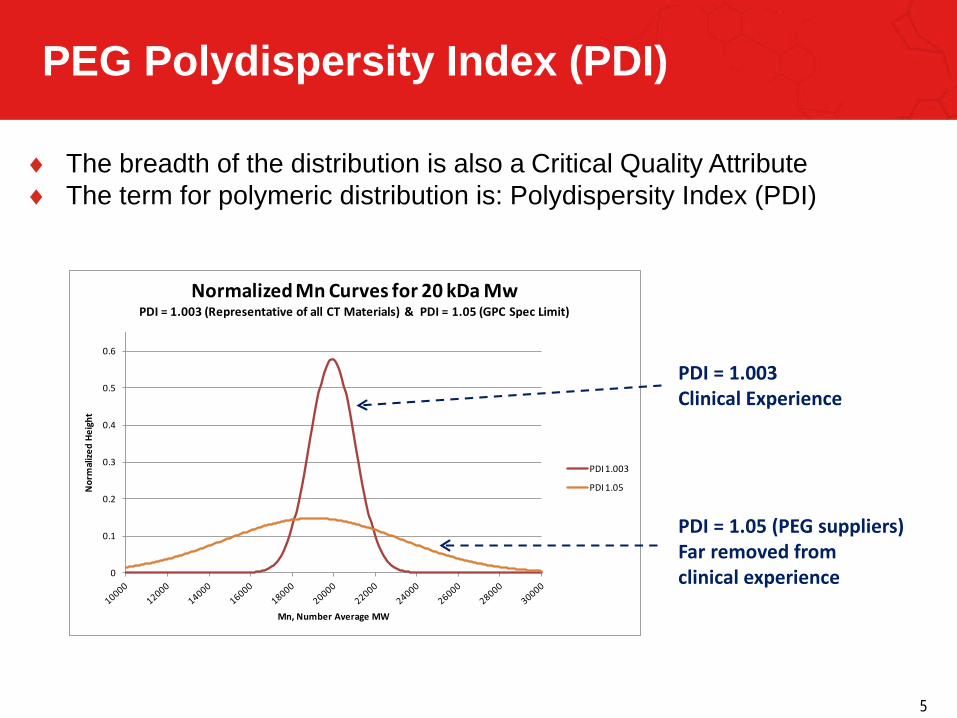
PEG Polydispersity Index (PDI)
♦ The breadth of the distribution is also a Critical Quality Attribute♦ The term for polymeric distribution is: Polydispersity Index (PDI)
0
0.1
0.2
0.3
0.4
0.5
0.6
Nor
mal
ized
Heig
ht
Mn, Number Average MW
Normalized Mn Curves for 20 kDa Mw PDI = 1.003 (Representative of all CT Materials) & PDI = 1.05 (GPC Spec Limit)
PDI 1.003
PDI 1.05
PDI = 1.003Clinical Experience
PDI = 1.05 (PEG suppliers)Far removed from clinical experience
5

PEG Mw and PDI and its impact to PK
♦ Extreme Mw could effect PK (Rodent Model)♦ PEGylated samples with various PEG size♦ 5 kD and 10 kD mPEG significantly different♦ Supplier range acceptable: 18-22 kD♦ Combination (intentionally increasing PDI) acceptable in 18-22 kD range
Rat IV clearance study
6

Phase 2 to Phase 3 PEG supply
♦ Map of PEG of suppliers: • Parameters with potential to impact Drug Product CQAs
Test Supplier 1 (Phase 1/2 and 3)
Supplier 2 (Phase 3)
Supplier 3 (Phase 3)
Weight Average Molecular Weight (MW, Da) - GPC 18,000 – 22,000 18,000 – 22,000
Number Average Molecular Weight (MN, Da) - GPC 18,000 – 22,000 Report
Polydispersity Index NMT 1.10 NMT 1.05 NMT 1.05
Bi-functional PEG (%)* NMT 3 NMT 4
20 kDa Fraction (%) NLT 90
Functional Activity (%) NLT 80 NLT 80 NLT 90
Free p-Nitrophenol (ppm) NMT 200 Report
7* PNP-PEG-PEG-PNP Bi-functional PEG – has the potential to generate covalent dimers

Phase 3 Mw Data
S
0High resolution LC-TOF-MS data:♦ Data collected on PEG used in Phase 3 supply♦ Each Supplier is able to reproduce Mw♦ However; statistically significant differences are observed between suppliers
Supplier 2
Supplier 3 Supplier 1(Phase 1/2)
8

Phase 3 PDI Data
High resolution LC-TOF-MS data:♦ Data collected on PEG used in Phase 3 supply♦ Each Supplier is able to control PDI♦ Populations are similar amongst different suppliers
Supplier 2 Supplier 3 Supplier 1(Phase 1/2)
9

PEG attributes that may affect DP CQAs
LP541 Degradation Pathways
Dimer and HMWP formation
De-PEGylationor PEG degradation
GlutamineDeamidation(pH induced)
Disulfide Rearrangements
(occurs mainly in API)
Could PEG properties influence these CQAs ?
10

Analytical comparability study
♦ A comparability assessment was conducted at the start of Phase 3• Examined PEG raw materials• Multiple parameters related to drug substance and drug product
♦ Drug substance testing:1. Release testing comparison2. Characterization and biophysical testing3. Accelerated stability studies / cell based bioassay
♦ Drug product testing:1. In-process solution testing 2. Release testing comparison3. Characterization testing4. Accelerated stability studies / cell based bioassay
11

SEC Analysis / DP Demo Batches
SEC% HMWP
PEG Storage condition T=0 0.5 M 1M 2M 6M
Supplier 12-8 °C
30°C/60%RH40°C/75% RH
1.2
2.61.6 2.2
1.4
Supplier 22-8 °C
30°C/60%RH40°C/75% RH
1.4
2.71.9 2.5
1.6
Supplier 32-8 °C
30°C/60%RH40°C/75% RH
1.6
3.01.9 2.8
1.8
12
AU
-0.020
-0.010
0.000
0.010
0.020
0.030
0.040
0.050
0.060
0.070
0.080
0.090
0.100
Minutes0.00 2.00 4.00 6.00 8.00 10.00 12.00 14.00 16.00 18.00 20.00 22.00 24.00 26.00 28.00 30.00 32.00 34.00 36.00 38.00 40.00
HMWP
LP541 Monomer Metacresol
6 Month StressedDrug Product Sample@ 30°C/65%RH

RP-HPLC Analysis / DP Demo Batches
RP-HPLC Related Substances
and Impurities: % Total
PEG Storage Condition T=0 0.5 M 1M 2M 6M
Supplier 12-8 °C
30°C/60%RH40°C/75% RH
1.3
3.12.3 2.5
1.5
Supplier 22-8 °C
30°C/60%RH40°C/75% RH
1.4
3.22.3 2.9
1.7
Supplier 32-8 °C
30°C/60%RH40°C/75% RH
1.6
3.62.7 3.2
2.0
13
AU
-0.02
0.00
0.02
0.04
0.06
0.08
0.10
0.12
0.14
0.16
0.18
0.20
Minutes0.00 2.00 4.00 6.00 8.00 10.00 12.00 14.00 16.00 18.00 20.00 22.00 24.00 26.00 28.00 30.00
LP541 Metacresol
DimersHigher Order
Multimers
Proteinfragments
6 Month StressedDrug Product Sample@ 30°C/65%RH

SEC and RP-HPLC Analysis: Phase 3 DP
14
♦ Monitoring of comparability continues throughout program♦ Phase 3 batches shown:
• Lower Mw PEG (supplier 3), influences:– API purification parameters– Results in reduced purity (may be compensated by column load)
• Stability performance remains constant.

PEG remains intact over the shelf-life
DS Batch C065137Initial
DS Batch C0651379 weeks, 25°C, 60 % RH
DP Batch TP12089Initial
DP Batch TP120893 Months, 30°C, 65% RH
♦ Mass analysis of stressed drug substance and drug product
15

PEG remains intact over the shelf-life
♦ Expanded Plot of [M+5H]5+ TOF-MS Spectra♦ Identical observations for all 3 suppliers
16

CEX Analysis
CEX-HPLC Related Substances
and Impurities: % Total
PEG Storage Condition T=0 0.5 M 1M 2M 6M
Supplier 12-8 °C
30°C/60%RH40°C/75% RH
4.8
5.95.3 5.9
3.7
Supplier 22-8 °C
30°C/60%RH40°C/75% RH
5.5
6.66.2 6.6
3.7
Supplier 32-8 °C
30°C/60%RH40°C/75% RH
5.1
6.36.0 6.7
4.0
AU
-0.004
-0.002
0.000
0.002
0.004
0.006
0.008
0.010
0.012
0.014
0.016
0.018
0.020
0.022
0.024
0.026
0.028
0.030
0.032
0.034
0.036
0.038
0.040
0.042
Minutes0.00 5.00 10.00 15.00 20.00 25.00 30.00 35.00 40.00 45.00 50.00 55.00 60.00 65.00 70.00 75.00
1 2 3
46 7 5
Dea
mid
atio
nC
lip
N-te
rmin
us P
EG
Disulfide rearranged impuritiesD
i-PEG
ylat
ion
High stress sample
System suitability
17

CEX Analysis: Phase 3 DP
1835689C 0356
SS
S
S
♦ Monitoring of comparability continues throughout program♦ Phase 3 batches shown
• Stability performance remains constant

Peptide Map
19
AU
-0.20
0.00
0.20
0.40
0.60
0.80
1.00
1.20
1.40
1.60
1.80
2.00
Minutes0.00 2.00 4.00 6.00 8.00 10.00 12.00 14.00 16.00 18.00 20.00 22.00 24.00 26.00 28.00 30.00 32.00 34.00 36.00 38.00 40.00 42.00 44.00 46.00
♦ Glu-C peptide map characterization method• PEGylated fragment is late eluting (not shown)• Utilized to confirm CEX-HPLC observation• Sensitive to deamidation and disulfide rearrangements
Metacresol
PeptidefragmentsPeptide
fragments

Bioassay as a potential CQA
20
70.0
80.0
90.0
100.0
110.0
120.0
130.0
0 3 6 9 12
Pote
ncy B
y Cell
Bas
ed B
ioas
say (
%)
Time (Weeks)
C082449
C096546
C096548
C141565
C146588
C146591
C153910
C158833
Phase 3 API (PS + PV)Stressed at 25°C:
♦ 3 PEG suppliers♦ Purity decline observed by
RP-HPLC ♦ Potency decline is difficult
to detect beyond method variability 70.0
75.0
80.0
85.0
90.0
95.0
100.0
0 3 6 9 12Pu
rity
RP-H
PLC
(%)
C082449
C096546
C096548
C141565
C146588
C146591
C153910
C158833

Bioassay Drug Product Data
21
70
80
90
100
110
120
130
0 1 2 3 4 5 6
Pote
ncy
by C
ell b
ased
Bio
assa
y (%
)
Time (Months)
C142266
C142474
C146136
70
75
80
85
90
95
100
0 1 2 3 4 5 6
Puri
ty R
P-H
PLC
(%)
Time (Months)
C142266
C142474
C146136
Phase 3 DP PS batchesStressed at 30°C:
♦ Each batch is different PEG supplier
♦ Purity decline observed by RP-HPLC
♦ Potency decline is difficult to detect beyond method variability

22
Phase 3 accumulated experience
♦ 13 commercial scale API batches (data shown)♦ 11 drug product batches♦ The data set allows applying statistic tools for comparability studies

Clinical Evaluation of PEG Suppliers
♦ Phase 1 PK/PD Study♦ Healthy volunteers administered single injection of LP541 with each PEG
supplier on 3 separate occasions followed by PK sampling♦ CMC provided information on CT batches including the Mw of the PEG
batches used♦ No correlation was observed to PEG Mw♦ No difference observed in PD
♦ Phase 3 Study (one of the global Phase 3 studies)♦ Patient population♦ Open label study, LP541 arm randomized to a single PEG supplier ♦ Subgroup analysis as a function of PEG supplier♦ Different suppliers did not impact the PK and PD♦ No difference in safety data
23

PEG Supplier Evaluation
Clinical Efficacy/Safety
PK/PD (human)
ToxicologyStudies
Release & Stability Testing
Bioassay Testing
Additional Characterization Testing
Phase 2/3 PV and BLA
Primary Stability:Statistical comparability compared to clinical experience to date(API site change)
Start of Phase 3:Side by Side PEG Supplier comparability analytical data package
Phase 3 Global StudyPhase 1 PK/PD Study
Mixed PEG:Analytical comparability demonstrated with mixed PEG suppliers to support commercial supply chain flexibility
24

Control Strategy for Commercial Supply
♦ For commercial supply:• Drug substance was stored frozen in 50 L HDPE containers• Required a “floating batch” strategy for DP
♦ The DP facility was intending on using a FIFO approach
• LC-TOF analysis for Mw and PDI control the incoming PEG reagent
• RP-HPLC and CEX-HPLC ensures that only one PEG is attached to protein and at the correct position
• RP-HPLC ensures that de-PEGylation does not occur over shelf-life and patient in-use period
25
PEG
• Mw• PDI
Drug Substance
• RP-HPLC• CEX-HPLC
Drug Product
• RP-HPLC

Quality control of the drug productA
U
0.00
0.02
0.04
0.06
0.08
0.10
0.12
0.14
0.16
0.18
0.20
0.22
0.24
0.26
0.28
0.30
0.32
0.34
0.36
0.38
0.40
0.42
0.44
0.46
0.48
0.50
Minutes0.00 2.00 4.00 6.00 8.00 10.00 12.00 14.00 16.00 18.00 20.00 22.00 24.00 26.00 28.00 30.00 32.00 34.00 36.00 38.00 40.00 42.00 44.00 46.00 48.00 50.00 52.00 54.00 56.00 58.00 60.00 62.00 64.00
CEX Chromatography of DP made with more than one source of PEG-API
1.7 kD MW difference - OKLot H01020-121-A18.4 kD + 20.1 kD PEG
2.3 kD MW difference - OKLot H01020-121-B20.1 kD + 22.4 kD PEG
3.1 kD MW differenceLot H01020-121-E18.4 kD + 21.5 kD PEG
4.0 kD MW differenceLot H01020-121-C18.4 kD + 22.4 kD PEG
• If two PEG batches are combined that are separated by more than 2.3 kD, failures in the analytical methods would occur.
• Also occurs in SEC & RP-HPLC.• Controlling this by segregating
PEG in DS manufacturing is complex.
• Note: 18.4kD and 22.4kD PEGs intentionally ordered from suppliers.
26

Statistical Model for Mw and applying a singular control limit across suppliers
Supplier 2 3 1 (Phase 1/2)N= 17 7 22Average Mw 21727 20125 21484
Max Mw 21871 20324 21716
Min Mw 21585 19880 21335
Std. Dev. 88 145 74± 6 Std. Dev (rounded) 21200 - 22260* 19260* - 20990 21040 - 2193095/99.5 Tolerance levels 21364 - 22089 19299 - 20950 21199 - 21768
18,000 19,000 20,000 21,000 22,000
TOF-MS specification 19,260-22,260 Dalton
Supplier 2Supplier 3
Supplier 1Predicted TOF-MS with ±6 Std. Dev.
27

28
Proposed commercial PEG specifications
Test Procedure Acceptance criteria Critical parameter
Physical Appearance Visual Appearance White to Off-white Powder
Identity LC-TOF-MS Retention time cGMP requirement
Weight Average Molecular Weight LC-TOF-MS NLT19.3 kDa and
NMT 22.3 kDaImparts the long-acting PK/PD profile
Polydispersity Index LC-TOF-MS Not more than 1.01 Defines distribution of molecular weights
Functional Activity RP-HPLC Not less than 90 % Impacts only at extreme conditions)
Bi-functional PEG RP-HPLC Not more than 4.0 % Shown not to induce dimers
Water Content Karl-Fischer Not more than 1.0 % Significant hydrolysis could impact reaction
Free p-Nitrophenol RP-HPLC Not more than 200 ppm No known impact
Residual Solvents GC Review of Supplier Certificate of Analysis
Considerable process removal exists

♦ A statistical comparison of drug product accelerated stability data (30°C/65% RH) was conducted.
♦ Intent was to verify the comparability of drug product manufactured using different PEG suppliers versus mixed PEG suppliers.
♦ Acceptance criteria were applied to batch release and characterization data
♦ Acceptance criteria were applied to accelerated stability data.♦ Mixed PEG source DP was generated from all 3 possible
combinations:• Supplier 1 + Supplier 2• Supplier 1 + Supplier 3• Supplier 2 + Supplier 3
29
Introducing mixed PEG supplier batches

30
♦ Common slope test:• A singular slope is provided for the mixed PEG supplier• When the p-value is greater than 0.05, no statistical differences exist• p-Value was 0.69
Introducing mixed PEG Supplier batches

31
♦ Common slope test:♦ p-Value was 0.046 and required further assessment:
• The mix PEG supplier data had a slightly lower degradation rate indicating that using mix PEG suppliers would be acceptable
• As more data was collected, the apparent differences diminished
Introducing mixed PEG Supplier batches

32
Introducing mixed PEG Supplier batches
♦ Common slope test:• A singular slope is provided for the mixed PEG supplier• When the p-value is greater than 0.05, no statistical differences exist• p-Value was 0.59

33
Summary
♦ Analytical comparability (including in-vitro data) was used to introduce two PEG suppliers into the Phase 3 program
♦ PEG methods and control parameters were refined to allow a viable commercial supply chain using 3 PEG suppliers
♦ Analytical comparability with statistical acceptance criteria was utilized to allow mixed PEG supplier batches (Drug Product)
♦ Clinical Comparability was demonstrated during the Phase 3 registration program

Acknowledgements
♦ Team Members:♦ Cindy Payne♦ Stan Szewczyk♦ Chi Nguyen
♦ Characterization:♦ Clayton Gough
♦ Purification Scientist:♦ Dr. Jonathan Webb
♦ Statistician:♦ Kevin Guo
♦ TS-MS Senior Engineer:♦ Andrew Rockabrand
♦ RACMC Consultants:♦ Allison Wolf♦ John Dougherty♦ Dr. Bruce Meiklejohn
♦ Bio-Product Consultant:♦ Dr. Viren Sarin
34