critical chains and its randomness study
TRANSCRIPT

Critical Chains and Its Randomness StudyXiaokang Han ( [email protected] )
Xi’an University of Architecture and TechnologyWenzhou Yan
Xi'an University of Architecture and TechnologyTing Liu
Xi'an University of Architecture and Technology
Research Article
Keywords: critical chain, critical path method, comparative study, randomness, duration optimization,resource constraints
Posted Date: May 20th, 2021
DOI: https://doi.org/10.21203/rs.3.rs-522605/v1
License: This work is licensed under a Creative Commons Attribution 4.0 International License. Read Full License
Critical Chains and Its Randomness Study 1
Xiaokang HAN*1,2, Wenzhou YAN1, Ting LIU1 2
1Xi’an University of Architecture and Technology, School of Management, Xi’an 710055, China 3
2Hualu Engineering & Technology Co., Ltd., Project Control Department, Xi’an 710065, China 4
X.H. (Academic position: PhD student and Senior Engineer, Last Degree earned: MSc, e-mail: 5
W.Y. (Academic position: Professor, Last Degree earned: PhD, e-mail: [email protected]) 7
T.L. (Academic position: MSc Student, Last Degree earned: Bachelor degree, e-mail: [email protected]) 8
Corresponding author 9
E-mail: [email protected] 10
ORCID 11
https://orcid.org/0000-0002-7442-4944 12
Conflicts of interest/Competing interests 13
The authors declare that they have no conflict of interest. 14
Acknowledgements 15
This work was supported in part by the National Natural Science Foundation of China under Grant 16
51808424 and under Grant 51478384, and in part by the Industrial Building Environment and Energy 17
Conservation Innovation Team of China under Grant 2017KCT-14. 18
Received Date: 19
20
21
22
23

Critical Chains and Its Randomness Study 24
25
Abstract: It has been widely accepted in the academic community that the Critical Chain Method (CCM) 26
has significant advantages over the Critical Path Method (CPM) in solving the problem with resource 27
constraints. However, this paper conducted a study on comparing the two methods of Critical Chain 28
Method and Critical Path Method, and found that the only difference between those two methods lies in 29
how to determine the priority of resources allocating, and on the assumption of not setting buffer zone, 30
those two methods have no essential distinctions at all. By establishing the relationship between CCM and 31
CPM, this paper also enriched and improved CCM to some extent, and pointed out that the buffer zone 32
setting in CCM is merely subjective and short of scientificity. In the meantime, for the problem of unclear 33
representation of critical chains, it proposed two ways of representing critical chains and related rules to 34
follow. To verify the conclusion of this paper, further detailed case study of comparing CCM and CPM was 35
performed. Affected by various uncertain factors, the project construction sequence is random, the total 36
construction duration is random, and the critical chain is also random, so it is unable to determine how to 37
direct construction. Aiming at the randomness of the critical chain, this article analyzed various uncertain 38
factors of the critical chain, and on the basis of solving the critical chain sequence time, it proposed the 39
approach to determine the completion probability of the total construction duration and control the 40
construction of the critical chain to direct the construction, in the meantime, the inverse algorithm was 41
adopted to determine of the construction duration under the condition of required completion probability. 42
43
Keywords: critical chain; critical path method; comparative study; randomness; duration optimization; 44 resource constraints45
1. Introduction
In order to solve the problem of limit resources in the construction project, Dr. Goldratt proposed the
Critical Chain Method (CCM)[1,2]. Once proposed, this method had aroused great interests and extensive
researches in academia. CCM has been widely accepted to be superior to traditional Critical Path Method
(CPM). However, through a comparative study by the authors, it is concluded that there is no essential
distinctions between the two, and the only difference between those two is about the method of determining
the priority of resource allocation and the buffer zone[3].
The critical chain proposed based on the constraint theory has significant advantages in solving
resource constraints and construction time waste caused by inefficiency of workers. The critical chain has
two technical points when solving the problem, the identification of the critical chain and the setting buffer
zone[4].
Adopting a heuristic algorithm
jitotal LSTACTIM (1)
determine the start sequence, adjust the logical relationship between the work predecessors and successors,
and obtain the longest chain in time that meets the resource limit requirements which is the critical chain
identified. However, the heuristic algorithm can only solve the problem of determining the operation time
of the sequence.
In the middle of construction process, affected by various uncertain factors, the time factors such as
the earliest start time and the latest finish time of the activity are uncertain. It also leads to uncertainties in

construction sequence variance and activity durations. The randomness of sequence duration leads to the
uncertainty of the total construction duration after the project logical sequence change. The ACTIM
algorithm cannot identify critical chains with uncertain sequence duration and total duration. When there is
more than one critical chain, the variance of different critical chain sequences’ duration is different, and
there are differences between the critical chains. The uncertainty of the sequence duration of the critical
chains, the uncertainty of the total construction duration, and the differences between the critical chains
lead to the randomness of the critical chains.
The purpose of the buffer zone is to absorb the risks caused by reducing the duration of critical chain
processes. However, the setting of buffer zone is not scientific and reasonable, and there exists a problem
that the buffer zone may be set too large or too small.
The traditional method is not applicable to the identification of critical chains with random
characteristics and the problem of unreasonable buffer settings. Based on this, the article studied the
randomness of critical chains and the problem of buffer setting.
2.Review on Critical Chains
On solving the problem of limited resources, CCM has two technical key points of critical chain
identification and buffer zone setting.
2.1 Identification of critical chain
The identification of critical chain is an algorithm that allocates resources reasonably under the
resource constraints. There are quite a few methods for identifying, the most commonly used is a heuristic
algorithm based on priority rules proposed by Goldratt, also known as ACTIM value method. Here is
formula (2)
jiLSTACTIM (2)
In this formula,T -Total Duration, jiLS -Latest Start Time of an activity.
When resource conflicts occur between activities, the priority of resource allocation can be determined
by the ACTIM value: the activity with larger ACTIM value has higher priority over he activity with smaller
ACTIM value on resource allocation. This may cause changes in the logical relationships between related
activities in the original network diagram and delays in the total construction duration, and there will be
multiple critical chains. However, there has not been sufficiently studied regarding this issue up to present,
and neither on how to represent the critical chains under the resource constraints.
2.2 Setting buffer zone and its problems
In the execution of a project, at the beginning people are more tend not tohurry to work at full strength
until it’s getting closer to the project finish phase. It's like students tend to waste most of their time outside
of studying, whereas study extremely hard right before the exam coming. This phenomenon is called
“Student Syndrome”, which is expressed in Parkinson's Law- How much time left will automatically
become the time needed to complete that work, that is, the work will always be dragged down to be
completed to the last minute, and never be completed ahead of time[6].
To mitigate the impact of “Student Syndrome” or Parkinson's Law on the project duration, the critical
chain technology proposed a method of setting a buffer zone. The essence of it is to reduce the working
time of each process and gather the reduced time together for setting up a buffer area for use. Common
buffer setting methods are 50% clipping method and root variance method.

No matter which method is used to set the buffer zone, it is a subjective method and lacks scientific
basis. The purpose of setting up the buffer zone is to solve the problem of “Student Syndrome”, but this is
not the only solution. It is entirely possible to make a scientific and reasonable estimate of the activity
duration by studying various uncertain factors affecting the activity duration, including “Student
Syndrome” that may occur. Therefore, it is not necessary to set the buffer zone.
3. Determination and representation of critical chains
3.1 Rules for determining critical chains
According to the ACTIM value method proposed by Goldratt, it mainly solves the issue of resource
allocating priority when the resource is limited, and meets the constraint condition of resource priority
allocation order, which may change the logical relationships between some activities s in the original
network and form new paths. It increases the difficulty of identifying critical chains, for which the
following basic rules must be followed:
(1)Meet the constraints of resource limits.
(2)New paths formed after changes in the logical relationships between certain activities must be
considered.
(3)The sum of the durations of all activities on the same path is the longest.
This often leads to multiple critical chains. How to present the critical chain clearly and intuitively is a
problem to be solved.
3.2 Representation of critical chains
There are many researches on the critical chain, but there is still no consensus has been reached on the
representation of the critical chain, and the problem that the critical chain representation is unclear still
exists. The key to solving this problem is to clearly show the change in the logical relationships between
some activities after meeting the resource constraints. This paper proposed two representations of critical
chains.
Taking Fig.1 as an example, assuming that all activities use the same resource and the buffer zone
setting is not considered, the numbers in parentheses on the arrow line indicate the resource requirements
(cubic meters / week), and the numbers below the arrow line indicate the duration of activity (week ). The
maximum resource limit is 20 cubic meters per week.
Figure 1 Directly mark out the changes in critical chains and related activity logic relationships on the
network diagram According to the resource constraints and critical chain determination rules, determine the new logical
relationships and critical chains between the activities, and use the double solid line or thick solid line to

directly mark out on the network diagram. The double solid lines in Fig.2 represent two critical chains: A-C-F-G and B-D-F-G. If the work in the network diagram has no logical relationships, after adjusting the resources, it becomes a Finish-Start relationship, and it is located on the critical chain, and the operations are still marked with double solid lines. For example, activity A and activity C originally had a parallel relationship, and after adjustment of resources, there was a Finish-Start relationship, and a double solid line was artificially added to form a complete critical chain. In this way, the critical chain and the change in the logical relationships between the activities that meet the resource limit can be seen intuitively and clearly from the figure. The wavy line in the figure indicates the float time.
Figure 2 Critical chain representation
(2)Adding nodes and dummy activities to annotate the changes of critical chains and relevant activity
logic relationships.
The first representation method is relatively simple and easy to operate, but there will arrow line
crosses that do not meet the drawing rules of the network diagram. If the work in the network graph
originally had no logical relationships, after the resource adjustment, the logical relationship of Finish-Start
can be represented by adding nodes and dummy activities. The critical chain is still represented by double
solid line or thick solid line. As shown in Fig.3, node 3 and dummy activity 2-3 are added between
activities A and C. Similarly, nodes 8 and 9 are new nodes. The critical chains are still A-C-F-G and
B-D-F-G. The expression is clearer, especially when there are multiple key chains, which is more
advantageous.
Figure 3 Critical chain representation

4. Comparison of CCM and CPM
A comparative study of the Critical Chain Method and Critical Path Method using the network plan
shown in Fig.4 is based on the following assumptions:
(1) The duration of every activity is a fixed value and does not change;
(2) Do not consider the buffer zone setting for the critical chain;
(3) Once a activity is started, it must not be interrupted to ensure the integrity of the construction
process;
(4) The resource allocation intensity of each activity is balanced and reasonable, and will not be
changed during the optimization process.
(5) All activities use the same resource, and the resource limit is 12max R (cubic meters / week)
Figure 4 A comparative study of the Critical Chain Method and Critical Path Method
4.1CPM solution process
(1)CPM optimization fundamentals
Using the peak-cutting method in CPM, assuming that the total resource demand exceeds the resource
limit at a certain time period, there are several activities being performed at the same time, and any two
activities A and B are changed from the original parallel operation to A is performed before B[7], as shown
in Fig.5.
Figure 5 Optimization principle diagram
Then proceed with the new sequence, the extended construction duration is:
babbaba LSEFLFDEFT , (3)
where, baT , —when activity A is arranged before activity B, the corresponding duration is extended.
baT , —The smallest one will get top priority on resource allocation.

aEF —Earliest Finish time of activity A
bLS —Latest Start Time for activity B.
Similarly, we can get abT , , compare
baT , and abT , , and choose the smallest one as the
optimization solution.
(2)Main optimization steps
During the period (3,4), A and C running simultaneously.
R(3,4)=Ra+Rc=5+8=13,R(3,4)> Rmax
Priority of resource allocating of resources is required. There are two possible solutions: activity A is
performed before activity C and the duration is not extended; Activity C is performed before activity A and
the duration is extended by 2 days. So, choose activity A before C. As shown in Table1.
Table 1 Working time parameters for periods exceeding the resource limit
Activity EF LS sequence plan 1 plan 2
A 4 4 Predecessors A C
C 6 7 Successors C A
baT ,
-3 2
During the period of (7,9), there are D, E, and F working simultaneously.
R(7,9)=Rd+Re+Rf=4+4+7=15
R(7,9)>Rmax
Priority of resource allocation is required. There are 6 possible solutions. Activity D is performed
before activity E and the duration is extended by 1 day. Activity D is performed before activity F and the
duration is not extended. Activity E is performed before activity F and the duration is extended by 1 day;
Activity E is performed before activity D and the duration is extended by 2 days; Activity F is performed
before activity D and the duration is extended by 5 days; Activity F is performed before activity E and the
duration is extended by 1 day. So select activity D before activity F, as shown in Table 2.
Table 2 Activity time parameters for periods exceeding the resource limit
Activity EF LS sequence plan 1 plan 2 plan 3 plan 4 plan 5 plan 6
D 9 8 Predecessors D D E E F F
E 10 8 Successors E F F D D E

F 13 9 baT ,
1 0 1 2 5 5
(3)CPM-based determination and representation of critical chain
To meet the resource constraints, the critical chain is A-D-F, as shown in Fig.6. Among them, activities
A and C, and activities D and F are new logical relationships.
Figure 6 Schematic of the key chain based on CPM and CCM
4.2CCM solution process
To solve the network plan resource constraint issue shown in Fig.6 by applying key chain method, the
main steps are indicated as the following:
(1)Calculate the latest start time (LS) of each activity and the total duration of the project.
The total duration of the network plan was determined to be 13 weeks by the CPM method. The latest
start time of each activity is shown in the second row of Table 1.
(2) Calculate the priority of resource allocation for each activity
Adopt the heuristic algorithm and obtain the ACTIM value of each activity according to formula (1),
see the third row of Table 1.
(3) Determine the start time and end time of the activity
For allocating resources based on the ACTIM value and constraints, if the amount of simultaneous
resources demand in a certain period exceeds the maximum resource limit. The resource with the highest
ACTIM value is allocated first, and the smaller one is pushed backward. According to this method, until all
the activities meet the resource limit requirements, the start time and finish time of each activity are
re-determined. The specific results are shown in rows 6 and 7 of Table 1.
(4) Identify critical chains
In order to meet the resource limit requirements, activities A and C, and activities D and F are
transformed from the original parallel relationship to the immediately Finish-Start relationship. At this time,
the length of the line formed by steps A, D, and F is the longest, so the critical chain is A-D-F, as shown in
Table 3.
Table 3 The critical chain identification and duration calculation influenced by resources

1 Activity name A B C D E F H
2 LS 2 0 3 6 6 7 9
3 ACTIM 9 11 8 5 5 4 2
4 Activity duration 4 3 3 5 3 4 2
5 Resource demand 5 6 8 4 4 7 5
6 Adjusted start time 0 0 4 4 7 9 10
7 Adjusted finish time 4 3 7 9 10 13 12
4.3 Comparison of CCM and COM results
From the above results, there is no difference between CCM and CPM when the buffer zone setting is
not considered.
The article compared the Critical Chain Method and Critical Path Method through case studies, and
drew the following conclusions:
(1)The buffer zone setting in the Critical Chain Method is a subjective method and lacks scientificity.
To solve the problem of “Student Syndrome”, other methods can be adopted;
(2)Two representation methods of the critical chain were proposed to make the expression of the
critical chain clearer and more intuitive;
(3) If the buffer zone setting is not considered, there is essentially no difference between Critical
Chain Method and Critical Path Method; the only difference is about the method of determining the priority
of resource allocation.
Therefore, the comparative study of this article enriches and improves the Critical Chain Method and
opens up the connections between CCM and CPM.
5. Uncertainty Factor Analysis
The randomness of the critical chain is mainly caused by the uncertainty of the total duration of the
construction sequence[11]. The critical chain projects with large time span and complicated procedures are
affected by various uncertain factors such as the local economy, politics, and technics , resulting in
turbulence of the durations of activities, which ultimately affect the total duration of the project. The critical
chain sequence duration is determined by four factors: construction quantity, planned productivity rate,
manpower and equipment manhour invested, and the number of shifts in work[5].
(1) Construction quantity
Uncertain factors affect the construction sequence duration by affecting the construction quantity.
Once the construction drawings are determined, the project's quantity will usually not change, but design
drawings’ defects, construction problems and other factors can cause the project's quantity to change, and
activity durations and the total construction duration would change consequently.
(2) Productivity rate
Uncertainty affects the duration of a sequence by affecting the planned productivity rate. Although the
planned productivity rate is reasonable and scientific, deviation always exists between the plan and the
actual productivity. In fact, unexpected situations happen in real-world construction jobs. For example, the
impact of bad weather on workers’ efficiency makes the critical chain impossible to be implemented with

the planned productivity rate, which affects the construction sequence duration.
(3) Manpower and manhours
During project implementation, in the manpower and equipment manhours are maintained in a
constant state. Therefore, once personnel and work shift change would affect the construction sequence
duration and project duration[11].
(4) Working shifts
To complete the work as soon as possible, the construction shift change causes the actual progress to
be inconsistent with the planned progress, which affected the activity duration.
Therefore, the activity duration is affected by construction quantity, planned productivity rate,
manpower and equipment manhours, and work shifts. Any changes in any single factor would affect the
construction sequence duration of the critical chain, and the duration of the construction sequence is
random.
6.Estimation of a activity duration
Due to the existence of many uncertain factors mentioned above, the duration of a activity is uncertain,
which makes the start and finish time of each activity and the total construction duration uncertain. For this
reason, it is necessary to make a scientific and reasonable estimation of the activity duration. Commonly
used approaches are theoretical calculation, three-point estimation and two-point probability estimation,
etc[8].
Theoretical calculation refers to the estimation about activity duration based on construction quantity,
productivity rate, manpower and equipment manhours, and work shifts, but the theoretical calculation does
not take into account the impact of uncertain factors on the project activity duration, and the estimation
results are not accurate. In order to make the activity duration estimation as scientific and accurate as
possible, the most optimistic time, common time and most pessimistic time of the activity duration are
estimated under the influence of uncertain factors, and the three estimated times are used as the process
under uncertainty basic data for working hours[9].
Assume that the activity duration follows the distribution, and estimate the expectation of each
activity duration. The calculation formula is as follows:
6
4 cbai
(4)
Among them, a is the most optimistic operation time of process i ;
b is the most probable operating time of process i ;
c is the most pessimistic operation time of process i .
The corresponding variance of operation time is:
2
6)(
aci
(5)
7. Probability estimation and determination of critical chains
7.1 Estimate of total construction period and completion probability
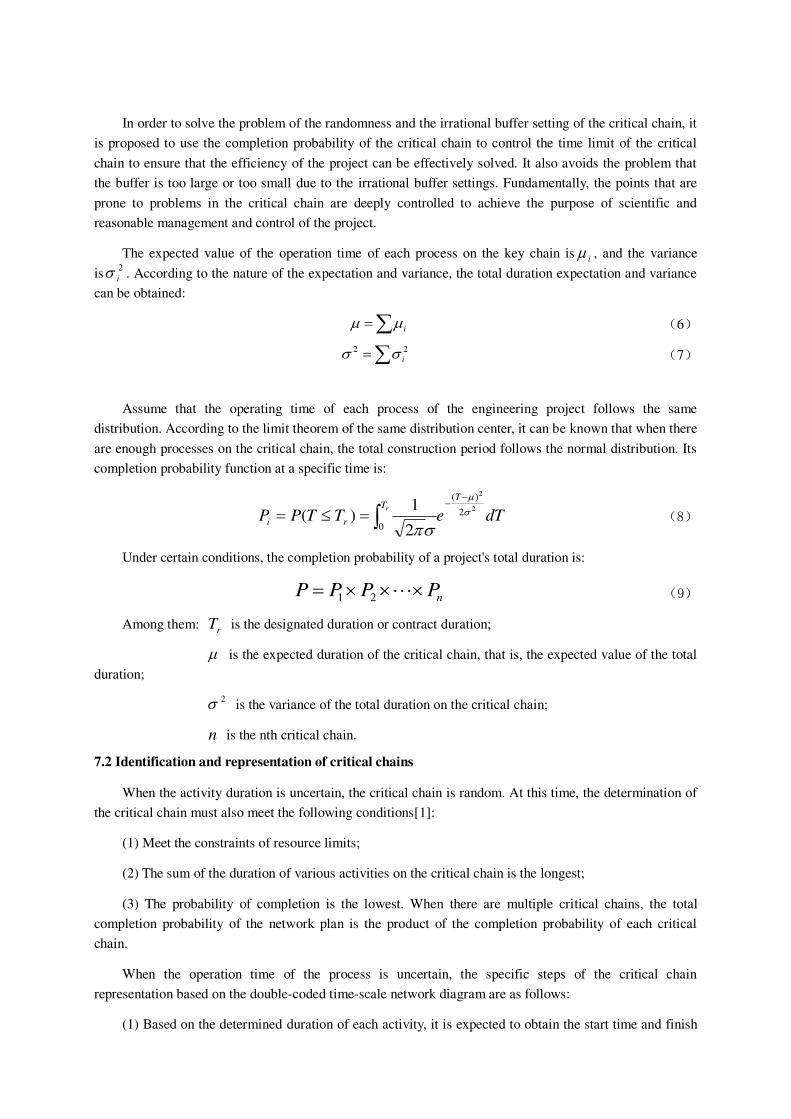
In order to solve the problem of the randomness and the irrational buffer setting of the critical chain, it
is proposed to use the completion probability of the critical chain to control the time limit of the critical
chain to ensure that the efficiency of the project can be effectively solved. It also avoids the problem that
the buffer is too large or too small due to the irrational buffer settings. Fundamentally, the points that are
prone to problems in the critical chain are deeply controlled to achieve the purpose of scientific and
reasonable management and control of the project.
The expected value of the operation time of each process on the key chain is i , and the variance
is 2i . According to the nature of the expectation and variance, the total duration expectation and variance
can be obtained:
i (6)
22i (7)
Assume that the operating time of each process of the engineering project follows the same
distribution. According to the limit theorem of the same distribution center, it can be known that when there
are enough processes on the critical chain, the total construction period follows the normal distribution. Its
completion probability function at a specific time is:
dTeTTPP
TT
ri
r 2
2
2
)(
0 2
1)(
(8)
Under certain conditions, the completion probability of a project's total duration is:
nPPPP 21 (9)
Among them: rT is the designated duration or contract duration;
is the expected duration of the critical chain, that is, the expected value of the total
duration;
2 is the variance of the total duration on the critical chain;
n is the nth critical chain.
7.2 Identification and representation of critical chains
When the activity duration is uncertain, the critical chain is random. At this time, the determination of
the critical chain must also meet the following conditions[1]:
(1) Meet the constraints of resource limits;
(2) The sum of the duration of various activities on the critical chain is the longest;
(3) The probability of completion is the lowest. When there are multiple critical chains, the total
completion probability of the network plan is the product of the completion probability of each critical
chain.
When the operation time of the process is uncertain, the specific steps of the critical chain
representation based on the double-coded time-scale network diagram are as follows:
(1) Based on the determined duration of each activity, it is expected to obtain the start time and finish

time of each activity that meets the resource limit conditions based on the ACTIM value;
(2) Draw a time-scaled network diagram based on the start time and finish time, and draw double solid
lines for the sequence in which the time on the critical chain is sequentially connected, and at the same time,
add nodes manually at the node-free time sequence transfer. As shown in Fig.2, when there are multiple key
chains, all can be represented by one icon.
8. Examples
(1) Known conditions: The relevant information of a project is shown in Table 4. The resource limit is
12aR units, and the specified construction period is dTr 14 .
Table 4 Operation time related parameters
Activity name Successor Expected duration Duration variance
B C 3 0.3
A D 4 0.5
C E、F 3 0.6
E G 3 0.7
D / 5 0.2
G / 3 0.8
F / 4 0.2
(2) Draw network diagram. Based on the known conditions shown in Table 1, the network is drawn as
shown in Fig.7. The numbers above the arrows indicate the resource intensity of the activity, and the
numbers below the arrow indicate the expected activity duration.
Figure 7 Network for a case project
(3)Identify critical chains. ACTIM heuristic algorithm is adopted to identify the critical chain,
determine the ACTIM value, and the expected start time and finish time of each activity.
Table 5 The critical chain identification and duration calculation influenced by resources
Activity B A C E D F G
LSi-j 0 3 3 6 7 9 8
ACTIM 12 9 9 6 5 3 4
Activity duration 3 4 3 3 5 3 4
Resource demand 6 5 8 4 4 5 7

Start time 0 0 4 7 4 9 10
Finish time 3 4 7 10 9 13 13
According to the above method, two critical chains A-C-E-G and A-D-F can be obtained, and the
expected construction duration is 13d.
(4) According to the data in Table 5, draw the diagram of the critical chain representation in the
network diagram, as shown in Fig.8 below.
Figure 8 Critical chain network for a project
(5) There are two critical chains. The completion probability of different critical chains in the specified
construction duration are:
① For the critical chain A-D-F,
Variance: 2.122221 FDA ,When the specific duration is 14d, according to formula (6),
8.01 P can be obtained.
② For the critical chain A-C-E-G,
Variance: 6.28.07.06.05.0222222 GECA ,when the specific duration is
14d, 7.02 P can be obtained.
At 14d, the total completion probability of the critical chain is 56.021 PPP , and critical
chain A-C-E-G need to be controlled well to ensure completion on time.
9. Conclusion
By analyzing the uncertain factors of the critical chain, the article had made the following conclusions:
(1) The uncertainty of the activity duration of the critical chain sequence can be confirmed by the
expectation of the activity duration;
(2) Using fixed probability to determine the completion probability at a specific time can achieve the
purpose of determining which critical chain to direct the construction;
(3) The critical chain representation method based on the time-scaled network graph is used to make
the critical chain representation more intuitive and clearer.

Declarations
Not applicable.
Funding
This work was supported by the National Natural Science Foundation of China (51808424 and 51478384)
and the Industrial Building Environment and Energy Conservation Innovation Team of China
(2017KCT-14).
Conflicts of interest/Competing interests
The authors declare that they have no conflict of interest.
Ethics approval
Any submission that has data collected from human subjects requires ethics approval.
Consent to participate
Written informed consent was obtained from individual or guardian participants.
Consent for publication
Not applicable.
Availability of data and material
All data generated or analysed during this study are included in this published article.
Code availability
Not applicable.
Authors’ contributions
X.H. conceptualized the main idea of this research project; X.H. designed and conducted the experiments;
W.Y. and T.L. checked the results; X.H. wrote the whole paper. All authors have read and agreed to the
published version of the manuscript.
References
[1] Goldratt E.M.(1997). It’s Not Luck. Great Barrington: The North River Press.
[2] Goldratt E.M.(1997). Critical Chain. Great Barrington: The North River Press.
[3] Ashtiani B., Leus R., Aryanezhad MB.(2011). New competitive results for the stochastic
resource-constrained project scheduling problem: Exploring the benefits of pre-processing: Journal of
Scheduling, 14(2), 157–171.
[4] Ma G.F., Wang A.M., Li N.(2014).Improved Critical Chain Project Management Framework for
Scheduling Construction Projects: Journal of construction engineering and management,
140(12),1–12.
[5] You W.Y., Zhao Z. Y., Zuo J. (2010).Application of Innovative Critical Chain Method for Project
Planning and Control under Resource Constraints and Uncertainty: Journal of construction
engineering and management, 136(9),1056-1060.
[6] Geekie A.,Steyn H.(2008).Buffer sizing for the critical chain project management method: South
African Journal of Industrial Engineering, 19(1).73-88.
[7] Özcan E., Artigues C., Bourreau E., Afsar H. M.(2013). Special issue on maintenance scheduling:
theory and applications: Journal of Scheduling, 16(6),549–550.
[8] Leung J.Y.T.(2004).Handbook of scheduling: algorithms, models, and performance
analysis.CHAPMAN & HALL/CRC.
[9] PMI.(2008).A Guide to the Project Management Body of Knowledge(PMBOK® Guide)—Fourth
Edition.Pennsylvania:Project Management Institute, Inc.
[10] Han X. K., Niu J.,LU M.(2018). Project Scheduling Early Warning and Feedback System: Chinese
Project technology, (08),26-29.
[11] Harold K.(2017).Project Management: A Systems Approach to Planning, Scheduling, and
Controlling,11th edition. John Wiley&Sons,Limited..

Figures
Figure 1
Directly mark out the changes in critical chains and related activity logic relationships on the networkdiagram
Figure 2
Critical chain representation

Figure 3
Critical chain representation
Figure 4
A comparative study of the Critical Chain Method and Critical Path Method
Figure 5

Optimization principle diagram
Figure 6
Schematic of the key chain based on CPM and CCM
Figure 7
Network for a case project

Figure 8
Critical chain network for a project