cristina-mihaela gruian - babeș-bolyai...
TRANSCRIPT

“Babeş-Bolyai” University, Faculty of Physics, Cluj-Napoca, Romania
& University of Osnabrück, Department of Physics, Germany
Cristina-Mihaela Gruian
Protein adsorption onto bioactive glass –
conformational changes and quantitative analysis
PhD Thesis
Summary
Scientific coordinators:
Prof. dr. Simon Simion
Prof. dr. Heinz-Jürgen Steinhoff
Cluj-Napoca
2011

Table of Contents
1. INTRODUCTION ....................................................................................................................................... 1
2. MATERIALS AND METHODS ................................................................................................................. 5
2.1 Sample preparations ......................................................................................................................... 5
2.1.1 Bioactive glass preparation ........................................................................................................ 5
2.1.2 Spin labeling ............................................................................................................................. 5
2.1.3 Protein adsorption ..................................................................................................................... 5
2.2 Sample analysis ................................................................................................................................ 6
2.2.1 Cw-EPR measurements .............................................................................................................. 6
2.2.2 Four pulse DEER measurements ............................................................................................... 6
2.2.3 FTIR measurements ................................................................................................................... 7
2.2.4 XPS measurements .................................................................................................................... 7
2.2.5 SEM measurements ................................................................................................................... 7
3. RESULTS AND DISCUSSION ................................................................................................................... 7
3.1 Horse methemoglobin ...................................................................................................................... 7
3.1.1 Immobilization of methemoglobin on the bioactive glass substrate............................................. 7
3.1.2 Conformational changes in methemoglobin structure, induced upon interaction with bioactive
glass substrate – inter spin distances .......................................................................................... 9
3.1.3 Conformational changes in methemoglobin structure, induced upon interaction with bioactive
glass substrate – secondary structure ........................................................................................ 11
3.1.4 Quantitative adsorption analysis .............................................................................................. 13
3.2 MnmE from E.coli.......................................................................................................................... 18
3.2.1 Immobilization of MnmE on the bioactive glass substrate ........................................................ 18
3.2.2 Conformational changes in MnmE structure, induced upon interaction with bioactive glass
substrate – inter spin distances ................................................................................................. 21
3.2.3 Conformational changes in MnmE structure, induced upon interaction with bioactive glass
substrate – secondary structure ................................................................................................ 25
3.2.4 Quantitative adsorption analysis .............................................................................................. 27
4. CONCLUSIONS ........................................................................................................................................ 30
Selective Bibliography ......................................................................................................................... 32
Keywords: protein adsorption, bioactive glass, spin labeling, EPR, horse methemoglobin, MnmE, FTIR,
conformational changes, concentration of adsorbed protein, glutaraldehyde.

1
1. Introduction and motivation
Protein adsorption and subsequent changes in their conformation are the first biomechanical events
taking place at the surface of an implant after implantation and are determinants for further
physicochemical interactions. Hence, the first step in evaluating the blood and tissue compatibility of
any medical device is to study its behavior in terms of interactions with proteins. Both, the total amount
of adsorbed protein as well as the overall protein-implant surface area interactions are of primary
importance for the biocompatibility of a bioengineered material. Adsorption of protein molecules onto
solid surfaces frequently results in conformational and/or orientational changes within the adsorbed layer
[SERVAGENT-NOINVILLE et al. 2000, DOUSSEAU and PEZOLET 1990]. Because protein structures are
relatively unstable, proteins tend to unfold, allowing internal regions to form additional contacts with a
particular solid surface [EL-GHANNAM et al.1999]. This denaturation is often associated with a loss of
secondary or tertiary structure and results in irreversible adsorption.
Despite an increased understanding of many facets of protein adsorption in recent years, little is
known about conformational changes in protein’s structure. Moreover, protein behavior in its native
environment after adsorption as well as details concerning protein dynamics and the exact amount of the
protein attached remain largely unknown [LATOUR 2005, GRAY 2004, WERTZ and SANTORE 2001].
Most of the techniques which are frequently used to gain such information exhibit serious limitations
and are not easily adaptable to proteins adsorbed on solid surfaces. For example, it is difficult to obtain
high resolution X-ray structural information for the adsorbed proteins, whereas circular dichroism is not
easily adaptable to proteins adsorbed on solid surfaces [KARLSSON et al. 2000, TIAN et al. 1998].
Although many studies have used Fourier Transform Infrared (FTIR) spectroscopy as a surface-sensitive
technique to investigate protein structure, this method is not able to provide information about the
protein dynamics or its tertiary structure. Besides the methods mentioned above, site-directed spin
labeling (SDSL) in combination with Electron Paramagnetic Resonance (EPR) spectroscopy is a potent
alternative, which provides both detailed structural and dynamic information [FANUCCI et al. 2003,
HUBBELL et al. 2000], and therefore becomes very useful for the analysis of proteins in their native
environment. SDSL involves the introduction of a spin label at a specific site in the amino acid sequence
by cysteine substitution mutagenesis followed by modification of the sulfhydril group with a nitroxide
reagent.

2
Up to now, this method has been predominantly used for studying the structure and dynamic of
soluble proteins in solution or membrane proteins reconstituted in the their native membrane
environment [BORDIGNON and STEINHOFF, 2007]. Only few studies reported recently that it can be
extended to proteins adsorbed on planar lipid bilayers [JACOBSEN et al. 2005, RISSE et al. 2003], or
even on quartz solid surface [JACOBSEN et al. 2006]. Nevertheless, in these studies only continuous
wave EPR (cw-EPR) measurements are presented, to investigate adsorption-induced conformational
changes at the level of the backbone fold.
A primary goal of this work is to use EPR spectroscopy combined with site-directed spin labeling for
investigating adsorption of proteins on solid surfaces. In addition to cw-EPR, we intend to determine
inter spin distances in proteins adsorbed on solid surfaces by means of double electron electron
resonance (DEER) pulsed EPR from which a more detailed picture of the protein conformation and
conformational changes can be deduced. Another aim of this study is to investigate the effect of
glutaraldehyde as protein coupling agent in protein adsorption on bioactive glasses. For this purpose,
interaction of two model proteins: horse methemoglobin and MnmE (5-methyl-aminomethyl-uridine
forming enzyme) with bioactive glass which is commonly used as biomaterial for bone defects repair
was investigated in terms of conformational changes and quantitative adsorption properties.
Both proteins are medium size (horse methemoglobin has a molecular mass of 66.5 kDa while MnmE
is a 50 kDa protein) but belong to different classes. Horse methemoglobin is a metalloprotein consisting
of four polypeptide chains: two alpha types (141aa each) and two beta types (146aa each). Each protein
chain subunit contains a heme group whose four nitrogen atoms chelate an iron atom, but unlike
hemoglobin, the iron is oxidized into Fe3+
, inhibiting the oxygen-binding capabilities of the protein. It is
worth to mention here that previous studies have shown that GA induces polymerization of hemoglobin
[MACDONALD and PEPPER 1994, OKUDA et al. 1991, GUILLOCHON et al. 1986, WEETALL 1974]. This
protein has many lysine residues located on the surface, and interaction of these residues with GA leads
to protein cross-linking [OKUDA et al. 1991, WEETALL 1974], resulting in a multitude of species, e.g.
dimers, trimers and larger species [MACDONALD and PEPPER 1994, GUILLOCHON et al. 1986]. This
heterogeneous mixture of hemoglobin products with a variety of molecular weights and chemical
modifications makes the tetrameric structure of the molecule more rigid.
MnmE is a more complex protein, belonging to the class of G proteins. Previous studies have shown
that G domains of MnmE is activated by dimerization [GASPER et al. 2009], displays lower affinities
towards nucleotides and it requires GTP hydrolysis (stimulated by the presence of K+ [SCRIMA and
3
WITTINGHOFER 2006, SCRIMA et al. 2005]) to be functionally active. The crystal structure of MnmE
dimer suggests that each monomer consists of three domains: an N-terminal domain responsible for
constitutive dimerization, a central helical domain, and the G domain [SCRIMA et al. 2005]. It was
already shown that in the nucleotide free state the G domains face each other with their nucleotide
binding sites (Figure 2) without displaying any structural contacts between each other [MEYER et al.
2009]. In the presence of GDP-AlFx, which is the transition state mimicking the GTP hydrolysis, the G
domains contact each other by overcoming a 20-30 Ǻ distance gap [BOEHME et al. 2010a, BOEHME et al.
2010b]. ]. This large conformational change occurring upon activation makes this protein ideally suited
to study the influence of protein-bioactive glass interaction on functional conformational dynamics.
For elucidation of structural changes which may occur upon adsorption of horse methemoglobin and
MnmE on the surface of bioactive glasses, both proteins were investigated by EPR spectroscopy, in
terms of spin label side chain dynamics and inter spin distances. In this regard, paramagnetic centers
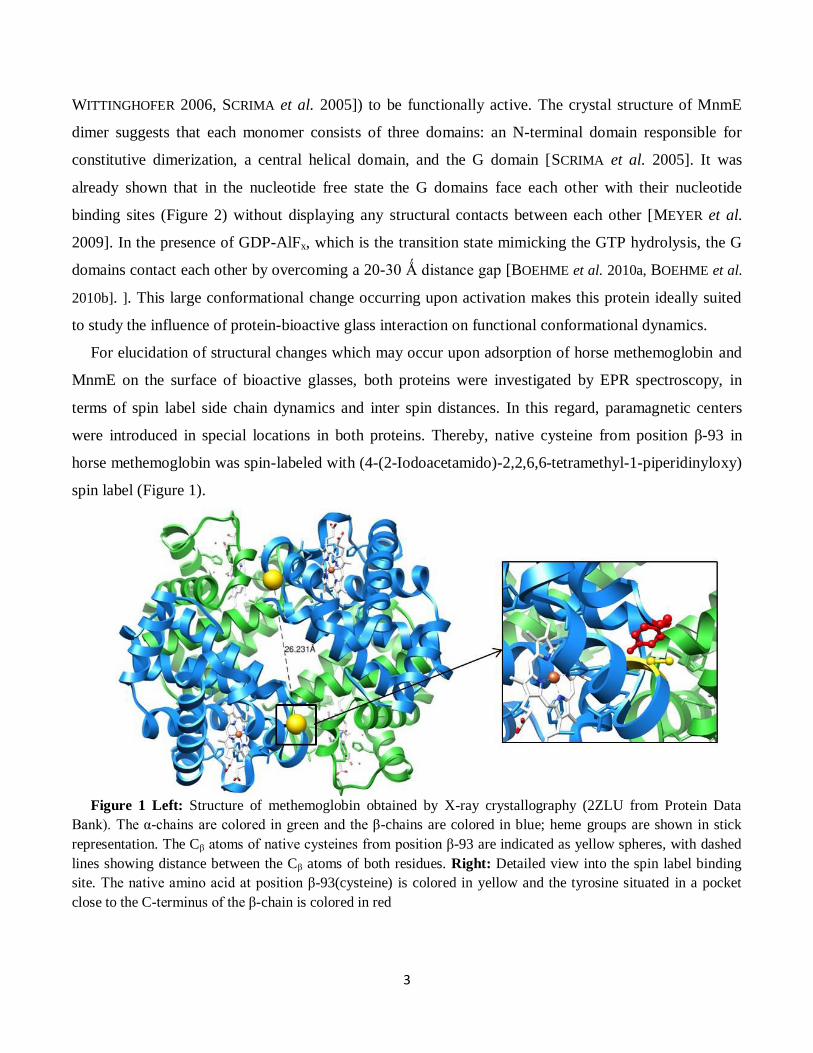
were introduced in special locations in both proteins. Thereby, native cysteine from position β-93 in
horse methemoglobin was spin-labeled with (4-(2-Iodoacetamido)-2,2,6,6-tetramethyl-1-piperidinyloxy)
spin label (Figure 1).
Figure 1 Left: Structure of methemoglobin obtained by X-ray crystallography (2ZLU from Protein Data
Bank). The α-chains are colored in green and the β-chains are colored in blue; heme groups are shown in stick
representation. The Cβ atoms of native cysteines from position β-93 are indicated as yellow spheres, with dashed
lines showing distance between the Cβ atoms of both residues. Right: Detailed view into the spin label binding
site. The native amino acid at position β-93(cysteine) is colored in yellow and the tyrosine situated in a pocket
close to the C-terminus of the β-chain is colored in red

4
In the case of MnmE, four positions were mutated to cysteine and then spin labeled with (1-oxyl-
2,2,5,5-tetramethyl-3-pyrroline-3-methyl) methanethiosulfonate spin label (MTSSL): Ser278 and
Glu287 (both in the G-domain) and Ile105 and Lys95 (situated in the N terminal domain of the protein)
(Figure 2). These locations where chosen to provide information on the position of the two monomers
relative to each other in both open (apo) and closed (GDP·AlFx) state when the protein is adsorbed on
the bioactive glass.
A b
Figure 2. MnmE Mutants. Positions of native residues that were mutated to cysteines and spin labeled are
indicated by yellow spheres. (a) Open conformation of the MnmE protein generated with pdb 1XZP; (b) Closed
conformation of the G domains [pdb 2GJ8] superimposed on the TmMnmE crystal structure. Domains are labeled
as follows: N-terminal domains (NA, NB), α-helical domains (HA, HB) and G-domains (GA,GB).
Also, the properties of an implant material are influenced by the secondary structure of the protein in
its adsorbed state. Hence, we have addressed the study of both proteins and their changes in secondary
structure upon adsorption by means of FTIR spectroscopy. Besides the information about the protein
conformation after adsorption, the amount of the protein adsorbed on the surface is of great importance
for the properties of an implant material. In this regard, concentration of protein attached on bioactive
glass was determined by means of EPR and FTIR spectroscopies. X-Ray Photoelectron spectroscopy
(XPS) was used to follow the chemical modification of the outermost few nanometers layer of the
bioactive glass (BG) surface, in order to analyze the surface coverage. Moreover, the surface
morphology of bioactive glass was analyzed before and after protein adsorption by Scanning Electron
Microscopy (SEM).

5
2. Materials and Methods
2.1. Sample preparation
2.1.1. Bioactive glass preparation
The bioactive glass (BG) system used as substrate for protein attachment was prepared by the sol-gel
method [HENCH and WEST 1990] and is identical in composition with the classical 45S5 Bioglass®:
45% SiO2, 24.5% Na2O, 24.5% CaO and 6% P2O5 (in molar %). After preparation, the bioactive glass
was milled and the particle size of the obtained powder ranged from hundreds of nm to few μm. The
water contact angle recorded on the BG surface before milling was 41°, indicating a hydrophobic
character of the BG surface after preparation [VERNE et al. 2009, TUNC et al. 2005]. In order to facilitate
protein adsorption, the surface of bioactive glass was silanized with 3-aminopropyl-triethoxysilane
(APTS) and subsequently modified with glutaraldehyde (GA) [CHEN et al. 2007, CHEN et al. 2006,
WILLIAMS and BLANCH 1994].
2.1.2. Spin labeling
Horse methemoglobin. The native cysteine at position β-93 in horse methemoglobin was labeled with
(4-(2-Iodoacetamido)-2,2,6,6-tetramethyl-1-piperidinyloxy) spin label using the following protocol:
oxyhemoglobin was extracted from fresh horse blood samples according to Benesch et al. (1972) and
then converted to methemoglobin by the addition of a 2-fold amount of K3Fe(CN)6 [STEINHOFF et al.
1989]. Spin labeling of the methemoglobin with (4-(2-Iodoacetamido)-2,2,6,6-tetramethyl-1-
piperidinyloxy) followed the procedure of McCalley et al. (1972). Labeling efficiencies were
determined to be 80%.
MnmE from E. coli. Purified, nucleotide-free Cys-mutants of E. coli MnmE: Glu287, Ser278, Ile105
and Lys95, were pretreated with dithioerythritol (DTE, 4°C, 2 hours) to reduce any disulfides to thiols.
After removal of DTE via filtration, the protein solutions were incubated with 1 – 5 mM (1-oxyl-2,2,5,5-
tetramethylpyrroline-3-methyl)methanethio-sulfonate spin label (MTSSL, Toronto Research; Alexis
Biochemicals) for 16 hours at 4°C. Unbound MTSSL was removed by gel filtration.
2.1.3 Protein adsorption
Horse methemoglobin. Powder samples were incubated for 4 hours at room temperature (298 K) in a
solution of 150 mg/ml (≈2 mM) horse methemoglobin in phosphate buffer (0.01M, pH 7.4).
MnmE from E.coli. Powder samples were incubated for 4 hours at room temperature (298 K) in a
solution with a protein concentration of 10-25 mg/ml (200-500μM). Buffer conditions were 100 mM

6
KCl, 50 mM Tris-DCl (pH 7.5), 5mM MgCl2 in D2O. In order to obtain the transition state analog GDP-
AlFx, 200-400 μM of nucleotide-free MnmE already adsorbed on the BG substrate were incubated in 1
mM GDP, 1 mM AlCl3 and 4 mM NaF.
All samples were stored for 30 days at 4°C in eppendorf tubes and then ultrasonicated for 45 minutes
at room temperature. After ultrasonication, the samples were washed three times with buffer solution to
remove the protein that was probably detached from the surface during the process. Finally, the samples
were transferred to EPR capillaries and measured at room temperature to verify the stability of protein
attachment.
2.2. Sample analysis
2.2.1. Cw-EPR measurements
X band cw-EPR experiments were performed using a homemade EPR spectrometer equipped with a
Bruker dielectric resonator. The microwave power was set to 1.0 mW; the B-field modulation amplitude
was 0.15 mT. Sample volumes greater than 15 μl (the bioactive glass volume) were filled into EPR glass
capillaries with 0.9 mm inner diameter (the EPR-active volume of the sample tube was 10 μl).
Concentration of protein adsorbed on the bioactive glass was estimated by calculating the area of
EPR absorption spectrum, which is directly proportional to the spin concentration in the sample. The
protein concentration was calculated by comparison of this area with the one of a reference spin probe of
known concentration (2,2,6,6,-tetramethyl-1-piperidinyloxy (TEMPO)).
2.2.2. Four pulse DEER measurements
Pulse EPR measurements were carried out at X-band frequencies (9.3-9.4 GHz) with a Bruker
Elexsys 580 spectrometer equipped with a Bruker Flexline split-ring resonator ER 4118XMS3 and a
continuous flow helium cryostat (ESR900, Oxford Instruments) controlled by an Oxford Intelligent
temperature controller ITC 503S. Prior to freezing the protein in 3mm inner diameter EPR tubes, the
samples were supplemented with 10% (by volume) glycerol for horse methemoglobin and 12.5% (by
volume) glycerol for MnmE. The measurements were performed using the four-pulse DEER sequence
[PANNIER et al. 2000]:
The total measurement time for each sample was 4÷48 h. Background correction and determination
of interspin distance distributions were carried out using the program DEERAnalysis (2010) and a

7
model of randomly oriented spins with respect to the dipolar axis and Tikhonov regularization [JESCHKE
et al. 2006].
2.2.3. FTIR measurements
FTIR spectroscopic analyses were performed in reflection configuration with a JASCO 6200 FTIR
spectrometer in the 4000 to 400 cm-1
spectral domain with a resolution of 4 cm-1
. Gaussian peak analysis
of the amide I band was performed to analyze the secondary structure of the proteins before and after
adsorption on bioactive glass. Peak locations were determined by second derivative analysis [DONG et
al. 1990, BYLER and SUSI 1986] and correlated with values found in previous studies [KONG and YU
2007, NATALELLO et al. 2005, ARRONDO and GONI 1999, SESHADRI et al. 1999, SUSI and BYLER
1983]. The amount of adsorbed protein was estimated by the peak area ratio of amide I to amide II,
according to the findings of Buchanan and El-Ghannam (2010).
2.2.4. XPS measurements
The XPS measurements carried out to analyze the surface functionalization of bioactive glass
microparticles with protein were performed using an SPECS PHOIBOS 150 MCD system equipped
with monochromatic AlKα source (250 W, hυ = 1486.6 eV), a hemispherical analyzer and a
multichannel detector. The curve-fitting analysis of N 1s was performed by using Gaussian curve fitting
function in the CasaXPS software.
2.2.5. SEM measurements
SEM images were recorded using FEI Quanta 3D FEG 200/600 Scanning Electron Microscope. The
sample powders were covered with platinum (Pt) in order to amplify the secondary electrons signal. This
coating was performed in an Agar Automatic Sputter Coater at standard atmospheric pressure (1013
mBar).
3. Results and Discussion
3.1. Horse methemoglobin
3.1.1. Immobilization of methemoglobin on the BG substrate
For the spin-labeled side chains that are exposed to solution the nitroxide mobility refers to rotational
correlation times of the nitroxide in the ns time range. This in turn results in EPR spectra characterized
by narrow line widths of the center lines and small apparent hyperfine splitting. If the mobility of the
spin label side chain is restricted by interactions with neighboring side chains or surfaces, the line widths

8
and the apparent hyperfine splitting are increased [KLARE and STEINHOFF 2009]. At first glance, the X
band cw-EPR spectrum of methemoglobin in solution (Figure 3a) is the sum of two components. Such
multicomponent spectra are referred to as “complex” and can be associated with two possible situations:
(1) a conformational exchange between two states of the protein [BRIDGES et al. 2010], so that in an
equilibrium mixture, with slow exchange between states, the spectrum is a sum of two components in
proportion to their populations; (2) a rotameric equilibrium, which explains the line shape as the result
of the side chain existing in multiple rotameric states. However, the presence of an isosbestic point for
methemoglobin in solution, at approximately 3432 G field value (determined from X-band cw-EPR
measurements in the temperature range from 5 to 25 degrees Celsius (Figure 3b) suggests that in this
case the origin of the complex spectrum is the equilibrium of the JAA side-chain between two states
with different mobility. This assessment is in agreement with the Moffat’s interpretation [MOFFAT
1971], who attributed the components related to the mobile (α) and immobile (β) fractions of the spin
label side chain to different orientations of the spin labels with respect to the protein. One of these
orientations is free in solution on the surface of the molecule and the other is strongly immobilized,
corresponding to the spin labels which occupy the tyrosine pocket, Tyr HC2(145)β in the C-terminus of
the β-chain (Figure 1) [MOFFAT 1971].
A b
Figure 3 (a) Room temperature X-band cw-EPR spectra of horse methemoglobin spin-labeled in position β-93*
recorded in solution (black) and in adsorbed state immediately after immersion on bioactive glass without GA
(red) and with GA (blue). Inset: The mobile and immobile components visible in the lower field spectral lines are
depicted with α and β, respectively. (b) X-band cw-EPR spectra recorded for methemoglobin in solution, in the
temperature range from 5 to 25 degrees Celsius. Inset: the mobile and immobile components visible in the lower
field spectral lines are denoted as α and β respectively.

9
Upon protein adsorption on bioactive glass, the equilibrium between the two conformations is
significantly shifted towards the component (Figure 3a). This indicates that the spin labels interact
with the BG surface or with adjacent domains of protein. A notable feature is the increase of the line
width observed for the immobile component after adsorption (see the inset of Figure 3a), that cannot be
associated only with the spin labels that are trapped into the tyrosine pocket. This line broadening can be
explained by assuming that the movement of the entire protein molecule is restricted due to interaction
with bioactive glass.
To further address the influence of GA on nitroxide mobility when the protein is attached to the BG
substrate, the spin label mobility was analyzed in terms of fractions of populations, reorientational
correlation times and the semiempirical mobility parameter (the inverse of the central resonance
line width). When the protein is attached on the BG without GA treatment all the above parameters
indicate higher degree of motional freedom for the spin labels oriented to the protein surface. This
suggests that the structure in the vicinity of position β-93 is changed upon adsorption in a way which
would allow for a fraction of spin labels to avoid the tyrosine pocket and to rotate less restricted than in
solution. Giving the fact that position β-93 is located in an α-helical domain, one possible explanation
would be that part of this helix unfolds upon adsorption and, consequently, motion of the spin label
which point to the protein surface is less restricted compared to the same spin label attached to MetHb in
solution. On the other hand, when the BG substrate is functionalized with GA, restrictions in spin label
mobility are more pronounced, suggesting that the protein molecule becomes more rigid as a
consequence of the polymerization induced by the protein coupling agent [MACDONALD and PEPPER
1994, GUILLOCHON et al. 1986, WEETALL 1974].
3.1.2. Conformational changes in methemoglobin structure, induced upon interaction with BG
substrate – inter spin distances
SDSL-EPR in combination with DEER spectroscopy was applied to determine intramolecular
distances between the two β-93 positions in methemoglobin before and after adsorption on bioactive
glass. The Cβ-Cβ distance between the two β-93 positions in methemoglobin determined from X-ray
structure is 26.23 Å for the protein in its native state (Figure 1). A recent study reported a distance of
about 25.3 Å between the two positions β-93 of human hemoglobin labeled with MTS [BANHAM et al.
2007]. Our DEER measurements revealed a distance of 24.8 Å between the β-93 sites of methemoglobin
10
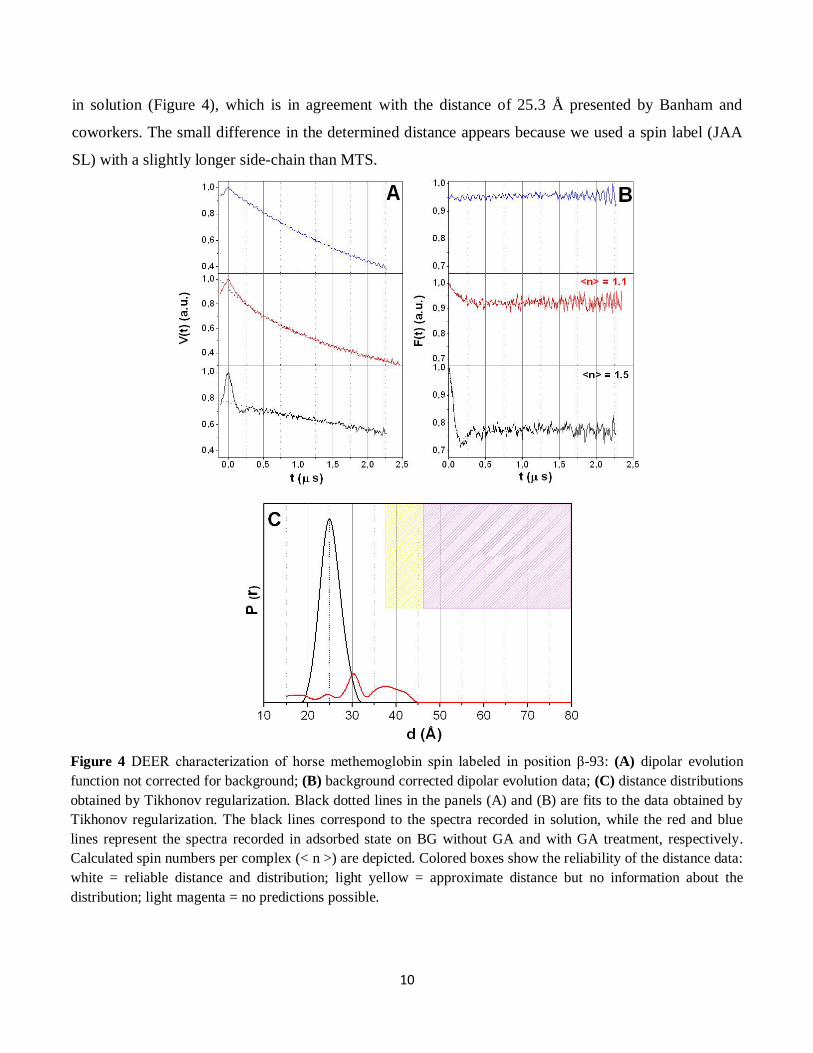
in solution (Figure 4), which is in agreement with the distance of 25.3 Å presented by Banham and
coworkers. The small difference in the determined distance appears because we used a spin label (JAA
SL) with a slightly longer side-chain than MTS.
Figure 4 DEER characterization of horse methemoglobin spin labeled in position β-93: (A) dipolar evolution
function not corrected for background; (B) background corrected dipolar evolution data; (C) distance distributions
obtained by Tikhonov regularization. Black dotted lines in the panels (A) and (B) are fits to the data obtained by
Tikhonov regularization. The black lines correspond to the spectra recorded in solution, while the red and blue
lines represent the spectra recorded in adsorbed state on BG without GA and with GA treatment, respectively.
Calculated spin numbers per complex (< n >) are depicted. Colored boxes show the reliability of the distance data:
white = reliable distance and distribution; light yellow = approximate distance but no information about the
distribution; light magenta = no predictions possible.

11
A qualitative evaluation of the DEER traces recorded after adsorption can be directly derived by eye
from the form factor F(t) extracted from dipolar evolution function V(t) [POLYHACH and JESCHKE
2007]. A first observation is that all DEER spectra recorded in adsorbed state have a very low
modulation depth (<0.1 in case of BG without GA and 0 for BG treated with GA), pointing out that a
very small number of spins have dipolar-dipolar interaction (Figure 4). We assume that the low number
of pairs of interacting spins is caused by protein dissociation. In fact, it was shown that hemoglobin
dissociates at extreme pH values (below 4 and above 10), upon addition of detergents or at low
concentrations [PIN and ROYER 1994, VALDES and ACKERS 1977]. Moreover, taking into account that
the subunits of hemoglobin are to a large extent held together by hydrophobic interactions [ANTONINI
and BRUNORI 1971], it is likely that the interaction between the hydrophobic surface of bioactive glass
and the protein molecules results in dissociation and denaturation.
DEER experiments conducted with methemoglobin attached on BG without GA treatment have
shown that a small fraction of protein keeps its tetrameric structure upon adsorption, in this case
allowing us to obtain a distance distribution (Figure 4). However, intensity of the distance distribution
curve is much lower than for the protein in solution as a consequence of the reduced number of spins
pairs with distances between 2÷8 nm.
Distance distributions obtained after the analysis using Tikhonov regularization showed that when the
protein is attached on the BG the distance between the two β-93 positions is bigger than for the protein
in solution (Figure 4). This leads to the assumption that the two β chains are slightly apart for the protein
in adsorbed state compared to the protein in solution. Projected on the protein, this means that in
adsorbed state the tetrameric structure adopts a conformation that is slightly unfolded as a consequence
of interaction between protein and BG surface.
Samples containing methemoglobin adsorbed on bioactive glass treated with GA represent a special
case due to the total absence of modulation depth in the 4-pulse DEER data. We assume that the main
factor contributing to this situation is polymerization of methemoglobin (and consequently a
homogeneous spatial distribution of spin labels in the sample), due to the presence of GA.
3.1.3. Conformational changes in methemoglobin structure, induced upon interaction with BG
substrate – secondary structure
Both amide I (centered at 1650 cm-1
) and amide II (centered at 1550 cm-1
) bands can be seen in the
absorption profiles of methemoglobin after adsorption. To obtain information about conformational

12
changes which may appear in protein secondary structure upon adsorption we focused on the signal
characteristic to amide I functional group.
Hemoglobin is an α-helical protein (86 % helix, according to X-ray crystallography) and contains no
β-sheets [CAI and SINGH 2004]. The small peaks at ca. 1627 and 1695 cm-1
can therefore be assigned to
the short loops connecting the helical cylinders [SUSI and BYLER 1983] and the pronounced peak
between 1654–1656 cm-1
can be associated with α-helices (Figure 5). Contributions of β-turns are
visible in the peak at about 1679–1682 cm-1
while the small peak at 1648 cm-1
is assigned to a random
structure. The percentage of α-helix (74%) determined from the amide I region for lyophilized
methemoglobin (Table 1) is in agreement with the values presented in previous FTIR studies [CAI and
SINGH 2004, LUO et al. 1994].
Figure 5 Separation of the amide I band into its components for horse methemoglobin before and after adsorption
on BG without and with GA. The closed circles represent the sum of the separated band components. The errors
are ±1 cm-1
for the band positions and ±5% for the peak areas.
Curve fitting analysis of amide I (Figure 5) reveals that on the BG surface, methemoglobin loses a
large percentage of its α-helical structure (approximately 18 %), shown by a decrease in the percent area
of the component band centered at 1654 cm-1
and a concurrent increase in β-turns, loops or random
structure component (Table 1). This behavior suggests that the protein is somewhat denatured upon
interaction with the BG surface, losing a large fraction of its helical secondary structure. This change in
conformation may arise from a stronger interaction with the bioactive glass surface, a feature that has
been previously reported for other proteins on this type of substrate [CHEN et al. 2007, CHEN et al.
2006, GRUIAN et al. 2011a, GRUIAN et al. 2011b, BUCHANAN and EL-GHANNAM 2010]. The unfolding
of approximately 18% of α-helixes upon adsorption correlated with the results obtained by cw-EPR

13
spectroscopy supports the assumption that the α helix, where position β-93 is located, unfolds upon
adsorption.
Table 1 Distribution of secondary structure elements in methemoglobin. The uncertainty due to experimental
error and fitting procedure are within the limit of ± 4 %
As a protein coupling agent, it is expected that glutaraldehyde maintains almost completely the native
protein structure [HEULE et al. 2003, WILLIAMS and BLANCH 1994, WEETALL 1985]. Indeed, the
deconvolution of amide I band (Figure 5) revealed that methemoglobin loses a smaller percentage of α-
helix structure (approximately 11 %) when the bioactive glass is treated with glutaraldehyde (Table 1),
confirming that the stability towards denaturation is higher on this substrate. However, the increase in
the amount of disordered structures (β-turn and random) towards more stable elements like α-helixes
implies a certain denaturation of methemoglobin even when the bioactive glass is functionalized with
glutaraldehyde. Therefore, we can assume that methemoglobin adsorption implies strong interactions
with the BG surface, which in turn can disrupt the hydrogen bonds involved in stabilization of α-helixes
located at the outer parts of the protein.
3.1.4. Quantitative adsorption analysis
The amount of protein attached on BG was determined by means of three different spectroscopic
techniques: EPR, FTIR and XPS spectroscopy. First, the amount of the protein attached to the bioactive
glass was estimated from the value of spin concentration in the sample, which was calculated from the
area of cw-EPR spectra recorded at room temperature. Certainly, in order to determine the real protein
0
20
40
60
80
α-helix(%) loop(%) β-turn(%) random(%)
MetHb native MetHb on BG MetHb on BG-GA
74
56.6
65
13.4
21.8
11.7 12.6 14.6 15.9
7 7.4 0 S
econ
dary
str
uct
ure
(%
)

14
concentration (not only the one which contains spin labels) the spin label efficiency had to be considered
for these calculations.
Table 2a shows the amount of protein attached to the bioactive glass immediately after immersion as
well as 30 days later and after ultrasonication. Immediately after immersion the protein shows greater
affinity for BG without GA. Nevertheless, the EPR spectra recorded 30-days after incubation at 4°C in
sample buffer as well as after 30 min of ultrasonication and subsequent washing steps indicated that a
larger amount of protein is irreversibly bound in case of the bioactive glass treated with GA.
A second approach was to evaluate the amount of protein that remained on the BG surface after
ultrasonication from the peak area ratio of amide I to amide II of FTIR spectra. This procedure allows us
only to establish a comparison between amounts of protein attached on different substrates but it is not
possible to determine the actual concentration of the adsorbed protein. Thereby, the results obtained by
FTIR spectroscopy for protein concentration on BG substrates after ultrasonication (Table 2b) are in
agreement with the results obtained by EPR spectroscopy for the same samples (Table 2a).
Table 2 (a) Molar concentration (in µM) of methemoglobin adsorbed on BG before and after ultrasonication. (b)
Amide I/ Amide II ratio of intensities from FTIR spectra recorded for methemoglobin attached on BG after
ultrasonication. For both methods, errors are estimated to ±10%, due to experimental procedure and uncertainties
in baseline subtraction.
a b
X-ray photoelectron spectroscopy (XPS) [MUIR et al. 2008, BROWNE et al. 2004] was further used to
analyze the protein coverage of the BG surface (were analyzed only the ultrasonicated samples). Protein
adsorption was evidenced by using the 400 eV peak for N1s, the source of which could only be the
protein (Figure 6).
0
100
200
300
400
after immersion after ultrasonication MetHb on BG MetHb on BG with GA
379
323 298 319
1
2
3
4
5
6
7
after ultrasonication MetHb on BG MetHb on BG with GA
5.45 6.04
Pro
tein
con
cen
trati
on
(µ
M)
Am
ide
I/ A
mid
e II
(a.u
.)

15
Figure 6 N 1s high resolution spectra of bioactive glass before (gray-a) and after immersion in horse
methemoglobin solution (black -b). (the N 1s peak recorded at 407.5 eV does not contain contributions associated
to organic matrixes; therefore, a high resolution spectra was not needed in this situation, the peak was subtracted
from survey spectrum of BG without GA)
Although the BG system contains nitrogen, the N 1s photoelectron peak observed before immersion
in protein solution is centered around 408 eV (Figure 6). This peak is typical for nitrogen in nitrates and
appears as consequence of nitrates precursors used in bioactive glass preparation. After the treatment of
BG with glutaraldehyde, the N 1s photoelectron peak from 408 eV disappears due to dissolution of
nitrates during washing steps and a new peak appears at binding energy close to 400 eV, corresponding
to N from amino group in 3-aminopropyl-triethoxysilane. Nevertheless, after immersion in protein
solutions, the deconvolution of N 1s core level spectra reveals the presence of two components centered
at 398.2 and 400 eV (Figure 7). Both components are characteristic to C-NH2 bonds, but the latter one
was found to be typical for nitrogen in organic matrix [VANEA and SIMON 2011, SERRO et al. 2006].
Therefore, the intensity of this peak was considered marker for protein attachment (Table 3). The
relative intensities of the N 1s XPS peak recorded around 400 eV for both BG substrates before and after
immersion in protein solution (Table 3) show that more protein is attached on the substrate with GA
treatment.

16
Figure 7 Deconvoluted N 1s high resolution XPS spectra of bioactive glass before and after immersion in horse
methemoglobin solution. The N 1s peak recorded for BG at 407.5 eV does not contain contributions associated
to organic matrixes; therefore, a deconvolution of this peak was not of interest for the purpose of this study.
Table 3 N1s atomic percentage on BG surface for the peak recorded around 400 eV before and after immersion
in horse methemoglobin solution (after ultrasonication)
0
2
4
6
8
10
12
14
before immersion after ultrasonication
BG without GA BG with GA
N 1
s (a
t.%
)
0
3.4
5.2
11.5

17
Taken together, all three techniques have shown that glutaraldehyde positively influences the protein
binding stability on bioactive glass. We assume that in the presence of glutaraldehyde protein
distribution on the BG surface is more organized; hence, the number of molecules having weak
attachment points is much lower compared to the substrate which does not contain GA. This assumption
is supported by the results from SEM characterization of both BG surfaces before and after immersion in
protein solution (Figure 8 and Figure 9). When the BG substrate is treated with glutaraldehyde more
regular organization of the protein layer can be observed (Figure 9). The chains that are observed on the
surface of BG treated with GA have approximately 50 nm width, which would correspond to a
macromolecule formed by 8-10 proteins. This interpretation further supports the hypothesis of protein
polymerization and is supported by other studies which have shown that glutaraldehyde leads to the
cross-linking of hemoglobin [WEETALL 1974] and resulting in formation of macromolecules consisting
of 8-10 proteins [MACDONALD and PEPPER 1994, GUILLOCHON et al. 1986].
Figure 8 SEM images of BG without GA before (A) and after immersion in methemoglobin solution (B). The
images in the right are recorded with a higher magnification. After adsorption a uniform layer of protein covers
the BG surface.

18
Figure 9 SEM images of the BG with GA, before (A) and after immersion in methemoglobin solution
(B). The images in the center and right panels are recorded with higher magnification. Higher porosity can
be observed on sample treated with GA, which is thought to be the result of microporosity induced by ion
leaching during heat-treatment in water at 80°C.
3.2. MnmE from E.coli
3.2.1. Immobilization of MnmE on the BG substrate
In order to gain detailed information about the putative immobilization of the protein upon the
adsorption onto BG, room temperature cw EPR measurements were performed for MnmE spin labeled
in positions Ser278, Glu287, Ile105 and Lys95 (further on will be denoted as S278, E287, I105 and
K95) (Figure 2).
Room temperature cw EPR spectra of MnmE in solution spin labeled in all four positions are
characterized by the presence of two distinct components, related to the mobile (α) and immobile (β)
fractions of the spin label side chain (Figure 10). The immobile component arises from a fraction of spin
labels engaged in secondary and tertiary interactions which restricts their reorientational freedom. The
mobile component can be assigned to the spin labels which have less constrains in their environment.
Also, this component is influenced by general backbone fluctuations. Free unbound spin label exhibits

19
sharp resonance lines that superimposed the recorded spectra for positions E287, I105 and K95 (marked
with a star symbol (*), Figure 10).
Figure 10 Room temperature cw-EPR spectra of the spin labeled MnmE cysteine mutants E287, S278, I105 and
K95 in solution (black lines) and in adsorbed state (red lines: on BG without GA, blue lines: on BG with GA).
Shown are the spectra for open G-domain conformation (apo state). The mobile and immobile components are
indicated by arrows α and β respectively. The peak marked by star symbol (*) corresponds to free unbound spin
label in solution.
In solution all four positions exhibit a more pronounced mobile component. In the case of E287 this
denotes a certain motional flexibility of the spin label side chain close to the top of the G-domain, while
for S278 the higher mobile component is explainable by the location of this position in the loop region
of switch II, which exhibits a very high structural flexibility. For the two positions situated in the N-

20
terminal domain of the protein, the mobile component is explainable by the deviations of both N-
terminal domains in solution.
Upon adsorption, all spectra exhibit an increase in the width of the central resonance line and larger
low field amplitude, suggesting that the spin label mobility is significantly decreased due to
immobilization of the protein on the BG substrate. The amount of signal corresponding to immobile
component was quantified by spectra simulations and expressed in terms of fraction of immobilized spin
labels. Accordingly, protein immobilization is also reflected in the values obtained for the fraction of
immobile component for each position before and after adsorption (these values are listed in Table 4).
Table 4 Fractions of immobile component determined from simulations of EPR spectra recorded for MnmE
before and after adsorption on BG without and with GA respectively.
As can be seen in Figure 10 and Table 4, the most pronounced changes in side-chain dynamics upon
adsorption on the bioactive glass appear for positions E287 and S278 situated in the G-domain of
MnmE. This strong immobilization induced by adsorption on bioactive glass might be due to a direct
interaction of this region with the BG surface, suggesting that these two positions may be close to
contact points of the protein on the surface.
Effect of glutaraldehyde. According to X-ray crystallographic structure of MnmE [SCRIMA et al. 2005],
this protein doesn’t have many lysines at the surface as compared to hemoglobin. Thus, it is unlikely
that interaction with GA would induce its polymerization. Although we expected a stronger attachment
of the MnmE on the BG substrate after addition of the protein coupling agent, cw-EPR spectra revealed
that mobility changes induced by functionalization with GA are quite small, except from position I105 at
the N-terminal domain. In the case of the two positions situated in the G-domain (E287 and S278), the
0
10
20
30
40
50
60
70
E287 (%) S278 (%) I105 (%) K95 (%)
MnmE MnmE on BG MnE on BG-GA
fβ (
%)
59
18
60 62
16
53
46
18
55 53

21
use of glutaraldehyde leads to a very small increase of the immobile component, i.e. to a stronger
attachment of this region of the protein on the BG surface. Although this behavior was expected, the
differences which appear due to functionalization with GA are very small (1÷2 % in terms of fraction of
immobilized spin labels). This might be due to the fact that the immobilization of this area on the BG
substrate was already extremely pronounced without glutaraldehyde addition. Hence, these data support
the assumption that these two positions are close to the contact points of the protein on the BG surface.
3.2.2. Conformational changes in MnmE structure, induced upon interaction with BG substrate –
inter spin distances
As in the case of methemoglobin after adsorption on the bioactive glass, the main characteristic for
all DEER traces is the low modulation depth of the signal (<0.1). Moreover, no modulation depth could
be observed in case of protein adsorbed on BG without GA treatment. So no distance distribution could
be obtained (Figures 11 and Figure 12).
The reasons which can cause this very low modulation depth were already discussed in Section 3.1.2.
Accordingly, in case of MnmE we assume that the explanation for this situation is the dissociation of the
protein and, consequently, distances higher than 8 nm between intramolecular spin labels. However,
DEER traces for the spin labeled protein attached to the BG with GA showed a distinct modulation
depth, allowing us to obtain a distance distribution. It seems that in this case, in contrast to the respective
data obtained from hemoglobin, GA does not induce the polymerization of the protein due to the poor
presence of lysines at the protein surface. This hypothesis is also supported by the SEM images (see
Section 3.2.4), which do not show the formation of long protein chains like in the case of
methemoglobin. Previous studies have shown that the protein coupling agent helps in maintaining the
native protein structure upon adsorption [HEULE et al. 2003]. This might be a possible explanation for
the fact that a small fraction of protein still keeps its dimeric form after adsorption on BG treated with
GA.
A special case which must be discussed here is mutant S278: spin labels attached to this position
seem to be too far apart from each other to be measurable within the sensitivity range of four DEER
spectroscopy (a very low modulation depth was obtained when the protein is attached on both types of
BG substrates) (Figure 11). The location of position 278 in the loop region of the G domain allows for a
high flexibility which can explain the fact that the two spin labels are separated with a distance higher
than 8 nm during adsorption of the protein on the BG. In solution, position S278 displays a major
contribution (about 80 % from the distance distribution – average value calculated from the area under

22
the distance distribution curve) given by the spin labels which display a distance of 49 Å between them.
After adsorption, the dissociation of the protein could lead to an increase of the interspin distance greater
than 30 Å. This in turn might be too far apart to be detected by our experimental DEER setup.
Figure 11 DEER comparison of MnmE mutants E287 and S278 in apo (black lines) and GDP·AlFx (pink lines)
state: left panel – dipolar evolution function not corrected for background; central panel – background corrected
dipolar evolution data; right panel – distance distributions obtained by Tikhonov regularization. Dotted lines in
the center panel are fits to the data obtained by Tikhonov regularization. Spectra recorded before and after
adsorption on the BG without and with glutaraldehyde are shown in panels A, B and C respectively. Colored
boxes show the reliability of the distance data: white = reliable distance and distribution; light yellow =
approximate distance but no information about the distribution; light magenta = no predictions possible.
23
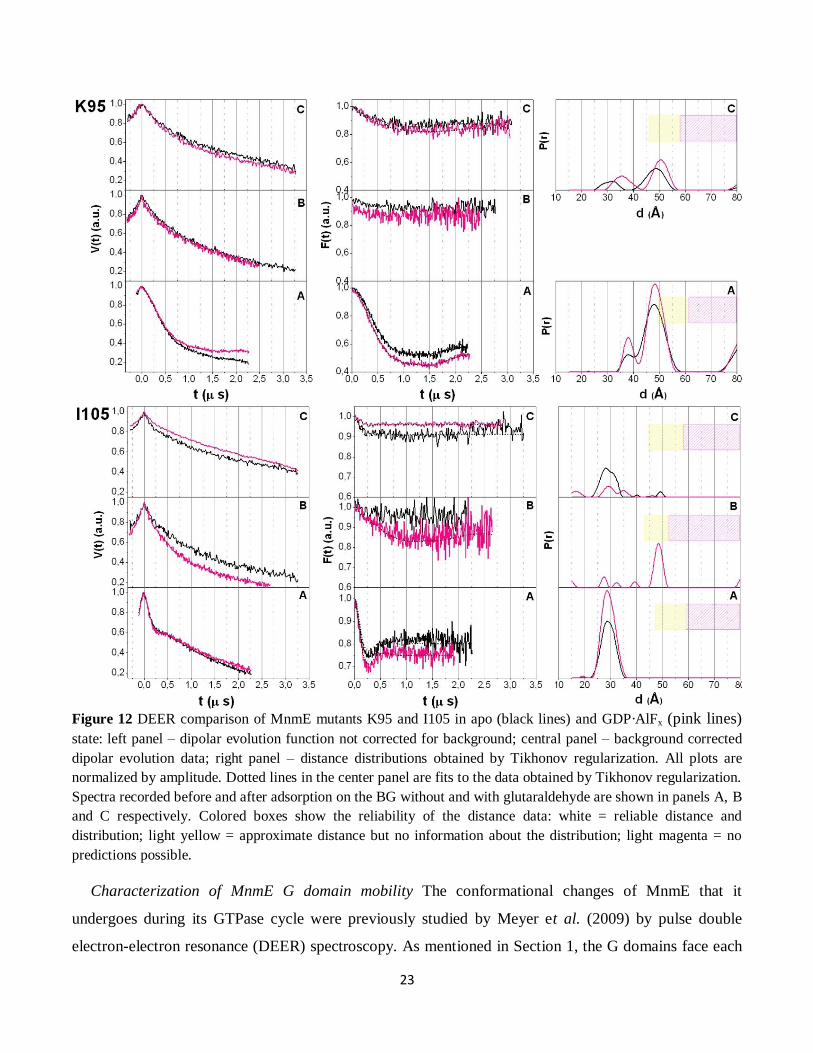
Figure 12 DEER comparison of MnmE mutants K95 and I105 in apo (black lines) and GDP·AlFx (pink lines)
state: left panel – dipolar evolution function not corrected for background; central panel – background corrected
dipolar evolution data; right panel – distance distributions obtained by Tikhonov regularization. All plots are
normalized by amplitude. Dotted lines in the center panel are fits to the data obtained by Tikhonov regularization.
Spectra recorded before and after adsorption on the BG without and with glutaraldehyde are shown in panels A, B
and C respectively. Colored boxes show the reliability of the distance data: white = reliable distance and
distribution; light yellow = approximate distance but no information about the distribution; light magenta = no
predictions possible.
Characterization of MnmE G domain mobility The conformational changes of MnmE that it
undergoes during its GTPase cycle were previously studied by Meyer et al. (2009) by pulse double
electron-electron resonance (DEER) spectroscopy. As mentioned in Section 1, the G domains face each

24
other in the nucleotide free state, but upon addition of GDP·AlFx they overcome a 20-30 Ǻ distance gap
[MEYER et al. 2009, BOEHME 2010, SCRIMA and WITTINGHOFER 2006] (see Figure 2).
However, after adsorption the major maxima recorded for positions E287 and S278 in transition state
(GDP·AlFx) are similar to those obtained for apo state (Figure 11), suggesting that the G domains of the
protein remain in the open conformation. This result supports the hypothesis highlighted by the cw
measurements, namely that after adsorption the protein “freezes” in open state, due to its immobilization
on the solid surface.
Figure 13 Schematic illustration of activation of MnmE during GTP hydrolysis in solution and after
adsorption on the bioactive glass. A. In solution, the G domains adopt an open conformation (in apo state)
and a closed conformation (in transition state); B. Upon adsorption, the G-domains are the contact region
with the BG substrate and, consequently, remain open in transition state. Figure adapted from [SCRIMA and
WITTINGHOFER 2006].
Furthermore, the major contributions obtained for positions I105 and K95 when the protein is
adsorbed on BG with GA are similar with those obtained for the protein in solution: 48 Å (for K95) and
29 Å (for I105) (Figure 12). Yet, position I105 was the only sample with protein adsorbed on the BG

25
without GA, which displayed a modulation depth high enough to obtain a distance distribution with a
maximum of 48 Å (20 Å longer than in solution or in case of BG with GA). This increase of distance
between these two positions (which implies a separation of the two N-terminal domains) explains the
increase of spin label mobility when the protein is adsorbed on BG without GA and supports the idea that
the protein dissociates upon adsorption on BG in the two constitutive monomers (see Figure 13).
3.2.3. Conformational changes in methemoglobin structure, induced upon interaction with BG
substrate – secondary structure
The deconvolution of amide I into its components shows that there are several conformational
changes for the protein adsorbed on both types of surfaces (Figure 14). It is worth to mention here that
the solvent used for this protein was D2O (see Section 2.1). So, the assignment of peak locations to
secondary structure elements was done accordingly). For instance, the major band at 1657.5 cm-1
,
assigned to the α-helix structures of the protein is slightly shifted after adsorption (1659 cm-1
) (Table5).
The higher band position at 1659 cm-1
corresponds to weaker hydrogen bonding, leading to more
flexible helices [TATULIAN 2001]; we assume that this difference in the helix flexibility appears as
consequence of interaction between the protein and bioactive glass.
Table 5 Assignments of amide I frequencies to secondary structure elements for MnmE before and after adsorption on bioactive glass
Mean frequencies (cm-1
)
α-helix β-sheet β-turn random aggregates
MnmE 1657.5 1624,
1639,1695
1680 - -
MnmE on bioactive glass 1659 1638 1678 1648 1620
Furthermore, the peaks at 1624 and 1695 cm-1
corresponding to β-sheets in the native structure of
MnmE are significantly shifted after adsorption to 1620 and 1692.5 cm-1
, respectively, thus changing
their assignment (Table 5). The 1620.0 cm−1
component can instead be attributed to side chains and
aggregates [ARRONDO and GONI 1999, SESHADRI et al. 1999], while the peak at about 1692 cm-1
can be
associated with β-turns [KONG and YU 2007, NATALELLO et al. 2005, SUSI and BYLER 1983].

26
Figure 14 Separation of the amide I band into its components for MnmE before and after adsorption on BG
without and with GA. The closed circles represent the sum of the separated band components. The errors are ±1
cm-1
for the band positions and ±5% for the peak areas.
Thereby, the general trend is that after adsorption the amount of α-helices and β-sheets decreases and
less ordered structures (turns, random coils and aggregates) increase. These changes are less pronounced
on the BG treated with GA (Table 6). It seem that the treatment with GA helps maintaining significantly
larger amounts of α-helices in the MnmE structure after adsorption although the loss in β-sheets
percentage is the same as on the BG without GA. Moreover, the percentage of aggregates is much lower
in case of BG treated with GA, indicating a lower degree of protein denaturation on this substrate (Table
6).
Table 6 Distribution of secondary structure elements in MnmE before and after adsorbtion on BG. The
uncertainty due to experimental error and fitting procedure are within the limit of ± 5 %
0
10
20
30
40
50
α-helix (%) β-sheet (%) β-turn (%) random (%) aggregates (%)
MnmE native MnmE on BG MnE on BG-GA
42
Seco
nd
ary
stru
ctu
re (
%)
33
38.6 36.6
29 29
21.4 19
23.9
0
4.5 3.8
14.8
4.7
0

27
3.2.4. Quantitative adsorption analysis
The amount of the protein attached on the bioactive glass was estimated from cw-EPR spectra
recorded at room temperature. The values of protein concentration on both BG substrates are similar
immediately after immersion, but the ultrasonication process removes more protein from the BG without
GA, indicating stronger protein attachment on the surface treated with GA (Table 7a). These results are
further supported by the values obtained from amide I/amide II ratio of FTIR spectra (Table 7b).
Table 7 (a) Molar concentration (in µM) of MnmE adsorbed on BG before and after ultrasonication. Errors are
estimated to ±10%, due to experimental settings and uncertainties in baseline subtraction. (b) Amide I/ Amide II
ratio of intensities from FTIR spectra recorded for MnmE attached on BG after ultrasonication. Errors are
estimated to ±15%, due to experimental procedure and uncertainties in baseline subtraction.
a b
The bioactive glass surface was further on analyzed by means of X-ray photoelectron spectroscopy
(XPS) before and after immersion in protein solution. The relative intensity of N 1s peak recorded at
approximately 400 eV (Figure 15) was used to monitor the amount of protein attached on the BG
surface (Table 8). As in the case of methemoglobin, the deconvolution of N 1s core level spectra
recorded after adsorption has shown the presence of two components centered at 398.2 and 400 eV, the
latest being typical for nitrogen in organic matrices [VANEA and SIMON 2011, SERRO et al. 2006]. Like
we expected, the BG treated with GA shows better protein coverage of the BG surface (Table 8), result
which is consistent with results obtained by EPR and FTIR spectroscopy.
0
100
200
300
400
500
600
after immersion after ultrasonication
MnmE on BG MnmE on BG with GA
pro
tein
co
nce
ntr
atio
n (
µM
)
508 491
353 408
0
5
10
15
20
after ultrasonication
MnmE on BG
Am
ide
I /
Am
ide
II (
a.u
.)
10.9
16.75

28
Figure 15 N 1s high resolution spectra of BG before (gray) and after immersion in MnmE solution (black). The
relative intensity of N 1s peak from ca. 400 eV was used to quantify protein attachment on the BG surface. (the N
1s peak recorded at 407.5 eV does not contain contributions associated to organic matrixes; therefore, a high
resolution spectra was not needed in this situation, the peak was subtracted from survey spectrum of BG without
GA)
Table 8 N1s atomic percentage on BG surface for the peak recorded at around 400 eV before and after immersion
in MnmE solution (after ultrasonication)
SEM images recorded on the BG surface before and after immersion in MnmE solution show that
after adsorption a uniform layer of protein covers the surface of both BG substrates (Figure 16 and
Figure 17), but it can be easily seen that adsorption is influenced by glutaraldehyde. It seems as if the
protein coupling agent leads to a better organization of the protein layer. Unlike the images for
methemoglobin, the presence of protein chains is not visible here, confirming that polymerization of
MnmE is unlikely to occur. This assumption was already suggested by the results obtained by pulse
DEER spectroscopy (see Section 3.2.2).
0
2
4
6
8
before immersion after ultrasonication
BG without GA BG with GA
N 1
s (a
t.%
)
0
3.4
2.1
7.1

29
Figure 16 SEM images of BG without GA before (A) and after immersion in MnmE solution (B). The images in
the right are recorded with a higher magnification. After adsorption a uniform layer of protein covers the BG
surface.
Figure 17 SEM images of the BG with GA, before (A) and after immersion in methemoglobin solution
(B). The images in the center and right panels are recorded with higher magnification.

30
4. Conclusions
According to the first aim of this work, we have shown that EPR spectroscopy combined with site-
directed spin labeling can be used to investigate adsorption of proteins on solid surfaces. For both
proteins, X-band cw-EPR measurements revealed significant differences in the spin label mobility upon
adsorption on bioactive glass, indicating that the movement of the entire protein molecule is restricted
due to interaction with bioactive glass. Interestingly, for horse methemoglobin cw-EPR spectra recorded
after adsorption revealed an increase in mobility of spin labels which are oriented towards the protein
surface, suggesting a possible unfolding of the β-93 surroundings upon adsorption. Indeed, investigation
of secondary structure of methemoglobin by FTIR spectroscopy confirmed that almost 20 % of the
protein helical structure is unfolded after adsorption, while pulse DEER measurements have shown an
increase of distance between the two positions β-93 after adsorption. According to results obtained by
these three techniques we may conclude that the α-helix where position β-93 is located unfolds after
adsorption.
In the case of MnmE, especially the two positions situated in the G-domain of the protein are affected
by the interaction with the BG substrate, suggesting that the vicinities of positions E287 and S278
represent a contact point between the protein and the bioactive glass (see Figure 13). This assumption is
further supported by the results obtained from pulse DEER spectroscopy that showed that the two G-
domains remain in open state even after the addition of GDP·AlFx, as a consequence of immobilization
of the G-domains on the BG surface.
One of the most important conclusions of this study is the assumption that both proteins dissociate
upon adsorption on the bioactive glass. This hypothesis is corroborated by the low modulation depth of
all DEER time traces recorded after adsorption. In fact, in the case of MnmE the modulation depth was
reduced almost completely so that it was impossible to obtain a distance distribution. This result leads us
to the conclusion that the functionality of MnmE is drastically affected upon adsorption. However, this
issue is not of crucial importance in evaluating the biocompatibility of a biomaterial. Previous studies
have shown that the effect of adsorbed protein on cell attachment is highly dependent on the quantity of
the protein attached [XIE et al. 2001, ZENG et al. 1999] and orientation of the protein molecule on the
surface of the biomaterial [BUCHANAN and EL-GHANNAM 2010, CHITTUR 1998]. Moreover, it was
recently demonstrated that a protein conformation rich in flexible and charged unordered structure
enhances the success of cell attachment and spreading on the surface of bioactive glass [BUCHANAN and
EL-GHANNAM 2010].

31
Another aim of this study was to investigate the effect of glutaraldehyde in protein attachment. In this
respect, the surface of bioactive glass was silanized with 3-aminopropyl-triethoxysilane and then
functionalized with glutaraldehyde. Quantitative analyses have shown that for both proteins
glutaraldehyde positively influences the binding stability on bioactive glass. It seems that the presence
of GA offers more stable and specific points for protein attachment on the BG substrate, so the binding
and distribution of the protein might be more organized as compared to untreated BG. If the BG
substrate is not functionalized with GA, the protein covers every accessible place on the surface with
some protein molecules having only weak attachment points so they can easily detach when the sample
is ultrasonicated. This hypothesis is highlighted by SEM characterization of the bioactive glass surface
before and after immersion in protein solutions.
Regarding the effect of glutaraldehyde in maintenance of protein native structure upon adsorption,
investigations performed by FTIR spectroscopy have shown that indeed for both proteins a higher
percentage of α-helical structure remains intact after adsorption. On the level of tertiary structure, pulse
DEER measurements revealed that only on the bioactive glass functionalized with GA a small amount
from the protein attached is able to preserve its dimeric structure. These results confirm that the protein
coupling agent plays a role in maintaining the native structure of both proteins upon adsorption but the
effect on tertiary structure is much weaker than on secondary structure elements. Methemoglobin
represents a special case, because it was already shown that hemoglobin polymerizes in the presence of
glutaraldehyde [MacDONALD and PEPPER 1994, GUILLOCHON et al. 1986, WEETALL 1974].
Accordingly, zero modulation depth of the DEER signal confirmed that treatment of BG surface with
glutaraldehyde induces polymerization of methemoglobin upon adsorption. Moreover, images obtained
by means of scanning electron microscopy revealed that glutaraldehyde leads to the cross-linking of
methemoglobin [WEETALL 1974], resulting in formation of macromolecules consisting of 8-10 proteins.
All the results presented above prove that EPR in combination with site-directed spin labeling is a
powerful tool for studying protein structure and dynamics after adsorption on solid substrates. The main
advantage of this method is that proteins can be investigated in their native environment, allowing thus
to obtain information about protein dynamics and functionality not only in solution but also in adsorbed
state. Moreover, investigations with three different techniques certified that EPR spectroscopy can be
used to quantify the protein attached on a solid substrate. This kind of information is of crucial
importance in the field of biomaterials and helps in understanding protein behavior upon interaction with
solid environments.

32
SELECTIVE BIBLIOGRAPHY
1. [ANTONINI and BRUNORI 1971] Antonini E and Brunori M in Myoglobin and Hemoglobin in their Reactions
with Ligands, eds. Neuberger, A. & Tatum, EL (North–Holland, Amsterdam), Vol. 21. (1971).
2. [ARRONDO and GONI 1999] Arrondo JLR and Goni FM, Prog. Biophys. Mol. Biol. 72 (1999) 367–405.
3. [BANHAM et al. 2007] Banham JE, Jeschke G, Timmel CR, Molecular Physics 105 (2007) 2041-47.
4. [BOEHME 2010] Boehme S, Structural and functional analysis of the MnmE/ Gid A protein complex studied by
EPR spectroscopy, 2010. Department of Biology, University of Osnabrueck, Germany. Ref Type:
Thesis/Dissertation.
5. [BOEHME et al. 2010a] Böhme Sabine, Simon Meyer, André Krüger, Heinz-Jürgen Steinhoff, Alfred
Wittinghofer, Johann P. Klare, J. Biol. Chem., 285 (2010) 16991-17000.
6. [BOEHME et al. 2010b] Sabine Böhme, Heinz-Jürgen Steinhoff and Johann P. Klare, Spectroscopy, 2010, 24 (3-
4), 283-288
7. [BORDIGNON and STEINHOFF 2007] Bordignon E, Steinhoff HJ, Membrane protein structure and dynamics
studied by side-directed spin labeling ESR, in: Hemminga MA, Berliner LJ (Eds), ESR Spectroscopy in
Membrane Biophysics, Springer Science and Business Media, New York, 2007, pp. 129-164.
8. [BRIDGES et al. 2010] Bridges MD, Hideg K, Hubbell WL, Appl Magn Reson 37 (2010) 363–390.
9. [BROWNE et al. 2004] Browne MM, Lubarsky GV,Davidson MR, Bradley RH, Surf. Sci. 553 (2004) 155–167.
10. [BUCHANAN and EL-GHANNAM 2010] Buchanan LA, El-Ghannam A, J. Biomed. Mater. Res. A 93 (2010)
537-546.
11. [BYLER and SUSI 1986] Byler DM and Susi H, Biopolymer 25 (1986) 469−487.
12. [CAI and SINGH 2004] Cai S and Singh BR, Biochemistry 43 (2004) 2541-2549.
13. [CHEN et al. 2006] Chen QZ, Rezwan K, Armitage D, Nazhat SN, Boccaccini AR, J. Mater. Sci.: Mater. Med.
17 (2006) 979-87.
14. [CHEN et al. 2007] Chen QZ, Rezwan K, Françon V, Armitage D, Nazhat SN, Jones FH, Boccaccini AR, Acta
Biomaterialia 3 (2007) 551-62.
15. [CHITTUR 1998] Chittur K, Biomaterials 19 (1998) 357–369.
16. [DONG et al. 1994] Dong A, Caughey WS, Du Clos TW, J. Biol. Chem. 269 (9) (1994) 6424–6430.
17. [DOUSSEAU and PEZOLET 1990] Dousseau F, Pezolet M, Biochemistry 29 (1990) 8771-8779.
18. [EL-GHANNAM et al.1999] El-Ghannam A, Ducheyne P, Shapiro IM, J. Orthop. Res. 17 (1999) 340-345.
19. [FANUCCI et al. 2003] Fanucci GE, Coggshall KA, Cadieux N, Kim M, Kadner RJ, Cafiso DS, Biochemistry
2003, 42, 1391.
20. [GASPER et al. 2009] Gasper R, Meyer S, Gotthardt K, Sirajuddin M, and Wittinghofer A, Nat. Rev. Mol. Cell
Biol. 10 (2009) 423–429
21. [GRAY 2004] Gray JJ, Current Opinion in Structural Biology 14 (2004) 110–115.

33
22. [GRUIAN et al. 2011a] Gruian C, Steinhoff HJ, Simon S, Digest Journal of Nanomaterials and Biostructures 6
(2011) 373-83.
23. [GRUIAN et al. 2011b] Gruian C, Steinhoff HJ, Simon S, Studia Chemia 2 (2011) (accepted)
24. [GUILLOCHON et al. 1986] Guillochon D, Vijayakshmi M W, Thiam-Sow A, Thomas D, Biochem. and Cell.
Biol. 64 (1986) 29-37.
25. [HENCH and WEST 1990] Hench LL, West JK, Chem Rev 90 (1990) 33-72.
26. [HEULE et al. 2003] Heule M, Rezwan K, Cavalli L, Gauckler LJ, Advanced Materials. 15 (2003) 1191–1194.
27. [HUBBELL et al. 2000] Hubbell WL, Cafiso DS, Altenbach C, Nat. Struct. Biol. 2000, 7, 735.
28. [JACOBSEN et al. 2005] Jacobsen K, Oga S, Hubbell WL, Risse T, Biophys. J. 88 (2005) 4351-4365.
29. [JACOBSEN et al. 2006] Jacobsen K, Hubbell WL, Ernst OP, Risse T, Angew. Chem. Int. Ed., 45 (2006) 3874-
3877.
30. [JESCHKE et al. 2006] Jeschke G, Chechik V, Ionita P, Godt A, Zimmermann H, Banham J, Timmel CR,
Hilger D, Jung H, Appl Magn Reson, 30 (2006) 473-498
31. [KARLSSON et al. 2000] Karlsson M, Martensson LG, Jonsson BH, Carlsson U, Langmuir 2000, 16, 8470.
32. [KLARE and STEINHOFF 2009] Klare JP, Steinhoff HJ, Photosynth Res. 102 (2009) 377-90.
33. [KONG and YU 2007] Kong J and Yu S, Acta Biochimica et Biophysica Sinica 39 (2007) 549–559.
34. [LATOUR 2005] Latour RA Jr., Biomaterials: Protein-Surface Interactions, in: Taylor & Francis (Eds)
Encyclopedia of Biomaterials and Biomedical Engineering, Informa Healthcare, New York 2005,pp.1-15.
35. [LUO et al. 1994] Luo S, Huang CYF, McClelland JF, Graves DJ, Analytical Biochemistry 216 (1994) 67-76.
36. [MACDONALD and PEPPER 1994] MacDonald SL, Pepper DS, Methods Enzymol. 231 (1994) 287-308.
37. [MCCALLEY et al. 1972] McCalley RC, Shimshick EJ, McConell HM, Chem. Phys. Lett. 13 (1972) 115-119
38. [MEYER et al. 2009] Meyer S, Böhme S, Krüger A, Steinhoff HJ, Klare JP, Wittinghofer A, PLoS Biology 7
(2009) e1000212.
39. [MOFFAT 1971] Moffat JK, J. Mol. Biol. 55 (1971) 135-46.
40. [MUIR et al. 2008] Muir BW, Tarasova A, Gengenbach TR, Menzies DJ, Meagher L, Rovere F, Fairbrother A,
McLean KM, Hartley PG, Langmuir 24 (2008) 3828–3835.
41. [NATALELLO et al. 2005] Natalello A, Ami D, Brocca S, Lotti M, Doglia SM, Biochem. J 385 (2005) 511–
517.
42. [OKUDA et al. 1991] Okuda K, Urabe I, Yamada Y, Okada H, J. Ferment. Bioeng. 71 (1991) 100-5.
43. [PANNIER et al. 2000] Pannier M, Veit S, Godt A, Jeschke G, Spiess HW, Journal of Magnetic Resonance 142
(2000) 331–340.
44. [PIN and ROYER 1994] Pin S and Royer CA, Methods Enzymol. 232 (1994) 42–55.
45. [POLYHACH and JESCHKE 2007] Polyhach Ye, Jeschke G, Physical Chemistry Chemical Physics, 9 (2007)
1895–1910.

34
46. [RISSE et al. 2003] Risse T, Hubbell WL, Isas JM, Haigler HT, Phys. Rev. Lett. 91 (2003) 188101-188105.
47. [SCRIMA et al. 2005] Scrima A, Vetter IR, Armengod ME, Wittinghofer A, EMBO J, 24 (2005) 23-33.
48. [SCRIMA and WITTINGHOFER 2006] Scrima A and Wittinghofer A, EMBO J, 25 (2006) 2940-2951.
49. [SERRO et al. 2006] Serro AP, Gispert MP, Martins MCL, Brogueira P, Colaco R, Saramago B, Biomed.
Mater. Res. 78A (2006) 581–589.
50. [SERVAGENT-NOINVILLE et al. 2000] Servagent-Noinville S, Revault M, Quiquampoix H, Baron M, J.
Colloid. Interface Sci. 221 (2000) 273-283.
51. [SESHADRI et al. 1999] Seshadri S, Khurana R, Fink AL, Methods Enzymol 309 (1999) 559–576.
52. [STEINHOFF et al. 1989] Steinhoff HJ, Lieutenant K, Redhardt A, Biochimica et Biophysica Acta 996 (1989)
49-56.
53. [SUSI and BYLER 1983] Susi H and Byler DM, Biochemical and Biophysical Research Communications, 115
(1983) 391-397.
54. [TIAN et al. 1998] Tian MH, Lee WK, Bothwell MK, McGuire J, J. Colloid Interface Sci. 1998, 200, 146.
55. [TUNC et al. 2005] Tunc S, Maitz MF, Steiner G, Vazquez L, Pham MT, Salzer R, Colloids and Surfaces B:
Biointerfaces 42 (2005) 219–225.
56. [VALDES and ACKERS 1977] Valdes RJ and Ackers GK, J. Biol. Chem. 252, (1977) 74–81.
57. [VANEA and SIMON 2011] Vanea E and Simon V, Applied Surface Science 257 (2011) 2346–2352
58. [VERNE et al. 2009] Verne E, Vitale-Brovarone C, Bui E, Bianchi CL, Boccaccini AR, Journal of Biomedical
Materials Research Part A 90 (2009) 981-992.
61. [WEETALL 1974] Weetall HH, Anal. Chem. 46 (1974) 602-615a.
62. [WEETALL 1985] Weetall HH, Trends Biotechnol. 3 (1985) 276-280.
63. [WERTZ and SANTORE 2001] Wertz CF, Santore MM, Langmuir 17 (2001) 3006-3016.
64. [WILLIAMS and BLANCH 1994] Williams RA, Blanch HW, Biosens. Bioelectron. 9 (1994) 159-167.
59. [XIE et al. 2001] Xie J, Riley C, Chittur K, J Biomed Mater Res 57 (2001) 357–365.
60. [ZENG et al. 1999] Zeng H, Chittur KK, Lacefield WR, Biomaterials 20 (1999) 377–384.