crisil sme ierindependentequityresearch - … research is india's largest independent and...
TRANSCRIPT
Enhancing investment decisions
CRISIL SME IERIndependentEquityResearch
MITCON Consultancy &
Engineering Services Ltd
Initiating Coverage

CRISIL SME IERIndependentEquityResearch
Explanation of CRISIL SME Fundamental and Valuation (CFV) matrix
The CRISIL SME CFV Matrix (CRISIL Fundamental and Valuation Matrix) addresses the two important analysis of an investment making process –
Analysis of Fundamentals (addressed through SME Fundamental Grade) and Analysis of Returns (SME Valuation Grade) The SME fundamental grade
is assigned on a five-point scale from grade 5 (indicating Excellent fundamentals) to grade 1 (Poor fundamentals). The SME valuation grade is assigned
on a five-point scale from grade 5 (indicating strong upside from the current market price (CMP)) to grade 1 (strong downside from the CMP). This
opinion is a relative assessment in relation to other SMEs in India. The assessment is based on a grading exercise carried out by industry specialists
from CRISIL Research.
CRISIL SME
Fundamental Grade Assessment
CRISIL SME
Valuation Grade Assessment
5/5 Excellent fundamentals 5/5 Strong upside (>25% from CMP)
4/5 Superior fundamentals 4/5 Upside (10-25% from CMP)
3/5 Good fundamentals 3/5 Align (+-10% from CMP)
2/5 Moderate fundamentals 2/5 Downside (negative 10-25% from CMP)
1/5 Poor fundamentals 1/5 Strong downside (<-25% from CMP)
About CRISIL Limited
CRISIL is a global analytical company providing ratings, research, and risk and policy advisory services. We are India's leading ratings agency. We are
also the foremost provider of high-end research to the world's largest banks and leading corporations.
About CRISIL Research
CRISIL Research is India's largest independent and integrated research house. We provide insights, opinions, and analysis on the Indian economy,
industries, capital markets and companies. We are India's most credible provider of economy and industry research. Our industry research covers 70
sectors and is known for its rich insights and perspectives. Our analysis is supported by inputs from our network of more than 4,500 primary sources,
including industry experts, industry associations, and trade channels. We play a key role in India's fixed income markets. We are India's largest provider
of valuations of fixed income securities, serving the mutual fund, insurance, and banking industries. We are the sole provider of debt and hybrid indices
to India's mutual fund and life insurance industries. We pioneered independent equity research in India, and are today India's largest independent equity
research house. Our defining trait is the ability to convert information and data into expert judgments and forecasts with complete objectivity. We
leverage our deep understanding of the macro economy and our extensive sector coverage to provide unique insights on micro-macro and cross-
sectoral linkages. We deliver our research through an innovative web-based research platform. Our talent pool comprises economists, sector experts,
company analysts, and information management specialists.
CRISIL Privacy
CRISIL respects your privacy. We use your contact information, such as your name, address, and email id, to fulfil your request and service
your account and to provide you with additional information from CRISIL and other parts of McGraw Hill Financial you may find of interest.
For further information, or to let us know your preferences with respect to receiving marketing materials, please visit www.crisil.com/privacy.
You can view McGraw Hill Financial’s Customer Privacy Policy at http://www.mhfi.com/privacy.
Last updated: May, 2013
Analyst Disclosure
Each member of the team involved in the preparation of the grading report, hereby affirms that there exists no conflict of interest that can bias the
grading recommendation of the company.
Disclaimer:
This SME Independent Equity Research Report (SME IER Report) has been sponsored by the National Stock Exchange of India Ltd. This SME IER
Report is based on data publicly available or from sources considered reliable (together Data). CRISIL Ltd. (CRISIL) does not guarantee the accuracy,
adequacy or completeness of the SME IER Report / Data and is not responsible for any errors or omissions or for the results obtained from the use of
SME IER Report / Data. The Data / SME IER Report is subject to change without any prior notice. Opinions expressed herein are our current opinions
as on the date of this SME IER Report. Nothing in this SME IER Report constitutes investment, legal, accounting or tax advice or any solicitation,
whatsoever. The subscribers / users assume the entire risk of any use made of this Data / SME IER Report. CRISIL especially states that, it has no
financial liability whatsoever, to the subscribers / users of this SME IER Report / Data. This SME IER Report / Data is for personal information of the
authorised recipient in India only. The SME IER Report should not be reproduced or redistributed or communicated directly or indirectly in any form to
any other person – especially outside India or published or copied in whole or in part, for any purpose.

RResults
January 07, 2014
Fair Value ₹64
CMP ₹47
MITCON Consulting & Engineering Services Ltd Established player in the engineering consultancy and training industry
SME Fundamental Grade 4/5 (Superior fundamentals)
SME Valuation Grade 5/5 (CMP has strong upside)
1
Pune-based MITCON Consultancy & Engineering Services Ltd (MITCON) is an established
player in the engineering consultancy and vocational training industry in India with expertise
in providing consultancy services to power generation, energy, infrastructure and BFSI
sectors. Recently, it has started catering to emerging sectors such as bio-technology,
environment management and food processing as well. Currently focused on Maharashtra,
the company plans to gradually expand to other major cities. Although demand for consulting
services is likely to remain subdued in the near term, we are positive on the long-term growth
prospects of the company. We have assigned SME Fundamental Grade of 4/5 to MITCON,
indicating that its fundamentals are superior relative to other SMEs in India.
Multi-industry exposure, geographic expansion plans bode well for long-term growth
Over the years, MITCON has developed expertise in providing consultancy services to
industries such as power, energy and BFSI; it has some of the leading public and private
sector players as its clients. The company has now started catering to emerging industries
such as bio-technology, environment management and food processing and is making steady
progress. Exposure to multiple industries is expected to be a key growth driver in the future.
MITCON also intends to expand its geographic presence, open up new growth avenues and
expand client base by setting up offices in other cities in India.
Plans to downsize training business to focus on consultancy
MITCON plans to downsize the vocational training business in order to channelise
management bandwidth to its core consultancy segment. Although the training segment
accounts for a significant share in total revenues, it has lower margins compared to the
consulting segment and lacks scalability. We expect the consulting business to drive
MITCON’s overall growth in the future.
Key risks: Competition is likely to intensify
The engineering consultancy industry is fragmented in nature with many small regional and
pan-India players. We expect MITCON to face stiff competition from these players as the
company scales up its consulting business and expand its geographic presence.
Revenues estimated to register tepid CAGR of 4.5% over FY13-16
Owing to economic slowdown and muted investment spending, MITCON’s revenues are
expected to remain under pressure in the near term and decline to ₹440 mn in FY15
compared to ₹467 mn in FY13. However, we expect the company’s foray into new markets
and gradual recovery in investment spending to drive revenue growth post FY15; we expect
revenue ₹533 mn in revenues in FY16. EBITDA margin is expected to contract to 20.3% in
FY15 owing to increase in employee costs and SG&A expenses, before recovering to 22.8%
in FY16. EPS is expected to decline to ₹6.4 in FY16 from ₹11.5 in FY13 due to lowered PAT
and equity infusion.
Valuation: We assign fair value of ₹64 per share
We have used the enterprise value to sales (EV/sales) multiple to value MITCON. We have
used EV/sales multiple of 1.0x on FY16 revenues and then added the FY15 cash, after
applying a discount of 30% to cash in hand, to arrive at the equity value for the company. By
using this method, we have arrived at a fair value of ₹64 per share for MITCON.
KEY FORECAST
(₹ mn) FY12 FY13 FY14E FY15E FY16E
Operating income 538 467 404 440 533
EBITDA 148 136 87 89 122
Adj net income 104 99 22 67 78
Adj EPS (₹) 11.1 11.5 4.7 5.5 6.4
EPS growth (%) (10.1) 3.8 (58.8) 16.0 17.2
RoCE (%) 30.7 23.4 10.3 7.6 10.1
RoE (%) 21.4 18.0 8.3 7.9 8.8
P/E (x) 4.3 4.1 10.0 8.6 7.3
P/BV (x) 0.8 0.7 0.7 0.7 0.6
EV/EBITDA (x) 1.3 1.2 1.0 2.2 2.4
Source: Company, CRISIL Research estimates
SME CFV MATRIX
KEY STOCK STATISTICS
NIFTY/SENSEX 6162/20693
NSE EMERGE ticker MITCON
Face value (₹ per share) 10
Shares outstanding (mn)* 12
Market cap (₹ mn)/(US$ mn)** 574/9
Enterprise value (₹ mn)/(US$ mn)** 128/2
52 week high/low (₹) 60/38
SHAREHOLDING PATTERN
ANALYTICAL CONTACT
Mohit Modi (Director) [email protected]
Sayan Das Sharma [email protected]
Bhaskar Bukrediwala [email protected]
Client servicing desk
+91 22 3342 3561 [email protected]
5/5
4/5
2/5
3/5
1/5
Excellent
Poor
StrongUpside
StrongDownside
5/5
4/5
2/5
3/5
1/5SM
E F
un
dam
en
tal
Gra
de
SM
E V
alu
ati
on
Gra
de
62%
41%
38%
59%
0%
10%
20%
30%
40%
50%
60%
70%
80%
90%
100%
Pre IPO Post IPO
Govt. company holdings Private holdings

CRISIL SME IERIndependentEquityResearch
2
Table 1: MITCON – Business environment
Parameter Business segments
Consultancy and engineering services Training and allied services
Revenue Contribution (FY13) 58% 42%
Revenue Contribution (FY15) 70% 30%
Revenue CAGR (FY10-13) 5.7% 11.6%
Revenue CAGR (FY13-15E) 5.0% -15.7%
Product/service description Provides consultancy services and corporate solutions to
power, energy and carbon, environment management,
BFSI, infrastructure and bio-technology sectors
Provides vocational and entrepreneurship
development training, corporate training and IT-
based training programs
Geographic presence Mostly in Maharashtra; plans to expand gradually to
major Indian cities such as Ahmedabad, Bengaluru,
Chennai, and Delhi
Maharashtra, Madhya Pradesh, Gujarat, Karnataka
and Goa
Market position Highly fragmented industry; MITCON is an established
player in the engineering consultancy market, particularly
for small ticket projects
An established player in the vocational and IT
training industry in Maharashtra. However, the
company plans to focus on its core consultancy
business
Demand drivers ■ Pick-up in investment spending - which will benefit
sectors such as power, infrastructure and banking - is
expected to result in higher demand for MITCON’s
consulting services
■ Geographic expansion to major business hubs of the
country is likely to expand the revenue and client
base
■ Increase in demand from the industry for skilled
labour
■ Central and state governments’ focus to
promote small scale industries is, in turn,
boosting demand for vocational and
entrepreneurship development training
Key risks ■ Prolonged slowdown in investment spending activity is likely to affect the consultancy business
■ MITCON faces stiff competition from large, established engineering consultancy providers such as Engineers
India Ltd, Feedback Ventures and Mott MacDonald India. With geographic expansion, the company is
expected to face competition from these players in the newer cities
Major competitors Large pan-India players - Engineers India Ltd, Feedback Ventures and Mott MacDonald Pvt. Ltd
Regional players - APITCO Ltd, KITCO Ltd, MPCON Ltd and others
Source: Company, CRISIL Research
MITCON Consultancy & Engineering Services Ltd
3
Grading Rationale
Established player in the engineering consultancy and
vocational training industry
Over the past three decades, MITCON has established itself as a known brand in the
engineering consultancy and vocational training market, particularly in Maharashtra. A wide
range of consultancy and training services – project feasibility studies, energy audit, project
management, market research and vocational training – are its key strength. Its expansive
client base includes prominent corporate (Hindustan Petroleum, Bharat Forge, GSPC Pipavav
and VRL Logistics) and public sector companies (Tamil Nadu Electricity Board; National
Institute for Micro, Small and Medium Enterprises; and Bureau of Energy Efficiency).
Consultancy business to drive future growth
Although the vocational training business has recorded healthy growth in recent years and
accounts for a significant share of total revenues (32% in FY13), the engineering consultancy
business is expected to drive long-term growth. The vocational training business lacks
scalability and earns lower margins compared to the consultancy business. According to the
management, the market opportunities of the consultancy business are more attractive
compared to training. A combination of these factors has prompted MITCON’s management to
shift its focus from the training business and channelise management bandwidth to its core
consultancy business. As a result, we expect the consulting segment to gradually increase its
share in overall revenues.
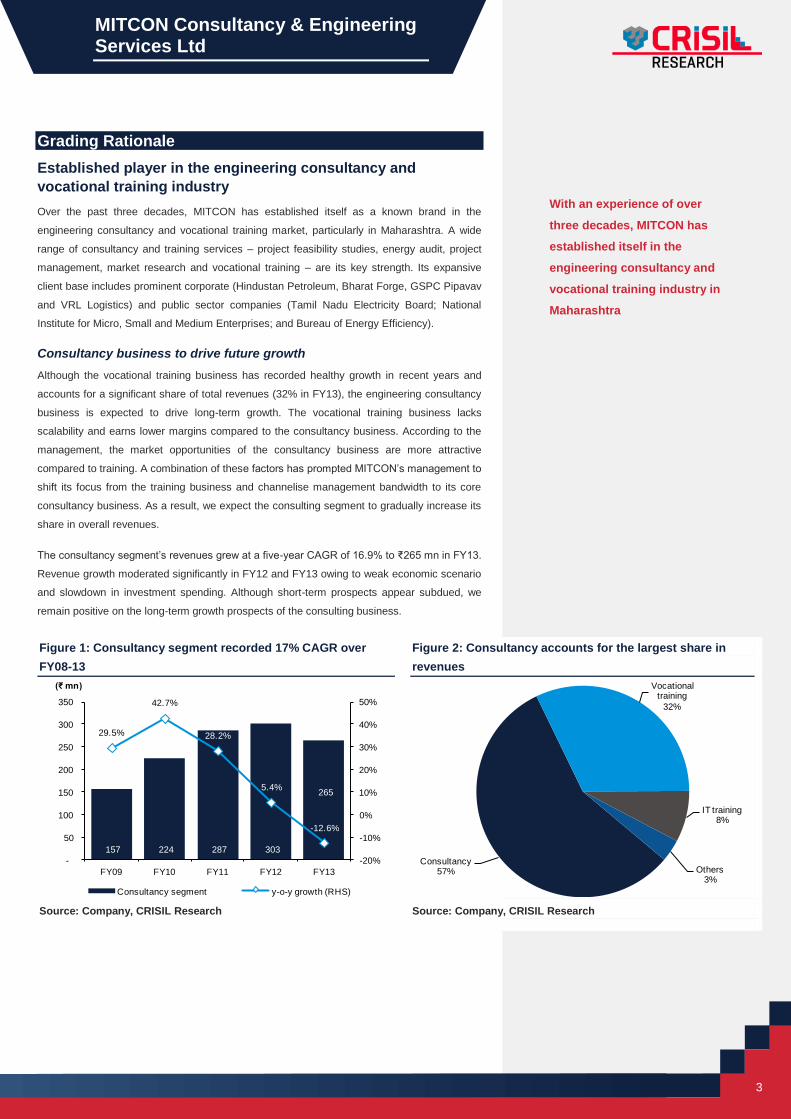
The consultancy segment’s revenues grew at a five-year CAGR of 16.9% to ₹265 mn in FY13.
Revenue growth moderated significantly in FY12 and FY13 owing to weak economic scenario
and slowdown in investment spending. Although short-term prospects appear subdued, we
remain positive on the long-term growth prospects of the consulting business.
Figure 1: Consultancy segment recorded 17% CAGR over
FY08-13
Figure 2: Consultancy accounts for the largest share in
revenues
Source: Company, CRISIL Research Source: Company, CRISIL Research
157 224 287 303
265
29.5%
42.7%
28.2%
5.4%
-12.6%
-20%
-10%
0%
10%
20%
30%
40%
50%
-
50
100
150
200
250
300
350
FY09 FY10 FY11 FY12 FY13
(₹ mn)
Consultancy segment y-o-y growth (RHS)
Consultancy57%
Vocational training
32%
IT training8%
Others3%
With an experience of over
three decades, MITCON has
established itself in the
engineering consultancy and
vocational training industry in
Maharashtra

CRISIL SME IERIndependentEquityResearch
4
Multi-industry exposure and diversified revenue base minimise
concentration risk
MITCON provides engineering consultancy services to a wide range of industries – traditional
(such as power, infrastructure, energy and banking) as well as emerging industries (bio-
technology, environment management and food processing). The multi-industry exposure
diversifies the revenue base of the company which, in turn, 1) lowers its dependence on a
single industry and 2) mitigates the risk of slowdown in any particular industry/market. We
expect its diversified presence across matured and growing industries to be one of the key
growth drivers for its consulting business.
Figure 3: MITCON’s consulting business has a diversified revenue base
Source: Company, CRISIL Research
Strong domain expertise in key sectors; to further expand to other
industries
Over the past three decades, the company has developed domain expertise in certain
industries – especially in decentralised power generation – which has helped it to gain a
strong foothold in those industries. Currently, it provides a wide range of services to small
power generation projects – project feasibility studies, assistance for getting approvals,
detailed appraisal reports, financial syndication, pre-contract engineering services, and post-
contract project management services. MITCON has recently started catering to emerging
industries such as bio-technology has and already recorded rapid growth.
In the coming years, the company intends to expand its offerings to more sectors such as
healthcare, textiles and agricultural. Additionally, it plans to strengthen its market research
offerings by adding consumer research services. Domain expertise in core sectors and a
focus on expanding service offerings to growing industries strengthen the company’s long-
term prospects.
Likely beneficiary of steady growth in end-user industries
Most of the industries served by MITCON are expected to report steady growth over the next
few years. Owing to an established position in the engineering consultancy industry, the
company could be a beneficiary of growth in client industries.
Power plant consultancy
39%
Energy and carbon services
27%
Environment management
6%
Infrastructure consulting
4%
Banking and finance
15%
SAFE9%
Balanced focus on mature as
well as growing industries
strengthens long-term growth
prospects
MITCON Consultancy & Engineering Services Ltd
5
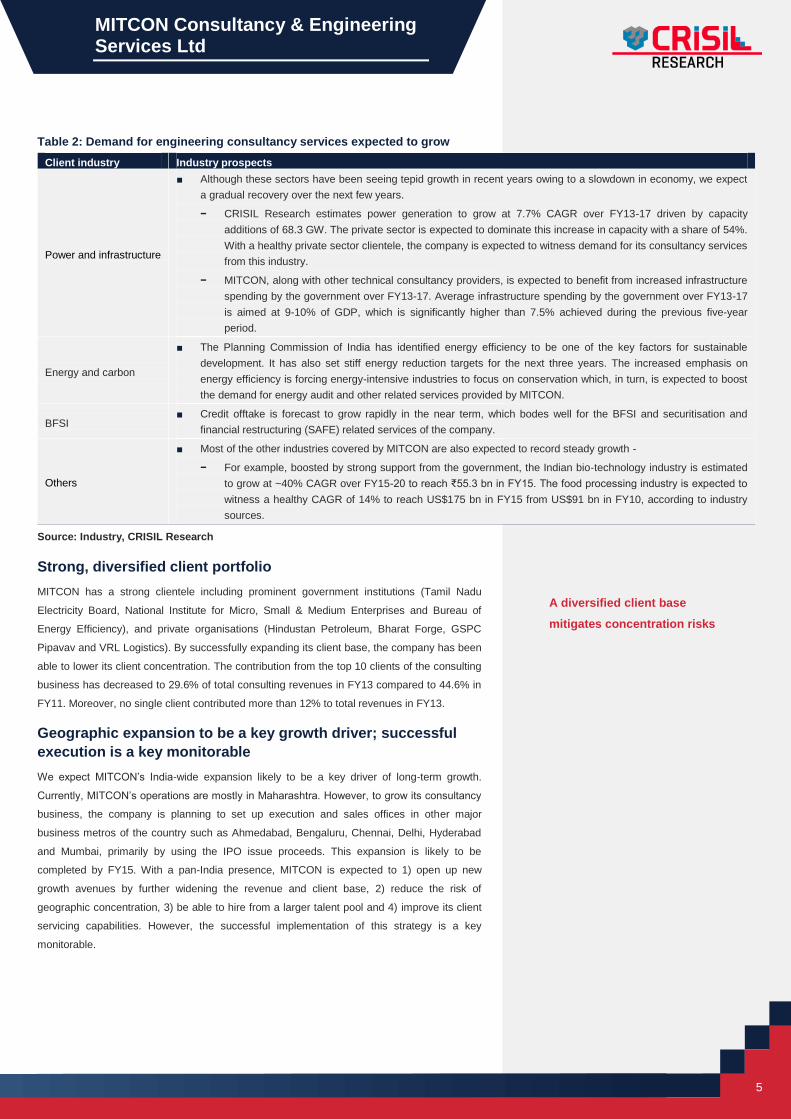
Table 2: Demand for engineering consultancy services expected to grow
Client industry Industry prospects
Power and infrastructure
■ Although these sectors have been seeing tepid growth in recent years owing to a slowdown in economy, we expect
a gradual recovery over the next few years.
− CRISIL Research estimates power generation to grow at 7.7% CAGR over FY13-17 driven by capacity
additions of 68.3 GW. The private sector is expected to dominate this increase in capacity with a share of 54%.
With a healthy private sector clientele, the company is expected to witness demand for its consultancy services
from this industry.
− MITCON, along with other technical consultancy providers, is expected to benefit from increased infrastructure
spending by the government over FY13-17. Average infrastructure spending by the government over FY13-17
is aimed at 9-10% of GDP, which is significantly higher than 7.5% achieved during the previous five-year
period.
Energy and carbon
■ The Planning Commission of India has identified energy efficiency to be one of the key factors for sustainable
development. It has also set stiff energy reduction targets for the next three years. The increased emphasis on
energy efficiency is forcing energy-intensive industries to focus on conservation which, in turn, is expected to boost
the demand for energy audit and other related services provided by MITCON.
BFSI ■ Credit offtake is forecast to grow rapidly in the near term, which bodes well for the BFSI and securitisation and
financial restructuring (SAFE) related services of the company.
Others
■ Most of the other industries covered by MITCON are also expected to record steady growth -
− For example, boosted by strong support from the government, the Indian bio-technology industry is estimated
to grow at ~40% CAGR over FY15-20 to reach ₹55.3 bn in FY15. The food processing industry is expected to
witness a healthy CAGR of 14% to reach US$175 bn in FY15 from US$91 bn in FY10, according to industry
sources.
Source: Industry, CRISIL Research
Strong, diversified client portfolio
MITCON has a strong clientele including prominent government institutions (Tamil Nadu
Electricity Board, National Institute for Micro, Small & Medium Enterprises and Bureau of
Energy Efficiency), and private organisations (Hindustan Petroleum, Bharat Forge, GSPC
Pipavav and VRL Logistics). By successfully expanding its client base, the company has been
able to lower its client concentration. The contribution from the top 10 clients of the consulting
business has decreased to 29.6% of total consulting revenues in FY13 compared to 44.6% in
FY11. Moreover, no single client contributed more than 12% to total revenues in FY13.
Geographic expansion to be a key growth driver; successful
execution is a key monitorable
We expect MITCON’s India-wide expansion likely to be a key driver of long-term growth.
Currently, MITCON’s operations are mostly in Maharashtra. However, to grow its consultancy
business, the company is planning to set up execution and sales offices in other major
business metros of the country such as Ahmedabad, Bengaluru, Chennai, Delhi, Hyderabad
and Mumbai, primarily by using the IPO issue proceeds. This expansion is likely to be
completed by FY15. With a pan-India presence, MITCON is expected to 1) open up new
growth avenues by further widening the revenue and client base, 2) reduce the risk of
geographic concentration, 3) be able to hire from a larger talent pool and 4) improve its client
servicing capabilities. However, the successful implementation of this strategy is a key
monitorable.
A diversified client base
mitigates concentration risks

CRISIL SME IERIndependentEquityResearch
6
To support its expansion strategy, MITCON intends to ramp up its advertising and marketing
initiatives and invest in brand-building exercises. As part of the planned marketing push,
MITCON is looking to launch advertising campaigns and other promotional activities.
Competitive landscape
The engineering consultancy industry is fragmented. There are a number of small regional
(including MITCON, KITCON, APITCO) and large pan-India players (such as Feedback
Ventures, Mott MacDonald, Engineers India Ltd). The entry barriers of this industry are also
low.
Table 3: Peer comparison – MITCON’s financial performance at par with peers
Parameters MITCON Engineers India Ltd Mott MacDonald
India Pvt. Ltd APITCO Ltd KITCO Ltd
Major services
Provides
consultancy
services to
industries including
power generation,
infrastructure,
BFSI, environment
engineering and
others. Also offers
training services
Provides engineering
consultancy services
such as design, EPC,
construction, and
integrated project
management services for
oil and gas,
petrochemicals, fertiliser
and LNG industries in
India and internationally
Provides an array of
management,
engineering and
development
consultancy and
advisory services to
energy,
infrastructure, power
and construction
industries
Offers engineering
and other
consultancy services
focusing on SMEs. It
caters to power
generation, energy
and carbon services,
environment
management and
others
Provides engineering,
management and
project consultancy
services. Its services
cover diverse sectors
such as infrastructure,
environment, financial
services, urban
development and IT
services
Geographic presence
Primarily
Maharashtra,
intends to expand
to other major
cities in India
Pan-India presence with
headquarter in Delhi
Present across India Andhra Pradesh,
Delhi, Kerala, and
Orissa
South India, primarily
Kerala
Market capitalisation
(₹ mn) 574 55,932 Unlisted Unlisted Unlisted
FY13 revenue (₹ mn) 467 25,290 2,139 145 285.6 (FY12)
Revenue growth
(FY11-13 CAGR) (0.6%) (5.8%) 4.5% 6.7% NA
Average EBITDA
margin (FY11-13) 29.2% 22.1% 2.6% 23.9% NA
Average PAT margin
(FY11-13) 20.5% 20.3% 0.4% 15.1% NA
Average RoE
(FY11-13) 23.5% 36.1% 20.8% 23.9% NA
Average debtor days 98 40 130 138 NA
Source: Industry, CRISIL Research
Although MITCON’s service offerings and operational and financial performance are at par
with most of the aforementioned companies, it lacks scale compared to larger players (such
as Engineers India, Mott MacDonalds and Feedback Ventures). This limits MITCON’s ability to
bid for large ticket projects, which is necessary to achieve the next level of growth.
Stretched working capital cycle is a key monitorable
Owing to an increase in debtor days, MITCON’s working capital was stretched in FY13. Due to
a challenging business environment, some of its clients were unable to pay their dues on time,
which led to debtor days increasing to 130 in FY13 from 89 in FY12. This, coupled with a
The service offerings and
financial performance of
MITCON are at par with most
competitors
MITCON Consultancy & Engineering Services Ltd
7
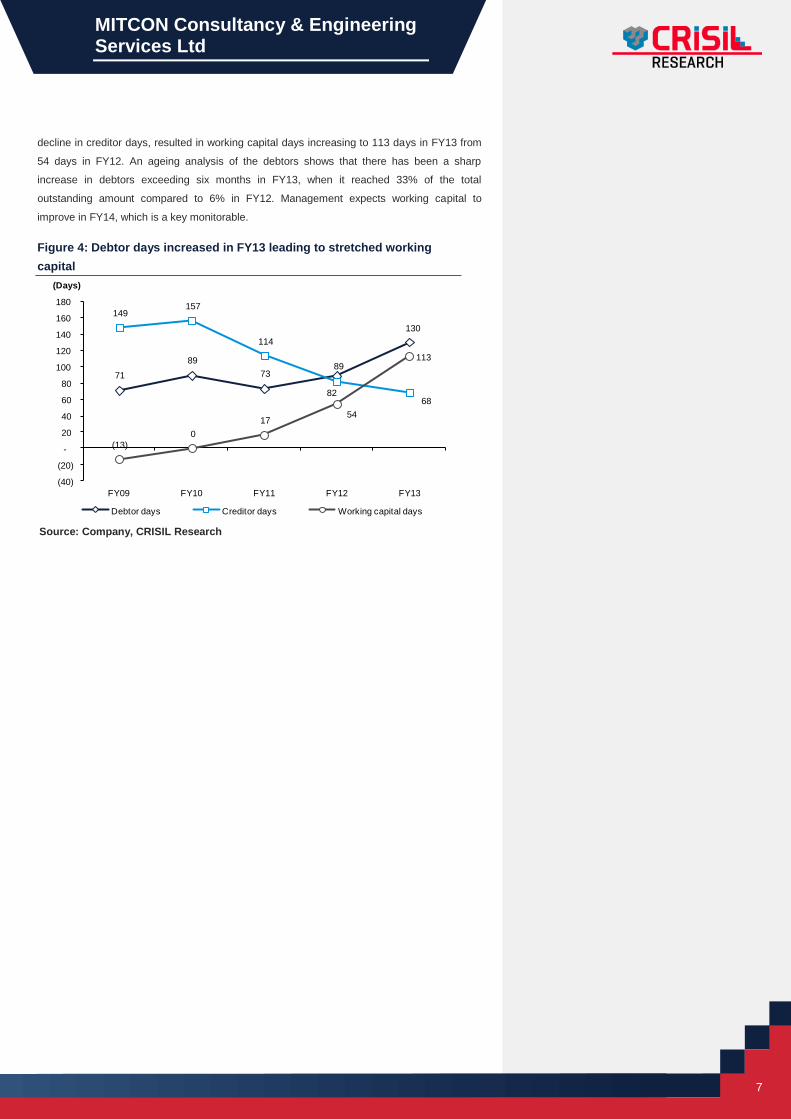
decline in creditor days, resulted in working capital days increasing to 113 days in FY13 from
54 days in FY12. An ageing analysis of the debtors shows that there has been a sharp
increase in debtors exceeding six months in FY13, when it reached 33% of the total
outstanding amount compared to 6% in FY12. Management expects working capital to
improve in FY14, which is a key monitorable.
Figure 4: Debtor days increased in FY13 leading to stretched working
capital
Source: Company, CRISIL Research
71
89
73 89
130
149 157
114
82 68
(13)
0
17 54
113
(40)
(20)
-
20
40
60
80
100
120
140
160
180
FY09 FY10 FY11 FY12 FY13
(Days)
Debtor days Creditor days Working capital days

CRISIL SME IERIndependentEquityResearch
8
Key Risks
Prolonged slowdown in investment spending could have an
adverse impact on growth
On account of muted economic growth and slowdown in investment spending, MITCON’s
consulting business has been under pressure for the past two years. Revenues from this
segment witnessed a tepid CAGR of 5.7% between FY10 and FY13 compared to 35.1%
between FY08 and FY10. If investment activity fails to pick up, demand for MITCON’s
consulting services - particularly power generation, energy and infrastructure related – could
be adversely impacted.
Increase in competitive intensity
The engineering consultancy industry is fragmented; there are a number of small regional and
large pan-India players. This, coupled with low entry barriers, leads to high competition. With
MITCON’s goals of establishing itself as a pan-India player, the competitive scenario for the
consulting business could intensify in the future. The company is likely to face competition
from other regional engineering consultancy providers (such as APITCO and KITCO Ltd) for
small ticket projects; for larger projects, it is likely to face competition from large consultancy
players such as Mott MacDonald and Feedback Ventures. At present, the company does not
have any substantial competitive advantage against these established players.
Downsizing the vocational business may affect top line in near
term
MITCON has decided to strategically shift focus from the vocational training business, which
accounted for 32% of total revenues in FY13, to the core consultancy business. Although the
management expects to maintain the current revenue stream from the training business, any
significant shortfall from current levels may adversely impact its top line, especially given that
the consultancy business is likely to remain under pressure in the near term.
Low entry barriers and
fragmented nature of the
industry may result in
increased competition
MITCON Consultancy & Engineering Services Ltd
9
Management and Corporate Governance
Strong institutional shareholding adds credibility
MITCON’s shareholders include leading banks and financial institutions (such as ICICI Bank,
IFCI, and SBI) and state development corporations - State Industrial & Investment Corporation
of Maharashtra (SICOM) Ltd, Maharashtra Industrial Development Corporation (MIDC), and
Maharashtra Small Scale Industries Development Corporation (MSSIDC). None of the
shareholders have over 20% stake in the company. Each of the four largest shareholders –
ICICI Bank, SIDBI, SICOM and IFCI – have one nominee director on the board. We believe a
strong institutional shareholding helps the company establish good corporate governance
practices.
Professional management team with strong domain expertise
MITCON is run by a professional management team with expertise in the engineering
consultancy industry. The company’s managing director, Mr Pradeep Bavadekar, has 18
years of experience in management and engineering consultancy; and 15 years of experience
in automotive components, plastic and chemical equipment industries. Under the leadership of
Mr Bavadekar, MITCON has successfully expanded its service portfolio to cover more
industries. Based on our interaction with the management, we believe that decision making in
MITCON is centralised.
The second line of management includes Mr Sunil Natu – senior vice president of power
projects, and Mr Ram Mapari – controller of finance; both have over three decades of
experience. In our opinion, the second line’s experience is commensurate with the size of the
company.
Directors have vast experience across industries
MITCON’s board consists of six directors – the MD, four nominee directors and one
independent director. The directors have held senior positions in companies across diverse
sectors such as banking, advisory, education, government and entrepreneurship. This makes
the profile of MITCON’s board significantly better than other small and medium enterprise
(SMEs) in the country. We believe the directors act independently and have the ability to
exercise oversight.
Related party transaction with MITCON Foundation
The management of MITCON runs a trust, MITCON Foundation, which operates a business
school in Pune. The company has outstanding receivables worth ₹21.3 mn from the trust
against a sale of land. However, the company has issued a corporate guarantee to Bank of
Baroda against a term loan taken by MITCON Foundation and is not eligible to claim its
outstanding amount until the term loan is paid in full. The trust is expected to complete the
payment to Bank of Baroda by FY15. Hence, the company is confident of recovering its dues
in the subsequent years. However, any such related party transaction with the trust in the
future could be detrimental for the minority shareholders.
Each of the four largest
institutional shareholders has
one nominee director on the
board
The management team is
experienced and commensurate
to the size of the business
No single shareholder has
more than 20% stake in the
company

CRISIL SME IERIndependentEquityResearch
10
Financial Outlook and Valuation
Revenue growth to be subdued in near term; expect 4.5%
CAGR over FY13-16
CRISIL Research expects MITCON’s revenues to grow to ₹533 mn in FY16 at a three-year
CAGR of 4.5% driven mainly by growth in the consulting segment. Given the weak economic
outlook, revenue growth is expected to be under pressure in FY14 and FY15 with y-o-y growth
of -14% and 9%, respectively. However, gradual recovery in investment spending activity and
geographic expansion is expected to drive top line growth from FY16 onwards.
We expect the consulting business to log a CAGR of 13.6% over FY13-16 driven by healthy
growth across divisions, while the vocational training segment is expected to report a decline.
As a result, the contribution of the consulting segment to overall revenues is expected to
increase steadily. MITCON is expected to set up offices in five major cities in India by FY15,
broadening its client and revenue base. This is expected to result in increasing demand for the
company’s consulting services.
Figure 5: Revenues to grow at 3% CAGR over FY13-16 Figure 6: Consulting segment to increase share in revenues
Source: Company, CRISIL Research Source: Company, CRISIL Research
EBITDA margin to contract to 20.3% in FY15; expected to
recover in FY16
With setting up of new offices, MITCON’s SG&A expense is likely to increase in the next
couple of years. The company expects to 1) hire new employees to back its growth plans,
which is likely to increase employee expenses as a percentage of sales; and 2) increase
marketing and advertising expenses, which are likely to lead to higher SG&A expense as a
percentage of sales. As a result, EBITDA margin is expected to decline from 29% in FY13 to
20.3% in FY15. However, as these initiatives are expected to result in higher sales post FY15,
EBITDA is estimated to improve to 22.8% in FY16.
Adjusted PAT to decline to ₹78 mn in FY16
We expect MITCON’s adjusted PAT to decline to ₹78 mn in FY16 from ₹99 mn in FY13,
mainly due to a decline in EBITDA margin. EPS is expected to decline to ₹6.4 in FY16 from
₹11.5 in FY13 as the equity base will increase equity infusion. The increase in equity, coupled
with declining profit margin, is also expected to result in RoE dropping to 8.3% in FY15 from
538 467 404 440 533
13.9%
-13.3% -13.5%
8.9%
21.3%
-25%
-20%
-15%
-10%
-5%
0%
5%
10%
15%
20%
25%
-
100
200
300
400
500
600
FY12 FY13 FY14E FY15E FY16E
(₹ mn)
Revenue y-o-y growth (RHS)
60% 60% 64% 69%76%
31% 31% 27%22%
16%
8% 8% 8% 8% 7%
1% 1% 1% 1% 1%
0%
10%
20%
30%
40%
50%
60%
70%
80%
90%
100%
FY12 FY13 FY14E FY15E FY16E
(%)
Consulting income Vocational training IT Training Others
Geographic expansion and
gradual recovery in investment
spending is likely to drive top-
line growth
Higher SG&A and employee cost
expected to result in subdued
EBITDA margin

MITCON Consultancy & Engineering Services Ltd
11
18% in FY13. However, we expect RoE to recover post FY15 once the offices across five
cities are set up and the company starts to witness demand for its services from those
regions.
Figure 7: Adjusted PAT to decline in FY13-16 Figure 8: RoE and RoCE to decline due to equity infusion
Source: Company, CRISIL Research Source: Company, CRISIL Research
We assign fair value of ₹64 per share to MITCON
We have followed the EV/sales multiple to value the company as it is operating in a cyclical
industry with limited long-term visibility on revenues and earnings.
■ We have used EV/sales multiple of 1.0x on FY16 revenue, which is at a ~25% discount
to the company’s listed peer, Engineering India Ltd (which is currently trading at a
EV/sales multiple of 1.26x). Given that 1) MITCON is a smaller player compared to
Engineers India Ltd and 2) MITCON’s average RoE over the past three years is
considerable lower than Engineers India Ltd (23.5% for MITCON compared to 36.1% for
Engineers India Ltd), we believe the 25% discount is appropriate. By using the multiple,
we have arrived at an enterprise value of ₹533 for MITCON.
■ To arrive at the equity value, we added back the FY15 cash, after discounting it by 30%,
to the enterprise value. We discounted it as we have limited visibility on the deployment
of the excess cash in hand. By adding back the cash, we have arrived at a total equity
value of ₹773 mn and a fair value of ₹64 per share.
Equity valuation of MITCON
FY16 revenue ₹533 mn
EV/sales multiple 1.0x
Enterprise value ₹533 mn
Cash in hand as of FY15 ₹343 mn
Discount rate applied to cash 30%
Debt as of FY15 -
Total equity value ₹773 mn
Fair value per share ₹64
Source: CRISIL Research
89 92 57 67 78
16.5%
19.7%
14.2%15.1% 14.6%
5%
8%
10%
13%
15%
18%
20%
-
10
20
30
40
50
60
70
80
90
100
FY12 FY13 FY14E FY15E FY16E
(₹ mn)
Adjusted PAT Adjusted PAT margin (RHS)
21.4
18.0
8.3
7.9
8.8
30.7
23.4
10.3
7.6
10.1
0
5
10
15
20
25
30
35
FY12 FY13 FY14E FY15E FY16E
(%)
RoE RoCE
Our fair value for MITCON is ₹64
per share
CRISIL SME IERIndependentEquityResearch
12
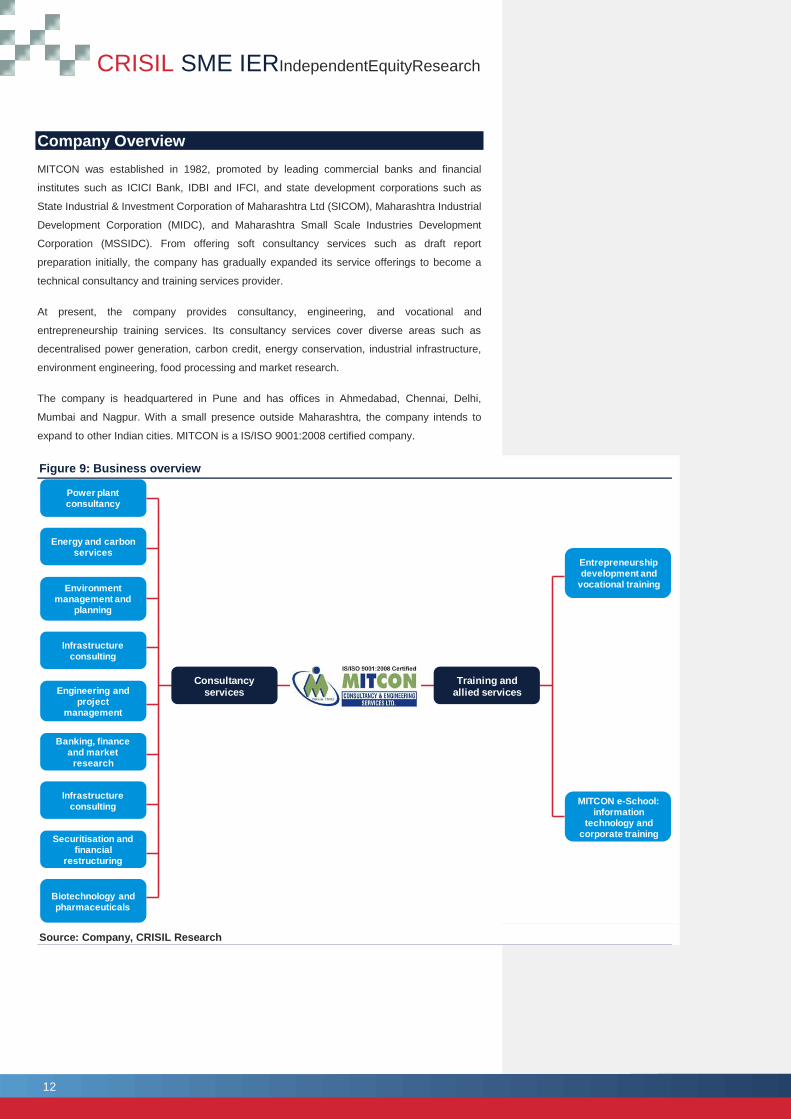
Company Overview
MITCON was established in 1982, promoted by leading commercial banks and financial
institutes such as ICICI Bank, IDBI and IFCI, and state development corporations such as
State Industrial & Investment Corporation of Maharashtra Ltd (SICOM), Maharashtra Industrial
Development Corporation (MIDC), and Maharashtra Small Scale Industries Development
Corporation (MSSIDC). From offering soft consultancy services such as draft report
preparation initially, the company has gradually expanded its service offerings to become a
technical consultancy and training services provider.
At present, the company provides consultancy, engineering, and vocational and
entrepreneurship training services. Its consultancy services cover diverse areas such as
decentralised power generation, carbon credit, energy conservation, industrial infrastructure,
environment engineering, food processing and market research.
The company is headquartered in Pune and has offices in Ahmedabad, Chennai, Delhi,
Mumbai and Nagpur. With a small presence outside Maharashtra, the company intends to
expand to other Indian cities. MITCON is a IS/ISO 9001:2008 certified company.
Figure 9: Business overview
Source: Company, CRISIL Research
Power plant consultancy
Energy and carbon services
Environment management and
planning
Infrastructure consulting
Engineering and project
management
Banking, finance and market
research
Infrastructure consulting
Securitisation and financial
restructuring
Consultancy services
Biotechnology and pharmaceuticals
Training and allied services
Entrepreneurship development and
vocational training
MITCON e-School: information
technology and corporate training
MITCON Consultancy & Engineering Services Ltd
13
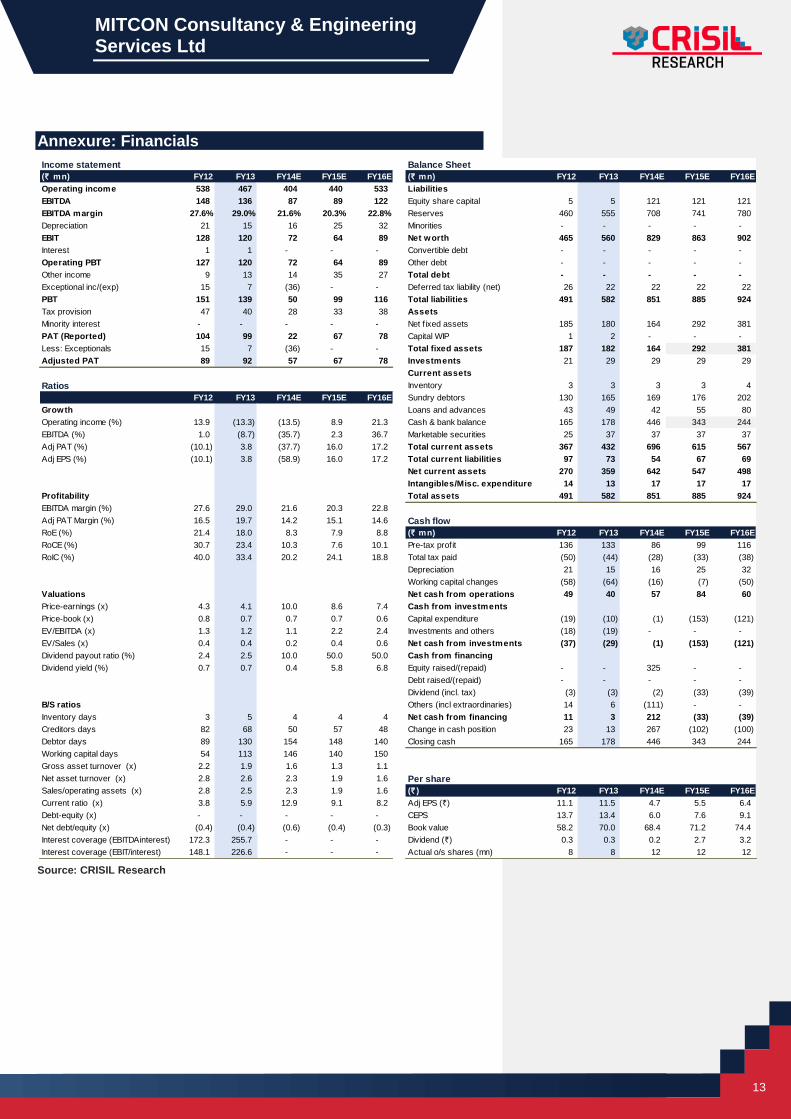
Annexure: Financials
Source: CRISIL Research
Income statement Balance Sheet
(` mn) FY12 FY13 FY14E FY15E FY16E (` mn) FY12 FY13 FY14E FY15E FY16E
Operating income 538 467 404 440 533 Liabilities
EBITDA 148 136 87 89 122 Equity share capital 5 5 121 121 121
EBITDA margin 27.6% 29.0% 21.6% 20.3% 22.8% Reserves 460 555 708 741 780
Depreciation 21 15 16 25 32 Minorities - - - - -
EBIT 128 120 72 64 89 Net worth 465 560 829 863 902
Interest 1 1 - - - Convertible debt - - - - -
Operating PBT 127 120 72 64 89 Other debt - - - - -
Other income 9 13 14 35 27 Total debt - - - - -
Exceptional inc/(exp) 15 7 (36) - - Deferred tax liability (net) 26 22 22 22 22
PBT 151 139 50 99 116 Total liabilities 491 582 851 885 924
Tax provision 47 40 28 33 38 Assets
Minority interest - - - - - Net f ixed assets 185 180 164 292 381
PAT (Reported) 104 99 22 67 78 Capital WIP 1 2 - - -
Less: Exceptionals 15 7 (36) - - Total fixed assets 187 182 164 292 381
Adjusted PAT 89 92 57 67 78 Investments 21 29 29 29 29
Current assets
Ratios Inventory 3 3 3 3 4
FY12 FY13 FY14E FY15E FY16E Sundry debtors 130 165 169 176 202
Growth Loans and advances 43 49 42 55 80
Operating income (%) 13.9 (13.3) (13.5) 8.9 21.3 Cash & bank balance 165 178 446 343 244
EBITDA (%) 1.0 (8.7) (35.7) 2.3 36.7 Marketable securities 25 37 37 37 37
Adj PAT (%) (10.1) 3.8 (37.7) 16.0 17.2 Total current assets 367 432 696 615 567
Adj EPS (%) (10.1) 3.8 (58.9) 16.0 17.2 Total current liabilities 97 73 54 67 69
Net current assets 270 359 642 547 498
Intangibles/Misc. expenditure 14 13 17 17 17
Profitability Total assets 491 582 851 885 924
EBITDA margin (%) 27.6 29.0 21.6 20.3 22.8
Adj PAT Margin (%) 16.5 19.7 14.2 15.1 14.6 Cash flow
RoE (%) 21.4 18.0 8.3 7.9 8.8 (` mn) FY12 FY13 FY14E FY15E FY16E
RoCE (%) 30.7 23.4 10.3 7.6 10.1 Pre-tax profit 136 133 86 99 116
RoIC (%) 40.0 33.4 20.2 24.1 18.8 Total tax paid (50) (44) (28) (33) (38)
Depreciation 21 15 16 25 32
Working capital changes (58) (64) (16) (7) (50)
Valuations Net cash from operations 49 40 57 84 60
Price-earnings (x) 4.3 4.1 10.0 8.6 7.4 Cash from investments
Price-book (x) 0.8 0.7 0.7 0.7 0.6 Capital expenditure (19) (10) (1) (153) (121)
EV/EBITDA (x) 1.3 1.2 1.1 2.2 2.4 Investments and others (18) (19) - - -
EV/Sales (x) 0.4 0.4 0.2 0.4 0.6 Net cash from investments (37) (29) (1) (153) (121)
Dividend payout ratio (%) 2.4 2.5 10.0 50.0 50.0 Cash from financing
Dividend yield (%) 0.7 0.7 0.4 5.8 6.8 Equity raised/(repaid) - - 325 - -
Debt raised/(repaid) - - - - -
Dividend (incl. tax) (3) (3) (2) (33) (39)
B/S ratios Others (incl extraordinaries) 14 6 (111) - -
Inventory days 3 5 4 4 4 Net cash from financing 11 3 212 (33) (39)
Creditors days 82 68 50 57 48 Change in cash position 23 13 267 (102) (100)
Debtor days 89 130 154 148 140 Closing cash 165 178 446 343 244
Working capital days 54 113 146 140 150
Gross asset turnover (x) 2.2 1.9 1.6 1.3 1.1
Net asset turnover (x) 2.8 2.6 2.3 1.9 1.6 Per share
Sales/operating assets (x) 2.8 2.5 2.3 1.9 1.6 (` ) FY12 FY13 FY14E FY15E FY16E
Current ratio (x) 3.8 5.9 12.9 9.1 8.2 Adj EPS (`) 11.1 11.5 4.7 5.5 6.4
Debt-equity (x) - - - - - CEPS 13.7 13.4 6.0 7.6 9.1
Net debt/equity (x) (0.4) (0.4) (0.6) (0.4) (0.3) Book value 58.2 70.0 68.4 71.2 74.4
Interest coverage (EBITDAinterest) 172.3 255.7 - - - Dividend (`) 0.3 0.3 0.2 2.7 3.2
Interest coverage (EBIT/interest) 148.1 226.6 - - - Actual o/s shares (mn) 8 8 12 12 12

CRISIL SME IERIndependentEquityResearch
CRISIL Research Team
President
Mukesh Agarwal CRISIL Research +91 22 3342 3035 [email protected]
Analytical Contacts
Sandeep Sabharwal Senior Director, Capital Markets +91 22 4097 8052 [email protected]
Prasad Koparkar Senior Director, Industry & Customised Research +91 22 3342 3137 [email protected]
Binaifer Jehani Director, Customised Research +91 22 3342 4091 [email protected]
Manoj Mohta Director, Customised Research +91 22 3342 3554 [email protected]
Sudhir Nair Director, Customised Research +91 22 3342 3526 [email protected]
Mohit Modi Director, Equity Research +91 22 4254 2860 [email protected]
Jiju Vidyadharan Director, Funds & Fixed Income Research +91 22 3342 8091 [email protected]
Ajay D'Souza Director, Industry Research +91 22 3342 3567 [email protected]
Ajay Srinivasan Director, Industry Research +91 22 3342 3530 [email protected]
Rahul Prithiani Director, Industry Research +91 22 3342 3574 [email protected]
Business Development
Hani Jalan Director, Capital Markets +91 22 3342 3077 [email protected]
Prosenjit Ghosh Director, Industry & Customised Research +91 22 3342 8008 [email protected]
Business Development – Equity Research
Vishal Shah – Regional Manager
Email : [email protected]
Phone : +91 9820598908
Shweta Adukia – Regional Manager
Email : [email protected]
Phone : +91 9987855771
Priyanka Murarka – Regional Manager
Email : [email protected]
Phone : +91 9903060685
Ankur Nehra – Regional Manager
Email : [email protected]
Phone : +91 9999575639
Our Capabilities
Making Markets Function Better
Economy and Industry Research
▪ Largest team of economy and industry research analysts in India
▪ Coverage on 70 industries and 139 sub-sectors; provide growth forecasts, profitability analysis, emerging trends,
expected investments, industry structure and regulatory frameworks
▪ 90 per cent of India’s commercial banks use our industry research for credit decisions
▪ Special coverage on key growth sectors including real estate, infrastructure, logistics, and financial services
▪ Inputs to India’s leading corporates in market sizing, demand forecasting, and project feasibility
▪ Published the first India-focused report on Ultra High Net-worth Individuals
▪ All opinions and forecasts reviewed by a highly qualified panel with over 200 years of cumulative experience
Funds and Fixed Income Research
▪ Largest and most comprehensive database on India’s debt market, covering more than 15,000 securities
▪ Largest provider of fixed income valuations in India
▪ Value more than ₹53 trillion (USD 960 billion) of Indian debt securities, comprising outstanding securities
▪ Sole provider of fixed income and hybrid indices to mutual funds and insurance companies; we maintain 12
standard indices and over 100 customised indices
▪ Ranking of Indian mutual fund schemes covering 70 per cent of assets under management and ₹4.7 trillion
(USD 85 billion) by value
▪ Retained by India’s Employees’ Provident Fund Organisation, the world’s largest retirement scheme covering
over 60 million individuals, for selecting fund managers and monitoring their performance
Equity and Company Research
▪ Largest independent equity research house in India, focusing on small and mid-cap companies; coverage
exceeds 125 companies
▪ Released company reports on 1,442 companies listed and traded on the National Stock Exchange; a global first
for any stock exchange
▪ First research house to release exchange-commissioned equity research reports in India
▪ Assigned the first IPO grade in India
Our Office
Ahmedabad
706, Venus Atlantis
Nr. Reliance Petrol Pump
Prahladnagar, Ahmedabad, India
Phone: +91 79 4024 4500
Fax: +91 79 2755 9863
Hyderabad
3rd Floor, Uma Chambers
Plot No. 9&10, Nagarjuna Hills,
(Near Punjagutta Cross Road)
Hyderabad - 500 482, India
Phone: +91 40 2335 8103/05
Fax: +91 40 2335 7507
Bengaluru
W-101, Sunrise Chambers,
22, Ulsoor Road,
Bengaluru - 560 042, India
Phone: +91 80 2558 0899
+91 80 2559 4802
Fax: +91 80 2559 4801
Kolkata
Horizon, Block 'B', 4th Floor
57 Chowringhee Road
Kolkata - 700 071, India
Phone: +91 33 2289 1949/50
Fax: +91 33 2283 0597
Chennai
Thapar House,
43/44, Montieth Road, Egmore,
Chennai - 600 008, India
Phone: +91 44 2854 6205/06
+91 44 2854 6093
Fax: +91 44 2854 7531
Pune
1187/17, Ghole Road,
Shivaji Nagar,
Pune - 411 005, India
Phone: +91 20 2553 9064/67
Fax: +91 20 4018 1930
Gurgaon
Plot No. 46
Sector 44
Opp. PF Office
Gurgaon - 122 003, India
Phone: +91 124 6722 000
Stay Connected | CRISIL Website |
Twitter |
LinkedIn |
YouTube |
CRISIL Ltd is a Standard & Poor's company
CRISIL Limited
CRISIL House, Central Avenue,
Hiranandani Business Park, Powai, Mumbai – 400076. India
Phone: +91 22 3342 3000 | Fax: +91 22 3342 8088
www.crisil.com