crime and justice - · pdf filecontemporary issues in crime and justice number 187 ... rather...
TRANSCRIPT

Contemporary Issues in Crime and Justice Number 187 October 2015
This bulletin has been independently peer reviewed.
CRIME AND JUSTICEBulletin NSW Bureau of Crime
Statistics and Research
Does the first prison sentence reduce the risk of further offending?Judy Trevena and Don Weatherburn
Aim: This bulletin examines the question of whether short prison sentences (up to 12 months) exert a special deterrent effect.
Method: Propensity score matching was used to compare time to reconviction among 3,960 matched pairs of offenders, in which one of each pair received a prison sentence of 12 months or less and the other received a suspended sentence of two years or less. Kaplan Meier survival analysis was then used to examine time to the first proven offence committed after the index court appearance. Adjustments were made for any time spent in custody during the follow-up period.
Results: No significant differences were found between the matched prison and suspended sentence groups in the time to first new offence.
Conclusion: These results suggest that short custodial sentences exert no more deterrent effect than comparable community orders.
Keywords: prison, re-offending, special deterrence, propensity score matching, suspended sentence
INTRODUCTION
One of the justifications most commonly advanced for the use of prison as a sanction is the assumption that it will reduce crime, whether by incapacitation, rehabilitation, deterrence or other mechanism. Two types of deterrence have been distinguished: general deterrence (in which the existence of prison penalties deters members of society from offending) and special deterrence (the reaction of people who have been to prison to the prison experience).
The high rate of return to prison and the international research literature on the effectiveness of prison as a special deterrent cast doubt on the assumption that imprisonment acts as a deterrent. Overseas and Australian studies (reviewed below) have found little evidence that offenders given a prison sentence are any less likely to re-offend than comparable offenders given a non-custodial sanction. In fact, a prison sentence may increase the likelihood of re-offending, perhaps by providing opportunities to learn criminal behaviour and attitudes from others while in custody, or because the stigma of being labelled reduces
opportunities to pursue a non-criminal way of life on release. Still, given the paucity of local evidence, the issue could hardly be regarded as closed. The effect of prison on re-offending is likely to depend on a host of social and criminal justice system-specific factors, such as rates of employment among former inmates (Schnepel, 2015) and levels of supervision and support in the period following release (Wan, Poynton, & Weatherburn, 2015). These factors may vary markedly from country to country. There remains a need, therefore, for further rigorous research into the effects and effectiveness of prison in Australia.
The aim of this study, then, is to investigate the special deterrent effect of prison in Australia. The study compares reoffending among a sample of offenders given short (less than one year) sentences with reoffending in a matched sample of offenders given a suspended prison sentence. The attraction of suspended sentences as a counterfactual is that, under Section 12 of the NSW Sentencing Procedure Act (1999), a court cannot impose a suspended sentence of imprisonment without having first decided that a full-time sentence of imprisonment is appropriate. Therefore, there should be little difference between offenders

2
B U R E A U O F C R I M E S T A T I S T I C S A N D R E S E A R C H
given (relatively short) full-time custodial sentences and those given suspended sentences of imprisonment, making it possible to create matched pairs of similar cases, in which one person received a full-time sentence of imprisonment and the other received a suspended sentence of imprisonment.
Before describing the current study in more detail, we briefly review past research on the effectiveness of prison as a special deterrent. There have been two major reviews of the evidence on the specific deterrent effect of prison: one conducted by Nagin, Cullen, and Jonson (2009) and the other conducted by Villettaz, Killias, and Zoder (2006). As both reach essentially the same conclusions we base our summary of the evidence around the more recent review by Nagin et al. (2009), before describing research conducted since 2009.
PAST RESEARCH
Nagin et al. (2009) summarise the evidence on specific deterrence under four different headings: experimental and quasi-experimental studies, matching studies, regression based studies and other studies. We adopt the same framework here. Rather than recapitulate their observations in detail, however, we illustrate each of the types of study they reviewed and then summarise their observations in relation to that type of study.
Experimental and quasi-experimental studies
Killias, Aebi, and Ribeaud (2000) took advantage of a facility in Switzerland under which offenders sentenced to short (14 day) periods of imprisonment could opt to serve the sentence as a form of community service order. Swiss law at the time allowed for testing, on an experimental basis, of innovative forms of correctional treatment, including alternatives to imprisonment. Normally most offenders opt for community service rather than prison, although some apparently do prefer to spend their 14-day sentence in custody. The Directors of Corrections in the Swiss canton of Vaud agreed to conduct an experiment in which eligible offenders were randomly allocated to prison or community service. The justification given for this seemingly inequitable treatment of offenders was that the resources available to manage offenders on community service orders were strictly limited.
The treatment (community service) group (n = 84) was compared with the randomised control (prison) group (n = 39). Measures were taken for each group of the prevalence and frequency of police-recorded offending (police contacts) and court convictions before the index court appearance (i.e. the appearance at which they were allocated to groups) and after that appearance. The follow-up period was two years. The prevalence of police contact and conviction declined post-allocation for both groups, as did the frequency of police contacts and court convictions. No difference was found between the groups in relation to the
changes in prevalence of police contact. When the frequency of police contact was examined, however, the custody group was found to have had slightly more contacts after the index court appearance than the community service group.
Overall, the five experimental or quasi-experimental studies of specific deterrence identified by Nagin et al. (2009) tend to suggest that imprisonment has a criminogenic effect rather than a deterrent effect on offenders. All five studies found at least one criminogenic effect of incarceration, most of which were statistically significant. Three reported at least one deterrent effect, but the only study in which the effect was statistically significant was the one that failed to separate deterrence from incapacitation effects (Barton & Butts, 1990). However, the strength of the experimental evidence is weak: two of these studies (Barton & Butts, 1990; Schneider, 1986) involved only juvenile offending, three (Killias et al., 2000; Schneider, 1986; Van der Werff (1979, cited by Nagin et al., 2009)) involve short custody periods (14 days or fewer), and only one (Killias et al., 2000) used data collected since 1990.
Matching studies
The benefit of random assignment of people to treatment conditions is that we can be reasonably confident that the groups will have a similar mix of background demographic characteristics and criminal histories. However there are few situations in the criminal justice system in which random assignment of a penalty for a crime is appropriate or acceptable, so we must look for other ways to create comparable groups. This is especially important when assessing the effect of a prison sentence, as many of the ways in which people sent to prison are typically different from those given a community sentence (for example, they are more likely to be male, a member of a marginalised ethnic group, have more numerous previous offences and have been convicted of a more serious index offence) are also ways in which people who reoffend tend to be different from those who do not (Werminck, Blockland, Nieuwbeerta, Nagin, & Tollenaar, 2010).
Another way to create comparable groups of offenders who receive custodial and non-custodial penalties (other than random assignment) is to match offenders, using either variable-by-variable matching or propensity score matching (Rosenbaum & Rubin 1983; 1984). Kraus (1974) provides a good example of variable-by-variable matching. In this study, the first 50 consecutive entries from each of seven categories of offence were drawn from the probation register of the NSW Department of Child Welfare. Kraus then used the Child Welfare Department’s Institutional Index to match each one of the 350 probationers with a comparable offender who was committed to an institution during the same period (1962-63). The matching was done on date of birth, age at current sentence, type of
3
B U R E A U O F C R I M E S T A T I S T I C S A N D R E S E A R C H
current offence, age at time of first offence, number of previous offences, category of previous offences and number of previous committals to an institution. Offenders were followed up for five years. Recidivism was measured in terms of rate of offending and the number of episodes of imprisonment. Differences in recidivism between the two groups varied across offence type, but overall offenders who had served time in detention were more likely to re-offend than offenders who had been sentenced to probation.
The essence of propensity score matching is to match individuals in terms of their likelihood of receiving some treatment (e.g. prison). Outcomes (e.g. re-offending) are then compared among individuals who are near identical in their likelihood of receiving treatment but who differ in whether they actually received treatment. The matching studies reviewed by Nagin et al. (2009) report mixed, mostly non-significant effects of incarceration, but the overall balance of evidence, across both variable-by-variable and propensity score matching studies, suggests that prison has a criminogenic effect, increasing the risk of reoffending relative to non-custodial penalties.
Regression studies
Most studies examining the specific deterrent effect of penalties on recidivism use regression methods. Spohn and Holleran (2002) compared 776 convicted felony offenders given probation sentences with 301 felony offenders sentenced to prison. The study controlled for age, sex, race, employment and type of drug offender (convicted of a drug-related offence, convicted of a non-drug offence but with a history of drug abuse or drug offences, or other). In addition, they also modelled the offender’s probability of being sent to prison (based on variables relating to the seriousness and other characteristics of the offence, the offender’s prior criminal record, race, age, employment status and legal representation) and included this predicted probability as a predictor. The results of their study suggested that offenders who were given a prison sentence were more likely to re-offend and took less time to re-offend, even when the probability of being sent to prison was controlled for.
Nagin et al. (2009) found 31 regression studies measuring the impact of custodial sentences on recidivism, relative to a non-custodial penalty. Of these, there were 17 studies with at least one comparison in which prison had a significant criminogenic effect, and seven in which prison had at least one significant deterrent effect.
Other studies
Some studies do not fit neatly into the experimental, matching or regression study categories. For example, the study by Drago, Galbiati, and Vertova (2007) is best thought of as a natural experiment on the effect of the expected length of a
future penalty. They examined the effect of a bill passed by the Italian Parliament in July 2006. The Collective Clemency Bill was designed to address the overcrowding in Italian prisons and provided for a three-year reduction in detention for all inmates who had committed a crime before 2 May 2006. This resulted in the release of all those with a residual prison sentence of less than three years (some 22,000 inmates). Crucially for this study, the Bill stated that any former inmate who committed another crime within five years following their release from prison would be required to serve the residual sentence suspended by the pardon in addition to the prison time incurred as a result of the new offence.
The effect of the Bill was to create a situation where the sentence for any future offence effectively varied randomly across prisoners released from custody as a result of the pardon. For example, an individual who entered prison one year before the pardon with a three year sentence, might have served one year, and received a pardon for two years of custody, and would therefore serve an extra two years for any future offence plus whatever sentence was imposed for the new offence. An individual convicted of exactly the same offence and with exactly the same case particulars but who happened to enter prison a year before the first person would have served two years of their sentence and received a pardon for one year, and therefore only have one year to serve on top of any prison time for the new offence. The sentence for any future offence, therefore, was increased by some amount that depended only on when an offender entered custody for the last offence. When Drago et al. (2007) analysed the effect of this natural experiment, they found that each additional month in the expected sentence reduced the propensity to re-offend by 1.2%. The effect depended, however, on the time previously served in prison. The longer the time already spent in prison, the weaker the relationship between the residual sentence and recidivism.
Similarly, Helland and Tabarrok (2007) examined the effect of expected future penalty, in the context of California’s Three strikes and you’re out sentencing legislation (Proposition 184). Under this legislation, an offender with two “strikes” (convictions from a prescribed list of serious offences) who is convicted of another felony faces a prison sentence of 25 years to life and cannot be released prior to serving 80% of the 25-year term. An offender with only one conviction for a strikeable offence who commits another felony faces a doubling of the length of the new sentence and no prospect of release until 80% of the sentence is served.
Hellend and Tabarrok (2007) identified a group of criminals with two trials for strikeable offences, and compared those who were convicted of two strikeable offences with those who were convicted of one strikeable and one non-strikeable offence. They argued that because the factors that determine whether
4
B U R E A U O F C R I M E S T A T I S T I C S A N D R E S E A R C H
these defendants end up convicted of only one strikeable or two strikeable offences (strength of evidence, competence of prosecutor etc.) are effectively random in nature, the only systematic difference between the two groups was the penalty hanging over them for their next offence. To estimate the deterrent effect of the three-strikes sentencing legislation then, they compared the re-offending rate of offenders released after conviction for two strikeable offences with the re-offending rate of offenders released after two trials for strikeable offences but only one conviction for a strikeable offence. They found that California’s three-strike legislation reduced felony arrests among “two strike” offenders by 17-20%. No such effect was found in states that did not have three-strike sentencing legislation. This pattern of results suggests a deterrent effect of expected future imprisonment.
Studies since 2009
Studies published since the review by Nagin et al. (2009) paint a fairly similar picture. In a quasi-experimental study, Green and Winik (2010) exploited the fact that cases in the US District of Columbia Superior Court are randomly assigned to judges who happen to differ substantially among themselves in the severity of the sentences they impose. They found no difference in rates of recidivism between offenders given prison sentences and offenders who received probation.
Other studies have used matching to create comparable groups, often in combination with other analysis techniques. For example Werminck et al. (2010) used a combination of matching by variable and propensity score matching to create a sample of 2,123 pairs of offenders in the Netherlands who were sentenced to either imprisonment (up to 6 months) or community service (up to 240 hours), after not receiving either type of sentence previously. They found that recidivism was significantly higher for people who went to prison, and that the difference was still apparent after 8 years of follow-up.
In one English summary, the Ministry of Justice (2011) were able to use variable by variable matching techniques to create 6,822 pairs of people (one with a custody sentence of less than 12 months, and the other with a suspended sentence) who had exactly the same age, gender, ethnicity, number of previous offences and index offence type. Those who were released from prison were more likely to reoffend than those with a suspended sentence, with the difference being greater for people with more previous convictions.
Another study based on English data (Jolliffe & Hedderman, 2015) used propensity score matching to compare reoffending after either community service or release from prison onto probation. This was a sample of moderately serious offenders: the prison terms were all of >1 year, and after matching both groups had an average of around 3 previous episodes
of custody. There was no evidence of a deterrent effect of incarceration, as those released from prison were slightly but significantly more likely to reoffend, even though they spent less time at liberty during the observation period (as they were also more likely to be re-incarcerated).
Two Australian studies examining the specific deterrent effect of custodial penalties using matching techniques have also been published since the review by Nagin et al. (2009). The first (Lulham, Weatherburn, and Bartels, 2009) used propensity score matching to compare the risk of re-offending amongst a sample of adult offenders given a sentence of imprisonment the same risk among adult offenders given a suspended sentence of imprisonment. The second (Weatherburn, 2010) compared rates of re-offending among two groups of offenders; one of whom had received a custodial penalty and the other of which had not. This study used a combination of exact matching (on offence, prior prison, prior court appearances, number of concurrent offences and bail status) and statistical controls for other factors (gender, Indigenous status, prior breach of order, legal representation, plea and prior conviction for violence). Neither study found any evidence that custodial penalties reduce the risk of re-offending.
THE CURRENT STUDY
We follow Lulham et al. (2009) in using offenders given a suspended sentence of imprisonment as our comparison group. As noted earlier, the attraction of suspended sentences as a counterfactual is that under Section 12 of the NSW Sentencing Procedure Act, a court cannot impose a suspended sentence of imprisonment without having first decided that a full-time sentence of imprisonment is appropriate. Lulham et al. (2009), however, imposed no restrictions on the length of the prison terms among cases included in their treatment (prison) group. Since it seems unlikely that a court contemplating a substantial prison sentence would also be considering the possibility of suspending it (and to maximise the similarity between our treatment and comparison groups) we exclude any cases where the offender received a prison sentence of more than 12 months.
The current study seeks to improve on past Australian research in this area in two other ways. First, we include a wider range of controls. The two recent Australian studies described in the previous section, for example, only controlled for static risk factors, such as age, gender, race, offence and prior criminal record. They did not control for any dynamic risk factors, such as drug use or association with criminal peers. The current study controls for dynamic risk factors using the Level of Service Inventory-Revised (LSI-R), a widely used scale employed in correctional settings to measure the factors thought to underpin an individual’s offending behaviour (Andrews & Bonta, 1995). The LSI-R contains items measuring both static and dynamic risk factors. We also control for two other factors not included in

5
B U R E A U O F C R I M E S T A T I S T I C S A N D R E S E A R C H
earlier Australian analyses, both of which may influence risk of re-offending. The first is the offender’s socioeconomic status (as inferred from his or her postcode of residence), and the second is a measure of remoteness (ARIA) compiled by the Australian Bureau of Statistics (2011), which indicates access to services (including hospitals, shops, schools, and employment). Both of these are inferred from the offender’s postcode of residence. The power of propensity score matching methods to create equivalent groups is limited to the explanatory variables that are included in the model. Excluded or unmeasured factors can lead to hidden bias, in which the matched groups still differ in unobservable ways. Thus, the more factors available to describe aspects of the sample that may be relevant to the probability of being imprisoned or of reoffending, the better.
The second way in which this study improves on past research is that we focus on the first prison sentence. Since the shock of imprisonment (and the negative experiences associated with it) are likely to be more acute among those who have never been imprisoned before than among those who have been previously imprisoned, this gives us our best chance of seeing a specific deterrent effect if there is one. Offenders who have previously been imprisoned and who are now experiencing another episode of imprisonment may differ in systematic ways from those who have never previously been imprisoned. By focussing on the first prison sentence we limit the risk of any selection or spill-over effects from earlier prison sentences. In this regard this study goes further than Lulham et al. (2009). They looked separately at a sub-sample of people who had previously received a sentence of imprisonment, but, as well as those sentenced to prison, we also excluded anyone who had spent a total of more than 365 days in any form of custody prior to sentencing (including juvenile detention, remand and time in police cells). This might seem to allow in offenders with substantial prior experience of custody but much of the time spent prior to the index court appearance formed part of the current episode of imprisonment. In practice, as we show later, the periods spent in custody prior to the present custodial episode are actually very short, and similar across groups.
METHOD
DATA SOURCE
Data regarding court appearances from January 2008 to December 2010 were extracted from the Bureau’s Reoffending Database (ROD). Data in ROD is linked longitudinally by person (see Hua & Fitzgerald, 2006), and each record contains a summary of the person’s history of contact with the criminal justice system, including previous offending (since 1994) and previous time in custody (since 2000). In addition, we also linked records to a summary of the person’s subsequent offending (matters finalised up to 31 December 2013).
SAMPLE
The primary comparison was between people who were sentenced to a period of imprisonment, and those who received a suspended sentence, in a NSW Local Court, between 2008 and 2010. From the data set of index contacts between 2008 and 2010, we identified everyone with no previous recorded history of being sentenced to prison (or periodic detention), who on the index date was sentenced as an adult to either fulltime prison (with a total sentence of up to 12 months) or a suspended sentence with or without supervision (with a total sentence of up to 24 months) in a NSW Local Court. Only people who were able to be linked to outcome data were considered and only one event per person was included: if anyone had more than one eligible event, only the first was included. From these 15,388 people we excluded a further 345 (2.2%). Firstly, in order to sample adults who had not previously been to prison, we excluded anyone who was under 18 at the time of the offence (n= 30), who had a proven offence at the index date of breaching a custodial order (n = 212), or who had previously accumulated more than 365 days in custody (n = 101). Secondly, for data completeness purposes, we excluded anyone who had missing data for gender (n = 3) or for number of proven concurrent charges at index appearance (n = 2). The total sample (before matching) thus consisted of 15,043 people.
OUTCOME VARIABLE
The outcome variable was time until first re-offence. This was calculated as the number of free days from the index date until the next new offence that was proven in court (other than offences committed in custody or breach of justice procedure offences: these were not counted as new offences). Free days were those on which the person was not in custody. Thus, the observation period during which someone could reoffend started at either the index date or the first day following the index date on which the person left custody, and finished when the person reoffended, returned to custody, died, or on 31 December 2013, whichever happened first.
EXPLANATORY VARIABLES
Variables that were included in the propensity score matching regression model were those available in ROD that were thought to be related to whether the person received treatment (in this case, whether they got a prison sentence) as well as related to the outcome (re-offending). These variables included demographic information, the person’s previous criminal history, features of the index appearance, and LSI-R score (see Table 1), as described below.
Demographic variables
The demographic variables included were:
● Gender;
6
B U R E A U O F C R I M E S T A T I S T I C S A N D R E S E A R C H
● Age (age in years at the index date: categorised as 18-24 years, 25-34 years, 35-44 years or 45+ years);
● Indigenous status (whether the person had ever identified as Indigenous in any contact with ROD: categorised as Indigenous, not Indigenous, or unknown);
● Remoteness of postcode of residence (categorised as major city, more remote (including inner regional, outer regional, remote and very remote areas), or missing);
● Socio-economic disadvantage for postcode of residence (categorised as above or below the median level of disadvantage within the sample, or missing).
Prior criminal history
Details of each person’s previous contacts with the criminal justice system (as at the index date) that were included in the model were:
● Total number of previous court appearances (categorised into 0-5 vs. 6 or more);
● Whether or not the person had any previous suspended sentences (yes or no), or bonds (yes or no);
● Any previous proven offences of different types (each coded as yes or no): violence (Australian and New Zealand Society of Criminology (ANZSOC) divisions 01, 02, 03, 06), property (ANZSOC divisions 07, 08, 09), drugs (ANZSOC division 10), traffic (ANZSOC division 14), or breach of a court order (ANZSOC division 15);
● Number of previous recorded custody episodes, not including any episode that included the index date (a continuous predictor).
Characteristics of index finalisation
The characteristics of the index event included in the regression model were:
● Year (2008, 2009, or 2010);
● Number of proven concurrent charges (categorised as 0, 1, 2-3, or 4 or more);
● Guilty plea (coded as yes or no);
● Legal representation (coded as yes, no, or unrecorded);
● Any proven offence(s) of different types on the finalisation date (each coded as yes or no) with categories of: act intended to cause injury (ANZSOC division 02), sexual offence (ANZSOC division 03), theft (ANZSOC divisions 07 & 08), fraud (ANZSOC division 09), drugs (ANZSOC division 10), breach of a court order (ANZSOC division 15);
● Seriousness of the principal offence, as measured by BOCSAR’s posi_rank - a scale of severity in which smaller values indicated a more serious crime (a continuous predictor).
LSI-R score
If the person had received an LSI-R assessment up to 36 months before their index date or up to 3 months afterwards, the score was also included as a predictor (categorised as Low, Medium-Low, Medium, Medium-High/High), otherwise LSI-R was categorised as Missing. Where there was more than one assessment within this period, the score obtained closest to the index date was used.
STATISTICAL ANALYSIS
In the first step, a logistic regression model was created to calculate each person’s propensity score (the probability of being sentenced to prison rather than receiving a suspended sentence) based on all of the predictors described above. Each of the predictors described above was considered, and entered into a model which was used to calculate a propensity score for each person in both groups, which ranged from 0 (unlikely to be sentenced to prison) to 1 (very likely to be sentenced to prison). Next, we identified pairs of people across groups with a similar propensity score (as described below), and these pairs became the matched prison and suspended groups. Finally, we compared time to re-offend for the matched groups.
RESULTS
DESCRIPTION OF SAMPLE
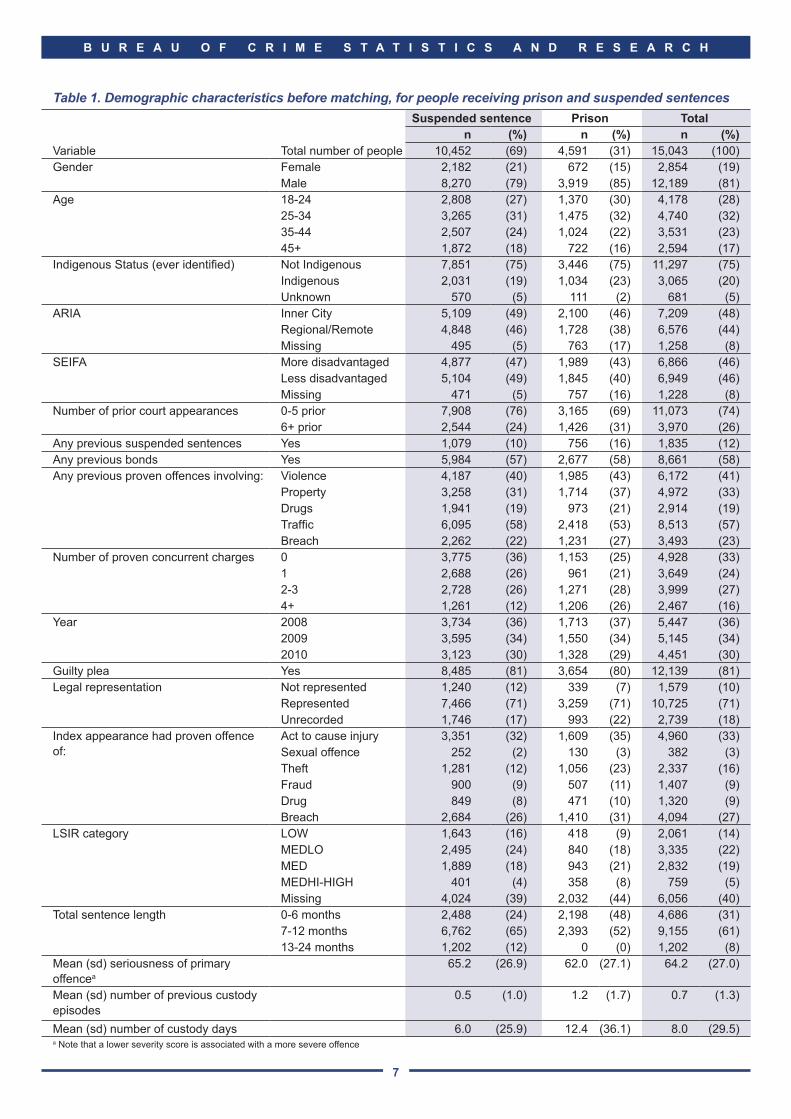
The characteristics of the sample before matching are shown in Table 1, separately for people who received prison and suspended sentences. Variables were inspected and then categorised to ensure that each level contained a reasonable number of observations. Overall, most variables were complete, but there were a few with substantial proportions of unknown or missing values: these were Indigenous status (with 5% unknown), ARIA and SEIFA (both 8% missing, legal representation (18% not recorded), and LSIR (40% with no valid score). There were tendencies for those people sentenced to prison to be more likely to be male, younger, Indigenous, and to have missing disadvantage and remoteness information, more prior court appearances and previous suspended sentences, concurrent charges at the index appearance, higher LSIR scores, and more previous days in custody.
For the Propensity Score Matching to identify matched pairs of people in each group, we used one-to-one nearest neighbour matching without replacement, performed using SAS Enterprise Guide Version 7.1. For each person in the imprisoned group, the person in the suspended sentence group with the most similar
7
B U R E A U O F C R I M E S T A T I S T I C S A N D R E S E A R C H
Table 1. Demographic characteristics before matching, for people receiving prison and suspended sentencesSuspended sentence Prison Total
n (%) n (%) n (%)Variable Total number of people 10,452 (69) 4,591 (31) 15,043 (100)Gender Female 2,182 (21) 672 (15) 2,854 (19)
Male 8,270 (79) 3,919 (85) 12,189 (81)Age 18-24 2,808 (27) 1,370 (30) 4,178 (28)
25-34 3,265 (31) 1,475 (32) 4,740 (32)35-44 2,507 (24) 1,024 (22) 3,531 (23)45+ 1,872 (18) 722 (16) 2,594 (17)
Indigenous Status (ever identified) Not Indigenous 7,851 (75) 3,446 (75) 11,297 (75)Indigenous 2,031 (19) 1,034 (23) 3,065 (20)Unknown 570 (5) 111 (2) 681 (5)
ARIA Inner City 5,109 (49) 2,100 (46) 7,209 (48)Regional/Remote 4,848 (46) 1,728 (38) 6,576 (44)Missing 495 (5) 763 (17) 1,258 (8)
SEIFA More disadvantaged 4,877 (47) 1,989 (43) 6,866 (46)Less disadvantaged 5,104 (49) 1,845 (40) 6,949 (46)Missing 471 (5) 757 (16) 1,228 (8)
Number of prior court appearances 0-5 prior 7,908 (76) 3,165 (69) 11,073 (74)6+ prior 2,544 (24) 1,426 (31) 3,970 (26)
Any previous suspended sentences Yes 1,079 (10) 756 (16) 1,835 (12)Any previous bonds Yes 5,984 (57) 2,677 (58) 8,661 (58)Any previous proven offences involving: Violence 4,187 (40) 1,985 (43) 6,172 (41)
Property 3,258 (31) 1,714 (37) 4,972 (33)Drugs 1,941 (19) 973 (21) 2,914 (19)Traffic 6,095 (58) 2,418 (53) 8,513 (57)Breach 2,262 (22) 1,231 (27) 3,493 (23)
Number of proven concurrent charges 0 3,775 (36) 1,153 (25) 4,928 (33)1 2,688 (26) 961 (21) 3,649 (24)2-3 2,728 (26) 1,271 (28) 3,999 (27)4+ 1,261 (12) 1,206 (26) 2,467 (16)
Year 2008 3,734 (36) 1,713 (37) 5,447 (36)2009 3,595 (34) 1,550 (34) 5,145 (34)2010 3,123 (30) 1,328 (29) 4,451 (30)
Guilty plea Yes 8,485 (81) 3,654 (80) 12,139 (81)Legal representation Not represented 1,240 (12) 339 (7) 1,579 (10)
Represented 7,466 (71) 3,259 (71) 10,725 (71)Unrecorded 1,746 (17) 993 (22) 2,739 (18)
Index appearance had proven offence of:
Act to cause injury 3,351 (32) 1,609 (35) 4,960 (33)Sexual offence 252 (2) 130 (3) 382 (3)Theft 1,281 (12) 1,056 (23) 2,337 (16)Fraud 900 (9) 507 (11) 1,407 (9)Drug 849 (8) 471 (10) 1,320 (9)Breach 2,684 (26) 1,410 (31) 4,094 (27)
LSIR category LOW 1,643 (16) 418 (9) 2,061 (14)MEDLO 2,495 (24) 840 (18) 3,335 (22)MED 1,889 (18) 943 (21) 2,832 (19)MEDHI-HIGH 401 (4) 358 (8) 759 (5)Missing 4,024 (39) 2,032 (44) 6,056 (40)
Total sentence length 0-6 months 2,488 (24) 2,198 (48) 4,686 (31)7-12 months 6,762 (65) 2,393 (52) 9,155 (61)13-24 months 1,202 (12) 0 (0) 1,202 (8)
Mean (sd) seriousness of primary offencea
65.2 (26.9) 62.0 (27.1) 64.2 (27.0)
Mean (sd) number of previous custody episodes
0.5 (1.0) 1.2 (1.7) 0.7 (1.3)
Mean (sd) number of custody days 6.0 (25.9) 12.4 (36.1) 8.0 (29.5)a Note that a lower severity score is associated with a more severe offence

8
B U R E A U O F C R I M E S T A T I S T I C S A N D R E S E A R C H
probability was selected as a matching control. Matching was sequential in a single pass, with both groups first sorted into a random order. A calliper of 0.01 meant that someone was only considered as a potential match if their propensity score was within +/- 0.01 of the imprisoned person’s score. Matching without replacement meant that each person in the suspended group was selected as a match only once. Of the 4,591 people in prison group, 86% (n = 3,960) were able to be matched to someone in the suspended sentence group (see Figure 1).
Equivalence between the two matched groups was assessed in three ways. Rosenbaum and Rubin’s (1985) Standardised Bias estimates were calculated for each variable, before and after matching (see Table A1 in the Appendix). The Standardised Bias is calculated by dividing the difference between group means by the pre-matching pooled variance: absolute values greater than 20 indicate a high level of bias. In addition, average values of each predictor were calculated before and after matching, and t-tests were used to estimate the statistical significance of differences between the average values of the two groups (Table A1). Averages are mostly between 0 and 1, as levels of categorical predictors were coded as dummy variables. Finally, the percentage point difference between the two groups was calculated before and after matching (see Figure 2). All three
2500 2000 1500 1000 500 0 500 1000 1500 2000 2500
0.05
0.15
0.25
0.35
0.45
0.55
0.65
0.75
0.85
0.95
Number of cases at each interval of the propensity score
Prop
ensi
ty to
rece
ive
a pr
ison
sen
tenc
e
Matched suspended, n = 3,960
Matched prison, n = 3,960
Unmatched suspended, n = 6,492
Unmatched prison, n = 631
Suspended sentence group Prison group
Figure 1. Propensity scores of people in suspended (left) and prison (right) groups who were (darker) and were not (lighter) able to be matched
measures indicated that the matching process successfully created groups with similar levels of all of the covariates used. After matching, all individual Standardised Bias estimates were below 3.6, and the combination of all covariates did not predict sentence type (LR χ2 = 25.7; p >0.995).
CENSORING
The proportion of people who died during the follow-up period was fairly similar across groups. For the unmatched groups, 148 (1.4%) of the people with a suspended sentence and 54 (1.2%) of those with a prison sentence died: in the matched groups the numbers of deaths were 55 (1.4%) and 47 (1.2%) respectively. However, more of the people with prison sentences returned to custody (without being charged with a new offence) than people with a suspended sentence (523 (11.4%) and 535 (5.1%) for the prison and suspended sentence respectively in the unmatched samples, and 438 (11.1%) and 226 (6.6%) in the matched samples). Although we did not use time in custody as a matching variable, the group means for “days in custody before the current custody episode” were more similar after matching (with a mean of 11.5 days and a standard deviation of 36.2 days for suspended sentences and 9.1 (30.2) days for prison sentences) than before matching (see Table 1).

9
B U R E A U O F C R I M E S T A T I S T I C S A N D R E S E A R C H
-15 -10 -5 0 5 10 15
Age (18-24)Age (25-34)Age (35-44)
Age (45+)ARIA (Inner City)
ARIA (Regional/Remote)ARIA (missing)
Concurrent proven (0)Concurrent proven (1)
Concurrent proven (2-3)Concurrent proven (4+)
Gender (male)Year (2008)Year (2009)Year (2010)
Index offence (cause injury)Index offence (breach)
Index offence (drug)Index offence (fraud)
Index offence (sexual assault)Index offence (theft)
Indigenous status (no)Indigenous status (yes)
Indigenous status (unknown)Legal representation (no)
Legal representation (yes)Legal representation (unrecorded)
LSIR (Low)LSIR (Med-Low)
LSIR (Med)LSIR (MedHigh-High)
LSIR (Missing)Previous bond (yes)
Previous proven breach offencePrevious court appearances (6+)
Previous proven drug offencePrevious proven cause injury offence
Previous proven property offencePrevious suspended sentence (yes)
Previous proven traffic offencePrevious proven violent offence
Pleaded guilty (yes)SEIFA (more disadvantaged)SEIFA (less disadvantaged)
SEIFA (missing)
Percentage point differencebetween suspended and prison
groups before matching
Before Matching
Figure 2. Percentage point differences between suspended and prison groups for categorical variables, before (left) and after matching (right)
-5 0 5
Percentage point differencebetween suspended and prison
groups after matching
After Matching
<< more in suspended group
more in prisongroup >>
<< more in suspended group
more in prisongroup >>
10
B U R E A U O F C R I M E S T A T I S T I C S A N D R E S E A R C H
SURVIVAL ANALYSIS
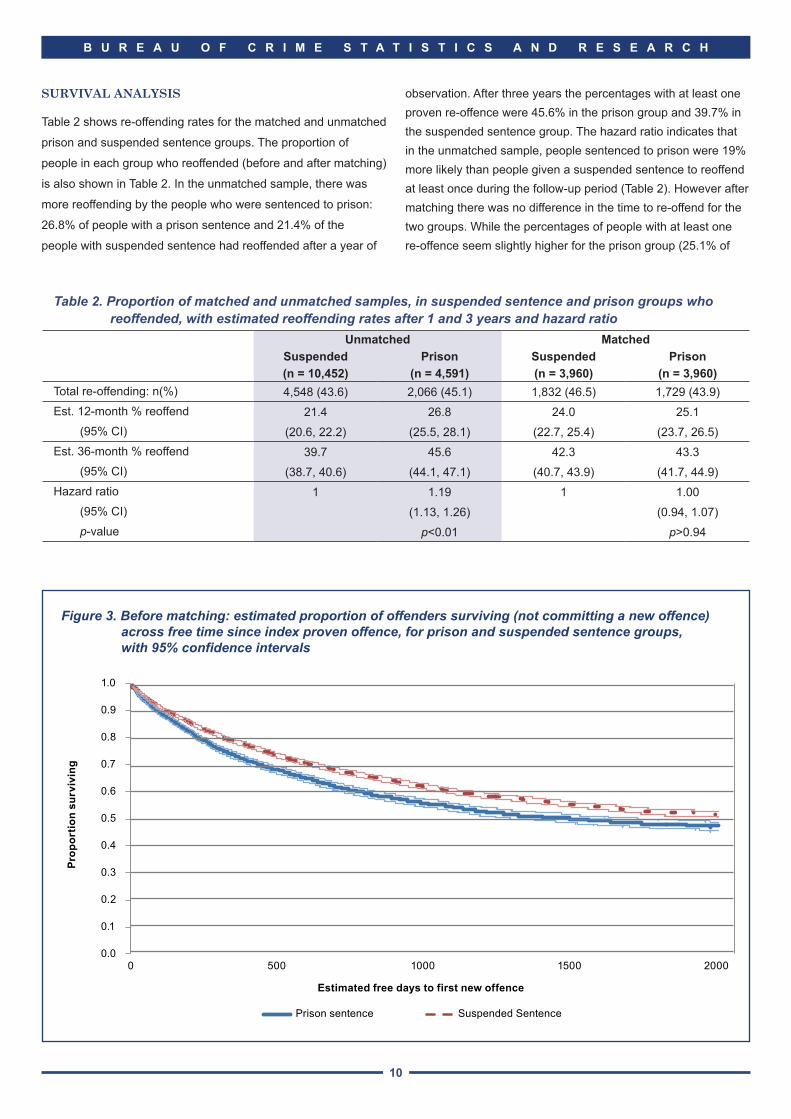
Table 2 shows re-offending rates for the matched and unmatched
prison and suspended sentence groups. The proportion of
people in each group who reoffended (before and after matching)
is also shown in Table 2. In the unmatched sample, there was
more reoffending by the people who were sentenced to prison:
26.8% of people with a prison sentence and 21.4% of the
people with suspended sentence had reoffended after a year of
Figure 3. Before matching: estimated proportion of offenders surviving (not committing a new offence) across free time since index proven offence, for prison and suspended sentence groups, with 95% confidence intervals
0.0
0.1
0.2
0.3
0.4
0.5
0.6
0.7
0.8
0.9
1.0
0 500 1000 1500 2000
Prop
ortio
n su
rviv
ing
Estimated free days to first new offence
Prison sentence Suspended Sentence
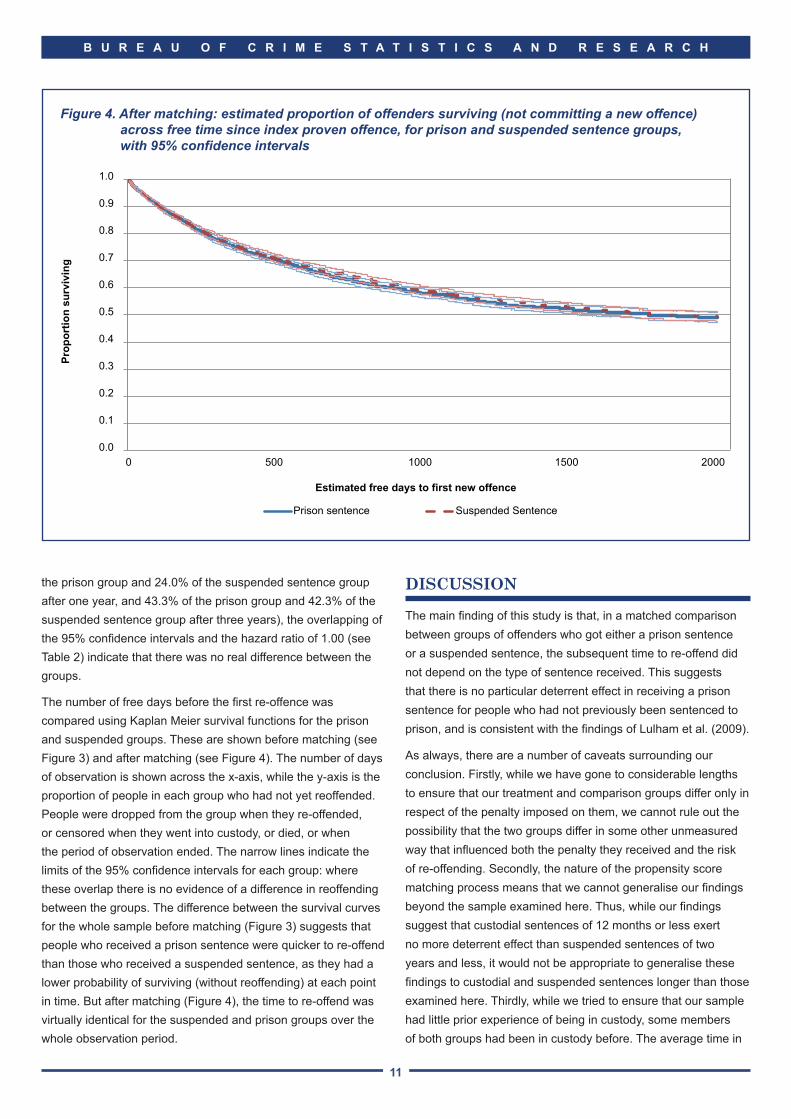
observation. After three years the percentages with at least one proven re-offence were 45.6% in the prison group and 39.7% in the suspended sentence group. The hazard ratio indicates that in the unmatched sample, people sentenced to prison were 19% more likely than people given a suspended sentence to reoffend at least once during the follow-up period (Table 2). However after matching there was no difference in the time to re-offend for the two groups. While the percentages of people with at least one re-offence seem slightly higher for the prison group (25.1% of
Table 2. Proportion of matched and unmatched samples, in suspended sentence and prison groups who reoffended, with estimated reoffending rates after 1 and 3 years and hazard ratio
Unmatched MatchedSuspended Prison Suspended Prison(n = 10,452) (n = 4,591) (n = 3,960) (n = 3,960)
Total re-offending: n(%) 4,548 (43.6) 2,066 (45.1) 1,832 (46.5) 1,729 (43.9)Est. 12-month % reoffend 21.4 26.8 24.0 25.1
(95% CI) (20.6, 22.2) (25.5, 28.1) (22.7, 25.4) (23.7, 26.5)Est. 36-month % reoffend 39.7 45.6 42.3 43.3
(95% CI) (38.7, 40.6) (44.1, 47.1) (40.7, 43.9) (41.7, 44.9)Hazard ratio 1 1.19 1 1.00
(95% CI) (1.13, 1.26) (0.94, 1.07)p-value p<0.01 p>0.94
11
B U R E A U O F C R I M E S T A T I S T I C S A N D R E S E A R C H
Figure 4. After matching: estimated proportion of offenders surviving (not committing a new offence) across free time since index proven offence, for prison and suspended sentence groups, with 95% confidence intervals
0.0
0.1
0.2
0.3
0.4
0.5
0.6
0.7
0.8
0.9
1.0
0 500 1000 1500 2000
Prop
ortio
n su
rviv
ing
Estimated free days to first new offence
Prison sentence Suspended Sentence
the prison group and 24.0% of the suspended sentence group after one year, and 43.3% of the prison group and 42.3% of the suspended sentence group after three years), the overlapping of the 95% confidence intervals and the hazard ratio of 1.00 (see Table 2) indicate that there was no real difference between the groups.
The number of free days before the first re-offence was compared using Kaplan Meier survival functions for the prison and suspended groups. These are shown before matching (see Figure 3) and after matching (see Figure 4). The number of days of observation is shown across the x-axis, while the y-axis is the proportion of people in each group who had not yet reoffended. People were dropped from the group when they re-offended, or censored when they went into custody, or died, or when the period of observation ended. The narrow lines indicate the limits of the 95% confidence intervals for each group: where these overlap there is no evidence of a difference in reoffending between the groups. The difference between the survival curves for the whole sample before matching (Figure 3) suggests that people who received a prison sentence were quicker to re-offend than those who received a suspended sentence, as they had a lower probability of surviving (without reoffending) at each point in time. But after matching (Figure 4), the time to re-offend was virtually identical for the suspended and prison groups over the whole observation period.
DISCUSSION
The main finding of this study is that, in a matched comparison between groups of offenders who got either a prison sentence or a suspended sentence, the subsequent time to re-offend did not depend on the type of sentence received. This suggests that there is no particular deterrent effect in receiving a prison sentence for people who had not previously been sentenced to prison, and is consistent with the findings of Lulham et al. (2009).
As always, there are a number of caveats surrounding our conclusion. Firstly, while we have gone to considerable lengths to ensure that our treatment and comparison groups differ only in respect of the penalty imposed on them, we cannot rule out the possibility that the two groups differ in some other unmeasured way that influenced both the penalty they received and the risk of re-offending. Secondly, the nature of the propensity score matching process means that we cannot generalise our findings beyond the sample examined here. Thus, while our findings suggest that custodial sentences of 12 months or less exert no more deterrent effect than suspended sentences of two years and less, it would not be appropriate to generalise these findings to custodial and suspended sentences longer than those examined here. Thirdly, while we tried to ensure that our sample had little prior experience of being in custody, some members of both groups had been in custody before. The average time in
12
B U R E A U O F C R I M E S T A T I S T I C S A N D R E S E A R C H
custody prior to the current episode of imprisonment was quite short (with means of 9.1 and 11.5 days for our matched prison and suspended sentence samples respectively) but even a brief prior stint in custody may be enough to blunt its deterrent effects.
Other matching studies have found that people released from prison offend at a higher rate than those with suspended (Ministry of Justice, 2011) or community sentences (Jolliffe & Hedderman, 2015). However in both these studies the differences were greater for offenders with longer criminal histories, which is consistent with our finding of no difference between groups, in a sample of people with no previous custodial sentence.
From a practical point of view our findings suggest that sentencing courts contemplating imposing a suspended sentence of up to two years instead of full-time custody of 12 months (or less) need not be concerned about the possibility that imposing a suspended sentence will put the public at greater risk. Our findings have important public policy implications as well. Prison is by far the most expensive sanction in the crime control toolkit. Australian State and Territory Governments spend more than $2 billion annually, keeping offenders in secure custody. In the financial year 2013/14, real net operating expenditure (which excludes capital costs and payroll tax) per prisoner per day was $219.00 (Steering Committee for the Review of Government Service Provision, 2015). By comparison, real net operating expenditure per day for an offender supervised in the community was $21.64. In other words, it costs about 10 times more to keep an offender in prison for a day than to keep an offender on some form of community corrections order.
The expenditure may well be justified in the case of offenders who are dangerous and or who are serving long (e.g. more than 12 month) sentences. Even if such sentences have no deterrent effect, it can be argued they have an incapacitation effect. A large proportion of prisoners, however, are not serving long sentences. About one in six sentenced prisoners in Australia (one in five Indigenous prisoners), are serving sentences of less than 12 months (Australian Bureau of Statistics, 2015). In 2014, the bulk (69%) of these offenders had a non-violent offence as their principal offence. Thirty-five percent were serving prison sentences for breaching court orders (Australian Bureau of Statistics, 2015). We have already seen evidence that sentences of 12 months or less exert no specific deterrent effect. Short sentences, by definition, exert little incapacitation effect. In such circumstances it is hard to see short prison sentences as a cost effective response to crime, especially when there is such an array of non-custodial programs that are known to be less expensive than prison (Aos, Miller & Drake, 2006). Halving the number of prisoners serving sentences of less than 12 months and placing them on community correction orders would save around $147 million1 in annual recurrent expenditure on
corrections. This is money that could then be redirected into creating more effective rehabilitation and post release support programs.
ACKNOWLEDGEMENTS
We would like to express our gratitude to Suzanne Poynton for providing feedback on an earlier draft of this report, to both external reviewers for several helpful comments and to Florence Sin for desktop publishing this report.
NOTES
1. The figure is calculated as follows: the last Australian Prison Census (Australian Bureau of Statistics, 2015) shows that a total of 4081 prisoners in Australia were serving sentences of less than 12 months. Assume we divert half this number (2041) to community corrections. As noted in the introduction, the average daily recurrent cost per prisoner is $219.00. This gives (2041 x 219 x 365 =) $163,147,335 as the fall in expenditure on prisoner serving sentences of less than 12 months. The fall is offset by the cost of placing these prisoners on a community corrections sanction. The average daily recurrent cost of keeping an offender on community corrections is (again as noted in the introduction), $21.64. Following the same procedure we arrive at $16,121,043 as the additional cost associated with community corrections. This yields a net saving of $147,026,292.

13
B U R E A U O F C R I M E S T A T I S T I C S A N D R E S E A R C H
REFERENCES
Andrews, D. & Bonta, J. (1995). The Level of Service Inventory - Revised. Toronto: Multi-Health Systems.
Aos, S., Miller, M., & Drake, E. (2006), Evidence-Based Public Policy Options to Reduce Future Prison Construction, Criminal Justice Costs, and Crime Rates. Olympia: Washington, State Institute for Public Policy.
Australian Bureau of Statistics (2011). Australian Standard Geographical Classification. Catalogue No. 1216.0. Canberra: Australian Bureau of Statistics.
Australian Bureau of Statistics (2015). Prisoners in Australia 2014. Catalogue No. 4517.0. Canberra: Australian Bureau of Statistics.
Barton, W. & Butts J.A. (1990). Viable options: intensive supervision programs for juvenile delinquents, Crime and Delinquency, 36(2): 238-256.
Drago, F., Galbiati, R., & Vertova, P. (2007). The deterrent effects of prison: evidence from a Natural Experiment, IZA Discussion Paper 2912, Bonn, Germany.
Green, D. & Winik, D. (2010). Using random judge assignments to estimate the effects of incarceration and probation on recidivism among drug offenders. Criminology, (48(2): 357-387.
Helland, E. & Tabarrok, A. (2007). Does Three Strikes Deter? A Nonparametric Estimation, Journal of Human Resources, 42: 309-330.
Hua, J. & Fitzgerald, J. (2006). Matching court records to measure reoffending. Crime and Justice Bulletin 95. Sydney: NSW Bureau of Crime Statistics and Research.
Jolliffe, D., & Hedderman, C. (2015). Investigating the impact of custody on reoffending using propensity score matching. Crime & Delinquency, 61 (8): 1051-1077.
Killias, M., Aebi, M., & Ribeaud, D. (2000) Does community service rehabilitate better than short-term imprisonment? Howard Journal of Criminal Justice. 39: 40-57.
Kraus, J. (1974). A comparison of corrective effects of probation and detention on male juvenile offenders, British Journal of Criminology, 49: 49-62.
Lulham, R., Weatherburn, D., & Bartels, l. (2009). The recidivism of offenders given suspended sentences: A comparison with full-time imprisonment. Crime and Justice Bulletin, 136. Sydney: NSW Bureau of Crime Statistics and Research.
Ministry of Justice. (2011). Compendium of reoffending statistics and analysis. London, England.
Nagin, D., Cullen, F., & Jonson, C. (2009). Imprisonment and re-offending. In M. Tonry, (ed), Crime and Justice: An Annual Review of Research (vol. 38), Chicago: University of Chicago Press: 115-200.
Rosenbaum, P. & Rubin, D. (1983). The central role of the propensity score in observational studies for causal effects, Biometrika, 70(1): 41-55.
Rosenbaum, P. & Rubin, D. (1984). Reducing bias in observational studies using sub-classification on the propensity score. Journal of the American Statistical Association, 79: 516-524.
Rosenbaum, P. & Rubin, D. (1985). Constructing a control group using multivariate matched sampling methods that incorporate the propensity score, American Statistician, 39(1): 33-38.
Schneider, A. (1986). Restitution and recidivism rates of juvenile offenders: Results from four experimental studies, Criminology, 24(3): 533-552.
Schnepel, K. (2015). Labor Market Opportunities and Crime. Paper presented at the Conference on Applied Research in Crime and Justice, 19th February. Dockside Convention Centre. Sydney.
Spohn, C. & Holleran, D. (2002). The effect of imprisonment on recidivism rates of felony offenders: A focus on drug offenders, Criminology, 40: 329-358.
Steering Committee for the Review of Government Service Provision. (2015). Report on Government Services 2015, vol. C, Justice, Productivity Commission, Canberra.
Villettaz, P., Killias, M., & Zoder, I. (2006). The effects of custodial vs non-custodial sentences on re-offending, Report to the Campbell Collaboration Crime and Justice Group, Institute of Criminology and Criminal Law, University of Lausanne, Switzerland.
Wan, W., Poynton, S., & Weatherburn, D. (2015). Does parole supervision reduce the risk of re-offending? Australian & New Zealand Journal of Criminology, first published on May 21, 2015 as doi:10.1177/0004865815585393.
Weatherburn, D. (2010). The effect of prison on adult re-offending. Crime and Justice Bulletin 143. Sydney: NSW Bureau of Crime Statistics and Research.
Werminck, H., Blokland, A., Nieuwbeerta, P., Nagin, D., & Tollenaar, N. (2010) Comparing the effects of community service and short-term imprisonment on recidivism: a matched samples approach. Journal of Experimental Criminology 6: 325-349.

14
B U R E A U O F C R I M E S T A T I S T I C S A N D R E S E A R C H
APPENDIX
Table A1. Standardised bias and t-test comparisons of predictors in suspended and prison groups, before and after matching
Covariate
Before matching After matchingSuspended
MeanPrison Mean
t-test p<0.05
Std Bias
|Bias| >20
Suspended Mean
Prison Mean
t-test p<0.05
Std Bias
|Bias| >20
(n=10,452) (n=4,591) (n=3,960) (n=3,960)Age (18-24) 0.27 0.30 * -7 0 0.28 0.29 n/s -2 0Age (25-34) 0.31 0.32 n/s -2 0 0.31 0.31 n/s 0 0Age (35-44) 0.24 0.22 * 4 0 0.23 0.23 n/s 0 0Age 45+ 0.18 0.16 * 6 0 0.17 0.17 n/s 2 0ARIA (inner city) 0.49 0.46 * 6 0 0.48 0.48 n/s 1 0ARIA (more remote) 0.46 0.38 * 18 0 0.41 0.41 n/s -1 0ARIA (missing) 0.05 0.17 * -39 1 0.11 0.11 n/s 1 00 concurrent charges 0.36 0.25 * 24 1 0.28 0.28 n/s 0 01 concurrent charge 0.26 0.21 * 11 0 0.23 0.22 n/s 1 02-3 concurrent charges 0.26 0.28 * -4 0 0.27 0.28 n/s -3 04+ concurrent charge 0.12 0.26 * -37 1 0.22 0.22 n/s 2 0Gender (male) 0.79 0.85 * -16 0 0.86 0.85 n/s 2 0Index year (2008) 0.36 0.37 n/s -3 0 0.35 0.36 n/s -2 0Index year (2009) 0.34 0.34 n/s 1 0 0.34 0.34 n/s 1 0Index year (2010) 0.30 0.29 n/s 2 0 0.31 0.30 n/s 2 0Acts causing injury index 0.32 0.35 * -6 0 0.34 0.35 n/s -1 0Breach index 0.26 0.31 * -11 0 0.29 0.29 n/s 0 0Drug index 0.08 0.10 * -7 0 0.09 0.10 n/s -2 0Fraud index 0.09 0.11 * -8 0 0.10 0.10 n/s -2 0Sexual assault index 0.02 0.03 n/s -3 0 0.03 0.03 n/s 2 0Theft index 0.12 0.23 * -28 1 0.19 0.19 n/s -1 0Indigenous (no) 0.75 0.75 n/s 0 0 0.76 0.76 n/s 1 0Indigenous (yes) 0.19 0.23 * -8 0 0.21 0.21 n/s -1 0Indigenous (unknown) 0.05 0.02 * 16 0 0.03 0.03 n/s 0 0Legal representation (no) 0.12 0.07 * 15 0 0.08 0.08 n/s 0 0Legal representation (yes) 0.71 0.71 n/s 1 0 0.70 0.70 n/s 0 0Legal representation (not recorded) 0.17 0.22 * -13 0 0.21 0.21 n/s 0 0LSIR (low) 0.16 0.09 * 20 1 0.11 0.10 n/s 1 0LSIR (med-low) 0.24 0.18 * 14 0 0.20 0.20 n/s 1 0LSIR (med) 0.18 0.21 * -6 0 0.20 0.20 n/s -1 0LSIR (med-high to high) 0.04 0.08 * -17 0 0.07 0.06 n/s 1 0LSIR (missing) 0.38 0.44 * -12 0 0.43 0.43 n/s -1 0Previous bonds (yes) 0.57 0.58 n/s -2 0 0.58 0.58 n/s 0 0Previous proven breach offence (yes) 0.22 0.27 * -12 0 0.27 0.25 n/s 2 0Previous court appearances (6+) 0.24 0.31 * -15 0 0.30 0.29 n/s 1 0Previous proven drug offence (yes) 0.19 0.21 * -7 0 0.20 0.20 n/s 0 0Previous proven injury offence (yes) 0.39 0.42 * -6 0 0.40 0.41 n/s -1 0Previous proven property offence(yes) 0.31 0.37 * -13 0 0.36 0.35 n/s 1 0Previous suspended sentence (yes) 0.10 0.16 * -18 0 0.16 0.15 n/s 3 0Previous proven traffic offence (yes) 0.58 0.53 * 11 0 0.54 0.54 n/s 1 0Previous proven violent (yes) 0.40 0.43 * -6 0 0.42 0.42 n/s -1 0Guilty plea (yes) 0.81 0.80 * 4 0 0.80 0.79 n/s 1 0Severity of principal offence a 65.17 62.00 * 12 0 63.36 62.40 n/s 4 0Number of previous custody episodes 0.49 1.20 * -51 1 0.91 0.93 n/s -2 0SEIFA (less deprived) 0.47 0.43 * 7 0 0.46 0.45 n/s 1 0SEIFA (more deprived) 0.49 0.40 * 17 0 0.43 0.44 n/s -2 0SEIFA (missing) 0.05 0.16 * -40 1 0.11 0.10 n/s 1 0Total number of differences between prison and suspended groups
39/47 7/47 0/47 0/47
a Note that a lower severity score is associated with a more severe offence

15
B U R E A U O F C R I M E S T A T I S T I C S A N D R E S E A R C H
Other titles in this seriesNo.186 The impact of the NSW Intensive Supervision Program on recidivism
No.185 That’s entertainment: Trends in late-night assaults and acute alcohol illness in Sydney's Entertainment Precinct
No.184 Trial court delay and the NSW District Criminal Court
No.183 Lockouts and Last Drinks
No.182 Public confidence in the New South Wales criminal justice system: 2014 update
No.181 The effect of liquor licence concentrations in local areas on rates of assault in New South Wales
No.180 Understanding fraud: The nature of fraud offences recorded by NSW Police
No.179 Have New South Wales criminal courts become more lenient in the past 20 years?
No.178 Re-offending on parole
No.177 Understanding the relationship between crime victimisation and mental health: A longitudinal analysis of population data
No.176 The impact of intensive correction orders on re-offending
No.175 Measuring recidivism: Police versus court data
No.174 Forecasting prison populations using sentencing and arrest data
No.173 Youths in custody in NSW: Aspirations and strategies for the future
No.172 Rates of recidivism among offenders referred to Forum Sentencing
No.171 Community Service Orders and Bonds: A Comparison of Reoffending
No.170 Participant Satisfaction with youth Justice Conferencing
No.169 Does CREDIT reduce the risk of re-offending?
No.168 Personal stress, financial stress, social support and women’s experiences of physical violence: A longitudinal analysis
No.167 Police use of court alternatives for young persons in NSW
No.166 The impact of the Young Offenders Act on likelihood of custodial order
No.165 Public confidence in the New South Wales criminal justice system: 2012 update
No.164 Youth Justice Conferencing versus the Children’s Court: A comparison of cost effectiveness
No.163 Intensive correction orders vs other sentencing options: offender profiles
No.162 Young adults’ experience of responsible service of alcohol in NSW: 2011 update
No.161 Apprehended Personal Violence Orders – A survey of NSW magistrates and registrars
No.160 Youth Justice Conferences versus Children's Court: A comparison of re-offending
No.159 NSW Court Referral of Eligible Defendants into Treatment (CREDIT) pilot program: An evaluation
B U R E A U O F C R I M E S T A T I S T I C S A N D R E S E A R C H
NSW Bureau of Crime Statistics and Research - Level 1, Henry Deane Building, 20 Lee Street, Sydney 2000 [email protected] • www.bocsar.nsw.gov.au • Ph: (02) 8346 1100 • Fax: (02) 8346 1298
ISSN 1030-1046 (Print) ISSN 2204-5538 (Online) • ISBN 978-1-925343-08-3 © State of New South Wales through the Department of Justice 2015. You may copy, distribute, display, download and otherwise freely deal with this work for any
purpose, provided that you attribute the Department of Justice as the owner. However, you must obtain permission if you wish to (a) charge others for access to the work (other than at cost), (b) include the work in advertising or a product for sale, or (c) modify the work.
No.158 The effect of arrest and imprisonment on crime
No.157 lllicit drug use and property offending among police detainees
No.156 Evaluation of the Local Court Process Reforms (LCPR)
No.155 The Domestic Violence Intervention Court Model: A follow-up study
No.154 Improving the efficiency and effectiveness of the risk/needs assessment process for community-based offenders
No.153 Uses and abuses of crime statistics
No.152 Interim findings from a randomised trial of intensive judicial supervision on NSW Drug Court
No.151 Personal stress, financial stress and violence against women
No.150 The relationship between police arrests and correctional workload
No.149 Screening cautioned young people for further assessment and intervention
No.148 Modelling supply rates of high-strengh oxycodone across New South Wales
No.147 The association between alcohol outlet density and assaults on and around licensed premises
No.146 Why is the NSW juvenile reconviction rate higher than expected?
No.145 Why does NSW have a higher imprisonment rate than Victoria?
No.144 Legally coerced treatment for drug using offenders: ethical and policy issues
No.143 The effect of prison on adult re-offending
No.142 Measuring offence seriousness
No.141 Change in offence seriousness across early criminal careers
No.140 Mental health disorders and re-offending among NSW prisoners
No.139 What do police data tell us about criminal methods of obtaining prescription drugs?
No.138 Prison populations and correctional outlays: The effect of reducing re-imprisonment
No.137 The impact of restricted alcohol availability on alcohol-related violence in Newcastle, NSW
No.136 The recidivism of offenders given suspended sentences
No.135 Drink driving and recidivism in NSW
No.134 How do methamphetamine users respond to changes in methamphetamine price?
No.133 Policy and program evaluation: recommendations for criminal justice policy analysts and advisors
No.132 The specific deterrent effect of custodial penalties on juvenile re-offending
No.131 The Magistrates Early Referral Into Treatment Program
No.130 Rates of participation in burglary and motor vehicle theft
No.129 Does Forum Sentencing reduce re-offending?
No.128 Recent trends in legal proceedings for breach of bail, juvenile remand and crime