crime and corrections - virginiasfc.virginia.gov › pdf › retreat › 2011 retreat ›...
TRANSCRIPT
SENATE FINANCE COMMITTEE
SENATE OF VIRGINIA
Senate Finance Committee
November 18, 2011
Crime and Corrections
SENATE FINANCE COMMITTEE
Overview
2
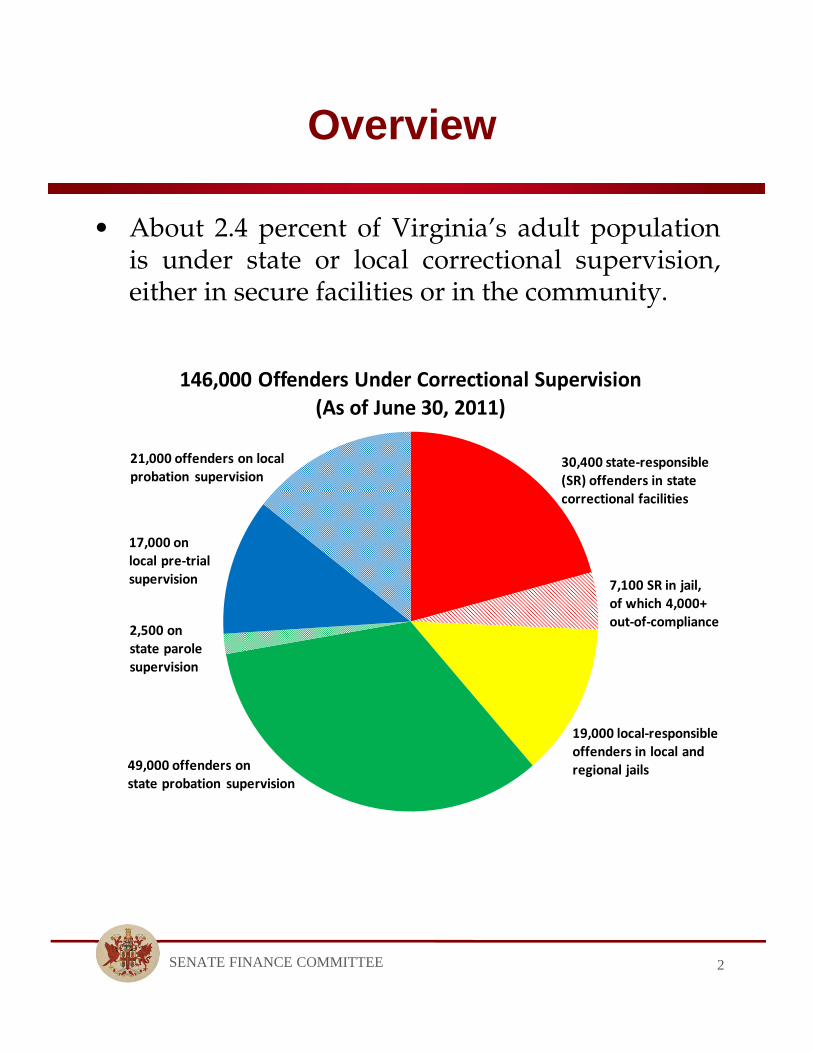
• About 2.4 percent of Virginia’s adult populationis under state or local correctional supervision,either in secure facilities or in the community.
146,000 Offenders Under Correctional Supervision
(As of June 30, 2011)
30,400 state‐responsible(SR) offenders in statecorrectional facilities
7,100 SR in jail,of which 4,000+out‐of‐compliance
19,000 local‐responsibleoffenders in local andregional jails49,000 offenders on
state probation supervision
2,500 onstate parolesupervision
17,000 onlocal pre‐trialsupervision
21,000 offenders on localprobation supervision
SENATE FINANCE COMMITTEE
Key Points
• Virginia has a well-managed, safe and securecorrectional system, and is a national leader inimplementing sentencing reforms.
• Virginia has a high incarceration rate, but lowcrime and recidivism rates.
• Offender populations have fallen, providingopportunities for cost savings, but thesesavings have affected operations.– State facilities have been closed and treatment
programs reduced or eliminated, resulting incontinued crowding and increased securityconcerns, especially in dormitory units.
– State funding for jails has been cut, resulting incost-shifting to localities. No jails have beenclosed due to budget cuts.
• Over 25 percent of jail inmates are reported tohave a mental illness (and 12 percent reportedto have a serious mental illness).
3
SENATE FINANCE COMMITTEE
Sentencing Reform
• As intended, the adoption of felony sentencingguidelines in 1994 has led to:– Reductions in sentencing disparities;– More predictable sentencing patterns; and,– More accurate forecasting of offender populations.
• The guidelines are voluntary and compliance bycircuit judges is very high (80 percent).
• The intention was to reserve expensive prison bedspace for violent and repeat offenders.
– The proportion of the Department of Corrections(DOC) facility population defined as violent hasincreased from 59 to 79 percent since 1994.
• No other state has fully implemented (as Virginiadid in 2002) risk assessment guidelines for circuitjudges to use in deciding which felons should bein prison and which may safely be assigned toalternative sanctions.
4
SENATE FINANCE COMMITTEE
Incarceration Rates
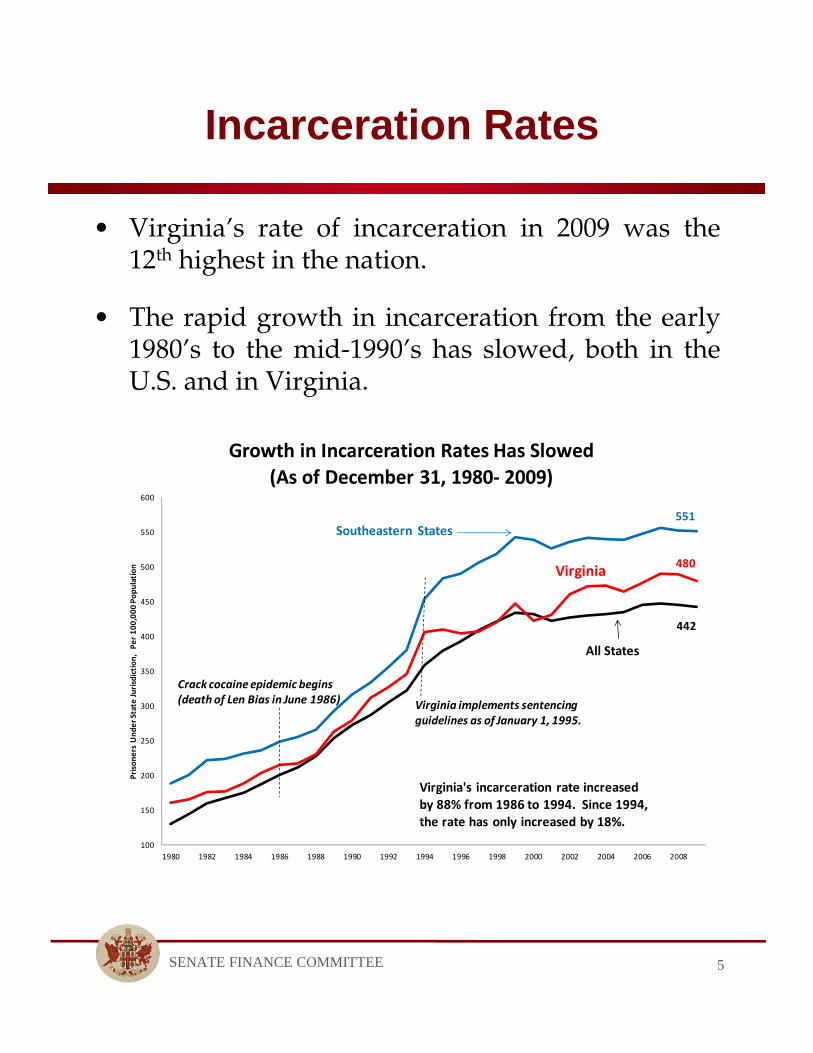
• Virginia’s rate of incarceration in 2009 was the12th highest in the nation.
• The rapid growth in incarceration from the early1980’s to the mid-1990’s has slowed, both in theU.S. and in Virginia.
5
100
150
200
250
300
350
400
450
500
550
600
1980 1982 1984 1986 1988 1990 1992 1994 1996 1998 2000 2002 2004 2006 2008
Prisoners Under State Jurisdiction, Per 100,000 Population
Growth in Incarceration Rates Has Slowed
(As of December 31, 1980‐ 2009)
Southeastern States
All States
Virginia
551
480
442
Virginia's incarceration rate increasedby 88% from 1986 to 1994. Since 1994,the rate has only increased by 18%.
Crack cocaine epidemic begins(death of Len Bias in June 1986) Virginia implements sentencing
guidelines as of January 1, 1995.
SENATE FINANCE COMMITTEE
Violent Crime Rates
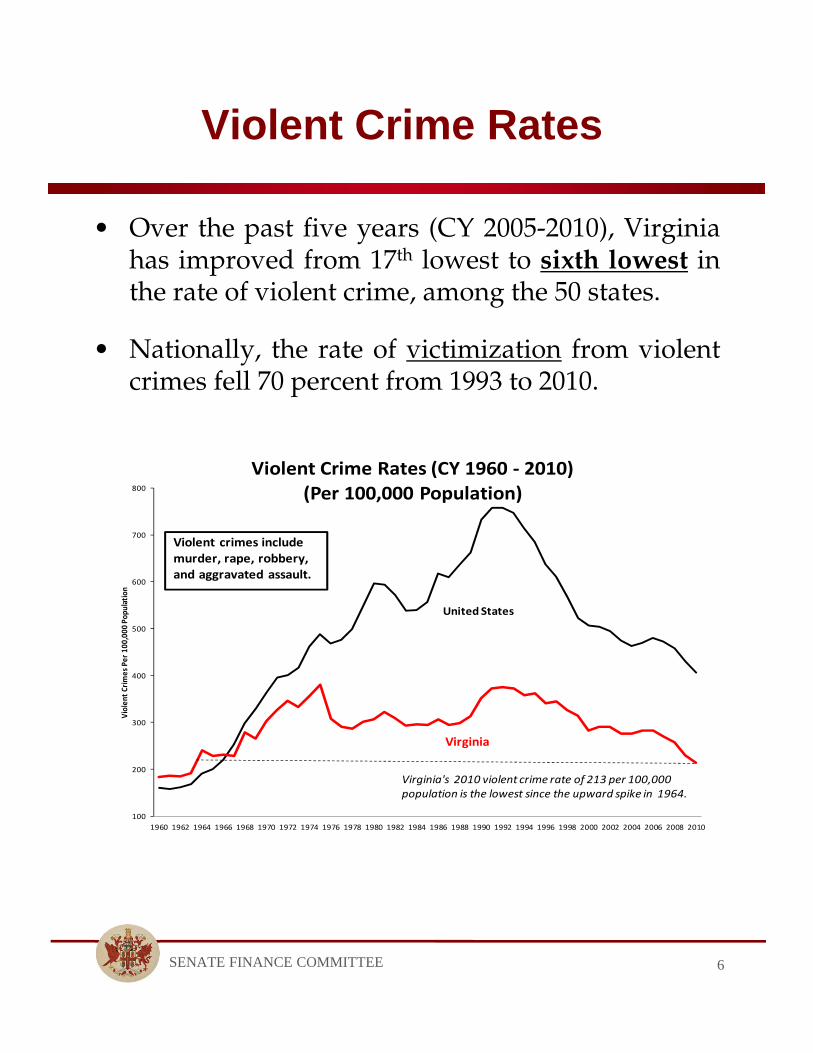
• Over the past five years (CY 2005-2010), Virginiahas improved from 17th lowest to sixth lowest inthe rate of violent crime, among the 50 states.
• Nationally, the rate of victimization from violentcrimes fell 70 percent from 1993 to 2010.
6
100
200
300
400
500
600
700
800
1960 1962 1964 1966 1968 1970 1972 1974 1976 1978 1980 1982 1984 1986 1988 1990 1992 1994 1996 1998 2000 2002 2004 2006 2008 2010
Violent Crimes Pe
r 100
,000
Pop
ulation
Violent Crime Rates (CY 1960 ‐ 2010)
(Per 100,000 Population)
Violent crimes includemurder, rape, robbery,and aggravated assault.
United States
Virginia
Virginia's 2010 violent crime rate of 213 per 100,000population is the lowest since the upward spike in 1964.
SENATE FINANCE COMMITTEE
Why the Decline?
• Criminologists are rethinking the link betweencrime and unemployment.
• Longer prison terms for violent/repeat offenders.
• A significant drop in cocaine availability; Virginiacocaine arrests down 47 percent since 2006.
• Smart policing – community policing strategies,more effective use of information technology.
• A broad range of anti-crime strategies, not just inpublic safety, but also in health and humanresources and education.
• Aging population – smaller percentage in highcrime-prone age group (15-24 year-old males).
• Regardless of the underlying causes, the mostsignificant factor is the drop in the crime rate inthe high crime-prone age group.
7
SENATE FINANCE COMMITTEE
Recidivism
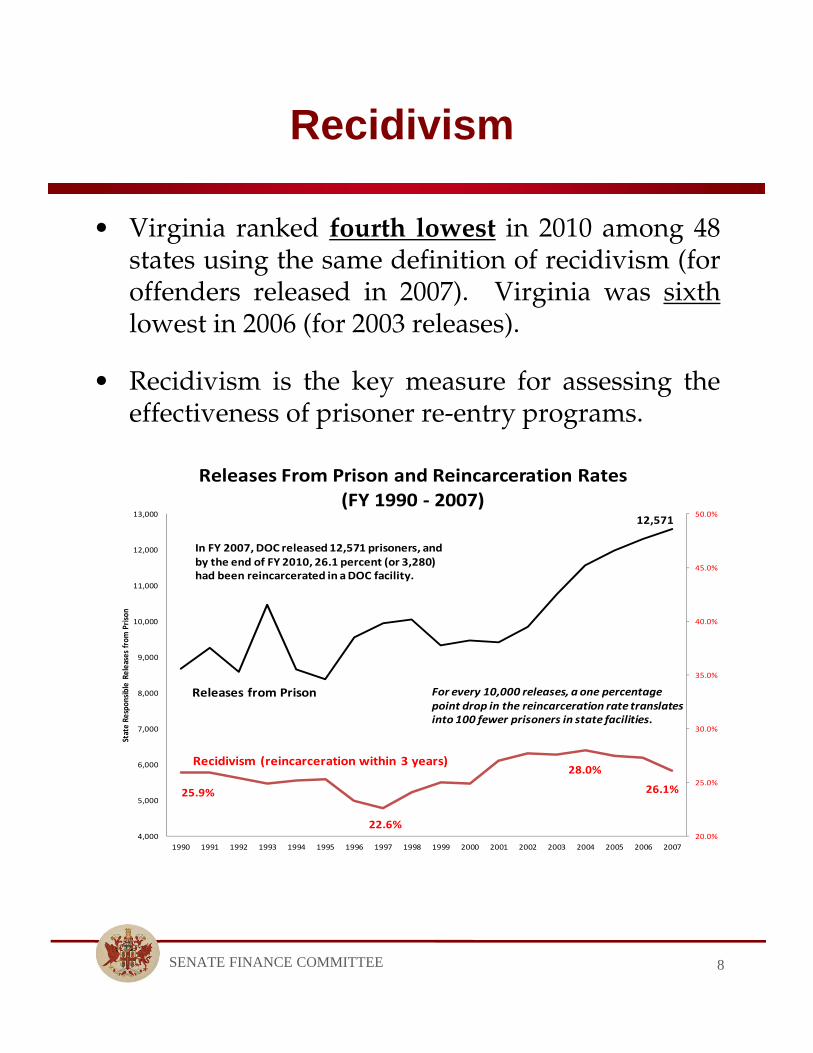
• Virginia ranked fourth lowest in 2010 among 48states using the same definition of recidivism (foroffenders released in 2007). Virginia was sixthlowest in 2006 (for 2003 releases).
• Recidivism is the key measure for assessing theeffectiveness of prisoner re-entry programs.
8
20.0%
25.0%
30.0%
35.0%
40.0%
45.0%
50.0%
4,000
5,000
6,000
7,000
8,000
9,000
10,000
11,000
12,000
13,000
1990 1991 1992 1993 1994 1995 1996 1997 1998 1999 2000 2001 2002 2003 2004 2005 2006 2007
State Re
spon
sible Re
leases from Prison
Releases From Prison and Reincarceration Rates
(FY 1990 ‐ 2007)12,571
28.0%
26.1%
Recidivism (reincarceration within 3 years)
In FY 2007, DOC released12,571 prisoners, andby the end of FY 2010, 26.1 percent (or 3,280)had been reincarcerated in a DOC facility.
Releases from Prison
25.9%
22.6%
For every 10,000 releases, aone percentagepoint drop in the reincarceration rate translatesinto 100 fewer prisoners in state facilities.
SENATE FINANCE COMMITTEE
Prisoner Re-Entry
• From last year’s retreat presentation:– A new business model is emerging in corrections,
with an increased emphasis on reducing recidivismand encouraging alternative sanctions, whereappropriate – based on sound principles of riskmanagement.
• Virginia has been encouraging improved prisonerre-entry programs for several years, to assistinmates returning to their home communities.
• In 2010 the Administration appointed a Prisonerand Juvenile Offender Reentry Council whichadopted 67 recommendations, and DOC now hasa formalized re-entry plan.– Collaboration with non-profits and localities;– Counseling and programming beginning when an
offender is sentenced to a DOC facility, andcontinuing through release to the community; and,
– Utilization of assessment information when makingprison and program assignments.
9
SENATE FINANCE COMMITTEE
Alternatives
• The Administration has continued the Task Forceon Alternatives for Non-Violent Offenders.
• The Task Force has recommended legislation toauthorize 3-5 pilot programs based on swift andsure sanctions for technical probation violators.– Last year, over 1,000 offenders were returned to
prison due to technical violations of the terms andconditions of probation, rather than a new crime.
– Proposed SURE program (Sanctions with UniformRapid Enforcement) would be administered by theVirginia Criminal Sentencing Commission.
– Judges would have a sanctioning continuum fornon-violent felons on probation: 1st violation 5-10 days (in jail) 2nd violation 15-20 days 3rd violation 25-30 days 4th violation 90 days – 12 months
o Not intended for drug addicts, based on use of a validated assessmentinstrument to be identified by the Sentencing Commission; court wouldhave the right to remove the offender from the program, upon motion ofthe Commonwealth or defense counsel.
10
SENATE FINANCE COMMITTEE
State Responsibility
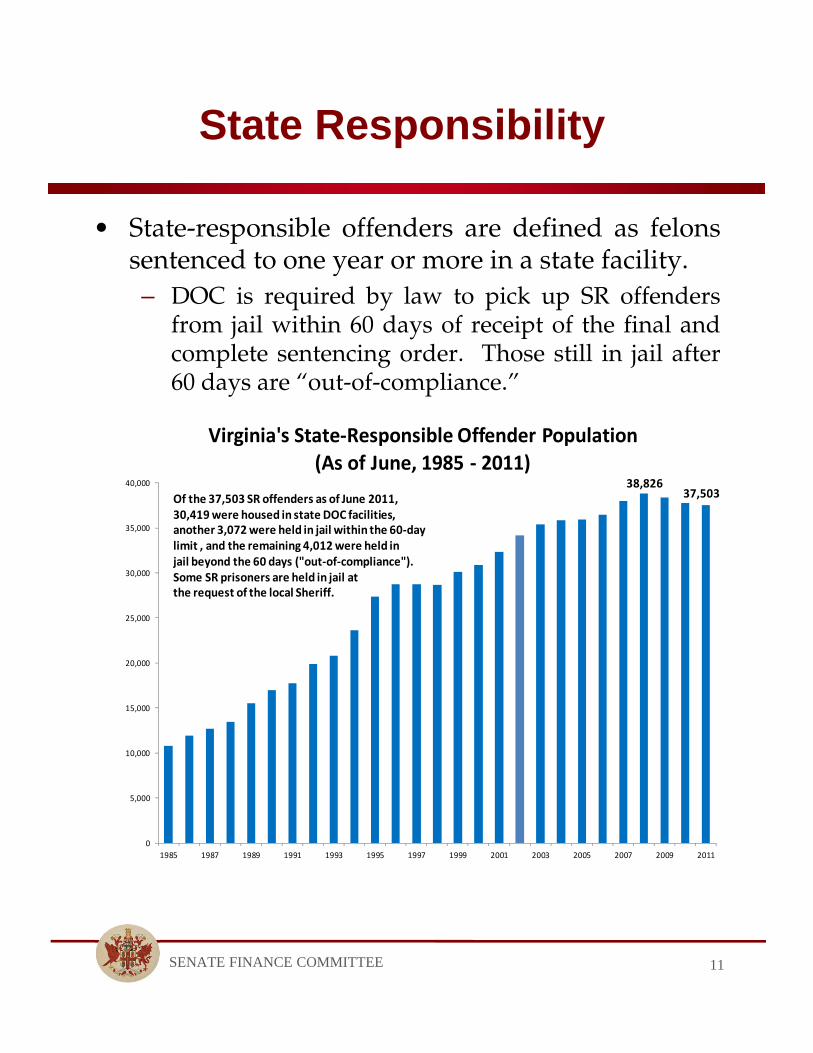
• State-responsible offenders are defined as felonssentenced to one year or more in a state facility.– DOC is required by law to pick up SR offenders
from jail within 60 days of receipt of the final andcomplete sentencing order. Those still in jail after60 days are “out-of-compliance.”
11
0
5,000
10,000
15,000
20,000
25,000
30,000
35,000
40,000
1985 1987 1989 1991 1993 1995 1997 1999 2001 2003 2005 2007 2009 2011
Virginia's State‐Responsible Offender Population
(As of June, 1985 ‐ 2011)38,826
37,503Of the 37,503 SR offenders as of June 2011,30,419 were housed in state DOC facilities,another 3,072 were held in jail within the 60‐daylimit , and the remaining 4,012 were held injail beyond the 60 days ("out‐of‐compliance").Some SR prisoners are held in jail atthe request of the local Sheriff.
SENATE FINANCE COMMITTEE
DOC Budget: The Basics
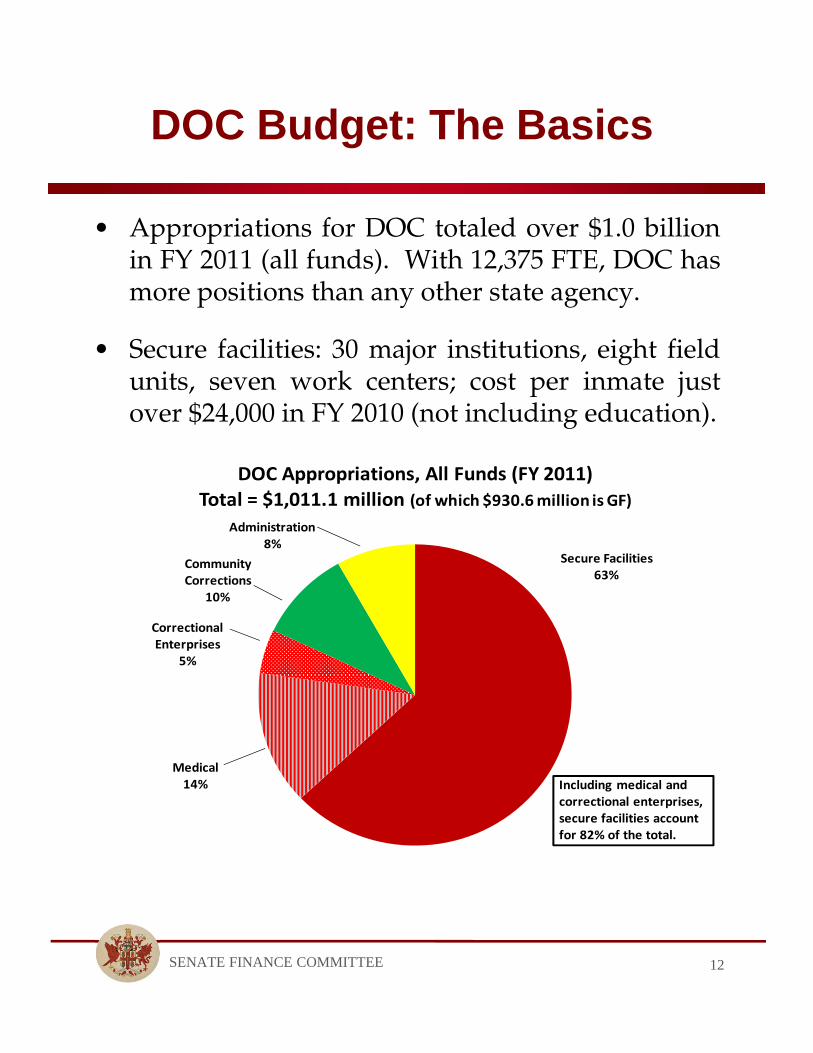
• Appropriations for DOC totaled over $1.0 billionin FY 2011 (all funds). With 12,375 FTE, DOC hasmore positions than any other state agency.
• Secure facilities: 30 major institutions, eight fieldunits, seven work centers; cost per inmate justover $24,000 in FY 2010 (not including education).
12
Secure Facilities63%
Medical14%
CorrectionalEnterprises
5%
Community Corrections
10%
Administration8%
DOC Appropriations, All Funds (FY 2011)Total = $1,011.1 million (of which $930.6 million is GF)
Including medical andcorrectional enterprises,secure facilities accountfor 82% of the total.
SENATE FINANCE COMMITTEE
Medical Costs
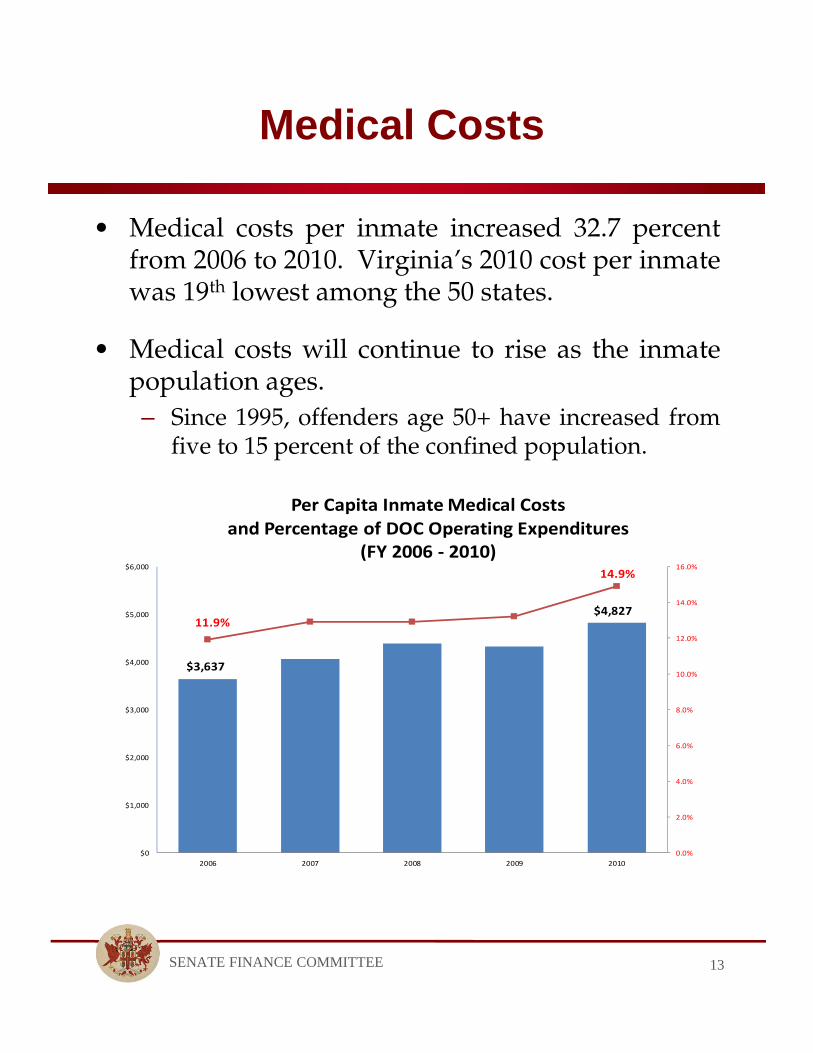
• Medical costs per inmate increased 32.7 percentfrom 2006 to 2010. Virginia’s 2010 cost per inmatewas 19th lowest among the 50 states.
• Medical costs will continue to rise as the inmatepopulation ages.– Since 1995, offenders age 50+ have increased from
five to 15 percent of the confined population.
13
0.0%
2.0%
4.0%
6.0%
8.0%
10.0%
12.0%
14.0%
16.0%
$0
$1,000
$2,000
$3,000
$4,000
$5,000
$6,000
2006 2007 2008 2009 2010
Per Capita Inmate Medical Costsand Percentage of DOC Operating Expenditures
(FY 2006 ‐ 2010)
$3,637
$4,82711.9%
14.9%
SENATE FINANCE COMMITTEE
DOC Budget Cuts
• DOC has weathered the transition to leanerbudgets over the past three years.– General fund operating expenditures in FY 2011, as
adjusted, were $59.4 million (7.3 percent) lowerthan three years earlier (in FY 2008).
– Since 2008, nine facilities (3,000 beds) closed; manyprograms reduced or eliminated; ten percent oftotal FTE positions eliminated -- but only 43 layoffs. Employees have taken on greater workloads. Limited capacity at this point to close additional
facilities without layoffs.
• The state-responsible population declined by 3.4percent from June, 2008-2011, but the number ofbeds closed is more than twice the reduction inthe state-responsible (SR) population.– As a result, state facilities are just as crowded as
before, and more SR prisoners are backed up inlocal and regional jails.
• Capital maintenance costs are increasing.
14
SENATE FINANCE COMMITTEE
Facilities Still Crowded
• The new Grayson County facility (River NorthCorrectional Center) has been mothballed.– $106 million capital cost.– $25 million/year operating cost (not funded).– $715,000 annual mothballing cost (6 FTE).
• Remaining facilities are at maximum capacity, or60-65 percent double-bunking. (DOC is updatingits facility capacity.)– In effect, capacity has been defined by the physical
limits of water and sewage treatment capacity. DOC continues to operate over 800 “temporary
emergency” beds, especially in crowded dormitoryunits – raising security concerns.
• Pennsylvania is ending its contract to house 1,000inmates in Virginia as of March 2012.– The $20.4 million per year in NGF revenue has
supported operation of Green Rock CorrectionalCenter near Chatham. Unless these funds are replaced, additional facilities
will be closed.
15
SENATE FINANCE COMMITTEE
Facilities Are Secure
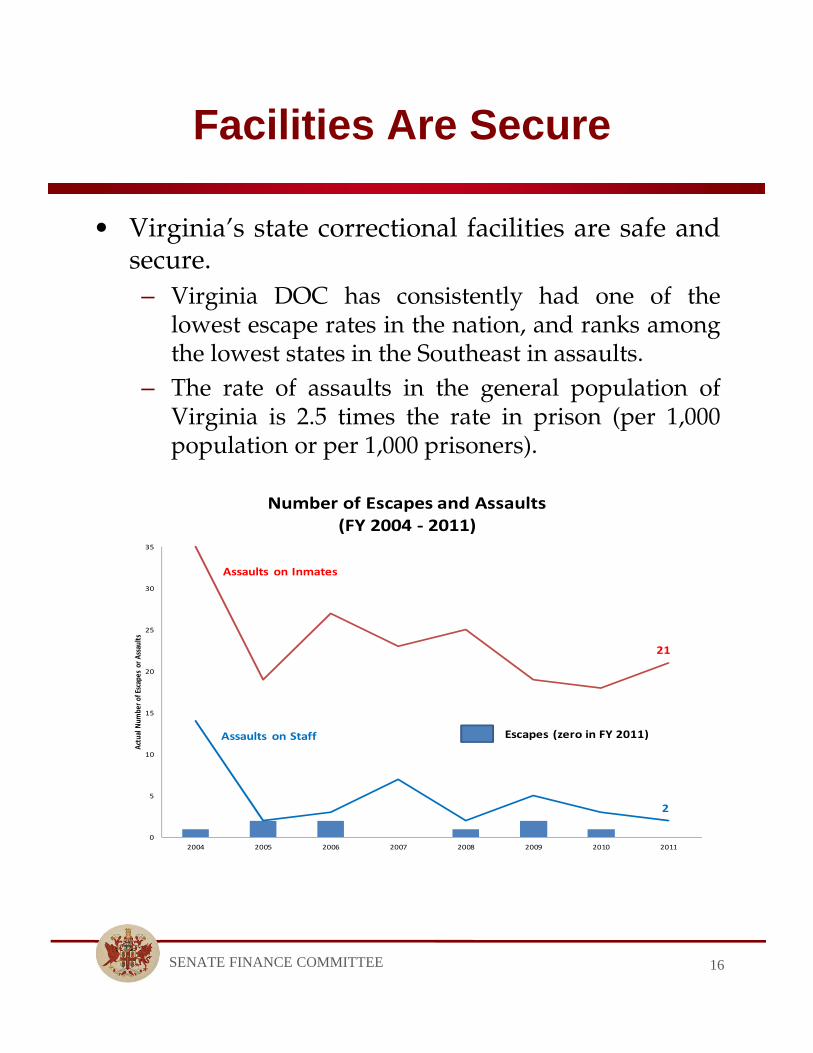
• Virginia’s state correctional facilities are safe andsecure.– Virginia DOC has consistently had one of the
lowest escape rates in the nation, and ranks amongthe lowest states in the Southeast in assaults.
– The rate of assaults in the general population ofVirginia is 2.5 times the rate in prison (per 1,000population or per 1,000 prisoners).
16
0
5
10
15
20
25
30
35
2004 2005 2006 2007 2008 2009 2010 2011
Actual N
umbe
r of Escapes or Assaults
Number of Escapes and Assaults (FY 2004 ‐ 2011)
Assaults on Staff
Assaults on Inmates
Escapes (zero in FY 2011)
2
21
SENATE FINANCE COMMITTEE
Forecasts Lowered, Again
• The Secretary of Public Safety convenes a policycommittee and a technical committee each year toupdate the four offender forecasts:– State-responsible (SR) adults, most of whom are
held in state facilities, but about 7,100 are housed inlocal or regional jails;
– Local-responsible (LR) adults, confined in localand regional jails;
– State-responsible juveniles, confined in statejuvenile correctional centers operated by theDepartment of Juvenile Justice (DJJ); and,
– Local-responsible juveniles, confined in local andregional juvenile detention facilities.
• The actual number of SR adults peaked in 2008;the number of LR adults peaked in 2007.– The actual numbers of state- and local-responsible
juvenile offenders peaked a decade ago.
• The forecasts have been lowered in each of thepast several years.
17
SENATE FINANCE COMMITTEE
SR Forecast
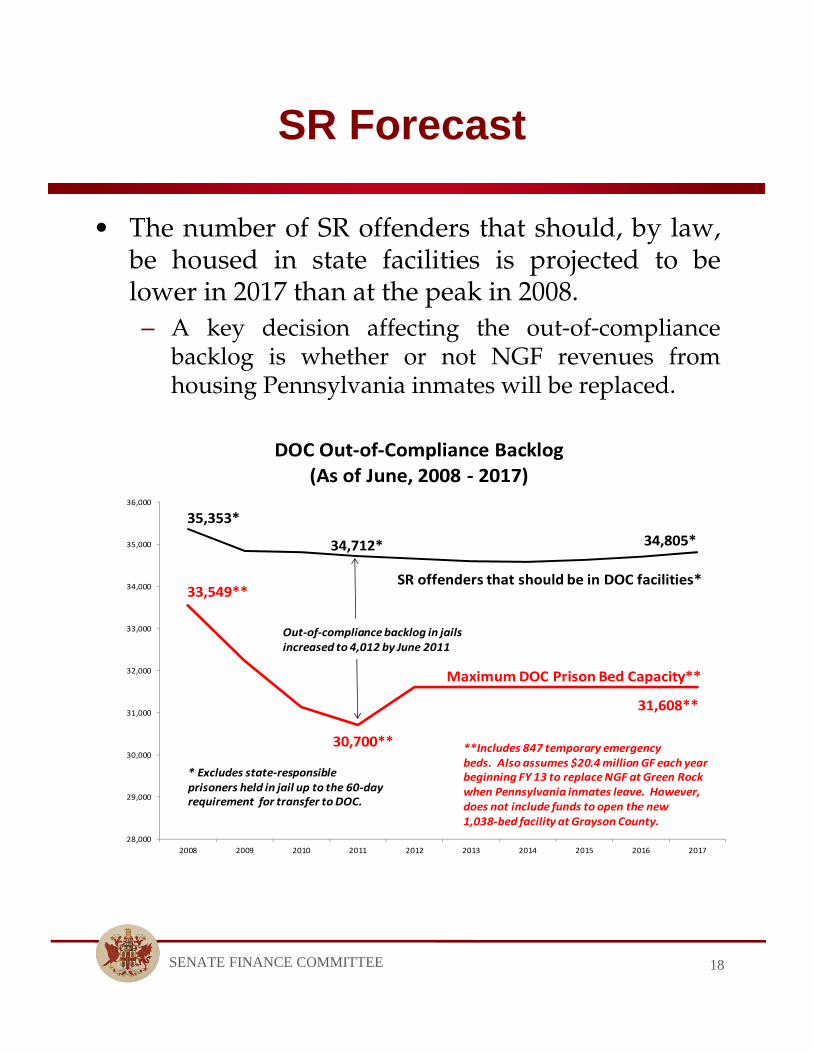
• The number of SR offenders that should, by law,be housed in state facilities is projected to belower in 2017 than at the peak in 2008.– A key decision affecting the out-of-compliance
backlog is whether or not NGF revenues fromhousing Pennsylvania inmates will be replaced.
18
28,000
29,000
30,000
31,000
32,000
33,000
34,000
35,000
36,000
2008 2009 2010 2011 2012 2013 2014 2015 2016 2017
DOC Out‐of‐Compliance Backlog(As of June, 2008 ‐ 2017)
MaximumDOC Prison Bed Capacity**
SR offenders that should be in DOC facilities*
35,353*
33,549**
34,805*
31,608**
Out‐of‐compliance backlog in jailsincreased to 4,012 by June 2011
* Excludes state‐responsibleprisoners held in jail up to the 60‐dayrequirement for transfer to DOC.
**Includes 847 temporary emergencybeds. Also assumes $20.4 million GF each yearbeginning FY 13 to replace NGF at Green Rockwhen Pennsylvania inmates leave. However,does not include funds to open the new1,038‐bed facility at Grayson County.
30,700**
34,712*
SENATE FINANCE COMMITTEE
Virginia’s Jails
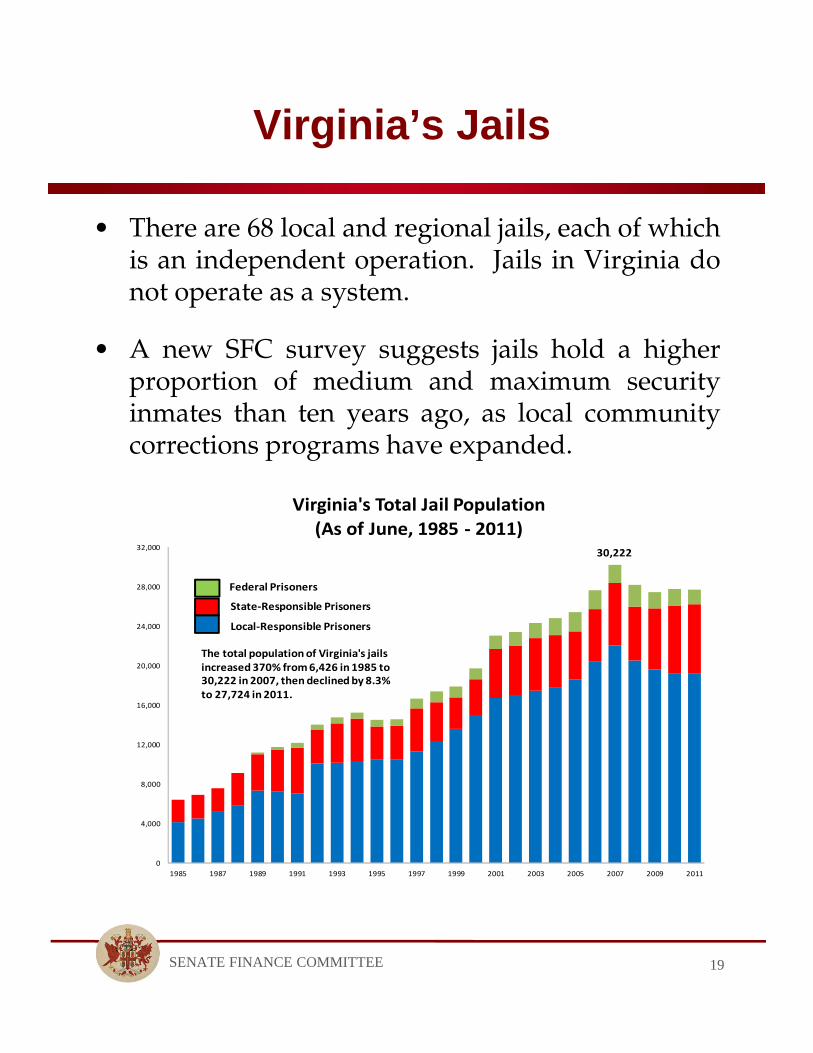
• There are 68 local and regional jails, each of whichis an independent operation. Jails in Virginia donot operate as a system.
• A new SFC survey suggests jails hold a higherproportion of medium and maximum securityinmates than ten years ago, as local communitycorrections programs have expanded.
19
0
4,000
8,000
12,000
16,000
20,000
24,000
28,000
32,000
1985 1987 1989 1991 1993 1995 1997 1999 2001 2003 2005 2007 2009 2011
Virginia's Total Jail Population
(As of June, 1985 ‐ 2011)
Federal Prisoners
State‐Responsible Prisoners
Local‐Responsible Prisoners
30,222
The total population of Virginia's jails increased 370% from 6,426 in 1985 to30,222 in 2007, then declined by 8.3%to 27,724 in 2011.
SENATE FINANCE COMMITTEE
LR Forecast
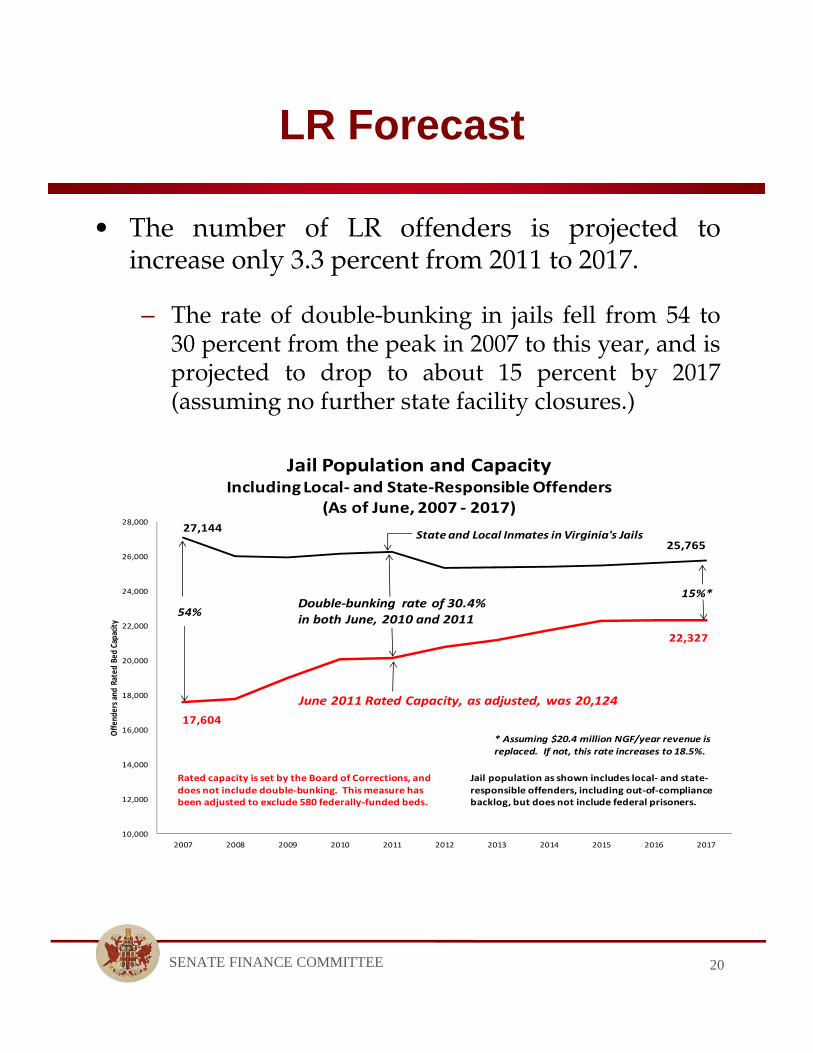
• The number of LR offenders is projected toincrease only 3.3 percent from 2011 to 2017.
– The rate of double-bunking in jails fell from 54 to30 percent from the peak in 2007 to this year, and isprojected to drop to about 15 percent by 2017(assuming no further state facility closures.)
20
10,000
12,000
14,000
16,000
18,000
20,000
22,000
24,000
26,000
28,000
2007 2008 2009 2010 2011 2012 2013 2014 2015 2016 2017
Offen
ders and
Rated
Bed
Capacity
Jail Population and CapacityIncluding Local‐ and State‐Responsible Offenders
(As of June, 2007 ‐ 2017)27,144
17,604
25,765
22,327
Double‐bunking rate of 30.4%in both June, 2010 and 2011
Rated capacity is set by the Board of Corrections, anddoes not include double‐bunking. This measure hasbeen adjusted to exclude 580 federally‐funded beds.
Jail population as shown includes local‐ and state‐responsible offenders, including out‐of‐compliancebacklog, but does not include federal prisoners.
June 2011 Rated Capacity, as adjusted, was 20,124
54%
15%*
* Assuming $20.4 million NGF/year revenue isreplaced. If not, this rate increases to 18.5%.
State and Local Inmates in Virginia's Jails
SENATE FINANCE COMMITTEE
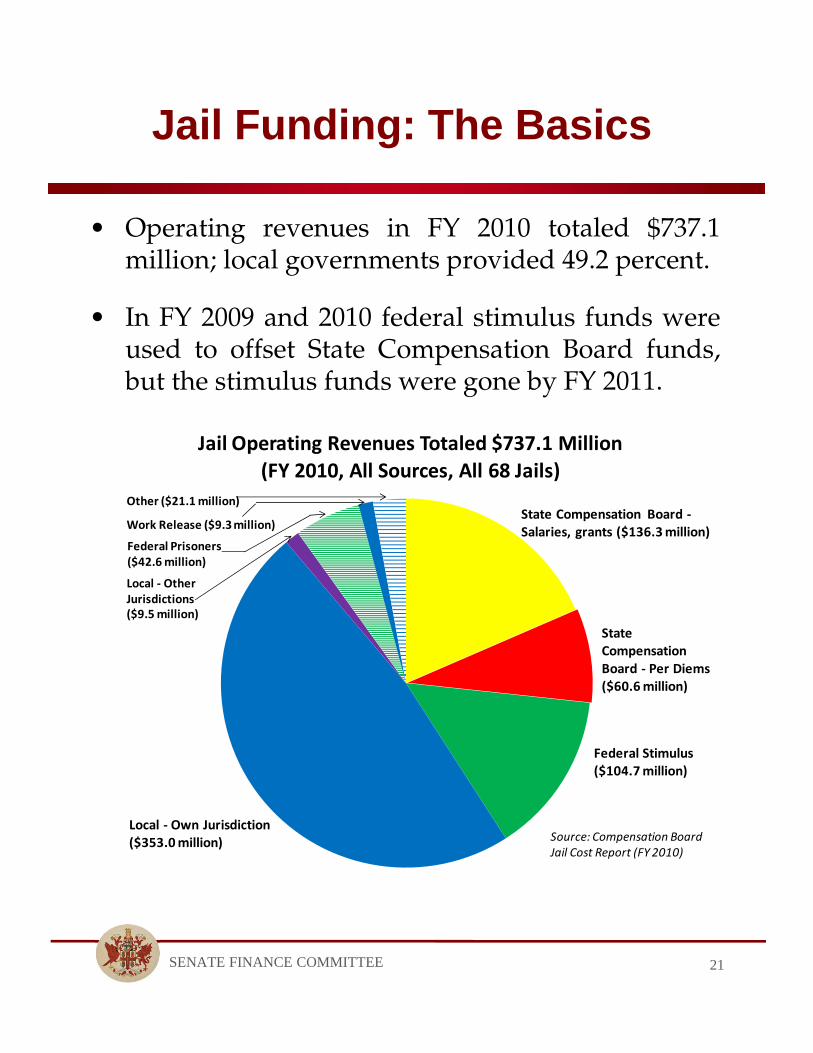
Jail Funding: The Basics
• Operating revenues in FY 2010 totaled $737.1million; local governments provided 49.2 percent.
• In FY 2009 and 2010 federal stimulus funds wereused to offset State Compensation Board funds,but the stimulus funds were gone by FY 2011.
21
Jail Operating Revenues Totaled $737.1 Million
(FY 2010, All Sources, All 68 Jails)
State Compensation Board ‐Salaries, grants ($136.3 million)
StateCompensationBoard ‐ Per Diems($60.6 million)
Federal Stimulus($104.7 million)
Local ‐ Own Jurisdiction($353.0 million)
Local ‐ OtherJurisdictions($9.5 million)
Federal Prisoners($42.6 million)
Work Release ($9.3 million)
Other ($21.1 million)
Source: Compensation BoardJail Cost Report (FY 2010)
SENATE FINANCE COMMITTEE
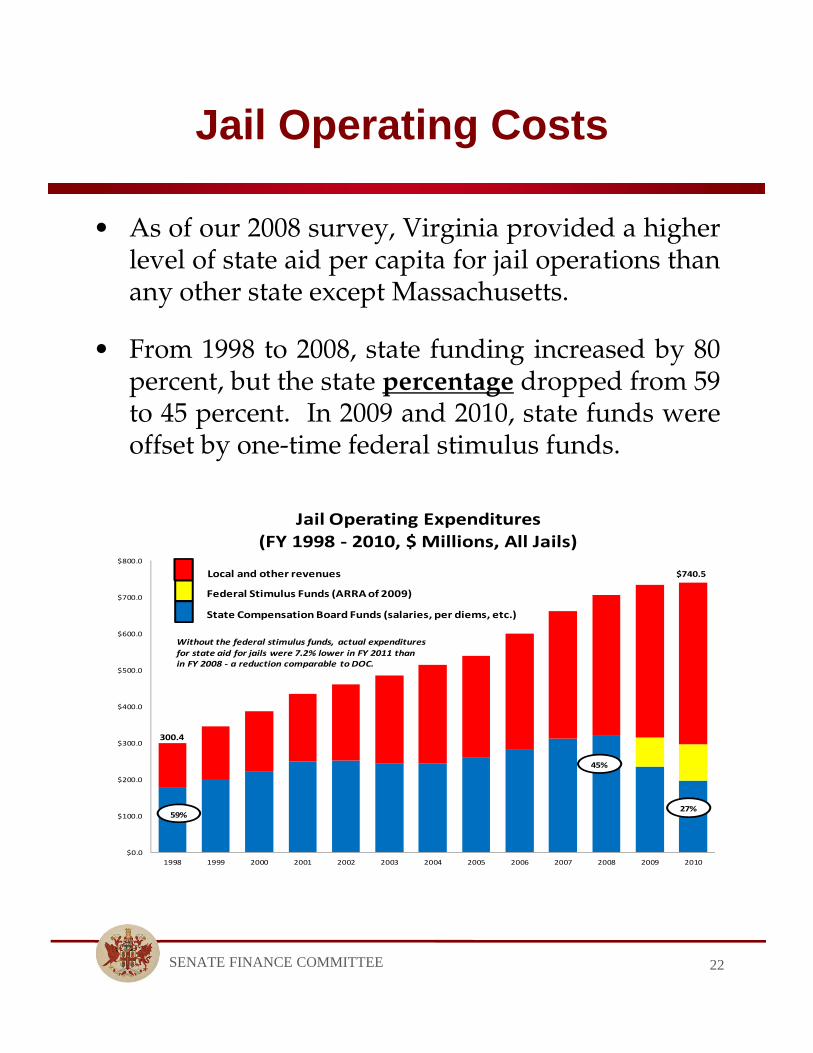
Jail Operating Costs
• As of our 2008 survey, Virginia provided a higherlevel of state aid per capita for jail operations thanany other state except Massachusetts.
• From 1998 to 2008, state funding increased by 80percent, but the state percentage dropped from 59to 45 percent. In 2009 and 2010, state funds wereoffset by one-time federal stimulus funds.
22
$0.0
$100.0
$200.0
$300.0
$400.0
$500.0
$600.0
$700.0
$800.0
1998 1999 2000 2001 2002 2003 2004 2005 2006 2007 2008 2009 2010
Jail Operating Expenditures
(FY 1998 ‐ 2010, $ Millions, All Jails)
Local and other revenues
Federal Stimulus Funds (ARRAof 2009)
State Compensation Board Funds (salaries, per diems, etc.)
300.4
$740.5
59%
45%
27%
Without the federal stimulus funds, actual expendituresfor state aid for jails were 7.2% lower in FY 2011 thanin FY 2008 ‐ a reduction comparable to DOC.
SENATE FINANCE COMMITTEE
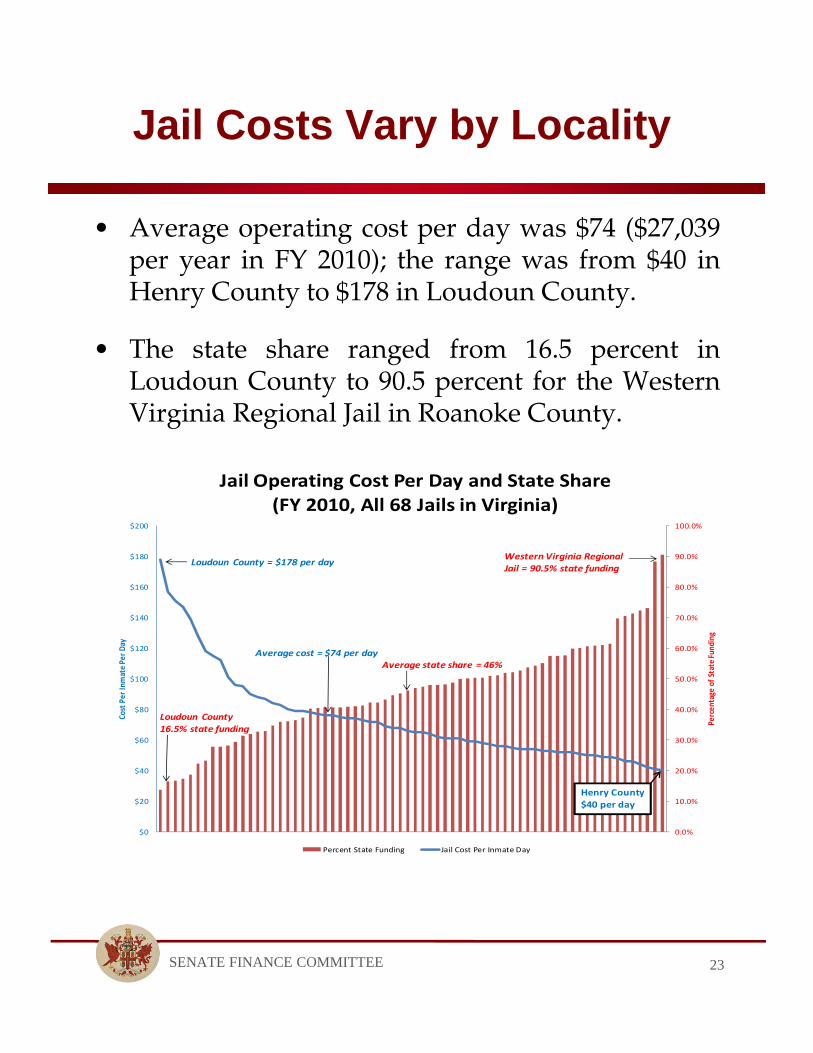
Jail Costs Vary by Locality
• Average operating cost per day was $74 ($27,039per year in FY 2010); the range was from $40 inHenry County to $178 in Loudoun County.
• The state share ranged from 16.5 percent inLoudoun County to 90.5 percent for the WesternVirginia Regional Jail in Roanoke County.
23
0.0%
10.0%
20.0%
30.0%
40.0%
50.0%
60.0%
70.0%
80.0%
90.0%
100.0%
$0
$20
$40
$60
$80
$100
$120
$140
$160
$180
$200
Percen
tage
of State Fund
ing
Cost Per In
mate Pe
r Day
Jail Operating Cost Per Day and State Share
(FY 2010, All 68 Jails in Virginia)
Percent State Funding Jail Cost Per Inmate Day
Average state share = 46%Average cost = $74 per day
Loudoun County = $178 per dayWestern Virginia RegionalJail = 90.5% state funding
Loudoun County
16.5% state funding
Henry County
$40 per day
SENATE FINANCE COMMITTEE
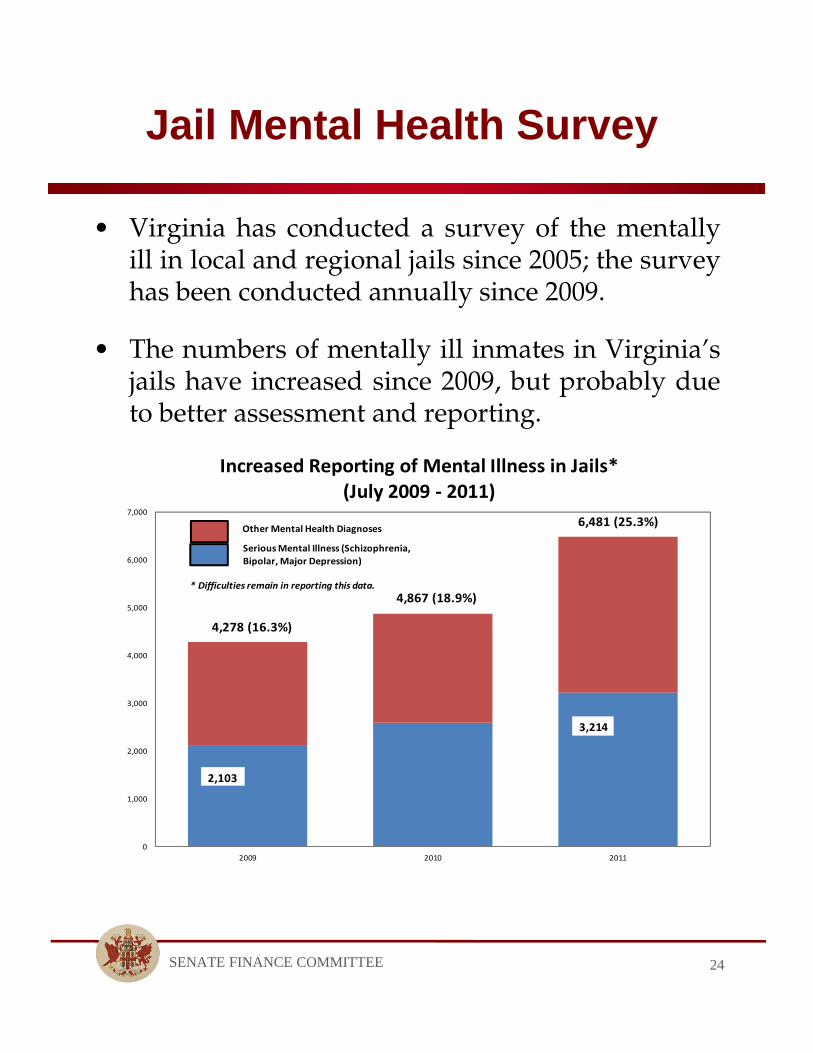
Jail Mental Health Survey
• Virginia has conducted a survey of the mentallyill in local and regional jails since 2005; the surveyhas been conducted annually since 2009.
• The numbers of mentally ill inmates in Virginia’sjails have increased since 2009, but probably dueto better assessment and reporting.
24
0
1,000
2,000
3,000
4,000
5,000
6,000
7,000
2009 2010 2011
Increased Reporting of Mental Illness in Jails*(July 2009 ‐ 2011)
4,278 (16.3%)
4,867 (18.9%)
6,481 (25.3%)Other Mental Health Diagnoses
SeriousMental Illness (Schizophrenia,
Bipolar, Major Depression)
* Difficulties remain in reporting this data.
3,214
2,103
SENATE FINANCE COMMITTEE
Addressing the Issue
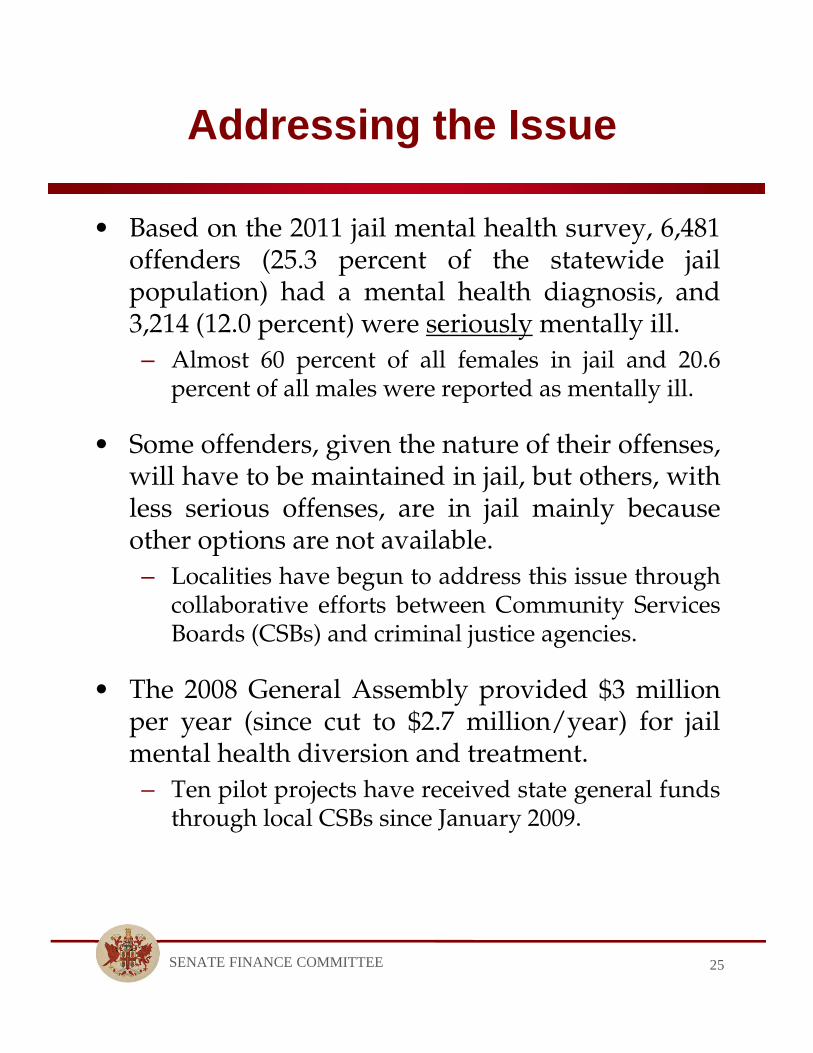
• Based on the 2011 jail mental health survey, 6,481offenders (25.3 percent of the statewide jailpopulation) had a mental health diagnosis, and3,214 (12.0 percent) were seriously mentally ill.– Almost 60 percent of all females in jail and 20.6
percent of all males were reported as mentally ill.
• Some offenders, given the nature of their offenses,will have to be maintained in jail, but others, withless serious offenses, are in jail mainly becauseother options are not available.– Localities have begun to address this issue through
collaborative efforts between Community ServicesBoards (CSBs) and criminal justice agencies.
• The 2008 General Assembly provided $3 millionper year (since cut to $2.7 million/year) for jailmental health diversion and treatment.– Ten pilot projects have received state general funds
through local CSBs since January 2009.
25
SENATE FINANCE COMMITTEE
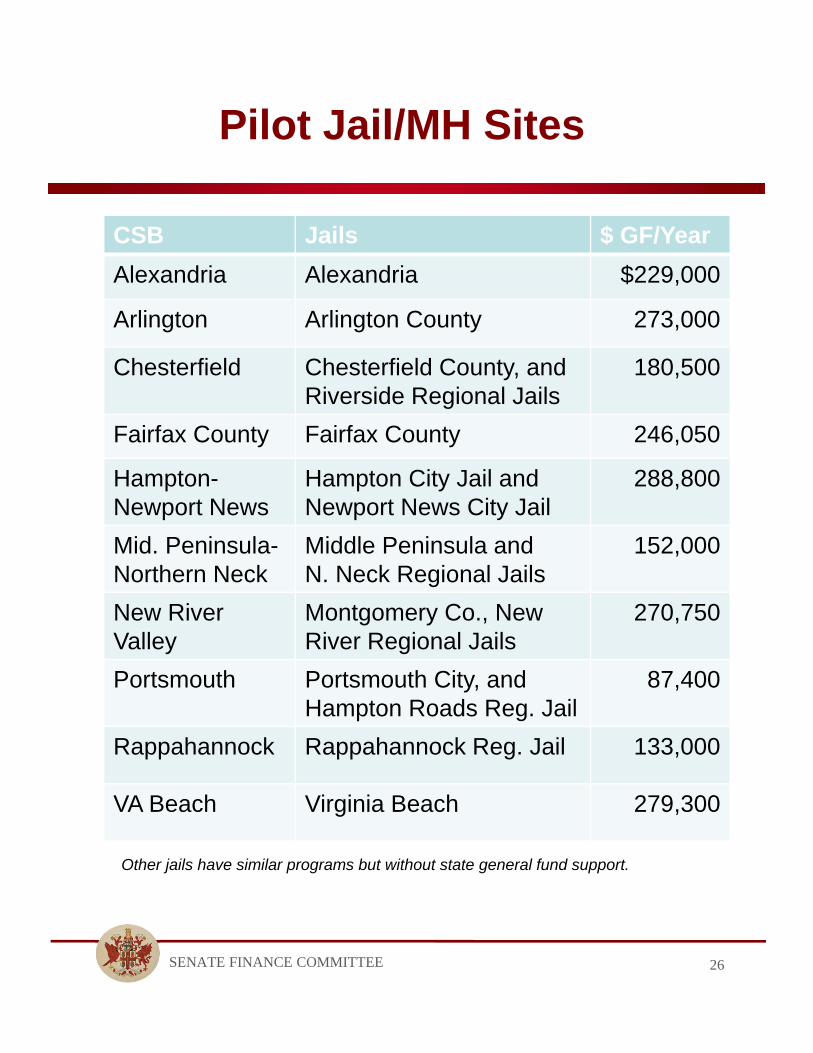
Pilot Jail/MH Sites
CSB Jails $ GF/Year
Alexandria Alexandria $229,000
Arlington Arlington County 273,000
Chesterfield Chesterfield County, andRiverside Regional Jails
180,500
Fairfax County Fairfax County 246,050
Hampton-Newport News
Hampton City Jail andNewport News City Jail
288,800
Mid. Peninsula-Northern Neck
Middle Peninsula andN. Neck Regional Jails
152,000
New River Valley
Montgomery Co., New River Regional Jails
270,750
Portsmouth Portsmouth City, and Hampton Roads Reg. Jail
87,400
Rappahannock Rappahannock Reg. Jail 133,000
VA Beach Virginia Beach 279,300
26
Other jails have similar programs but without state general fund support.
SENATE FINANCE COMMITTEE
Assessment of Pilot Grants
• Initial results appear promising.
• Good working relationships established betweenCSBs and local criminal justice agencies.– In many cases, local criminal justice/mental health
committees have been established.
• Jails are developing improved capacity to identifymental illness -- dedicated staff, better assessmentinstruments and improved collaboration.
• Crisis intervention teams (CITs) expanded (nineoperational, more planned) and over 2,500 lawenforcement officers trained.
• All ten pilot projects beginning to divert someoffenders from jail, and six assessment centers (ordrop-off facilities) operational.
• Constraints -- insufficient resources for treatmentand lack of housing alternatives.
27
SENATE FINANCE COMMITTEE
What Works?
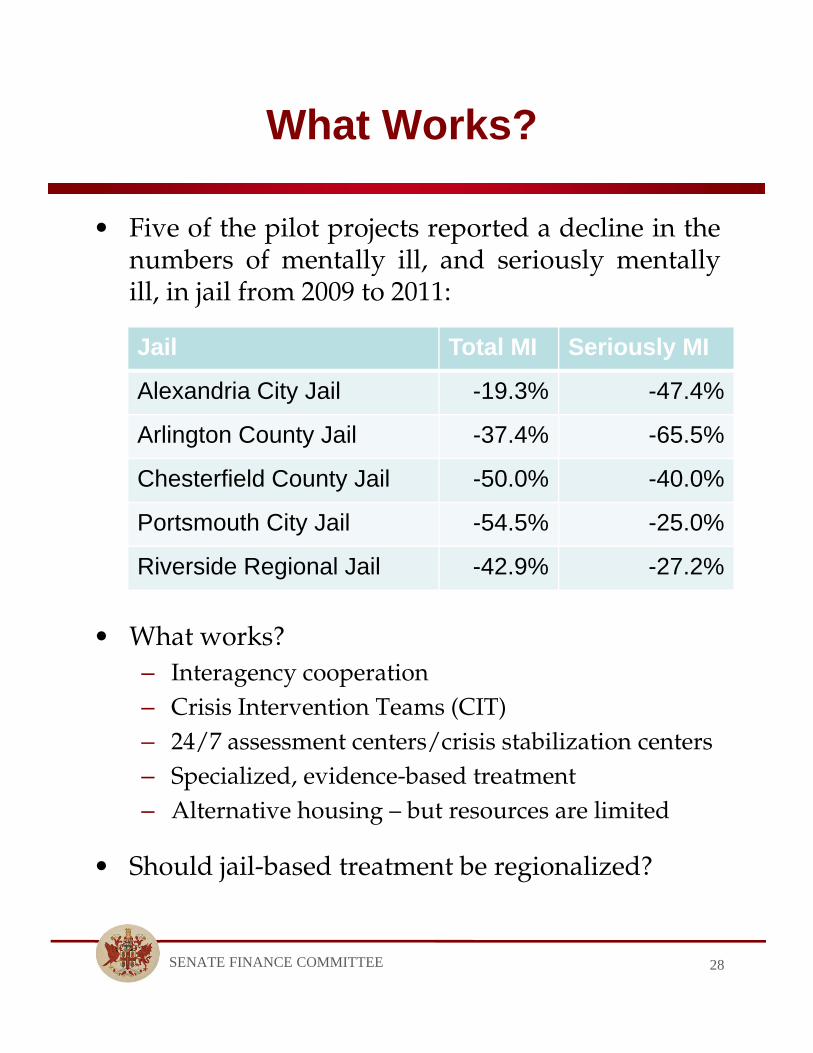
• Five of the pilot projects reported a decline in thenumbers of mentally ill, and seriously mentallyill, in jail from 2009 to 2011:
• What works?– Interagency cooperation– Crisis Intervention Teams (CIT)– 24/7 assessment centers/crisis stabilization centers– Specialized, evidence-based treatment– Alternative housing – but resources are limited
• Should jail-based treatment be regionalized?
28
Jail Total MI Seriously MI
Alexandria City Jail -19.3% -47.4%
Arlington County Jail -37.4% -65.5%
Chesterfield County Jail -50.0% -40.0%
Portsmouth City Jail -54.5% -25.0%
Riverside Regional Jail -42.9% -27.2%
SENATE FINANCE COMMITTEE
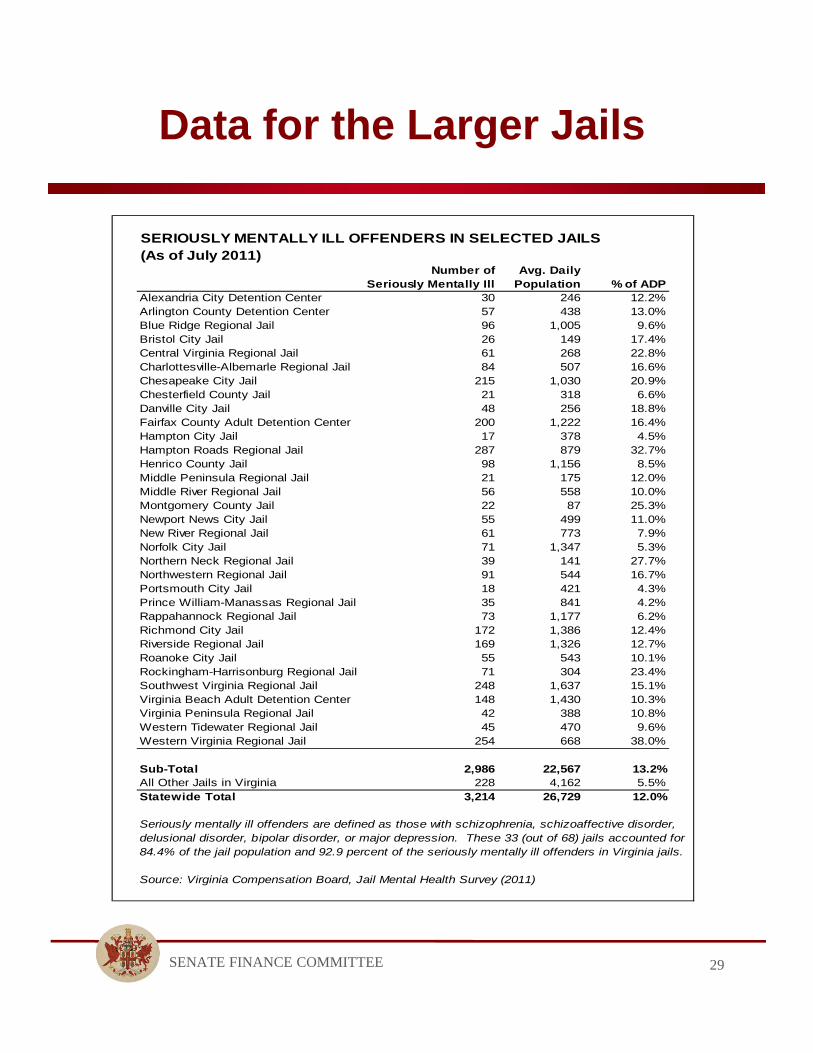
Data for the Larger Jails
29
SERIOUSLY MENTALLY ILL OFFENDERS IN SELECTED JAILS(As of July 2011)
Number of Avg. DailySeriously Mentally Ill Population % of ADP
Alexandria City Detention Center 30 246 12.2%Arlington County Detention Center 57 438 13.0%Blue Ridge Regional Jail 96 1,005 9.6%Bristol City Jail 26 149 17.4%Central Virginia Regional Jail 61 268 22.8%Charlottesville-Albemarle Regional Jail 84 507 16.6%Chesapeake City Jail 215 1,030 20.9%Chesterfield County Jail 21 318 6.6%Danville City Jail 48 256 18.8%Fairfax County Adult Detention Center 200 1,222 16.4%Hampton City Jail 17 378 4.5%Hampton Roads Regional Jail 287 879 32.7%Henrico County Jail 98 1,156 8.5%Middle Peninsula Regional Jail 21 175 12.0%Middle River Regional Jail 56 558 10.0%Montgomery County Jail 22 87 25.3%Newport News City Jail 55 499 11.0%New River Regional Jail 61 773 7.9%Norfolk City Jail 71 1,347 5.3%Northern Neck Regional Jail 39 141 27.7%Northwestern Regional Jail 91 544 16.7%Portsmouth City Jail 18 421 4.3%Prince William-Manassas Regional Jail 35 841 4.2%Rappahannock Regional Jail 73 1,177 6.2%Richmond City Jail 172 1,386 12.4%Riverside Regional Jail 169 1,326 12.7%Roanoke City Jail 55 543 10.1%Rockingham-Harrisonburg Regional Jail 71 304 23.4%Southwest Virginia Regional Jail 248 1,637 15.1%Virginia Beach Adult Detention Center 148 1,430 10.3%Virginia Peninsula Regional Jail 42 388 10.8%Western Tidewater Regional Jail 45 470 9.6%Western Virginia Regional Jail 254 668 38.0%
Sub-Total 2,986 22,567 13.2%All Other Jails in Virginia 228 4,162 5.5%Statewide Total 3,214 26,729 12.0%
Seriously mentally ill offenders are defined as those with schizophrenia, schizoaffective disorder,delusional disorder, bipolar disorder, or major depression. These 33 (out of 68) jails accounted for84.4% of the jail population and 92.9 percent of the seriously mentally ill offenders in Virginia jails.
Source: Virginia Compensation Board, Jail Mental Health Survey (2011)
SENATE FINANCE COMMITTEE
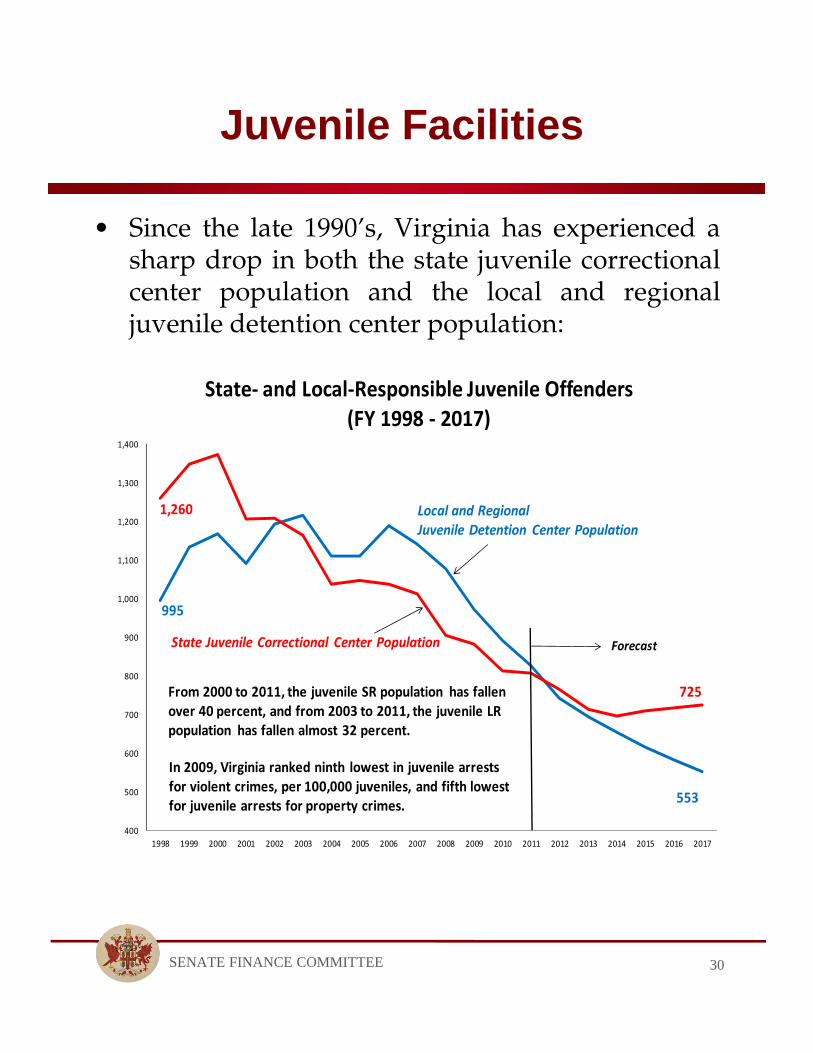
Juvenile Facilities
• Since the late 1990’s, Virginia has experienced asharp drop in both the state juvenile correctionalcenter population and the local and regionaljuvenile detention center population:
30
400
500
600
700
800
900
1,000
1,100
1,200
1,300
1,400
1998 1999 2000 2001 2002 2003 2004 2005 2006 2007 2008 2009 2010 2011 2012 2013 2014 2015 2016 2017
State‐ and Local‐Responsible Juvenile Offenders
(FY 1998 ‐ 2017)
725
553
Forecast
Local and Regional Juvenile Detention Center Population
State Juvenile Correctional Center Population
From 2000 to 2011, the juvenile SR population has fallenover 40 percent, and from 2003 to 2011, the juvenile LRpopulation has fallen almost 32 percent.
1,260
995
In 2009, Virginia ranked ninth lowest in juvenile arrestsfor violent crimes, per 100,000 juveniles, and fifth lowestfor juvenile arrests for property crimes.
SENATE FINANCE COMMITTEE
The Bottom Line
• Virginia’s crime and recidivism rates are low, andour national rankings have improved.
• Virginia has a well-managed, safe and securecorrectional system.
• Actual DOC expenditures, as adjusted, were cut7.3 percent from 2008-2011. Overcrowding instate DOC facilities remains a serious concern.
• Virginia has a high level of state aid for jails,although costs have shifted to local governmentssince the 1990’s. State aid for jails was cut 7.2percent from 2008-2011.
• A decision will be required whether or not toreplace $20.4 million in annual revenues fromhousing Pennsylvania inmates.
• There are no painless ways to reduce the cost ofVirginia’s state and local corrections.
31
SENATE FINANCE COMMITTEE
Concluding Thoughts
• Notwithstanding the drop in crime rates, crime(especially illicit drug trafficking and abuse)remains a very serious issue which will continueto engage the attention of public officials.
• However, the great prison and jail constructionboom of the past generation is over.– Virginia has excess capacity (vacant facilities) to
absorb future offender population growth.– Reducing overcrowding in state facilities should be
a priority, but there is a short-term cost to make theexcess capacity available.
– At lower cost, re-entry programs and alternativesto incarceration can help mitigate future growth infacility populations.
• Additional funding, supported by interagencycollaboration at the local level, can help to divertoffenders with mental illness from jail, and toimprove treatment.
32