crime analysis based on historical and transportation data
TRANSCRIPT

Crime Analysis and Predictions from historical Crime and Transportation Data∗
Valerii Klymchuk† and Candacey Primo‡
Saint Peter’s University2641 John F. Kennedy Boulevard, Jersey City, NJ 07306
(Dated: January 1, 2016)
Law enforcement agencies across the globe are employing a range of predictive policing methods.Smart, effective, and proactive policing is clearly preferable to simply reacting to criminal acts.
This paper proposes a novel approach to model, visualize, and predict crime risk levels for con-tinuous geographic domain based on demographic, historical and transportation data. The maincontribution of this approach lays in using passenger counts from major transportation hubs totackle a crime prediction problem.
While previous research efforts have used either background historical knowledge or offender’sprofiling, our findings show that aggregated data captured from Public Transit Infrastructure, incombination with basic demographic information, and historical crime records can be used to predictcrime.
In our experimental results with real crime data from Bogota we obtained a set of statistics thatdescribe seasonality in crime patterns, which can accompany predictive machine learning modelsassessing the risks of crime. Moreover, this work provides a discussion on implementation, designand final findings, suggesting a prototype for cloud based crime analytics dashboard.
I. INTRODUCTION
The ability to predict the locations of future crimeevents can serve as a valuable source of knowledge forlaw enforcement, both from tactical and strategic per-spectives. Predictive mapping holds a big promise foridentification of areas in which to focus interventions,but it also may improve the way those interventions areimplemented, if one can examine both distributions ofpast crimes and predictions of future concentrations[1].
The objective of this study was to develop a prototypeto illustrate the benefits of easy to use and, web-delivereddigital solution for visualization, analysis and explorationof criminal activity data in space and time. A new pro-totype was created as a web-based analytic dashboard toillustrate the potential benefits of new interactive toolsfor studying crime and transportation data provided bycity of Bogota.
This work primarily makes an attempt to investi-gate the predictive power of people dynamics derivedfrom transportation data in combination with histori-cal crime records within a place-centric and data drivenparadigm. While retrospective mapping efforts are use-ful, the true promise of crime mapping for police lies inits ability to identify early warning signs across time andspace, and inform a proactive problem solving and crimeprevention[1].
The current paper suggests a design for an interactiveprototype of Tableau analytic dashboard panel hosted ona cloud computer server, equipped with an interactive
∗ A footnote to the article title† Also at Computer and Information Sciences Department, SaintPeter’s University.‡ [email protected]
map and a set of filtering controls, which support linearand composite view, interactive temporal legends, and aset of informative interactive map layers.
We believe that that proposed solution can assistcrime analysts it identifying new insights about spatio-temporal crime patterns within urban city environment.Preliminary finding can accompany further predictivemodeling efforts in crime prediction.
II. PROBLEM UNDERSTANDING ANDRELATED WORK
The use of statistical and geo-spatial analyses to fore-cast crime levels has been around for decades. GIS out-puts can be used to visually identify concentrations andpatterns and to communicate those findings. GIS hasbeen widely used to produce maps depicting crime ”hotspots” as well as to conduct spatial analyses that sug-gest relationships between crime and characteristics ofthe social and physical environments in which crime con-centrations occur[1].
In recent years, however, there has been a surge of in-terest in analytical tools that draw on very large data setsto make predictions in support of crime prevention[2].Police agencies often use computer analysis of informa-tion about past crimes, the local environment, and otherintelligence to ”predict” and prevent crime. Predictivemethods allow police to work more proactively with lim-ited amount of resources. Improved situational awarenessat the tactical and strategic levels results, for example,in more efficient and effective policing, capable to pre-vent criminal activity by repeat offenders against repeatvictims.
Conventional approaches often apply human judge-ment and start with mapping crime locations and de-

2
termining where crimes are concentrated (”hot spots”).Such methods identify individuals at high risk of offend-ing in the future and relate to assessing individuals risk[2]. The most common method of ”forecasting” crimein police departments is simply to assume that the hotspots of yesterday are the hotspots of tomorrow
Meanwhile our approach relies rather on a new tech-nique that adds up the number of various risk factors tocreate an overall risk score. The objective of such datadriven technique is to forecast places and times with anincreased risk of crime in order to develop effective strate-gies for police to prevent crime more proactively or makeinvestigation efforts more effective.
A. Why Crime is Predictable. CriminologicalJustification for Predictive Policing
A notion that crime is predictable is supported bymajor theories of criminal behavior, such as routine ac-tivity theory, rational choice theory, and crime patterntheory[2]. These theories can be consolidated into ablended theory:
a. Criminals and victims follow common life pat-terns; overlaps in those patterns indicate an increasedlikelihood of crime.
b. Geographic and temporal features influence thewhere and when of those patterns.
c. As they move within those patterns, criminalsmake ”rational” decisions about whether to commitcrimes, taking into account such factors as the area, thetarget’s suitability, and the risk of getting caught.
The blended theory best fits ”stranger offenses”,such as robberies, burglaries, and thefts. It is less ap-plicable to vice and relationship violence, both of whichinvolve human connections that both extend beyondlimited geographic boundaries and lead to decisions thatdo not fit into traditional ”criminal rational choice”frameworks[2].
It is more manageable for police agencies to allocateresources to places that are most attractive to motivatedoffenders and to where crime is most likely to occur givencertain characteristics of the environment.
B. Place centric crime paradigm
Studies suggest that individuals are at greater riskto commit crime at the presence of criminogenicopportunities[3]. Places and environments have charac-teristics that encourage or discourage the occurrence ofcrime and, therefore, raise or lower criminogenic risk.
In 2008 criminologist David Weinberg proposed switchto switch from popular people-centric to place-centricparadigm [4].
In contrast to previous research on the spatial distri-bution of crime, in which explanations were sought in the
Figure 1. Subway stations depicted atop of crime intensitybase map of Bogota. Darker colors depict higher total crimecounts based on 2007 and 2013 data.
social, demographic, and economic characteristics of theresident population, this study is mainly concerned withexamining block-to-block variations in land use.
One related study shows that the size of the resi-dent population, the racial and ethnic composition of theblock, and the poverty level in the block group do haveadditional effects beyond those of land use, but also sug-gest that the effects of crime attractors, generators andoffender anchor points are general and apply indepen-dently of whether they are located in residential blocksand independently of the specific characteristics of thepeople who live in the block [5]. Other spatially corre-
Figure 2. Homicide heat-map with hot-spots of predomi-nantly concentrated in southern and some northern parts ofBogota city.

3
Figure 3. Bus stops and police stations in parts of Bogotacity atop of street network base map.
lated factors also drive the distribution of crime incidentsat block level. The settings and times for which some fac-tors become most relevant should also be considered bypredictive model.
The risk of crime at places that have criminogenicattributes is sought to be higher than at other placesbecause these locations attract motivated offenders (aremore likely to concentrate them in close proximity) andcreate a backcloth for certain events to occur. Attrac-tors are those specific features that attract offenders toplaces in which they commit crime. Generators can beseen as greater opportunities for crime that burgeon fromincreased volume of interaction occurring at these areas,resulting in greater risk and likelihood of crime.
Various potentially relevant crime attractors and crimegenerators may include, for example, bus stops, parkingplaces, supermarkets, warehouses, bookstores, clothingstores, and pharmacies, as well such characteristics assigns of physical deterioration and the lack of collectiveefficacy [6]. Another study outlines the following key fac-tors related to urban residential burglary[7]: social dis-organization, proximity to pawn shops, proximity to busstops, time of the day, day of the week, proximity topolice stations, fire stations and hospitals.
Crime analytic dashboard was developed to identifyand communicate environmental attractors of crime. Thedashboard and an interactive map can be used to antic-ipate places most suitable for illegal behavior, identifywhere new crime incidents can emerge and/or cluster.All environmental factors that determine specific vulner-abilities are weighted by the model according to theirrelative spatial influence on the outcome event, and finalmap articulates the vulnerability in relative risk valuesas for any given geographic location across the terrain.
1. Units of analysis
A common thread among opportunity theorists is thatthe unit of analysis for ”opportunity” is a place, and thatthe dynamic nature of that place constitutes opportuni-ties for crime. The way in which features of a landscapeaffect places throughout the landscape is referred to asthe concept of spatial influence. Effective predictive mod-els need to incorporate small areas as units of analysis,which more accurately reflect ”micro-places”, such as cityblocks, street segments, and intersections.
Not all census blocks in Bogota are on a perfect grid.Some streets are diagonals and blocks along these streetsare triangles. Furthermore, census blocks are not onlybounded by streets but also by railways and natural bar-riers such as rivers and lakes and the mountains. There-fore using more detailed geographic features than censusblock boundaries could provide a deeper understandingof how spatial patterns of crime are influenced by the ge-ography and land use. Also a face block, the two sidesof a street between two junctions, is a natural spatialunit, not only because it is smaller than a block but alsobecause it is characterized by inter-visibility [8].
To model a continuous crime opportunity surface in ageographic information system, we use a grid of equallysized cells that comprise entire jurisdiction. Each cell rep-resents a micro place throughout the landscape, while thecell size is selected as a function of street segment/blocklength, so that environmental backcloth is constructedin a manner that reflects unique landscape of each ju-risdiction and its street network on which people traveland to which crimes are geo-coded. Half the mean blocklength guided the choice of cell size in a micro cellulargrid, which is more consistent with expectations aboutthe continuous nature of criminogenic risk[3].
Figure 4. Spatial view of the city divided into city blocks,coded with color.
4
2. Target variable
Choice of variables is critical to the success of themodel and must be informed by theory. Theory-basedmodeling enables to identify which factors influence crimetarget selection, and thus inform crime prevention efforts.Risk of crime in this study is seen as a function of vul-nerability within the context of other factors that carrydifferent weights relative one to another, therefore in theabsence of motivated offenders, the existent risk of crimecan be relatively low.
Analyzing risk terrains along with event-dependent as-sessments is useful for generating a more complete un-derstanding of crime problems. The study of spatial con-centrations of crime relies upon evidence-based methods,and do not rely on the physical or social characteristicsof individuals who enter and leave these locations, onlyon the geographic factors that make these places risky.
Crime risk can be modeled as a dichotomous variable,which is rarely or never zero. The risk posed by eachcriminogenic feature is located at one or more places on alandscape; their confluence at the same place contributesto a risk value that, when raised a set amount, increasesthe likelihood of crime.
Risk terrain modeling produces a metric for place-based opportunity, as measured by the spatial influencesof place-based risk factors to be used for measuring vul-nerable places. Opportunity can be measured in degreesand changes over space and time as our perceptions aboutthe environments evolve; as new crimes occur; as policeintervene; or as motivated offenders and suitable targetstravel. Hotspots can be used as a proxy measure of placeswhere the dynamic interactions of underlying crimino-genic factors exist or persist over time[3]. The risk valuesserve as a measure of the clustering of the risk factors,and forecast whether crime will occur or possibly cluster.
III. DATASETS
For our study we exploit datasets provided by the cityof Bogota, Colombia. Throughout the project we haveworking access to the following data:
1. Crime dataset contains historical crime recordsfor the city of Bogota. Among other fields this datasetcontains geographic coordinates (X,Y ) for over 100k ofcrimes commited between January, 2007 - March, 2013and include such fields, as: types of crime, street addressfor each of the crime scenes, along with ObjectId (ZIP -like Code, presumably - police district, or city block) inBogota. Each ObjectId has its own Coordinates specifiedas longitude and latitude.
2. Transportation dataset in .cvs format contains co-ordinates for subway stations in Bogota, together withcounts of passengers entering each station every 15 min-utes over the span of 2-3 years.
3. Bus Transit dataset lists dates, bus route numberswith corresponding Destination (names of final stops) to
which each bus is heading, with counts of passengers.4. Publicly accessible datasets in .csv format with co-
ordinates for Bus stops, Police Stations, Schools, Hospi-tals, Churches in Bogota, etc.
5. Demographic dataset for the city of Bogota in .shpformat. A set of Bogota borough profiles related to home-lessness, households, residential property sales, housingmarket and societal well-being. Borough profiles datasetscontain area codes, area names, metrics about the pop-ulation of a particular geographic area, such as statis-tics about the population, households, demographics, mi-grant population, ethnicity, employment, earnings, houseprices, indices of multiple deprivation, etc.
A. Data understanding
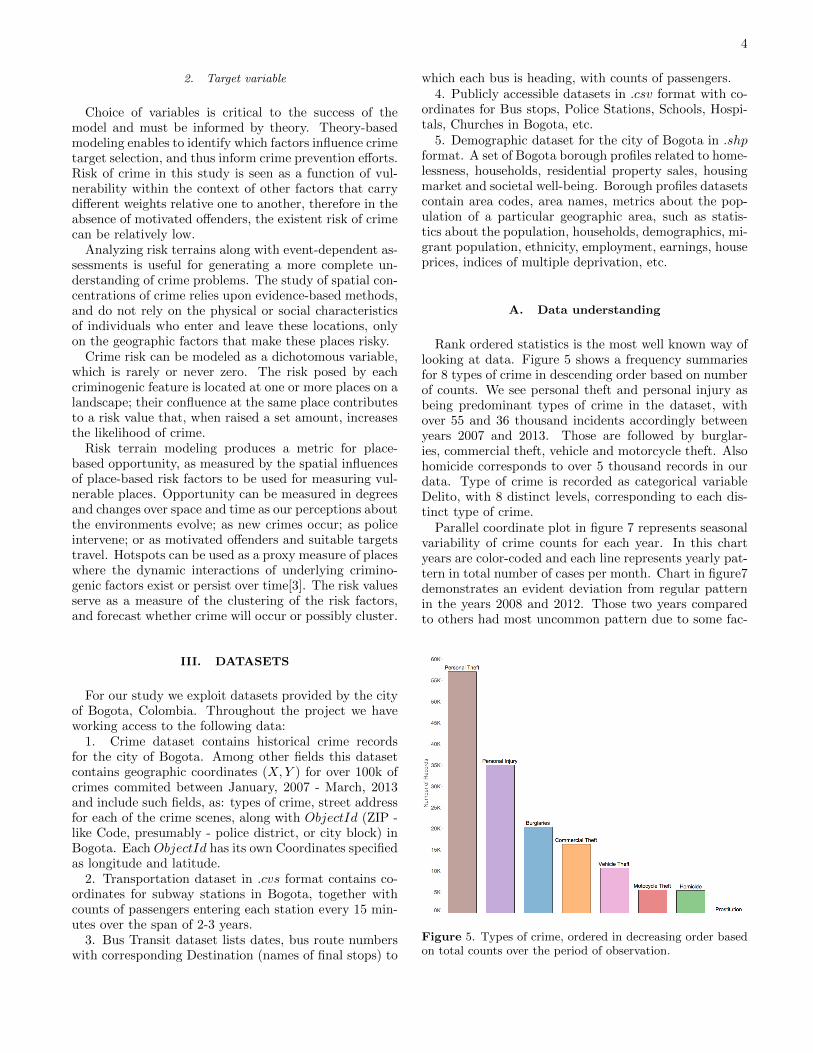
Rank ordered statistics is the most well known way oflooking at data. Figure 5 shows a frequency summariesfor 8 types of crime in descending order based on numberof counts. We see personal theft and personal injury asbeing predominant types of crime in the dataset, withover 55 and 36 thousand incidents accordingly betweenyears 2007 and 2013. Those are followed by burglar-ies, commercial theft, vehicle and motorcycle theft. Alsohomicide corresponds to over 5 thousand records in ourdata. Type of crime is recorded as categorical variableDelito, with 8 distinct levels, corresponding to each dis-tinct type of crime.
Parallel coordinate plot in figure 7 represents seasonalvariability of crime counts for each year. In this chartyears are color-coded and each line represents yearly pat-tern in total number of cases per month. Chart in figure7demonstrates an evident deviation from regular patternin the years 2008 and 2012. Those two years comparedto others had most uncommon pattern due to some fac-
Figure 5. Types of crime, ordered in decreasing order basedon total counts over the period of observation.

5
Figure 6. Seasonal variability of crime counts.
tors, which could have influenced crime counts in speci-fied time-frame. Considering, that presidential electionsin Colombia follow 4 year cycle, it might be safe to as-sume that those patterns could have been influenced par-tially or at large by the election campaigns taking place.
Time series chart in figure 6 provides a view of crimecounts variability over time. Stacked columns in thischart represent monthly totals split and color-coded bycrime type. This chart exhibits a significant dip in crimeduring first and second quarters of 2008, followed by spikein third quarter; crime counts also dipped even faster be-tween second and third quarters of 2012, and risen againin forth quarter. Such facts indicate presence of a longterm pattern within a span of 4 years of data. Notice,
Figure 7. Yearly seasonalities for different types of crime.Each line represents a year of data.
that this could support the hypothesis about correlationwith 4 year election cycles, mentioned before.
1. Data preparation
Following preprocessing steps were performed on data:1. Referencing all geo-tagged data to the cells.2. The features: for each of the variables related to the
cell the mathematical functions were computed to charac-terize the distributions and properties of such variables,e.g. mean, median, standard deviation, min and maxvalues, and Shannon entropy.
3. Bogota demographic profile feature has to be aggre-gated to each of the cells.
Correlation measures the numerical relationship of onevariable to another and are good for identifying variableswhich are related to each other. Pairs of highly corre-lated variables indicate redundancy in the data whichshould be considered, since redundant variables dont pro-vide new information to help with prediction, and somealgorithms can be harmed numerically by variables thatare highly correlated one to another. For high correlationvalues (greater than 0.95) a rule of thumb was applied:variables were considered identical, and treated as redun-dant variables by the model.
The final results can be very sensitive to the inputdata. Thus, if there are seasonal effects in the data, suchsensitivity can lead to spurious patterns or trends, whichcan make results difficult to reproduce. However, corre-lations are linear measures, which are affected severelyby outliers and skewness. Visualization is a good ideato verify that high correlation is real. Using parallel linechart we can see immediately which pairs of variables arehighly correlated all in one plot.
Chart in figure 8 displays weekly patterns for different

6
types of crime in the dataset. Each line represents a to-tal number of cases for each type of crime, based on theday of the week. Notice, how pattern for personal theftis different from pattern of personal injury, for example.While personal theft counts clime up on weekdays, per-sonal injury counts decrease; and spike on weekends forpersonal injuries corresponds to decline in personal theft.Such observations can indicate that weekly work/homecycles largely affect individual’s vulnerability for sometypes of crime.
2. Outliers and skew
Positive skew in variables results in mean values nolonger representing a typical value for the variable. Homevalues, for example are reported using the median ratherthan mean; because the mean gets inflated by the largevalues to the right of the distribution[9]. For positivelyskewed data log scale can be effective in changing thedata to see the data resolution and pattern better. Oncelog transform is applied, data will be in log units insteadof original units. The first indication of positive skew iswhen the mean is larger than the median. An additionalindicator is when the mode is less than the median, whichis also less than the mean.
Unsupervised learning technique - clustering was usedto identify multidimensional outlier. Clusters with rela-tively few values in them are indicative of unusual groupsof data, and therefore may represent multidimensionaloutliers. Dummy variables were created by the model toindicate whether the interaction is an outlier, as a mem-bership in a cluster of multidimensional outliers.
The assumption is that the outliers can distort themodel so much that they harm more than help. Thereforewe must remove outliers for linear regression, k-nearest
Figure 8. Weekly patterns of crime vary for different type ofcrime, and should be considered by the predictive model.
neighbor, K-Means clustering, and PCA. It is also pos-sible to separate the outliers and create separate modelsjust for outliers by relaxing the definition of an outlierfrom 3 standard deviations from the mean down to 2standard deviations from the mean. In some cases wewant to leave the outliers in the data without modifi-cation purposely allowing model to be biased. Decisiontrees, for example, are not affected by outliers[9].
Good features can make the patterns between inputsand the target variable far more transparent. In thiswork we generated a separate column dummy variable toindicate that the value is an outlier. We also transformthe outliers so that they are no longer outliers by binningthe data; and convert the numeric variables to categoricalto mitigate the numeric affect on the algorithms.
Finally, new additional features were added to the dataas new variables created from one or more existing vari-ables already in the data. Significant improvement inmodel performance metrics can be achieved by intro-ducing refined second order features, to allow capturinginter-temporal dependencies of the problem and to makethe feature space more compact.
IV. METHODOLOGY
Analyzing risk terrains along with event-dependent as-sessments is useful for generating a more complete under-standing of crime. Empirical research demonstrates thatincluding a measure of environmental risk yields a bettermodel of future crime locations compared to predictionsmade with past crime incidents alone[3]. Assuming thatevery new crime incident is a potential instigator for nearrepeats, priority can be given to new crimes that occurat high risk places with other high risk places in closeproximity.
Defining vulnerable places, therefore, is a function ofthe combined spatial influence of criminogenic featuresthroughout a landscape that contribute to crime by at-tracting and concentrating illegal behavior. Extra spatialfactors, such as knowledge about potential victims or of-fenders can also be considered. The steps in this workwere taken along the following road map:
1. Linking all information to the corresponding cells.
2. Data-set are randomly split into training (80% ofdata) and testing (20% of data) sets. Each dimension ofthe feature vector was normalized.
3. Pearson correlation analysis yields a large subset offeatures with strong mutual correlations and a subset ofuncorrelated features.
4. Pipeline variable selection approach, based on fea-ture ranking and feature subset selection is performedusing only data from the training set. Top variables-predictors of crime are being identified by our model,sorted by the mean reduction in accuracy.
Given the high skewness of the distribution and basedon previous research and ground-truth data about counts

7
Figure 9. Monthlly patterns for different types of crime reveal the nature of change in the total counts.
of crimes in each given sell, we split the criminal datasetwith respect to it’s median into these seven classes:
a) ”class −3”: median − 3σ ≤ N ≤ median − 2σ;
b) ”class −2”: median − 2σ ≤ N ≤ median − σ;
c) ”class −1”: median − σ ≤ N ≤ median;
d) ”class +1”: median ≤ N ≤ median + σ;
e) ”class +2”: median + σ ≤ N ≤ median + 2σ;
f) ”class +3”: median + 2σ ≤ N ≤ median + 3σ;
g) ”class 0 ”: median + 3σ ≤ N ≤ median − 3σ.
Algorithms automate most steps of risk terrain model-ing. Clustering groups data records into similar groups,and classification techniques assign data records to cate-gories (commonly referred to as classes). The algorithmtests a variety of spatial influences for every risk factorinput to identify the most grounded spatial associationswith known crime incident locations and considers onlythe most appropriate risk factors with their spatial influ-ences to produce risk terrain surface.
The exposure to personal crime in an area normallyincludes both the resident and the transient population(Andresen 2006), those who live in the area and thosewho visit the area. Note that the transient populationsize is not measured directly but is presumed to be incor-porated in the effect of the other variables[10]. In otherwords, crime generators generate crime by drawing anenlarged transient population into the block. Shannonentropy reflects the predictable structure of a place interms of the types of people present over the day[11].
Clustering algorithms are commonly used as part ofdata exploration in order to find commonalities acrosscrimes [2]. For example, clustering was applied on a dataset of burglaries to find those exhibiting similar tactics.These can be evidence of a serial burglar, or could suggestinterventions against some of the clusters. As a specificexample, Adderley and Musgrove had clustered perpetra-tors of serious sexual assaults using self-organizing maps[12]. SOM cluster observations with similar traits intorelated groups to identify crimes committed by the sameindividual because of such similarities.
The information could be fed into the hot spot mod-els to identify the perpetrators next target, or it could beused for geographic profiling methods to identify the per-petrators home base. Unsupervised learning techniquescan project high dimensional data onto two dimensions.Multidimensional scaling (MDS) algorithms, such as theSammon Projection, try to retain the relative distance ofdata points in the 2D projection as found in higher di-mensional space could be another option. A simpler wayis to use color, size, and shape.
The metric for feature ranking can be the mean de-crease in the Gini coefficient of inequality. The featurewith maximum mean decrease in Gini coefficient is ex-pected to have the maximum influence in minimizing theout-of-the-bag error. Minimizing the out-of-the-bag er-ror results in maximizing common performance metricsused to evaluate models.
When there is considerable overdispersion in the data(alpha value of 1.24), the negative binomial models mightfit the data better than a Poisson model. Therefore the-
Figure 10. Personal injury patterns by month and day of theweek sgow, that Sunday is the likeliest day for this crime.

8
oretical arguments were put forward to use (negative bi-nomial) regression models with lagged independent vari-ables rather than spatial error or spatial lag regressionmodels [5].
V. RESULTS AND EVALUATION
Place-based risk assessment with risk terrain modelingpermits real-time evaluation of the propensity for a newcrime to become an instigator for near repeats.
Some activities in adjacent blocks are correlated (i.e.,spatial autocorrelation in the independent variable) andare the effects of activities in adjacent focal block accord-ing to the model’s interpretation. Thus, for example, thepresence of a gas station in the block increases robberiesin the block, but so does the presence of a gas stationin an adjacent block. Thus, the land uses that attractcrime have similar crime-attracting repercussions on theadjacent blocks.
Some recent studies support the hypotheses that crimegenerators, crime attractors, and offender anchor pointsincrease the number of robberies. For example, addinga liquor store to the block may increase the expectednumber of robberies by 67 percent, and the blocks witha gas station have more than 4 times as many robberiesas similar blocks without a gas station.
Heatmap in figure 12 depicts clustering of personaltheft along south-east to central-north direction, whichis reminiscent with subway line path in figure 1. Anothercluster of personal injuries lays in south-west part of Bo-gota, where other carcinogenic features might be strong.Notice, that density of overlapping records is plotted infigure1 to see darker colors for more common patternsand lighter for less common ones.
Figure 11. Seasonality of commercial theft counts by monthand day of the week Sunday is the least likely day for such.
Figure 12. Interactive map view depicting concentraton ofnear repeat incidents in central part of Bogota.
VI. DISCUSSION
In urban crime analytics domain, an important issue isthe development of collaborative crime information sys-tems that integrate historical crime data, geographicaldata with dynamics of people flow. Such systems can beof great interest for many applications related to moni-toring and analysis of crime dynamics, where people flowas well as network properties are changing in fast andalmost continuous mode. This work aims to introduce aframework consisting of crime analytics dashboard, GISand several specialized applications to support predictivepolicing effort in real time with lack of resources.
All predictive techniques depend on data. Both thevolume and the quality of these data will determinethe usefulness of any approach. The saying garbage in,garbage out strongly applies to these analyses. Effortsshould be made to ensure that data are accurate andcomplete, though some techniques are less sensitive tosmall errors than others [2].
Ideally GIS software should have a data creation ETL-tool and/or wizard that simplifies data creation steps.Crime analysts work in tactical environments where theywork with data in real time leaving little room for cum-bersome multi-step processes [13]. Occasionally analystsneed to create new, unique data layers. Comprehen-sive GIS software needs to include geoprocessing toolsfor extracting and clipping features from larger collec-tions, merging map layers, editing spatial and attributefeatures of map layers.
It is recommended that the most efficient and usefulway to make use of RTM in investigating the risk of ur-ban residential burglary based on the surrounding en-vironmental context is by conducting an analysis at acitylevel [7]. It is believed that at this level of spatialanalysis, the identification of crime correlates and tem-

9
poral features will produce information that is not onlyinsightful but also practical.
VII. IMPLICATIONS AND LIMITATIONS
Hotspot maps, for instance, show the concentration ofcrime but offer little in the sense of context. By articulat-ing the environmental context of crime incident locations,risk terrain modeling helps to identify and prioritize spe-cific areas and features of the landscape to be addressedby a targeted intervention.
Strategies to address crime problems, therefore, mustincorporate both the spatial and temporal patterns of re-cent known crime incidents and the environmental risksof micro places if they are to yield the most efficientand actionable information for police resource allocation.Looking ahead, it could be useful to move beyond pre-dictions towards offering explicit decision support for re-source allocation and other decisions. To be useful in lawenforcement, predictive policing methods must be a partof a comprehensive crime prevention strategy.
The speed at which analytic dashboard operates de-pends heavily on the processing capabilities of the com-puter on which it is installed. Therefore, it is highlyrecommended that you install and operate this softwareon a cloud computer or server with abundant memory.
Finally, the most important measure of a crime fore-casting is whether it aids in crime control and prevention,and how the outputs of models translate into practice [1].In thinking about these needs, it is important that the
value of predictive policing tools is in their ability to pro-vide situational awareness of risks and the informationneeded to act on those risks and prevent crime [2].
VIII. CONCLUSION
In conclusion many analysts and investigators have aprofessional interest in how these approaches improvetheir work and make it more useful; police chiefs areeager to find new techniques to reduce crime withoutadding to their workforce; and the private sector seespotential funding from research grants, consulting, andsoftware development. Policing methods, including pre-dictive analyses, could be useful for peacekeeping appli-cations as well.
Large agencies with large volumes of incident and in-telligence data that need to be analyzed and shared willwant to consider more advanced and, therefore, more ef-fective systems. It is helpful to think of these as enter-prise information technology systems [2]. Such systemsmake sense of large datasets to provide situational aware-ness to decision makers and to the public. These systemshelp agencies understand the where, when, of crime andidentify the specific problems that drive crime in orderto take action against them. The predictive policing sys-tems provide the shared situational awareness needed tomake decisions about where and how to take action. De-signing intervention programs that take these attributesinto account, in combination with solid predictive ana-lytics, can go a long way ensuring that predicted crimerisks do not become real crimes.
[1] Elizabeth R. Groff and Nancy G. La Vigne. Forecastingthe future of predictive crime mapping. Crime Preven-tion Studies, 13(1):29–57, 2002.
[2] Walter L. Perry, Brian McInnis, Carter C. Price, Su-san C. Smith, and John S. Hollywood. Predictive Polic-ing. The Role of Crime Forecasting in Law EnforcementOperations. RAND Corporation, 2013.
[3] Leslie W. Kennedy, Joel M. Caplan, and Eric L. Piza. APrimer on the Spatial Dynamics of Crime Emergence andPersistence. Rutgers Center on Public Security, Newark,NJ, 2012.
[4] Samuel Kirson Weinberg. Theories of Criminality andProblems of Prediction. The Journal of Criminal Law,Criminology, and Police Science, 45(4):412–424, 1954.
[5] Richard Block Wim Bernasco. Robberies in chicago: Ablock-level analysis of the influence of crime generators,crime attractors, and offender anchor points. Journal ofResearch in Crime and Delinquency, 48(1):33–57, 2011.
[6] Peter K. B. St. Jean. Pockets of Crime: Broken Win-dows, Collective Efficacy, and the Criminal Point ofView. University Of Chicago Press, Chicago, IL, 2007.
[7] William D. Moreto. Risk Factors of Urban Residen-tial Burglary. [Research Brief Series Dedicated to SharedKnowledge]. RTM Insights, 4(4):1–3, 2010.
[8] William R. Smith, Sharon Glave Frazee, and Elisabeth L.Davison. Furthering the Integration of Routine Activ-ity and Social Disorganization Theories: Small Units ofAnalysis and the Study of Street Robbery as a DiffusionProcess. Criminology, 38(2):489–524, 2000.
[9] Dean Abbott. Applied Predictive Analytics. Principlesand Techniques for the Professional Data Analyst. JohnWiley Sons, Inc., Indianapolis, IN, 2014.
[10] David Weisburd, Wim Bernasco, and Gerben J. N. Bru-insma. Units of analysis in geographic criminology: His-torical development, critical issues, and open questions.Putting Crime in Its Place: Units of Analysis in Geo-graphic Criminology, pages 3–34, 2009.
[11] Andrey Bogomolov. Once Upon a Crime: Towards CrimePrediction from Demographics and Mobile Data. TheJournal of Criminal Law, Criminology, and Police Sci-ence, 1409(1):2983, 2014.
[12] Richard Adderley and Peter B. Musgrove. Data min-ing case study: Modeling the behavior of offenders whocommit serious sexual assaults. Proceedings of the 7thACM SIGKDD International Conference on KnowledgeDiscovery and Data Mining by Association for Comput-ing Machinery, 2001.
[13] International Association of Crime Analysts. GIS Soft-

10
ware Requirements for Crime Analysis (White Paper2012-01). Standards, Methods, Technology (SMT) Com-
mittee, Overland Park, KS, 2012.