cricket media group ltd. interim report · cricket media group ltd. unaudited condensed...
TRANSCRIPT

Cricket Media Group Ltd. Interim Report September 30, 2015

Condensed Consolidated Interim Financial Report
Cricket Media Group Ltd.
For the three and nine months ended September 30, 2015 and 2014
(Unaudited - Prepared by Management)

Cricket Media Group Ltd.
Unaudited Condensed Consolidated Interim Financial Report
September 30, 2015 and 2014
Contents Page
Condensed Consolidated Interim Statements of Financial Position 1 Condensed Consolidated Interim Statements of Comprehensive Loss 2 Condensed Consolidated Interim Statements of Changes in Equity (Deficit) 3 Condensed Consolidated Interim Statements of Cash Flows 4 Notes to the Condensed Consolidated Interim Financial Report 5 - 24

The accompanying notes are an integral part of these condensed consolidated financial statements.
1
Cricket Media Group Ltd.
Condensed Consolidated Interim Statements of Financial Position
September 30, 2015 and December 31, 2014
(Unaudited)September 30, December 31,
2015 2014
Current assetsCash & cash equivalents 1,088,857$ 912,565$ Accounts receivable, net of allowance for doubtful accounts (Note 5) 1,006,572 968,678 Inventory 404,550 448,770 Other current assets 880,018 915,231 Current assets held for sale (Note 3) 525,157 676,399
Total current assets 3,905,154 3,921,643
Property and equipment, net 151,363 261,824 Investment in NeuPals (Note 7) 439,548 540,266 Goodwill 13,519,899 13,519,899 Other intangible assets, net 4,499,200 4,375,055 Restricted cash 76,432 76,277 Other assets 111,848 63,231 Long-term assets held for sale (Note 3) - 1,275
Total assets 22,703,444$ 22,759,470$
Current liabilitiesAccounts payable and accrued expenses 5,195,909$ 5,785,970$ Accrued interest 1,997,242 1,010,689 Deferred revenue, current 4,159,406 6,267,928
Notes payable, current portion (Note 8) 260,076 1,470,000 Notes payable to related parties (Note 8) 3,500,000 1,050,118 Bridge loan debentures (Note 8) 6,420,946 - Finance lease obligations, current 34,084 46,554 Other current liabilities 178,037 168,992 Current liabilities held for sale (Note 3) 523,073 565,127
Total current liabilities 22,268,773 16,365,378
Secured convertible debentures (Note 4 and 8) 16,288,092 18,710,994 Deferred revenue, less current portion 668,395 689,875 Notes payable, less current portion (Note 8) 1,102,035 - Finance lease obligations, less current portion 43,376 70,953 Other liabilities 11,440 11,440
Total liabilities 40,382,111 35,848,640
Commitments and contingencies (Note 13)
Stockholders' equity (deficit)Share capital (Note 9) 115,735,473 115,057,827 Additional paid-in-capital 14,448,076 12,744,057 Accumulated deficit (146,269,992) (139,259,881) Accumulated other comprehensive loss (100,176) (139,125) Less: Treasury stock (28,800 shares) (1,492,048) (1,492,048)
Total stockholders' equity (deficit) (17,678,667) (13,089,170)
Total liabilities and stockholders' equity (deficit) 22,703,444$ 22,759,470$
Assets
Liabilities and Stockholders' Equity (Deficit)

The accompanying notes are an integral part of these condensed consolidated financial statements.
2
2015 2014 2015 2014
Revenue (Note 11) 2,834,468$ 2,843,444$ 9,693,897$ 10,379,099$
Operating expenses:1,826,525 1,893,530 5,970,622 6,210,960
Technology, research & development costs 474,325 1,109,325 1,717,394 3,441,196 710,075 785,365 1,880,832 2,374,113
General and administrative expenses 1,331,273 1,484,016 4,229,933 4,796,578 Marketing and promotion expenses 1,878,707 2,836,048 3,497,120 4,573,791 Stock-based compensation (Note 10) 24,556 42,714 126,777 291,241 Depreciation & amortization 200,679 243,536 610,861 725,447 Loss on investment in NeuPals (Note 7) 24,869 58,938 100,718 227,701
- (45,261) - (135,782) - 2,962,470 - 2,962,470
Total operating expenses 6,471,009 11,370,681 18,134,257 25,467,715
Loss from operations (3,636,541) (8,527,237) (8,440,360) (15,088,616)
Other income (expense):Change in fair value of derivatives (Note 4) 86,800 - 13,600 63,750 Interest expense, net (534,318) (1,118,902) (1,379,624) (3,254,472)
2,687 - 2,687 52,571 Net foreign currency exchange gain 1,572,377 926,845 2,702,483 944,134
Loss from continuing operations (2,508,995) (8,719,294) (7,101,214) (17,282,633)
Income from discontinued operations 58,426 39,170 91,103 7,594
Net Loss (2,450,569) (8,680,124) (7,010,111) (17,275,039)
Other comprehensive income :Items that may be subsequently reclassfied into net income/loss
Foreign currency translation (15,411) 4,647 38,949 30,817
Total comprehensive loss (2,465,980)$ (8,675,477)$ (6,971,162)$ (17,244,222)$
Net loss per common share - basic and diluted:Continuing operations (0.08) (0.45) (0.23) (1.11) Discontinued operations - - - -
Net loss per share - basic and diluted (0.08)$ (0.45)$ (0.23)$ (1.11)$
Weighted average number of common shares:Basic and diluted 31,003,917 19,248,893 30,782,473 15,493,339
Three Months Ended September 30,
Nine Months Ended September 30,
Change in estimated fair value of acquisition share considerationImpairment of goodwill and intangible assets (Note 6)
Other income
Cost of sales
Operations and support expenses
Cricket Media Group Ltd.
Condensed Consolidated Interim Statements of Comprehensive Loss
Three and Nine months Ended September 30, 2015 and 2014 (Unaudited)

The accompanying notes are an integral part of these condensed consolidated financial statements.
3
Cricket Media Group, Ltd.
Condensed Consolidated Interim Statements of Changes in Equity (Deficit)
Nine months Ended September 30, 2015 and 2014 (Unaudited)
Shares Dollars Shares Dollars Shares DollarsBalance at December 31, 2014 5,526,997 60,689,552$ 23,003,009 54,368,275$ (28,800) (1,492,048)$ 12,744,057$ (139,259,881)$ -$ (139,125)$ (13,089,170)$ Conversion from restricted to voting common stock 111,361 489,280 (111,361) (489,280) - - - - - - - Forgiveness of related party debt - - - - - - 1,000,000 - - - 1,000,000 Issuance of common stock in private placement 2,194,723 641,869 - - - - 608,131 - - - 1,250,000
Share issuance costs - (16,453) - - - - - - - - (16,453) Stock compensation: stock options - - - - - - 82,281 - - - 82,281 Stock compensation: restricted share units - - - - - - 80,816 - - - 80,816 Vesting of restricted common stock 115,385 24,817 225,551 35,177 - - (59,994) - - - -
Net loss - - - - - - - (7,010,111) - - (7,010,111) Foreign currency translation - (7,764) - - - - (7,215) - - 38,949 23,970 Balance at September 30, 2015 7,948,466 61,821,301$ 23,117,199 53,914,172$ (28,800) (1,492,048)$ 14,448,076$ (146,269,992)$ -$ (100,176)$ (17,678,667)$
Balance at December 31, 2013 4,311,397 59,651,648$ 7,672,744 45,261,083$ (28,800) (1,492,048)$ 7,352,232$ (116,809,681)$ (1,876)$ (151,838)$ (6,190,480) Conversion from restricted to voting common stock 2,075 5,258 (2,075) (5,258) - - - - - - - Warrants exercised - - 235,834 403,542 - - - - - - 403,542 Issuance of common stock to satisfy debt obligations - - 8,992,989 6,422,918 - - 2,755,542 - - - 9,178,460 Issuance of common stock in private placement 506,247 686,938 986,924 1,150,750 - - 535,987 - - - 2,373,675
Stock compensation: stock options - - - - - - 173,929 - - - 173,929 Stock compensation: restricted share units 18,993 22,833 37,312 26,522 - - 65,840 - - - 115,195 Stock compensation: warrants - - - - - - 10,026 - - - 10,026 Vesting of restricted common stock - - - - - - - - 1,876 - 1,876
Net loss - - - - - - - (17,275,039) - - (17,275,039) Foreign currency translation - (2,039) - - - - (2,441) - - 30,817 26,337 Balance at September 30, 2014 4,838,712 60,364,638$ 17,923,728 53,259,557$ (28,800) (1,492,048)$ 10,891,115$ (134,084,720)$ -$ (121,021)$ (11,182,479)$
Total Stockholders' (Deficit) EquityVoting Common Stock
Restricted Voting Common Stock Treasury Stock
Additional Paid-In Capital
Accumulated Deficit
Unvested Voting Common Stock
Accumulated Other
Comprehensive Loss

The accompanying notes are an integral part of these condensed consolidated financial statements. 4
Cricket Media Group, Ltd.
Condensed Consolidated Statements of Cash Flows
Nine months Ended September 30, 2015 and 2014 (Unaudited)
2015 2014Cash flows from operating activities:
Net loss from continuing operations $ (7,101,214) $ (17,282,633) Adjustments to reconcile net loss to net cash used in operating activities:
Gain from change in fair value of derivatives (Note 4) (13,600) (63,750) Depreciation and amortization 610,861 725,447 Stock-based compensation (Note 10) 126,777 291,241 Bad debt recovery, net 123,954 (179,923) Loss on investment in NeuPals (Note 7) 100,718 227,701 Amortization of financing costs from debentures (see Note 8) 189,142 1,953,132 Net foreign currency exchange gains (2,702,483) (944,134) Restricted share vesting - 1,876 Change in estimated fair value of acquisition consideration - (135,782) Impairment of goodwill and intangible assets (Note 10) - 2,962,470 Changes in operating assets and liabilities:
Accounts receivable (135,524) 17,172 Inventory 44,220 (321,529) Other current assets 65,212 (232,115) Accounts payable and accrued expenses 432,809 604,029 Deferred revenue (2,130,002) (2,360,961) Other 76,888 64,977
Total adjustments (3,211,028) 2,609,851
Net cash used in continuing operations (10,312,242) (14,672,782) Net cash provided by discontinued operations 110,244 242,549 Net cash used in operating activities (10,201,998) (14,430,233)
Cash flows from investing activities:Cash paid for acquisitions - (174,794) Cash received for sale of Nexify business 35,000 - Purchases of equipment - (47,342) Cash paid for patents and owned permissions (563,480) (459,209)
Net cash used in investing activities (528,480) (681,345)
Cash flows from financing activities:Proceeds from bridge financing debentures, net of financing costs (see Note 8) 6,356,160 - Proceeds from related party line of credit (see Note 8) 5,297,000 9,700,118 Proceeds from private placement, net of expenses 1,250,000 2,452,806 Repayments on related party line of credit (1,847,118) - Repayments on bank line of credit / promissory note (107,889) - Payments on finance lease obligations (40,047) (54,401) Proceeds from exercise of stock warrants - 399,882
Net cash provided by financing activities 10,908,106 12,498,405
Increase (decrease) in cash and equivalents 177,628 (2,613,173)
Effect of exchange rates on cash (1,336) (2,821)
Cash & cash equivalents at the beginning of the period 912,565 3,641,985 Cash & cash equivalents at the end of the period $ 1,088,857 $ 1,025,991
Non-cash financing activities:Forgiveness of related party debt - reclass to contributed capital $ 1,000,000 $ - Issuance of common shares in connection with acquisition consideration liabilities - 150,000 Issuance of common shares related to credit facility with related party - 9,050,000
Supplemental disclosures of cash flow information:Cash paid for interest $ 54,706 $ 958,462 Cash paid for income taxes 14,684 11,907
Nine Months Ended September 30,

5
Cricket Media Group Ltd.
Notes to the Condensed Consolidated Interim Financial Report (unaudited)
September 30, 2015 and 2014
NOTE 1 - Organization and Significant Accounting Policies Cricket Media Group Ltd. (“Cricket Media” or the “Company”), formerly ePals Corporation, was incorporated under the laws of the Province of Alberta on July 14, 2010. Previously classified as a Capital Pool Company as defined in Policy 2.4 of the TSX Venture Exchange (“TSX-V”), the Company completed a “qualifying transaction” as defined under the policies of the TSX-V on July 26, 2011 when it acquired Cricket Media, Inc. (formerly “ePals, Inc.”) pursuant to a statutory procedure to form “ePals Corporation” (“Merger”). In connection with the Merger, the Company continued under the laws of the Province of Ontario. The Company’s voting common shares trade on the TSX-V under the new stock symbol “CKT.” In July 2014, the TSX-V approved the consolidation of the Company’s issued and outstanding voting and restricted voting common shares, each on the basis of one post-consolidation share for every 25 pre-consolidation shares. The post-consolidation voting common shares commenced trading on the TSX-V as of July 10, 2014. This adjustment has been reflected for all periods presented in the financial statements. Cricket Media is an education media company that provides award-winning content on a safe and secure learning network for children, families and teachers across the world. Cricket Media’s popular media brands for toddlers to teens include Babybug®, Ladybug®, Cricket® and Cobblestone® with multiple language editions and apps in English, Spanish and Mandarin. In addition to activities associated with the sale of print and digital content, the Company licenses its content and innovative technology associated with its collaborative social media platform. The Company’s digital K-12 products for school and home include the ePals global community (the Company’s network of classrooms that allows teachers and students to safely connect and collaborate with other classrooms around the world) as well as In2Books®, a Common Core eMentoring program that builds reading, writing and critical thinking skills. Basis of presentation This unaudited condensed consolidated interim financial report and the notes thereto have been prepared in accordance with International Financial Reporting Standards (“IFRS”) as issued by the International Accounting Standards Board, is presented in United States dollars (unless otherwise noted) and has been prepared on a going concern basis (see Note 2). The disclosures contained in this condensed consolidated interim financial report comply with IAS 34 Interim Financial Reporting and do not include all IFRS requirements for annual financial statements. This condensed consolidated interim financial report should be read in conjunction with the consolidated audited financial statements of the Company, including the notes thereto, for the year ended December 31, 2014 that are filed under the Company’s SEDAR profile at www.sedar.com. In the opinion of management, the accompanying condensed consolidated interim financial report includes all adjustments to present fairly the financial position and the results of operations of the Company as of and for the three and nine months ended September 30, 2015 and 2014. This condensed consolidated interim financial report follows the same accounting policies and methods of application as the most recent consolidated annual financial statements of the Company. Interim results are not necessarily indicative of the results that may be expected for a full year. During the fourth quarter of 2014, the Company determined its Nexify advertising business and Open Court commerce business no longer fit the Company’s overall strategy. As a result, the Company began actively marketing these businesses for sale with the expectation that these businesses would be sold during 2015. As such, the Company has classified the assets and liabilities associated with these businesses as held for sale and the operations as discontinued operations. Prior period statements have been updated for comparative purposes to reflect this classification. The Nexify business was sold in July 2015.

6
The Company has one segment as of and for the nine months ended September 30, 2015. The Company’s geographic area of operation is currently predominantly the United States. Exports or foreign sales to locations outside the United States are currently not significant. Per share information for all periods presented, including common shares, outstanding equity instruments and per share dollar amounts, reflect the 25:1 share consolidation discussed above. Principles of consolidation This condensed consolidated interim financial report includes the accounts of Cricket Media, its wholly owned subsidiaries, Cricket Media, Inc., Carus Publishing Company (“Carus”), and ePals-Nexify, Inc., and ePals Foundation which is an entity in which Cricket Media, Inc. holds a controlling interest. All material intercompany balances and transactions have been eliminated in consolidation. Research and development costs Research costs are expensed as incurred. Development costs are capitalized when a specific product is determined to be technically feasible, when there is an intention to produce the product in a clearly defined future market and adequate resources exist to complete the project. Based on the Company’s product development process, technological feasibility generally occurs on completion of a working model of the Company’s product. To date, development costs incurred between the completion of a working model of the Company’s product and the general release of the product have been minimal. As a result, the Company has not capitalized development costs as of September 30, 2015 or 2014. For the three months ended September 30, 2015 and 2014, the Company expensed research and product development costs of $171,441 and $569,914, respectively, as classified in “Technology, research & development costs” on the accompanying condensed consolidated interim statements of comprehensive loss. For the nine months ended September 30, 2015 and 2014, the Company expensed research and product development costs of $648,291 and $1,498,435, respectively. Earnings (loss) per share Cricket Media Group Ltd. and Cricket Media, Inc.’s outstanding stock options and warrants to acquire the Company‘s restricted voting and voting common shares, convertible debentures and unvested restricted share units have been excluded in the basic and diluted net loss per common share calculations due to their anti-dilutive effect on earnings per share. Foreign currency The Company’s consolidated financial statements are presented in United States dollars (“USD”) which is its functional currency. Certain transactions are denominated in Canadian dollars (“CAD”) and are converted monthly by the Company into USD. Translation into USD is made in accordance with IAS 21 The Effects of Changes in Foreign Exchange Rates. All non-monetary assets and liabilities of subsidiaries denominated in CAD are translated into USD at exchange rates in effect at the end of each fiscal period. Adjustments resulting from the translation of financial statements of Canadian subsidiaries into USD are included in the “foreign currency translation” lines of the accompanying condensed consolidated interim statements of changes in equity and condensed consolidated interim statements of comprehensive loss and the “effect of exchange rates on cash” line in the accompanying condensed consolidated interim statements of cash flows. The “net foreign currency exchange gains (losses)” line in the accompanying condensed consolidated interim statements of comprehensive loss represents actual foreign currency exchange losses from cash received in CAD as opposed to the Company’s functional currency, USD and the translation of assets and liabilities denominated in CAD from transactions to be settled in that currency. Reclassifications of previously reported amounts Certain immaterial reclassifications have been made to prior periods to conform to the current presentation.

7
Use of estimates In the application of the Company's accounting policies, management is required to make judgments, estimates and assumptions about the carrying amounts of assets and liabilities that are not readily apparent from other sources. The estimates and associated assumptions are based on historical experience and other factors that are considered to be relevant. Actual results may differ from these estimates. The estimates and underlying assumptions are reviewed by the Company on an ongoing basis. Revisions to accounting estimates are recognized in the period in which the estimate is revised if the revision affects only that period or in the period of the revision and future periods if the revision affects both current and future periods. New accounting standards There are no new accounting standards issued during the nine months ended September 30, 2015 that had a material effect on the accompanying unaudited condensed consolidated interim financial report. There are no relevant changes in accounting standards applicable to future periods other than those disclosed in the most recent consolidated annual financial statements of the Company as of and for the year ended December 31, 2014. Subsequent events The Company evaluated this unaudited condensed consolidated interim financial report for subsequent events through the date this financial report was issued and filed with applicable securities regulatory authorities in Canada. The Company is not aware of any subsequent events which would require recognition or disclosure in this condensed consolidated interim financial statements other than those disclosed in Note 14. NOTE 2 – Going Concern and Liquidity This condensed consolidated interim financial report for the three and nine months ended September 30, 2015 and the notes thereto have been prepared on a going concern basis even though the Company currently has insufficient cash to fund its expected net operating shortfall for the next 12 months. In assessing whether the going concern assumption was appropriate, management took into account all relevant information available to it about the future, which was at least, but not limited to, the 12 month period following September 30, 2015. In order to fund its operating shortfall, the Company has been exploring various financing strategies and strategic alternatives including corporate-based, financial investor-based and private equity-based financings, strategic combinations, cost reduction initiatives, and other alternatives. The Company believes that based on the financial strength of its existing shareholder base and previous success in raising capital, any shortfall in its operating plan may be met through one or more of these strategies. During the nine months ended September 30, 2015, the Company had a net loss of $7,010,111, negative cash flow from operations of $10,201,998 and a negative working capital of $18,363,619. Historically the Company has had operating losses, negative cash flows from operations, and working capital deficiencies. The Company is subject to liquidity risks generally associated with early-stage media and technology companies, which include fluctuations in operating expenses and revenues, and challenges in securing further equity or debt financing which is subject to prevailing market conditions at that time. If it does not raise alternative financing before exhausting its cash reserves, the Company could be forced to alter its current business plan and expenditure levels. As a positive operating cash flow position has yet to be achieved, the Company currently has insufficient cash to cover its known operating expenditures for the next 12 months and will continue to evaluate its financing alternatives. There can be no assurance that management will be successful in raising the necessary capital required to fund planned operations, or that financing with acceptable terms will be available. These uncertainties may cast significant doubt upon the Company’s ability to continue as a going concern and/or uncertainty related to the capital structure of the Company. However, as described above, management has a reasonable expectation that the Company will continue for the foreseeable future. If for any reason, the Company is unable to continue as a going concern, it could have an adverse effect on the Company’s ability to realize assets at their recognized values, in particular goodwill and intangible assets, and to extinguish liabilities in the normal course of business at the amounts stated in this unaudited condensed consolidated interim financial report.

8
During the nine months ended September 30, 2015, the Company borrowed approximately $5.3 million and repaid approximately $1.8 million under its related party line of credit with ZG Ventures, LLC (“ZG”), an affiliate of two members of the Company’s Board of Directors, and also raised net proceeds of approximately $6.4 million through the issuance of debentures under its bridge loan financing (the “2015 Bridge Debentures”) that is part of the Company’s overall debt restructuring. Additionally, ZG forgave $1,000,000 of debt outstanding under the related party line of credit in March 2015. The Company also issued approximately 2.2 million Units at a price of CAD$0.65 per Unit for proceeds of approximately $1.25 million under a non-brokered private placement. Each Unit consisted of one common share of the Company and one-third of on common share purchase warrant (each whole common share purchase warrant, a “Warrant”). Each Warrant entitled the holder to purchase one additional common share of the Company at a price of CAD$0.65 until March 31, 2015. See Note 9 for additional information on the private placement transactions. The Company actively manages its liquidity through cash, debt and capital stock management strategies to fulfill obligations associated with financial liabilities, mainly accounts payable, accrued liabilities, the 2012 Debentures and the 2013 Debentures (each as defined in Note 8). To manage liquidity risk, the Company, among other things, prepares budgets and cash forecasts and monitors its performance against these projections. Management also monitors cash and working capital efficiency given current sales levels and seasonal variability. At September 30, 2015, the Company had $1,088,857 in cash and a $3,500,000 revolving line of credit with insiders, as discussed in Note 8. The Company was fully drawn under the $3,500,000 revolving line of credit as of September 30, 2015. See Note 14, “Subsequent Events” for additional information on the Company’s financing activities. The 2012 Debentures and 2013 Debentures have a maturity date of October 31, 2016. In March 2015, the Company reached an agreement to restructure its debt outstanding under the 2012 Debentures and 2013 Debentures. See Note 8 for additional information on the debt restructuring. The 2015 Bridge Debentures (as defined in Note 8) have a maturity date of April 30, 2016. Future capital requirements will depend on many factors, including, without limitation, the rate of revenue growth, the expansion of marketing and sales activities, the timing and extent of spending to support product development efforts and expansion into new territories, the timing of the release of new products and services and enhancements to existing products and services, acquisition activity, the timing of capital expenditures and expenses associated with web hosting and the continuing market acceptance of the Company’s products and services. NOTE 3 – Discontinued Operations and Disposal Groups Held For Sale Nexify The Company’s former Nexify business, whose Newstogram widget is installed on a network of partner sites, is a service that provides internet publishers and media companies with “smart” aggregation of content and data and predictive personalization services with respect to advertising to cultivate user relationships and enhance audience engagement. Newstogram develops an understanding of each unique user’s interests and affinities by observing user behavior and performing analysis of web content viewed. Newstogram then identifies and presents advertising content that is relevant to each user based on statistical models and dedicated matching functions.

9
The following is key financial information related to the Nexify business as of September 30, 2015 and December 31, 2014 and for the three and nine months ended September 30, 2015 and September 30, 2014:
September 30, December 31,2015 2014
Total current assets -$ 158,420$ Total long-term assets - 1,275 Total current liabilities - 34,000
2015 2014Total revenue 5,763 155,269 Total operating expenses (9,190) (134,447) Gain on sale of business 65,000 - Income (loss) from discontinued operations 61,573$ 20,822$
2015 2014Total revenue 120,426 535,174 Total operating expenses (103,801) (523,347) Gain on sale of business 65,000 - Income (loss) from discontinued operations 81,625$ 11,827$
Three months ended September 30,
Nine months ended September 30,
Current assets for Nexify consist of accounts receivable and long-term assets consist of Nexify’s immaterial deposits. Nexify’s current liabilities consist of accrued expenses. While the Nexify business has been a source of advertising revenue for the Company since its acquisition, upon recent evaluation of the business management determined Nexify’s business activities were no longer in line with the Company’s key strategic initiatives. In July 2015, the Company sold its Nexify business for $65,000, of which $30,000 of the cash consideration will be delivered six months after the closing of the sale. The Company recognized a gain of $65,000 related to the sale. The $30,000 of deferred consideration is classified as other current assets on the condensed consolidated statement of financial position.

10
Open Court Publishing The Company’s Open Court Publishing business generates revenues through the sale of books, primarily related to nonfiction and philosophy based content. Open Court has published more than 400 titles primarily for academics, philosophers and students, as well as a number of titles bringing high-quality philosophy to general readers. The following is key financial information related to the Open Court business as of September 30, 2015 and December 31, 2014 and for the three and nine months ended September 30, 2015 and September 30, 2014:
September 30, December 31,2015 2014
Total current assets 525,157$ 517,979$ Total current liabilities 523,073 531,127
2015 2014Total revenue 139,168 115,579 Total operating expenses (142,315) (97,231) Income (loss) from discontinued operations (3,147)$ 18,348$
2015 2014Total revenue 313,599 283,646 Total operating expenses (304,121) (287,879) Income (loss) from discontinued operations 9,478$ (4,233)$
Three months ended September 30,
Nine months ended September 30,
Current assets for Open Court consist of accounts receivable, inventory and prepaid royalties that will offset future royalty obligations related to book content. Open Court’s current liabilities consist of accrued expenses. Upon recent evaluation of the business, management determined Open Court’s business activities were no longer in line with the Company’s key strategic initiatives. As a result, the Company began actively marketing the business for sale at the end of 2014. The Company is seeking to dispose of the Open Court business during 2015. NOTE 4 – Fair Value Measurements
Certain assets and liabilities are recorded at fair value. IFRS 13 defines fair value as the amount for which an asset could be exchanged, or a liability settled, between knowledgeable, willing parties in an arm's length transaction. Fair value is based on assumptions market participants would make in pricing the asset or liability. Generally, fair value is based on observable quoted market prices or derived from observable market data when such market prices or data are available. When such prices or inputs are not available, the reporting entity should use valuation models. The Company’s assets and liabilities recorded at fair value on a recurring basis are categorized based on the priority of the inputs used to measure fair value. The inputs used in measuring fair value are categorized into three levels under authoritative guidance as follows: Level 1 - Inputs that are based upon quoted prices for identical instruments traded in active
markets. The Company did not have any Level 1 instruments at September 30, 2015 or December 31, 2014.
Level 2 - Inputs that are based upon quoted prices for similar instruments in active markets,
quoted prices for identical or similar investments in markets that are not active, or models based on valuation techniques for which all significant assumptions are observable in the market or can be corroborated by observable market data for substantially the full term of the investment.

11
Level 3 - Inputs that are generally unobservable and typically reflect management’s estimates of assumptions that market participants would use in pricing the asset or liability. The fair values are therefore determined using model-based techniques that include option pricing models, discounted cash flow models, and similar techniques.
The following section describes the valuation methodologies the Company uses to measure its financial assets and liabilities at fair value, and at September 30, 2015 and December 31, 2014, these were all recurring measurements. During the nine months ended September 30, 2015, there were no transfers between any levels. Assets (liabilities) measured at fair value on a recurring basis are summarized below:
As of September 30, 2015 Measured at Fair Value Hierarchy Level Description Fair Value Level 1 Level 2 Level 3
Restricted cash - certificate of deposit $ 76,432 $ - $ 76,432 $ -
Derivative liabilities1,2: Derivative liability for the holders’
conversion option in the 2013 Debentures 3,000 - - 3,000
Derivative liability for the Company’s forced conversion option in the 2013 Debentures 1,000 - - 1,000
Derivative liability for the holders’ conversion option in the 2012 Debentures 250 - - 250
Derivative liability for the voluntary conversion option in the 2015 Bridge Debentures 150,100 - - 150,100
Derivative liability for the automatic conversion feature in the 2015 Bridge Debentures 19,900 - - 19,900
As of December 31, 2014 Measured at Fair Value Hierarchy Level Description Fair Value Level 1 Level 2 Level 3
Restricted cash - certificate of deposit $ 76,277 $ - $ 76,277 $ -
Derivative liabilities1,2: Derivative liability for the holders’
conversion option in the 2013 Debentures 3,000 - - 3,000
Derivative liability for the Company’s forced conversion option in the 2013 Debentures 1,000 - - 1,000
Derivative liability for the holders’ conversion option in the 2012 Debentures 250 - - 250
Notes: (1) On the basis of its analysis of the nature, characteristics and risks of the financial instruments, the Company has determined that presenting the financial instruments by their nature is appropriate. (2) The derivative liabilities related to the 2012 Debentures and 2013 Debentures are included in secured convertible debentures on the condensed consolidated interim statements of financial position. The derivative liabilities related to the 2015 Bridge Debentures are included in bridge loan debentures on the accompanying condensed consolidated interim statements of financial position.

12
The effect of the fair value measurement on profit or loss for the three and nine months ended September 30, 2015 for Level 3 financial instruments was a gain of $86,800 and $13,600, respectively, which represents the unrealized loss on the derivative liabilities associated with the 2015 Bridge Debentures. The effect of the fair value measurement on profit or loss for the nine months ended September 30, 2014 for Level 3 financial instruments was a gain of $63,750, respectively, which represents the change in fair value of the derivative liabilities associated with the 2012 Debentures and 2013 Debentures. These amounts are classified as change in fair value of derivatives on the condensed consolidated interim statements of comprehensive loss. There was no effect of the fair value measurement of Level 3 financial instruments on other comprehensive income/loss for the three months ended September 30, 2014. The valuation processes and results for Level 3 financial instruments are reviewed and approved by the Company’s Controller and Chief Financial Officer at least each quarter in line with the Company’s quarterly reporting dates. Valuation results are discussed with the Audit Committee as part of its quarterly review of the Company’s financial statements. 2012 and 2013 Debentures In September 2012, the Company entered into an agreement to sell, on a “bought deal” private placement basis, an aggregate principal amount of CAD$12,000,000 of secured convertible debentures (the "2012 Debentures"). In March 2013, the Company entered into a trust indenture providing for the issuance, on a private placement basis, of up to an aggregate principal amount of CAD$10,000,000 of senior secured convertible debentures (the "2013 Debentures"). The 2012 Debentures and 2013 Debentures have two conversion features:
each CAD$1,000 principal amount of 2012 Debentures may be converted into approximately 67 voting common shares of the Company at the option of the holder and each CAD$1,000 principal amount of the 2013 Debentures is convertible into 100 voting common shares of the Company, at the option of the holder (“Conversion at Option of Holder”); and
on or after October 31, 2014, the Company may, at its option, convert the 2012 Debentures and 2013 Debentures into voting common shares at the conversion price, provided that the weighted average closing price of the Company’s voting common shares for the preceding ten trading days is not less than 200% of the conversion price (“Forced Conversion”). The Company has not exercised its right to convert the 2012 Debentures and 2013 Debentures into voting common shares as of November 14, 2015.
These conversion features were accounted for as embedded derivatives and recorded as liabilities at their fair values on the issuance date of the 2012 Debentures and 2013 Debentures. The conversion features are recorded at fair value and there were no changes to the key assumptions during the three or nine months ended September 30, 2015. In April 2015, the Company entered into a binding memorandum of understanding to restructure the debt outstanding under the 2012 Debentures and 2013 Debentures. See Note 8 for additional information on the debt restructuring. Debentures issued in connection with 2015 bridge financing During the second quarter of 2015, the Company issued additional debentures as part of the bridge loan financing component of its debt restructuring (the “Initial Bridge Loan”). Of the initial debentures issued, $50,000 were issued in the form of junior bridge debentures and $3,353,000 were in the form of senior bridge debentures. These debentures are convertible into voting common shares or restricted voting common shares of the Company at the option of the holder at a conversion price of $0.32 per share. Additionally, if the Company raises aggregate proceeds of $10,000,000 pursuant to an equity financing of preferred shares and the Initial Bridge Loan, collectively, all outstanding indebtedness under the Initial Bridge Loan will convert into, at the option of the holder: (A) preferred shares at a conversion price equal to the greater of (i) 80% of the issue price per share under the preferred share financing; and (ii) $0.32; (B) voting common shares or restricted voting common shares at a price of $0.32 per share or (C) a combination of (A) and (B) at the holders’ option. During the third quarter of 2015, the Company issued additional $647,000 in senior bridge debentures and $950,000 in junior bridge debentures under these same terms.

13
During the third quarter of 2015, the Company issued additional junior debentures as part of an additional bridge loan financing in the amount of $1,444,000. These debentures are convertible into voting common shares or restricted voting common shares of the Company at the option of the holder at a conversion price of $0.25 per share. Additionally, if the Company raises aggregate proceeds of $10,000,000 pursuant to an equity financing of preferred shares and the Initial Bridge Loan, collectively, all outstanding indebtedness under the bridge loan will convert into, at the option of the holder: (A) preferred shares at a conversion price equal to the greater of (i) 80% of the issue price per share under the preferred share financing; and (ii) $0.25; (B) voting common shares or restricted voting common shares at a price of $0.25 per share or (C) a combination of (A) and (B) at the holders’ option. The aforementioned conversion features were accounted for as embedded derivatives and recorded as liabilities at their fair values on the issuance date of the debentures. The conversion features are recorded at fair value as of September 30, 2015. The conversion features associated with the 2015 Bridge Debentures were accounted for as embedded derivatives and recorded as liabilities at their fair values on the issuance date. The Company utilized a third-party valuation expert that used the Monte Carlo model to value these derivative liabilities at September 30, 2015. The key assumptions used in the model at September 30, 2015 are as follows:
2015 Senior Bridge Debentures:
September 30,2015
Share price $0.18 Principal outstanding1 $4,000,000 Term 0.58 years Volatility2 60% Risk-free rate3 0.12% 2015 Junior Bridge Debentures:
September 30,2015
Share price $0.18 Principal outstanding14 $2,444,000 Term 0.58 years Volatility2 60% Risk-free rate3 0.12%
Notes: (1) Represents the value that the underlying asset must exceed for the conversion option to have value and is equal to the face value of the debentures. (2) In estimating the volatility, the third-party valuation expert analyzed the daily closing stock price of guideline companies and derived the annualized stock volatility for the latest four-year period (utilizing daily returns). The Company does not have sufficient trading history to rely on its volatility. (3) Represented by the current yield on the U.S. Treasury Bond with the closest time to maturity to the term of the debentures. (4) Of the principal amount outstanding, $1,000,000 were issued with conversion price of $0.32 per share and $1,444,000 were issued with a conversion price of $0.25 per share. Restricted cash The Company is required to maintain a security deposit for one of its office leases, which is held in the form of a letter-of-credit. At September 30, 2015 and December 31, 2014, the Company had a certificate of deposit with a bank as collateral for an irrevocable standby letter-of-credit totaling $76,432 and $76,277, respectively. The fair value of the certificate of deposit is based on quotes from the bank. Non-recurring fair value measurements Certain financial statement items are measured at fair value when required on a non-recurring basis such as intangibles upon acquisition and when impaired.
14
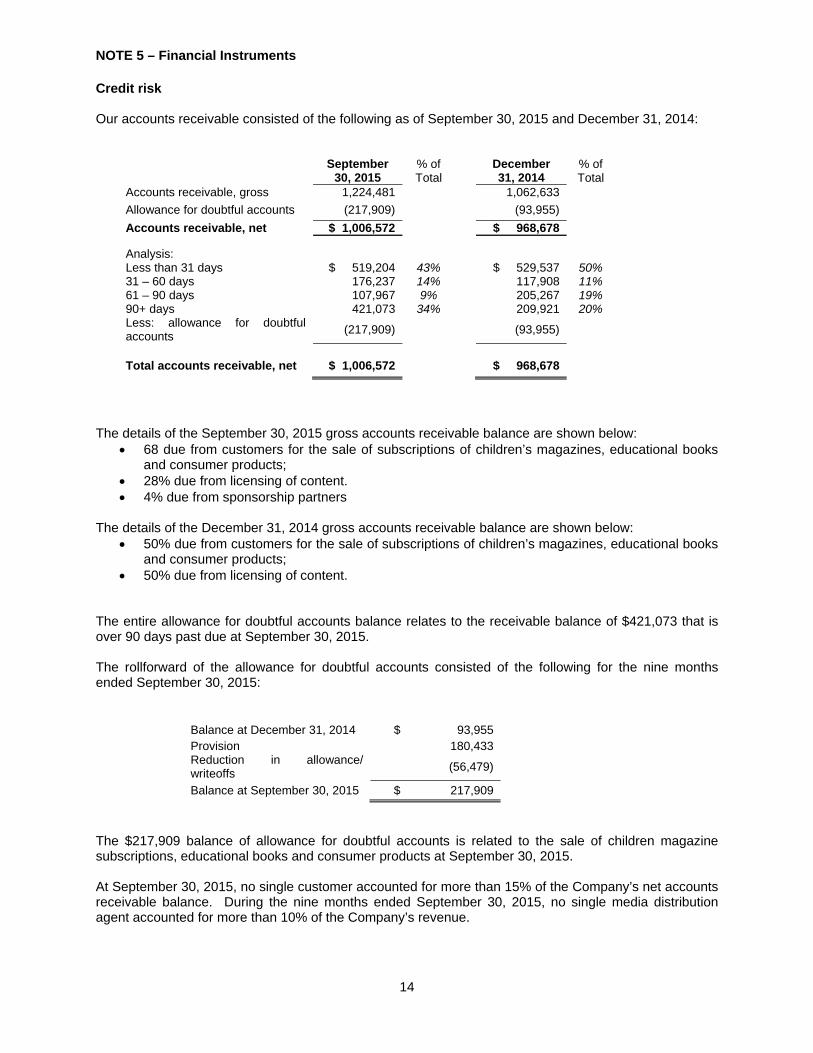
NOTE 5 – Financial Instruments Credit risk Our accounts receivable consisted of the following as of September 30, 2015 and December 31, 2014:
September 30, 2015
% of Total
December 31, 2014
% of Total
Accounts receivable, gross 1,224,481 1,062,633
Allowance for doubtful accounts (217,909) (93,955)
Accounts receivable, net $ 1,006,572 $ 968,678
Analysis: Less than 31 days $ 519,204 43% $ 529,537 50% 31 – 60 days 176,237 14% 117,908 11% 61 – 90 days 107,967 9% 205,267 19% 90+ days 421,073 34% 209,921 20% Less: allowance for doubtful accounts
(217,909)
(93,955)
Total accounts receivable, net $ 1,006,572 $ 968,678
The details of the September 30, 2015 gross accounts receivable balance are shown below:
68 due from customers for the sale of subscriptions of children’s magazines, educational books and consumer products;
28% due from licensing of content. 4% due from sponsorship partners
The details of the December 31, 2014 gross accounts receivable balance are shown below:
50% due from customers for the sale of subscriptions of children’s magazines, educational books and consumer products;
50% due from licensing of content. The entire allowance for doubtful accounts balance relates to the receivable balance of $421,073 that is over 90 days past due at September 30, 2015. The rollforward of the allowance for doubtful accounts consisted of the following for the nine months ended September 30, 2015:
Balance at December 31, 2014 $ 93,955 Provision 180,433 Reduction in allowance/ writeoffs
(56,479)
Balance at September 30, 2015 $ 217,909
The $217,909 balance of allowance for doubtful accounts is related to the sale of children magazine subscriptions, educational books and consumer products at September 30, 2015. At September 30, 2015, no single customer accounted for more than 15% of the Company’s net accounts receivable balance. During the nine months ended September 30, 2015, no single media distribution agent accounted for more than 10% of the Company’s revenue.

15
Interest rate risk Interest rate risk is defined as the risk that the fair value or future cash flows of a financial instrument held by the Company will fluctuate because of changes in interest rates. The 2012 Debentures have a fixed interest rate of 6.50% per annum and the 2013 Debentures have a fixed interest rate of 10.00% per annum. Additionally, the 2015 Bridge Debentures have a fixed interest rate of 5%. The Company’s only exposure to interest rate risk from these debentures is from a cost of funds perspective. If interest rates rise, the value of the convertible debentures decreases. In April 2015, the Company entered into a binding memorandum of understanding to restructure the debt outstanding under the 2012 Debentures and 2013 Debentures. See Note 8 for additional information on this debt restructuring. Currency risk The Company is required to pay the principal and interest payments on the 2013 Debentures and the 2012 Debentures in CAD which creates an exposure to currency risk between CAD and the Company’s functional currency of USD. The related debenture agreements specify that for the computation of the principal and interest payments, any currency other than CAD shall be converted into CAD at the applicable Bank of Canada noon rate of exchange on the date which such computation is to be made. In April 2015, the Company signed a binding memorandum of understanding for a debt restructuring that would restructure the debenture debt outstanding in CAD into debt outstanding in USD. See Note 8 for additional information on the debt restructuring. Liquidity risk See discussion of going concern and liquidity in Note 2. NOTE 6 – Goodwill & Other Intangible Assets No impairment was recognized for the Company’s goodwill or other intangible assets during the nine months ended September 30, 2015. During the third quarter of 2014, management determined the Company would suspend the expansion of sponsorship and global community activities in an attempt to shift resources to more profitable areas of the business. As a result, the Company’s intangible assets supported by sponsorship activities, which include the ePals brand name indefinite lived intangible asset and the goodwill generated by the 2006 merger of In2Books and ePals Classroom to form the legacy platform business, were evaluated for impairment. Upon completing the evaluation, the Company determined the value of the intangible assets were no longer recoverable. An impairment loss of $902,178 and $2,060,292 was recognized during the three months ended September 30, 2014 related to the goodwill and brand name intangibles, respectively, which represents a full write off of the aforementioned assets. The remaining balance of goodwill within the ePals CGU primarily relates to the Company’s Iguana publications.

16
NOTE 7 – Investment in NeuPals In March 2012, the Company signed a definitive Joint Venture Contract with NeuEdu Tianjin (“NeuEdu”) for a 20-year term whereby the parties agreed to form a partnership named NeuPals Dalian Educational Information Technologies Co., Ltd. (“NeuPals”) to create and launch a Chinese version of ePals’ Global Community and products. For accounting purposes, the Company does not meet the requirements of having joint control, but instead meets the requirements for having significant influence over NeuPals based on how strategic financial and operating decisions are approved by NeuPals’ board of directors. Therefore, NeuPals is being accounted for as an associate of the Company under the equity method of accounting in accordance with IFRS. The table below shows the activity during the nine months ended September 30, 2015 in the Investment in NeuPals account on the condensed consolidated interim statements of financial position at September 30, 2015: Investment in NeuPals at December 31, 2014 $540,266 49% portion of NeuPals net loss for the nine months ended September 30, 2015
(100,718)
Investment in NeuPals at September 30, 2015 $439,548
NOTE 8 – Debt 2012 and 2013 Debentures At September 30, 2015, the Company had a principal amount of approximately CAD$22 million secured convertible debentures outstanding. A rollforward of the secured convertible debentures line in the condensed consolidated interim statements of financial position is shown below, which is made up of the host debt liability, the derivative liabilities for the Forced Conversion and Conversion at Option of Holder, net of the transaction costs apportioned to the host debt liability component that are being amortized over the estimated term of the debentures under the effective interest method.
Balance of secured convertible debentures at December 31, 2014 $18,710,994 Accretion of the 2012 Debentures and 2013 Debentures 67,627 Foreign currency gain (2,490,529) Balance of secured convertible debentures at September 30, 2015 $16,288,092
Terms of the 2013 Debentures During 2013, the Company issued the 2013 Debentures in an aggregate principal amount of CAD$10,000,000. A total of CAD$9,750,000 of the 2013 Debentures were collectively held by existing investors and an affiliate of two members of the Company’s Board of Directors. Each CAD$1,000 principal amount of the 2013 Debentures is convertible into 100 voting common shares of the Company, at the option of the holder, representing a conversion price of CAD$10.00 per share (the “2013 Conversion Price”). Prior to the issuance of the senior bridge debentures, discussed below, the 2013 Debentures rank senior to other indebtedness of the Company, including the 2012 Debentures, and bear interest at a rate of 10.0% per annum, payable annually in arrears on April 30 each year. The 2013 Debentures have a maturity date of October 31, 2016. As of September 30, 2015, the holders of the 2013 Debentures held a senior security interest to the 2012 Debentures in all of the present and subsequently acquired tangible and intangible personal property of the Company. Per the original terms, the 2013 Debentures will not be redeemable prior to October 31, 2015. On or after October 31, 2015, under certain conditions, the Company may, at its option, redeem the 2013 Debentures, at par plus accrued and unpaid interest thereon to the redemption date. Further, on or after October 31, 2014, the Company may, at its option, convert the 2013 Debentures into the Company’s voting common shares at the 2013 Conversion Price, provided that the volume weighted average trading price of the Company’s voting common shares for the preceding 10 trading days is not less than 200% of the 2013 Conversion Price. Holders of converted 2013 Debentures will receive, in cash, accrued and unpaid interest thereon to the conversion date.

17
The agreements for the 2012 Debentures prohibit the Company from incurring senior indebtedness over CAD$10,000,000 without the requisite consent. As of September 30, 2015, the Company had issued the maximum amount of senior indebtedness permitted under the trust indenture governing the terms of the 2012 Debentures through the issuance of the 2013 Debentures. Terms of the 2012 Debentures The 2012 Debentures were issued with substantially the same terms as the 2013 Debentures with the exception of the conversion price of CAD$15.00 and interest rate of 6.5%. Each CAD$1,000 in principal of the 2012 Debentures may be converted into approximately 67 voting common shares of the Company at the option of the holder representing a conversion price of CAD$15.00 per share. The maturity date of the 2012 Debentures was also extended to October 31, 2016 at the Company’s option. Restructuring of the 2012 Debentures and 2013 Debentures In March 2015, the Company entered into a binding memorandum of understanding to restructure the debt outstanding under the 2012 Debentures and 2013 Debentures. The debt restructuring requires the approval of holders of 66 2/3% of the aggregate principal amount of the 2012 Debentures and holders of 66 2/3% of the aggregate principal amount of the 2013 Debentures. The Company is proceeding with the definitive documents necessary to fully effect the debt restructuring. Implementation of the debt restructuring is subject to the acceptance by the TSX-V. After the implementation of the debt restructuring and assuming the Company raises a minimum of $10 million pursuant to the Company’s preferred share financing and the Initial Bridge Loan financing, collectively, the Company’s long term debt will be reduced from approximately $22 million to approximately $11 million per the memorandum of understanding. 2015 Bridge Debentures During the nine months ended September 30, 2015, the Company issued additional debentures as part of the bridge loan financing component of its debt restructuring. Of the debentures issued, $2.4 million were issued in the form of junior debentures and $4.0 million were in the form of senior bridge debentures. A rollforward of the secured convertible debentures line in the condensed consolidated interim statements of financial position is shown below, which is made up of the initial host debt liability of approximately $6.2 million and the derivative liabilities for the conversion features, net of the transaction costs apportioned to the host debt liability component that are being amortized over the estimated term of the debentures under the effective interest method.
Balance of bridge debentures at December 31, 2014 $ - Issuance of the 2015 Bridge Debentures, net 6,313,031 Accretion of the 2015 Bridge Debentures 121,515 Change in fair value of conversion features (13,600) Balance of bridge debentures at September 30, 2015 $6,420,946
Terms of the 2015 Bridge Debentures The 2015 Bridge Debentures will mature on April 30, 2016 and carry an annual interest rate 5%. The debentures are convertible into voting common shares or restricted voting common shares of the Company at the option of the holder at a conversion price ranging between $0.25 and $0.32 per share. Additionally, if the Company raises aggregate proceeds of $10,000,000 pursuant to an equity financing of preferred shares and the Initial Bridge Loan, collectively, all outstanding indebtedness under the 2015 Bridge Debentures will convert to, at the option of the holder: (A) preferred shares at a conversion price equal to the greater of (i) 80% of the issue price per share under the preferred share financing; and (ii) $0.25 or $0.32 (as detailed in the respective debenture agreement); (B) voting common shares or restricted voting common shares at a price ranging between $0.25 and $0.32 per share per the relevant agreements or (C) a combination of (A) and (B) at the holders’ option. The senior bridge debentures rank senior to the 2012 Debentures and 2013 Debentures and the junior bridge loan debentures rank junior to the 2012 Debentures and 2013 Debentures.

18
As of September 30, 2015, the holders of the senior bridge debentures held a senior security interest in all of the present and subsequently acquired tangible and intangible personal property of the Company, including the 2012 Debentures, 2013 Debentures and junior bridge debentures. Accounting for the Debentures Since the Company’s 2012 Debentures and 2013 Debentures were issued in a currency other than the Company’s functional currency of USD and the Company’s common stock is denominated in CAD, the Company’s debentures fail the ‘fixed-for-fixed’ criteria for equity classification under IFRS. The two conversion features (Forced Conversion and Conversion at Option of Holder) of the 2012 Debentures and 2013 Debentures were accounted for as embedded derivatives and recorded as liabilities at their fair values on the debentures issuance date. The conversion features were measured first at their fair values and recorded separately, with the host debt liability component measured at the residual after deducting the fair value attributable to the conversion features from the convertible debenture as a whole. The proceeds from the debenture tranches were bifurcated between the host debt liability and these conversion features on their respective issuance dates. Additionally, while the 2015 Bridge Debentures were issued in USD, the Company’s stock tied to the conversion features is denominated in CAD and thus these debentures also failed the ‘fixed-for-fixed’ criteria for equity classification under IFRS. As a result, the 2015 Bridge Debentures are being accounted for in the same manner as the 2012 Debentures and 2013 Debentures. Transaction costs were apportioned to the host debt liability component and are being amortized over the estimated term of the convertible debenture using the effective interest method. The host debt liability component, net of the transaction costs, is being accreted to the face value of the liability using the effective interest method. As of September 30, 2015, the accretion of the liability is charged at a weighted average effective interest rate of 10.3% for the 2013 Debentures and 7.3% for the 2012 Debentures such that at maturity, the liability component is equal to the face value of the outstanding debentures. As of September 30, 2015, the accretion of the liability is charged at a weighted average effective interest rate of 14.8% for debentures issued under the bridge loan such that at maturity, the liability component is equal to the face value of the outstanding debentures. A portion of the 2015 Bridge Debentures were issued to related parties with a fixed annual interest rate of 5%. As a result, the Company evaluated whether these debentures were issued at a discount. Including considerations related to the conversion features, it was determined that the fair value of tranches issued in May 2015 was lower than the host debt amount by approximately $50,000. This discount is being amortized over the life of these debenture tranches. The Company remeasured the fair value of the conversion features in the 2015 Bridge Debentures and recognized a gain of $86,800 and $13,600 to adjust the conversion features to their fair value during the three and nine months ended September 30, 2015, respectively. See Note 4 for additional information on the fair value of these conversion features. In February 2013, the TSX-V approved the 2012 Debentures to be listed and posted for trading on that exchange. Trading commenced on February 21, 2013 and now trade under the symbol CKT.DB. Credit agreements with insiders As of September 30, 2015, the Company was fully drawn under the $3,500,000 revolving line of credit with ZG, an affiliate of two members of the Company’s Board of Directors. In March 2015, ZG forgave an aggregate of $1,000,000 of indebtedness outstanding under the line of credit. As partial consideration for the forgiveness of debt, Cricket Media, Inc. agreed, subject to certain conditions, to indemnify Miles Gilburne and Nina Zolt, the principals of ZG, from all payment obligations that may be incurred by them in connection with a personal guarantee they have provided in connection with the Company’s bank line-of-credit with The National Capital Bank of Washington, whereby they guaranteed the repayment by ePals Foundation Inc., an entity which Cricket Media, Inc. controls, of $1,500,000 of indebtedness incurred by ePals Foundation pursuant to a commercial line of credit with The National Capital Bank of Washington prior to the restructuring of that debt in June 2015 as described below. ZG also provided a payment guaranty to The National Capital Bank of Washington related to the promissory note replacing the revolving bank line of credit. Due to the related party nature of this transaction with a significant shareholder, the debt forgiveness was recorded as a reduction to the debt outstanding and an increase to

19
additional paid-in-capital. No gain was recognized in connection with this transaction. Additionally, approximately $1.8 million of the 2015 Bridge Debentures discussed above were issued in settlement of amounts outstanding under the revolving line of credit. Bank promissory note In April 2014, the Company renewed the $1,500,000 bank line-of-credit agreement with the same local bank for a one-year term. The line-of-credit agreement was renewed under terms where the Company will repay $10,000 of principal per month from October through December 2014 and $15,000 per month from January 2015 through March 2015. Interest rate terms were substantially similar to the previous agreement. In April 2015 the Company restructured the line-of-credit in the form of a promissory note to carry a 5.0% interest rate with repayment due over five years, which took effect in June 2015. Under the new line-of-credit, which matures on September 30, 2020, the Company will make monthly payments of principal and interest of approximately $27,000 per month. At September 30, 2015 and December 31, 2014 the Company was in compliance with all covenants in the debt agreements. Two directors of the Company (the “Guarantors”) have provided a guaranty to the bank with respect to the promissory note and the Company has agreed to reimburse the Guarantors for amounts that may be paid by the Guarantors to the bank in connection with the guarantee. At September 30, 2015, the Company had $1,362,111 outstanding under the promissory note, of which $260,076 was classified as a current note payable and $1,102,035 was classified as a long-term note payable as of September 30, 2015. At December 31, 2014, the Company had $1,470,000 outstanding on the bank line-of-credit. The outstanding balance under the line-of-credit was classified as a current liability at December 31, 2014. Due to the low current market interest rates, exposure to interest rate risk is minimal. NOTE 9 – Share Capital On July 9, 2014, the Company announced that the TSX-V approved the consolidation of the Company’s issued and outstanding voting common shares and the Company’s issued and outstanding restricted voting common shares, each on the basis of one post-consolidation share for every 25 outstanding pre-consolidation shares. Effective at the opening of trading on July 10, 2014, the voting common shares commenced trading on the TSX-V on a consolidated basis and continued to trade under the symbol “CKT”. The outstanding convertible securities of the Company were adjusted in accordance with the terms to reflect the consolidated capital structure of the Company. Voting common shares During the nine months ended September 30, 2015, the Company completed two additional tranches of its previously announced non-brokered private placement and issued approximately 2.2 million Units at a price of CAD$0.65 per Unit for proceeds of approximately $1.25 million. Each Unit consisted of one voting common share of the Company and one-third of one Warrant. Each Warrant entitled the holder to purchase one additional voting common share of the Company at a price of CAD$0.65 until March 31, 2015. The Warrants were not exercised before the expiration date. In March 2015, the Company issued 115,385 voting common shares in connection with the settlement of restricted stock units granted to a member of the Board of Directors. Restricted voting common shares During the nine months ended September 30, 2015, the Company issued 225,551 restricted voting common shares in connection with the settlement of restricted stock units granted to a member of the Board of Directors.

20
NOTE 10 – Share-Based Compensation Stock options Presented below is a summary of the stock option activity for the nine months ended September 30, 2015 and 2014: Weighted Weighted Average Number Average Remaining of Exercise Contractual Options Price Term (Years)
Outstanding at January 1, 2014 453,301 $ 8.67 Granted 519,239 1.22 Exercised - - Forfeited or expired (133,283) 4.70
Outstanding at September 30, 2014 839,257 $ 2.55 8.18 Exercisable at September 30, 2014 436,018 $ 3.33 7.30 Outstanding at January 1, 2015 783,358 $ 4.07
Granted 2,576,018 0.20 Exercised - - Forfeited or expired (379,886) 1.25
Outstanding at September 30, 2015 2,979,490 $ 0.72 8.96 Exercisable at September 30, 2015 916,816 $ 1.67 7.81
At September 30, 2015, the Company’s total outstanding and total exercisable stock options had no intrinsic value. The fair value of options granted during the three months ended September 30, 2015 and September 30, 2014 was $32,885 and $9,526, respectively. The fair value of options granted during the nine months ended September 30, 2015 and September 30, 2014 was $103,239 and $248,710, respectively. The fair value of stock options grants is being expensed over the respective vesting periods. The Company charged to operations stock compensation expense for stock options totaling $23,164 and $30,314 for the three months ended September 30, 2015 and 2014, respectively. The weighted-average grant date fair value of options granted during the three months ended September 30, 2015 and September 30, 2014 was $0.05 and $0.25. The Company charged to operations stock compensation expense for stock options totaling $82,280 and $173,662 for the nine months ended September 30, 2015 and 2014, respectively. The weighted-average grant date fair value of options granted during the nine months ended September 30, 2015 and September 30, 2014 was $0.04 and $0.48, respectively. During the nine months ended September 30, 2014, the Company issued 12,000 stock options to a consultant for services provided between January 2014 and April 2014. The fair value of $50,000 attributed to these options was based on the fair value of the services received. The fair value of each stock option award to employees was estimated from the date of grant using the Black-Scholes Option Pricing Model with assumption ranges for the nine months ended September 30, 2015 and 2014 noted in the following table:
September 30,2015
September 30, 2014
Expected volatility 46.00 - 61.00% 45.00 - 57.00% Expected dividends 0.00% 0.00% Expected term (in years) 1.00 – 4.00 1.25 – 4.00 Risk-free interest rate 0.25 – 1.28% 0.17 – 1.36%

21
Restricted share units (“RSU”) The fair value of RSUs granted during the nine months ended September 30, 2015 and September 30, 2014 was $72,633 and $47,397, respectively. Stock-based compensation for RSUs of $44,497 and $105,408 was recorded during the nine months ended September 30, 2015 and 2014, respectively. No RSUs were granted during the three months ended September 30, 2015 and September 30, 2014. Stock-based compensation for RSUs of $1,392 and $10,255 was recorded during the three months ended September 30, 2015 and 2014, respectively. Presented below is a summary of the restricted share unit activity for the nine months ended September 30, 2015 and 2014: Weighted Number Average of Grant Date RSUs Fair Value
Outstanding at January 1, 2014 54,579 $ 4.00Granted 42,000 1.25Vested (68,578) 7.27Forfeited (400) 12.06
Outstanding at September 30, 2014 27,601 $ 1.88
Outstanding at January 1, 2015 20,167 $ 2.06
Granted 446,154 0.16Vested (340,769) 0.21Forfeited - -
Outstanding at September 30, 2015 125,552 $ 0.30
All of the RSUs awarded during the nine months ended September 30, 2015 and September 30, 2014 were issued to directors, officers and employees of the Company. Stock warrants As discussed in Note 9, the Company issued stock warrants through a non-brokered private placement during 2015 and these warrants expired on March 31, 2015. The Company issued approximately 700,000 stock warrants with a strike price of CAD$0.65 per warrant. There were certain dilution events that could have potentially changed the strike price of these warrants, including: (i) the issuance of common shares, or securities exchangeable for or convertible into restricted voting common shares, issued to all or substantially all shareholders as a stock dividend; (ii) any distribution on its outstanding or voting common shares; (iii) the occurrence of a stock split; or (iv) the occurrence of a reverse stock split. None of the warrants granted during 2015 were exercised before the expiration date. During 2014, the Company issued approximately 500,000 stock warrants with a strike price of CAD$1.875 per warrant in connection with its non-brokered private placement transactions. There were certain dilution events that could potentially change the strike price of these warrants, including: (i) the issuance of common shares, or securities exchangeable for or convertible into restricted voting common shares, issued to all or substantially all shareholders as a stock dividend; (ii) any distribution on its outstanding or voting common shares; (iii) the occurrence of a stock split; or (iv) the occurrence of a reverse stock split. The fair value of the stock warrants was derived using a Monte-Carlo simulation model and the Company recognized a reduction to common stock on the condensed consolidated balance sheet of $45,962. The assumptions used in the Monte-Carlo simulation include various dilution scenarios, which were weighted based on the chance of occurrence. These stock warrants expired in August 2014. The values of warrants outstanding as of September 30, 2015 and December 31, 2014 were immaterial.

22
Presented below is a summary of the warrant activity for the nine months ended September 30, 2015 and 2014: Weighted Number Weighted Average Of Average Remaining Warrant Exercise Contractual Shares Price Term (Years)
Outstanding at January 1, 2014 1,777,366 $ 3.75 Granted 497,720 1.88 Exercised (235,834) 1.88 Forfeited or expired (1,833,056) 1.88
Outstanding at September 30, 2014 206,196 $ 10.62 4.27
Outstanding at January 1, 2015 1,487,244 $ 4.69
Granted 731,574 0.53 Exercised - - Forfeited or expired (2,064,394) 0.58
Outstanding at September 30, 2015 154,424 $ 10.08 1.16 All warrants were exercisable at September 30, 2015. At September 30, 2015, the Company’s total outstanding and exercisable warrants had no intrinsic value. NOTE 11 – Revenue The Company sub-classifies revenue within the following categories: (1) subscriptions, (2) licensing, (3) commerce and (4) sponsorship. Subscription revenue is comprised of subscriptions of children’s magazines and digital content. Licensing includes revenue generated from content licensing, agreements related to the Company’s application programming interfaces (“APIs”), licensing the Company’s platform to third parties and the licensing of school suite solutions. Commerce revenues are comprised of the sales of educational digital apps, games, books and other physical and digital products directly to consumers and through partnerships, including the one-time sales of magazine back issues. Sponsorship and advertising revenues include revenue from the Company’s sponsorship agreements with corporate and non-profit sponsors and advertising agreements. Presented below is the Company’s revenue broken out by goods and services for the three and nine months ended September 30, 2015 and 2014:
2015 2014 2015 2014Goods: media products & commerce revenue $2,331,608 $2,503,905 $8,443,540 $9,074,041Services revenue: licensing & sponsorship 502,860 339,539 1,250,357 1,305,058Total revenue $2,834,468 $2,843,444 $9,693,897 $10,379,099
Three months ended September 30,
Nine months ended September 30,
Presented below is the Company’s revenue by category for the three and nine months ended September 30, 2015 and 2014:
2015 2014 2015 2014Subscriptions $2,237,037 $2,360,096 $7,923,401 $8,516,541Licensing 427,859 339,203 1,150,030 1,179,461 Commerce 94,572 144,145 520,466 557,941 Sponsorship 75,000 - 100,000 125,156 Total revenue $2,834,468 $2,843,444 $9,693,897 $10,379,099
Nine months ended September 30,
Three months ended September 30,

23
NOTE 12 – Transactions with Related Parties In March 2015, ZG forgave an aggregate of $1,000,000 of indebtedness outstanding under the Company’s revolving line of credit. As partial consideration for the forgiveness of debt, Cricket Media, Inc. agreed, subject to certain conditions, to indemnify Miles Gilburne and Nina Zolt, the principals of ZG, from all payment obligations that may be incurred by them in connection with a personal guarantee they have provided in connection with the Company’s bank line-of-credit with The National Capital Bank of Washington, whereby they have guaranteed the repayment by Cricket Media, Inc. of $1,500,000 of indebtedness incurred by Cricket Media, Inc. pursuant to a commercial line of credit with The National Capital Bank of Washington prior to the restructuring of that debt in June 2015. ZG also provided a payment guaranty to The National Capital Bank of Washington related to the promissory note replacing the revolving bank line of credit. See Note 8 for additional information on the debt forgiveness. During the nine months ended September 30, 2015, the Company issued debentures associated with the bridge financing component of the Company’s overall debt restructuring. Of the $6.4 million in debentures issued as of September 30, 2015, approximately $1.6 million are held by ZG, an affiliate of two members of the Company’s Board of Directors. As of September 30, 2015, $9,750,000 of the 2013 Debentures outstanding were held by existing investors and an affiliate of two members of the Company’s Board of Directors. See Note 8 for additional information about the Company’s debentures.
In 2013, the Company entered into a publishing agreement with NeuPals for the translation and publication of Chinese language versions of the Company’s children’s magazines and content. NeuPals will pay royalty payments to the Company based on a percentage of NeuPals’ gross sales revenue from the sale of Chinese-translated magazines, books and back issues it translates (the “Derivatives”). The Company will pay to NeuPals royalty payments calculated as a percentage of the Company’s gross sales revenue from Derivatives sold outside of China. No revenues were earned and no royalties were incurred under this agreement during the three and nine months ended September 30, 2015. NeuPals and NeuEdu are affiliated with Neusoft Holdings. See Note 7 for more information about NeuEdu’s relationship with the Company.
NOTE 13 – Commitments and Contingencies Operating leases for office space In 2015, the Company signed an extension to its noncancelable operating lease for corporate office space in Virginia that was originally scheduled to expire in December 2015. That lease now has an expiration date of June 30, 2016. The lease agreement and amendments require the Company to pay its proportionate share of the operating expenses and real estate taxes during the lease period. The Company is required to maintain a security deposit for this lease, which it holds in the form of a letter-of-credit. At September 30, 2015 and December 31, 2014, the Company has a certificate of deposit ("CD”) held at a bank as collateral for an irrevocable standby letter-of-credit totaling $76,432 and $76,277, respectively. In accordance with the operating lease agreement, the Company must maintain the balance of the CD at a minimum of $68,743. This CD expires on November 13, 2016. NOTE 14 – Subsequent Events In October 2015, the Company closed an additional tranche of its secured convertible debentures (the “Junior Bridge Debentures”) and has issued additional Junior Bridge Debentures in the aggregate principal amount of $250,000. The Junior Bridge Debentures are convertible into voting common shares or restricted voting common shares of the Company at the option of the holder at a conversion price of $0.25 per share. In the event that the Company raises aggregate gross proceeds of a minimum of $10 million pursuant to an equity financing of preferred shares (the “Financing”) and the $5,000,000 bridge loan described in the Company’s news release dated July 16, 2015 (the “Existing Bridge Loan”), collectively, all outstanding indebtedness under the junior bridge loan will convert into, at the option of the holder: (A) preferred shares at a conversion price equal to the greater of: (i) 80% of the issue price per share under the Financing; and (ii) $0.25; or (B) voting common shares or restricted voting common shares at a price of $0.25 per share, or a combination of (A) and (B) at the holder’s option. These Junior Bridge Debentures expire on April 30, 2016.

24
In November 2015, the Company issued additional Junior Bridge Debentures in the aggregate principal amount of $190,000. These Junior Bridge debentures were issued under the same terms as those issued in October 2015. Additionally, the Company extended the repayment terms associated with its related party line of credit. The repayment date of all outstanding principal and interest has been extended to April 30, 2016. All other terms remain unchanged.

1
MANAGEMENT’S DISCUSSION AND ANALYSIS OF CRICKET MEDIA GROUP LTD.
FOR THE THREE AND NINE MONTHS ENDED SEPTEMBER 30, 2015
DATE OF REPORT: NOVEMBER 24, 2015
The Management’s Discussion and Analysis (“MD&A”) of Cricket Media Group Ltd. (“Cricket Media”, “Company”, “we”, “us” and “our”), formerly ePals Corporation, was prepared by management of the Company and should be read in conjunction with the Company’s unaudited condensed consolidated interim financial report and accompanying notes for the three and nine months ended September 30, 2015 and the audited consolidated financial statements and accompanying notes for the years ended December 31, 2014 and 2013. Previously classified as a Capital Pool Company as defined in Policy 2.4 of the TSX Venture Exchange (“TSX-V”), the Company completed a “qualifying transaction” as defined under the policies of the TSX-V on July 26, 2011 when it acquired ePals, Inc. pursuant to a statutory procedure to form “ePals Corporation” (“Merger”). The Company changed its name to “Cricket Media Group Ltd.” on July 10, 2014. Additional information about the Company and the Merger may be found under the Company’s SEDAR profile at www.sedar.com. The Company’s unaudited condensed consolidated interim financial report for the three and nine months ended September 30, 2015 and 2014 and this MD&A are presented in United States dollars (unless otherwise noted) and were prepared in accordance with International Financial Reporting Standards (“IFRS”), which are generally accepted accounting principles (“GAAP”) in Canada. The Company’s transition date to IFRS was January 1, 2009. Forward-Looking Statements
Certain statements contained in this MD&A constitute forward-looking information within the meaning of applicable securities laws, including statements with respect to customers, ventures; partnerships; contributions and/or prospects of one or more of the Company’s business lines; the Company’s strategy, prospects and success in pursuing domestic or international markets; and the Company’s anticipated plans to increase its subscriptions, revenue and sales. These statements relate to future events or future performance. Often, but not always, forward-looking information can be identified by the use of words such as “plans”, “expects”, “is expected”, “budget”, “scheduled”, “estimates”, “forecasts”, “intends”, “anticipates”, or “believes” or variations (including negative variations) of such words and phrases, or statements formed in the future tense or indicating that certain actions, events or results “may”, “could”, “would”, “might” or “will” (or other variations of the forgoing) be taken, occur, be achieved, or come to pass. Forward-looking information is necessarily based upon a number of assumptions and factors that, while considered reasonable, are subject to known and unknown risks, uncertainties, and other factors which may cause the actual results and future events to differ materially from those expressed or implied by such forward-looking information. Those assumptions and factors are based on information currently available to the Company. Such material factors and assumptions include, but are not limited to: the Company’s ability to execute on its business plan; the acceptance of the Company’s products and services by customers globally; that the Company’s affiliated entities will be able to secure distribution partners for sale of the Company’s products and services; the Company’s subjective assessment of the likelihood of success of a sales lead or opportunity; that sales will be completed at or above estimated margins; that the demand for education media related products domestically, in Europe and in China will continue to grow; that the demand for the Company’s products and services globally will develop and grow; the receipt of all requisite regulatory approvals throughout venture territories for the sale of the Company’s products and services; the availability of additional financing, if and when required and market conditions generally. Although the Company has attempted to identify important factors that could cause actual actions, events or results to differ materially from those described in forward-looking information, there may be other factors that cause actions, events or results to differ from those anticipated, estimated or intended. The forward-looking information contained in this MD&A is made as of the date hereof and the Company is not obligated to update or revise any forward-looking information, whether as a result of new information, future events or otherwise, except as required by applicable securities laws. Because of the risks, uncertainties and assumptions contained

2
herein, investors should not place undue reliance on forward-looking information. The foregoing statements expressly qualify any forward-looking information contained herein. Any and all forward-looking information contained in this MD&A is expressly qualified by this cautionary statement.
Many factors could cause the actual results of the Company to differ materially from the results, performance, achievements or developments expressed or implied by such forward-looking statements, including, without limitation, those factors under the heading “Risk Factors” included in the Company’s Management’s Discussion and Analysis for the year ended December 31, 2014, which may be found under the Company’s SEDAR profile at www.sedar.com. The industry and statistical data presented in this MD&A have been compiled from sources and participants which, although not independently verified by the Company, are considered by the Company to be reliable sources of information. References in this MD&A to research reports or to articles and publications should not be construed as depicting the complete findings of the entire referenced report, article or publication. Core Business & Strategy Core Business Cricket Media is an education media company that provides award-winning content on a safe and secure learning network for children, families and teachers across the world. Cricket Media’s popular media brands for toddlers to teens include Babybug®, Ladybug®, Cricket® and Cobblestone® with multiple language editions and apps in English, Spanish and Mandarin. In addition to activities associated with the sale of print and digital content, the Company licenses its content and innovative technology associated with its collaborative social learning platform. The Company’s digital K-12 products for school and home include the ePals Global Community (the Company’s network of classrooms that allows teachers and students to safely connect and collaborate with other classrooms around the world) as well as In2Books®, a Common Core eMentoring program that builds reading, writing and critical thinking skills. Cricket Media serves millions of teachers, students and parents in over 200 countries and territories through its products and services. The availability of English language product offerings and the expansion of product offerings into Mandarin and bilingual English-Mandarin is an important part of the Company’s business activities in China as the Company continues to expand its international reach. The Company’s mission is to create and power collaborative products and experiences that enlighten, educate, and entertain children, connecting them to their families, friends, and the world around them. Our vision is to create the opportunity for every student to build the skills and gain the knowledge needed for success in a networked, global economy and to assist educators and parents in helping students achieve those goals.
The cornerstone of the Company’s business strategy is to deliver high quality content that is paired with safe social networking and tailored to the specific needs of toddlers to teens at home, K-12 students, schools, educators, and parents. Specifically, the Company aims to produce and distribute high-quality children’s content, digital media and interactive learning apps for sale in home and school markets, as well as to provide an environment and tools through which third party publishers and developers can distribute new digital learning products and services to its users. The markets for our products are both highly competitive and still at an early stage of development in North America and globally. We deliver a variety of online and offline media products and collaboration services producing multiple revenue streams.
The Company manages its business based on its four primary revenue-generating activities: subscriptions, commerce, licensing and sponsorship.

3
Subscription Revenue The Company’s subscription revenues are generated through the sale of annual subscriptions to its print and digital products to consumer and institutional purchasers.
Commerce Revenue Commerce revenue consists of revenues related to the sale of digital apps, games, books and other non-subscription based physical and digital products directly to consumers and through partnerships, as well as the bulk sales of magazine back issues.
Licensing Revenue Licensing revenues consist of the licensing of the Company’s media content and the licensing of the Company’s technology and collaborative framework to third parties. While the Company has moved away from selling enterprise tools on the legacy ePals platform as a stand-alone product and service in the U.S., this category included residual licensing revenues associated with contracts for the 2013 – 2014 school year. Sponsorship Revenue Sponsorship revenue includes revenues from the Company’s sponsorship agreements with corporate and non-profit sponsors.
Overall Performance The Company has made progress toward several strategic objectives: cutting spending, reducing losses, expanding digital products and marketing, growing its pipeline of products and sales prospects, and opening up new channels domestically and internationally. Recent Developments Media Product Developments: While print subscription circulation decreased during 2015 compared to the prior year period, sales and circulations with a digital component (digital only or bundle) continue to experience strong year-over-year growth. The increased adoption of digital products is aligned with the Company’s strategy to increase its digital presence in response to increased demands for digital content. In the third quarter of 2015, subscriptions with a digital component grew 8% year-over-year. While there has been growth in the number of digital subscriptions, the Company continues to actively work on increasing user engagement associated with its digital products through digital marketing efforts including paid search, email and internet agents. As part of that initiative, the Company has entered into agreements with two major digital newsstands to increase exposure of its products and expand its digital reach. Beginning in April 2015 the Company consolidated its Appleseed and Ask publications and consolidated its Odyssey and Muse publications. While the consolidation of brands will initially have a negative impact on the overall number of circulations, the Company believes both instances of consolidating content from two magazines into one will satisfy the needs of its customers while creating economies of scale and improving margins. Content Licensing: The Company continues to focus on its content licensing business, which typically yields higher margins attributable to low costs associated with readying existing content assets to be licensed. The content licensing pipeline continues to grow, though sales tend to be irregular. Content licensing revenue increased 41% for the three months ended September 30, 2015 compared to the prior year period as the Company continues to expand its pipeline of licensing partners. In addition to new licensing partnerships and increased sales from existing licensing customers, the Company has begun licensing content to institutional customers that were previously bulk purchasers of back issues. The

4
Company expects content licensing and commerce revenue to experience growth though at an irregular pace throughout 2015. Expense Reduction Initiatives: The year-over-year decrease in operating loss for the three months ended September 30, 2015 compared to the prior year period was the seventh consecutive quarter of improvement in year-over-year operating performance. Management continues to evaluate its expenditures and look for more cost effective ways to generate growth. During 2015, the Company consolidated some of its magazine brands (Appleseed consolidated with Ask and Odyssey consolidated with Muse) to streamline its content offerings while creating economies of scale. Additionally, the Company has refocused its marketing efforts by exploring and implementing marketing through more efficient digital outlets. These outlets, which include web and direct email campaigns, are expected to be more cost effective than the catalogs used in prior years with a more profound impact on customer acquisition by more selectively targeting potential customers. Additionally, the Company has outsourced technology development and revamped the technology supporting its Global Community (which was relaunched during the third quarter of 2015). The Company has completed the replacement of its website, its back-end subscription and fulfillment systems and has outsourced customer service. These initiatives are expected to further lower costs as well as improve the Company’s ability to renew and cross sell customers across all product offerings with a state-of-the-art ecommerce system. As the Company focuses on reducing overhead costs and other expenses that are not targeted to enhance near-term revenue growth, management continues to evaluate the Company’s current product offerings in an effort to determine the optimal path to becoming cash flow positive. As a result, management may decide to reduce or reallocate resources associated with certain products and services. These strategic changes may result in a reduction of revenue and expenses generated from the Company’s current products and services. The Company continues to see the benefit of its cost reduction initiatives within its operating results. Operating expenses decreased 43% for the three months ended September 30, 2015 compared to the prior year period, which was primarily the result of reduced headcount and technology costs stemming from previous initiatives to streamline the business as well as other strategic shifts such as the elimination of the print holiday catalog in favor of more direct and cost effective methods. This year-over year decrease was impacted by an impairment loss of $3.0 million during the three months ended September 30, 2014 with no corresponding impairment loss in the current year period. Expansion of China Operations: During 2014, the Company entered into an agreement with Neumedias to develop and distribute interactive digital media products for children throughout China based on the Company’s award winning magazines. Under this agreement, four publication brands of dual English-Chinese language apps and content for toddlers and young children are being offered on smartphones, tablets and smart TVs through Neumedias’ digital media platform, with the potential to expand to additional publication brands. There are currently over 20 titles translated and available for sale in the Nezha Store and more are expected to become available throughout 2015. The translated content created through this agreement is expected to expand the reach of the Company’s media products internationally through distribution directly to users and to third party publishers. Neumedias has also begun to act as an agent for the Company in discussions with publishers to create and sell print versions of the translated content. Additionally, the Company has signed multiple deals with new channel partners that are expected to expand its reach in China. These agreements serve as additional distribution channels for the sale of our content as well as the licensing of our content for inclusion in Chinese publications to aid in language learning for a wide range of ages. The Company continues to explore various options related to the promotion of both its digital and print assets. In conjunction with the Company’s strategy to concentrate resources on products that are expected to generate near-term revenue, the Company continues to closely evaluate its products and initiatives, including those associated with its NeuPals joint venture. Market conditions and changes in management’s overall strategy may result in a shift in the Company’s key initiatives.

5
Results of Operations
Third Quarter 2015 vs. Third Quarter 2014 (Unaudited)
Revenue Subscription revenues decreased 5% year-over-year due to a decrease in circulations, which was partially impacted by the discontinuance of seven brands, three of which were consolidated with other existing brands. Licensing revenues increased by 26% during the three months ended September 30, 2015 compared to the prior year period primarily due to an increase in licensing activity during the current period. The increased licensing revenue is the result of the Company’s continued focus on expanding its licensing business through the unified sales team established earlier this year. Commerce revenue decreased by 34% during the three months ended September 30, 2015 compared to the prior year period due to the de-emphasis of third party product offerings and a slight decrease in bulk sales of back issues of the Company’s magazines in the current year. At September 30, 2015, no single customer accounted for more than 15% of the Company’s net accounts receivable balance. During the three months ended September 30, 2015 and 2014, no one customer accounted for more than 10% of the Company’s revenue. Deferred Revenue Advance payments for the sale of children’s publication subscriptions are deferred and included in revenue on a pro-rata basis over the term of the subscriptions as issues are delivered. Of the $4,159,406 in current deferred revenue at September 30, 2015, $4,089,892 was for advance payments of media subscriptions. The Company had $668,395 in long-term deferred revenue at September 30, 2015, with $589,228 for advance payments of media subscriptions. The remainder of deferred revenue relates primarily to licensing contracts.
2015 2014 %
(in thousands)Revenue:
Subscription 2,236$ 2,360$ (124)$ -5%Licensing 428 339 89 26%Commerce 95 144 (49) -34%Sponsorship 75 - 75 NM
Total: 2,834 2,843 (9) 0%Less: Operating expenses 6,471 11,370 (4,899) -43%Loss from Operations (3,637) (8,527) (4,890) -57%Other income (expense):Change in fair value of derivatives 87 - 87 NMInterest expense, net (534) (1,119) (585) -52%Other income 3 - 3 NMNet foreign currency exchange gain 1,572 927 (645) 70%Loss from continuing operations (2,509)$ (8,719)$ (6,210)$ -71%Income from discontinued operations 58$ 39$ 19$ 49%Net loss (2,451)$ (8,680)$ (6,229)$ -72%Basic and diluted loss per share:
Basic and diluted loss per share from continuing operations (0.08)$ (0.45)$ Basic and diluted loss per share from discontinued operations - -
Basic and diluted net loss per share (0.08)$ (0.45)$
Weighted average shares outstanding - basic and diluted 31,004 19,249
Three months ended September 30, Increase
(Decrease)

6
Total deferred revenue decreased by $2,130,002 between December 31, 2014 and September 30, 2015, which is consistent with the decrease during the prior year period. Deferred revenue is typically highest during the holidays at year-end from renewals on existing media subscriptions and new media subscriptions. Operating Expenses
The decrease in operating expenses during the third quarter of 2015 compared to the prior year is primarily due to the Company’s expense reduction initiatives that included a focus on near-term revenue opportunities, streamlining senior management and identifying outsourcing opportunities.
Marketing and promotion expenses decreased approximately $957,000 for the three months ended September 30, 2015 compared to the prior year period primarily due the revamp of the Company’s marketing initiatives, which included the elimination of the holiday catalog in 2015.
Technology, research and development costs decreased $635,000 for the three months ended September 30, 2015 compared to the prior year period primarily due to a reduction in employee headcount and lower costs related to external professional services related to the Company’s current technological initiatives.
General and administrative expenses decreased approximately $153,000 for the three months ended September 30, 2015 compared to the prior year period primarily due to a reduction of headcount and external professional services as part of the Company’s cost containment initiatives, offset by an increase in legal fees associated with financing and general corporate matters.
Operations and support expenses decreased approximately $75,000 for the three months ended September 30, 2015 compared to the prior year period as a result of reduced employee headcount as the Company continues to streamline its operations.
Stock-based compensation decreased approximately $18,000 for the three months ended September 30, 2015 compared to the prior year period primarily due to a reduction in the fair value of awards vested.
Impairment of goodwill and intangible assets for the three months ended September 30, 2014 included impairment losses related to a full write off of the ePals brand name intangible asset and a write off of the majority of the goodwill within the Company’s ePals cash generating unit. No impairment loss was recognized for the three months ended September 30, 2015.
Operating Expense Detail 2015 2014 %
(dollars in thousands)Cost of sales 1,826$ 1,893$ (67)$ -4%Technology, research and development 474 1,109 (635) -57%Operations and support 710 785 (75) -10%General and administrative 1,331 1,484 (153) -10%Marketing and promotion expenses 1,879 2,836 (957) -34%Stock-based compensation 25 43 (18) -42%Depreciation & amortization 201 244 (43) -18%Change in estimated fair value of acquisition share consideration - (45) 45 100%Impairment of goodwill and intangible assets - 2,962 (2,962) -100%Loss on investment in NeuPals 25 59 (34) -58%Total operating expenses 6,471$ 11,370$ (4,899)$ -43%
Three months ended September 30, Increase
(Decrease)

7
Interest Expense
Interest expense decreased approximately $585,000 during the three months ended September 30, 2015 compared to the prior year period due to lower accretion of interest under the effective interest method used to account for the 2012 Debentures and 2013 Debentures (each as hereafter defined) in the current period compared to the prior year, as well as favorable changes in the exchange rate from CAD to USD.
Net Foreign Currency Exchange Gains
The net foreign currency exchange gains for the three months ended September 30, 2015 was approximately $1,572,000 compared to approximately $927,000 during the prior year period. This year-over-year fluctuation is due to changes in the exchange rate for CAD to USD.
Results of Operations
Nine months Ended September 30, 2015 vs. Nine months Ended September 30, 2014 (Unaudited)
2015 2014 %
(dollars in thousands, except per share data)Revenue:
Subscription 7,924$ 8,517$ (593)$ -7%Licensing 1,150 1,179 (29) -2%Commerce 520 558 (38) -7%Sponsorship and advertising 100 125 (25) -20%
Total: 9,694 10,379 (685) -7%Less: Operating expenses 18,134 25,468 (7,334) -29%Loss from Operations (8,440) (15,089) (6,649) -44%Other income (expense):Change in fair value of derivatives 14 64 (50) -78%Interest expense, net (1,380) (3,254) (1,874) -58%Other income 3 52 (49) -94%Net foreign currency exchange gains 2,702 944 1,758 NMLoss from continuing operations (7,101)$ (17,283)$ (10,182)$ -59%Income from discontinued operations 91$ 8$ 83$ 1038%Net loss (7,010)$ (17,275)$ (10,265)$ -59%Basic and diluted loss per share:
Basic and diluted loss per share from continuing operations (0.23)$ (1.11)$ Basic and diluted loss per share from discontinued operations - -
Basic and diluted net loss per share (0.23)$ (1.11)$
Weighted average shares outstanding - basic and diluted 30,782 15,493
Nine months ended September 30, Increase
(Decrease)

8
Revenue
Subscription revenues decreased 7% year-over-year due to a decrease in circulations, which was partially impacted by the discontinuance of seven brands, three of which were consolidated with other brands. Commerce revenue decreased 7% year-over-year due to lower newsstand and ebook sales. During the nine months ended September 30, 2015 and 2014, no one customer accounted for more than 10% of the Company’s revenue.
Operating Expenses
Technology, research and development costs decreased $1,724,000 for the nine months ended September 30, 2015 compared to the prior year period primarily due to a reduction in employee headcount and lower costs related to external professional services, as well as the outsourcing of technology development work.
Operations and support expenses decreased approximately $494,000 for the nine months ended September 30, 2015 compared to the prior year period as a result of reduced employee headcount as the Company continues to streamline its operations.
General and administrative expenses decreased approximately $567,000 for the nine months ended September 30, 2015 compared to the prior year period primarily due to a reduction of headcount and external professional services as part of the Company’s cost containment initiatives. This variance is partially offset by an increase in legal fees, which is the result of costs related to financing and general corporate matters, and an increase in costs related to contractors primarily due to the use of temporary help as needed for various initiatives. The net cost reduction for the reduction of headcount and increase in contractors was approximately $456,000 for the nine months ended September 30, 2015 compared to the prior year period.
Marketing and promotion expenses decreased approximately $1,077,000 during the nine months ended September 30, 2015 compared to the prior year period due to a reduction in employee headcount and costs associated with print-based marketing campaigns the Company is retiring in favor of more direct, digital methods, partially offset by increased professional service costs related to the development and execution of the Company’s marketing strategy to refocus efforts on digital outlets and an increase in costs related to professional services, which is due to an increase in consulting services in connection the change in strategy from print based marketing to more direct and cost effective means.
Operating Expense Detail 2015 2014 %
(dollars in thousands)Cost of sales 5,971$ 6,212$ (241)$ -4%Technology, research and development 1,717 3,441 (1,724) -50%Operations and support 1,880 2,374 (494) -21%General and administrative 4,230 4,797 (567) -12%Marketing and promotion expenses 3,497 4,574 (1,077) -24%Stock-based compensation 127 291 (164) -56%Depreciation & amortization 611 725 (114) -16%Change in estimated fair value of acquisition share consideration - (136) 136 100%Impairment of goodwill and intangible assets - 2,962 (2,962) -100%Loss on investment in NeuPals 101 228 (127) -56%Total operating expenses 18,134$ 25,468$ (7,334)$ -29%
Nine months ended September 30, Increase
(Decrease)

9
Stock-based compensation decreased approximately $164,000 for the nine months ended September 30, 2015 compared to the prior year period primarily due to a reduction in the fair value of awards vested.
Impairment of goodwill and intangible assets for the nine months ended September 30, 2014 included impairment losses related to a full write off of the ePals brand name intangible asset and a write off of the majority of the goodwill within the Company’s ePals cash generating unit. No impairment loss was recognized for the nine months ended September 30, 2015.
Interest Expense
Interest expense decreased approximately $1,874,000 during the nine months ended September 30, 2015 compared to the prior year period due to lower accretion of interest under the effective interest method used to account for the 2012 Debentures and 2013 Debentures in the current period compared to the prior year, as well as favorable changes in the exchange rate from CAD to USD.
Net Foreign Currency Exchange Gains
The net foreign currency exchange gain for the nine months ended September 30, 2015 was approximately $2,702,000 compared to a gain of approximately $944,000 during the prior year period. This year-over-year fluctuation is due to changes in the exchange rate for CAD to USD.
Summary of Quarterly Results (Unaudited)
The following table sets forth certain unaudited information for each of the Company’s eight most recent quarters. The quarterly information has been derived from the unaudited condensed consolidated interim financial reports of the Company that have been prepared in accordance with IFRS and include all adjustments necessary for the fair presentation of the information presented.
The net loss for the first quarter of 2014 decreased from the fourth quarter of 2013 primarily due to an increase in foreign currency gains and a decrease in operating expenses. Operating expenses for the first quarter of 2014 decreased compared to the prior quarter primarily due to the Company’s cost containment initiatives. Second quarter 2014 revenues were lower than the first quarter of 2014 because our media business ships two subscription issues in the second quarter of each year compared to three subscription issues in the first quarter of each year. The increase in net loss for the second quarter of 2014 compared to the first quarter of 2014 was primarily due to the decrease in revenue and a foreign currency loss in the second quarter compared to foreign currency gains during the first quarter. The decrease in total revenue and increase in net loss for the third quarter of 2014 compared to the second quarter of 2014 were due to decreases in licensing, commerce and sponsorship revenues, partially offset by a slight increase in subscription revenue. The increase in net loss was also due to increases in marketing and promotion expenses and the recognition of impairment losses related to the Company’s ePals brand name intangible and goodwill associated with its ePals cash generating unit, partially offset by decreases in costs of sales, technology costs and general and administrative expenses. Weighted average common shares outstanding increased throughout 2014 primarily due to private placement transactions and the issuance of shares to
2013(in thousands) Q4 Q1 Q2 Q3 Q4 Q1 Q2 Q3
Revenue 4,212$ 4,343$ 3,193$ 2,843$ 4,218$ 3,759$ 3,100$ 2,834$ Net loss (5,545)$ (3,114)$ (5,481)$ (8,680)$ (5,175)$ (1,163)$ (3,396)$ (2,451)$ Net loss per common share (0.56)$ (0.25)$ (0.37)$ (0.45)$ (0.20)$ (0.04)$ (0.11)$ (0.08)$
Weighted average common shares 9,978 12,322 14,833 19,249 25,956 30,389 30,948 31,004
2014
(1) Weighted average common shares outstanding have been adjusted for the 25:1 share consolidation that took place in July 2014.
2015

10
settle amounts outstanding under the Company’s revolving line of credit. The increase in revenues in the fourth quarter of 2014 compared to the third quarter of 2014 primarily relate to seasonal fluctuations in the Company’s revenue related to sales during the holiday season and revenue recognized in connection with use of the Company’s content within standardized testing throughout the US. The net loss for the fourth quarter of 2014 decreased compared to the third quarter of 2014 primarily due to the increases in revenues previously discussed, higher foreign currency gains in the fourth quarter and lower impairment related charges in the fourth quarter.
Revenue for the first quarter of 2015 decreased compared to the fourth quarter of 2014 primarily due to a decline in subscriptions, which was impacted by the consolidation of some of the Company’s magazine brands, and lower licensing revenues. The decrease in licensing revenues partially relates to revenues during the fourth quarter of 2014 associated with the use of the Company’s content in school assessments with no corresponding revenues during the first quarter of 2015. The net loss decreased for the first quarter of 2015 compared to the fourth quarter of 2014 primarily due to decreases in costs of sales, technology and marketing costs, as well as the absence of impairment charges in the current period compared to impairment charges recognized during the previous quarter. The decreases in operating expenses were partially offset by decreases in revenue during the first quarter of 2015 compared to the fourth quarter of 2014. Total revenue for the second quarter of 2015 decreased compared to the first quarter primarily due to a decrease in subscription revenues, which was partially impacted by the timing and number of the Company’s publications between the first quarter and the second quarter of each year. The net loss for the second quarter of 2015 increased compared to the first quarter primarily due to fluctuations in exchange rates for CAD to USD that resulted in a foreign currency exchange loss for the second quarter of 2015 versus the foreign currency exchange gain recognized during the first quarter of 2015. The increase in net loss is also impacted by the decrease in revenue partially offset by a corresponding decrease in cost of sales. Revenue for the third quarter of 2015 decreased compared to the second quarter of 2015 due to the irregular nature of licensing activity and decreases in subscription and licensing revenues, which was impacted by the brand consolidation, which is expected to result in near-term revenue decreases but ultimately be more profitable long term. Net loss for the third quarter of 2015 decreased compared to the second quarter due to lower warehouse costs resulting from the Company’s move to a third party fulfillment company and lower technology costs from external professional consulting services, as well as favorable changes in the exchange rate for CAD to USD. These decreases in costs were partially offset by increased in operations and support costs due to severance costs, and a seasonal increase in marketing costs associated with the preparation for the holiday season.
Financial Condition
Total assets at September 30, 2015 compared to December 31, 2014 decreased by $56,026 primarily due to a decrease in assets held for sale due to the sale of Nexify and a decrease in the Company’s investment in the NeuPals joint venture, offset by an increase in cash and an increase in other intangible assets driven by additions of owned permissions related to the Company’s content. Total liabilities of $40,382,111 at September 30, 2015 represented an increase of $4,533,471 compared to December 31, 2014 primarily due to funds raised through the Company’s bridge financing activities and borrowings under the related party line of credit, offset by a decrease in deferred revenues which is consistent with the seasonal nature of the Company’s business, as well as a decrease in accounts payable and a decrease in the balance of the 2012 Debentures and 2013 Debentures driven by favorable fluctuations in the exchange rate from CAD to USD. Stockholders’ deficit increased by $4,589,497 as of September 30, 2015 compared to December 31, 2014 primarily due to the net loss for the period, partially offset by the issuance of common shares through private placement transactions during the nine months ended September 30, 2015 and the forgiveness of $1,000,000 in related party debt.

11
Liquidity and Capital Resources
At September 30, 2015, the Company had $1,088,857 in cash and a $3,500,000 revolving line of credit with insiders of the Company. As of September 30, 2015, the Company was fully drawn under the $3,500,000 revolving line of credit (discussed below). During the fourth quarter of 2015, the Company extended the repayment period for the revolving line of credit to April 30, 2016.
The Company previously had a $1,500,000 bank line-of-credit with an outstanding balance of $1,425,000. In April 2015 the Company restructured the line-of-credit into a promissory note carrying a 5.0% fixed interest rate with repayment due over five years, which took effect in June 2015. Under the new agreement, which matures on September 30, 2020, the Company will make monthly payments of principal and interest of approximately $27,000 per month.
During the nine months ended September 30, 2015, the Company borrowed approximately $5.3 million and repaid approximately $1.8 million under its related party line of credit. The Company also issued approximately 2.2 million units (“Units”) at a price of CAD$0.65 per Unit for proceeds of approximately $1.25 million under a non-brokered private placement. Each Unit consisted of one common share of the Company and one-third of one common share warrant (each whole common share warrant, a “Warrant”). Each Warrant entitled the holder to purchase one additional common share of the Company at a price of CAD$0.65 until March 31, 2015. Additionally, during the second quarter of 2015, the Company raised net proceeds of approximately $6.4 million through the issuance of debentures under its bridge loan financing (the “2015 Bridge Debentures”) that is part of the Company’s overall debt restructuring (as further discussed below), of which $1,000,000 was used to repay amounts outstanding under the related party line of credit.
In September 2012, the Company entered into an agreement to sell, on a “bought deal” private placement basis, an aggregate principal amount of CAD$12,000,000 of secured convertible debentures (the "2012 Debentures"). In March 2013, the Company entered into a trust indenture providing for the issuance, on a private placement basis, of up to an aggregate principal amount of CAD$10,000,000 in senior secured convertible debentures (the "2013 Debentures"). In March 2015, the Company entered into a binding memorandum of understanding to restructure the debt associated with these debentures in connection with an overall strategic shift in the Company’s capital structure. The debt restructuring of the 2012 Debentures and 2013 Debentures requires the approval of holders of 66 2/3% of the aggregate principal amount of the 2012 Debentures and holders of 66 2/3% of the aggregate principal amount of the 2013 Debentures. The Company is proceeding with the definitive documents necessary to fully effect the debt restructuring. Implementation of the debt restructuring is subject to the acceptance by the TSX-V.. After the implementation of the debt restructuring and assuming the Company raises a minimum of $10 million pursuant to a preferred share financing and the bridge loan financing of $5,000,000, collectively, the Company’s long term debt will be reduced from approximately $22 million to approximately $11 million per the memorandum of understanding.

12
The table below shows the net changes in cash flows for the nine months ended September 30, 2015 and 2014:
Cash used in operating activities and cash used in investing activities decreased for the nine months ended September 30, 2015 compared to the prior year period primarily due to the reduction in operating expenses driven by the Company’s cost containment initiatives. The decrease in cash used in investing activities was driven by absence of cash paid for acquisitions in the current period, as well as $35,000 received for the sale of the Nexify business. Cash provided by financing activities decreased for the nine months ended September 30, 2015 compared to the prior year period due to a slight decrease in funds raised through the Company’s financing activities and an increase in repayments of amounts outstanding under the related party line of credit and bank promissory note. Bank Promissory Note and Debt Covenants At September 30, 2015 and December 31, 2014, the Company is in compliance with all requirements related to its bank promissory note and the 2012 Debentures and 2013 Debentures. Future Working Capital and Capital Expenditure Needs
The Company’s consolidated financial statements and the notes thereto have been prepared on a going concern basis even though the Company currently has insufficient cash to fund its net operating shortfall for the next 12 months. In assessing whether the going concern assumption was appropriate, management took into account all relevant information available to it about the future, which was at least, but not limited to, the 12 month period following September 30, 2015. In order to fund its operating shortfall, the Company is exploring various financing strategies and strategic alternatives including corporate-based, financial investor-based and private equity-based financings, strategic combinations, additional cost reduction initiatives, and other alternatives. The Company believes that based on the financial strength of its existing shareholder base and previous success in raising capital, any shortfall in its operating plan may be met through one or more of these strategies. During the nine months ended September 30, 2015, the Company had a net loss of $7,010,111, negative cash flow from operations of $10,201,998 and a negative working capital of $18,363,619. Historically the Company has had operating losses, negative cash flows from operations, and working capital deficiencies. The Company is subject to liquidity risks generally associated with early-stage media and technology companies, which include fluctuations in operating expenses and revenues, and challenges in securing further equity or debt financing which is subject to prevailing market conditions at that time. If it does not raise alternative financing before exhausting its cash reserves, the Company could be forced to alter its current business plan and expenditure levels. As a positive operating cash flow position has yet to be achieved, the Company currently has insufficient cash to cover its known operating expenditures for the next 12 months and will continue to evaluate its financing alternatives. There can be no assurance that management will be successful in raising the necessary capital required to fund planned operations, or that financing with acceptable terms will be available. These uncertainties may cast significant doubt upon the Company’s ability to continue as a going concern and/or uncertainty related to the capital structure of the
2015 2014
(dollars in thousands)
Net cash used in operating activities (10,202)$ (14,430)$ Net cash used in investing activities (528) (681) Net cash provided by financing activities 10,908 12,498 Increase (decrease) in cash & cash equivalents 178 (2,613)
For the nine months ended September 30,

13
Company. However, as described above, management has a reasonable expectation that the Company will continue for the foreseeable future. If for any reason the Company is unable to continue as a going concern, it could have an adverse effect on the Company’s ability to realize assets at their recognized values, in particular goodwill and intangible assets, and to extinguish liabilities in the normal course of business at the amounts stated in the unaudited condensed consolidated interim financial report. During the nine months ended September 30, 2015, the Company borrowed approximately $5.3 million and repaid approximately $1.8 million under its related party line of credit with ZG Ventures, LLC (“ZG”), an affiliate of two members of the Company’s Board of Directors, and also raised net proceeds of approximately $6.4 million through the issuance of debentures under its bridge loan financing that is part of the Company’s overall debt restructuring. Additionally, ZG forgave $1,000,000 of debt outstanding under the related party line of credit in March 2015. The Company also issued approximately 2.2 million Units at a price of CAD$0.65 per Unit for proceeds of approximately $1.25 million under a non-brokered private placement. Each Unit consisted of one common share of the Company and one-third of Warrant. Each Warrant entitled the holder to purchase one additional common share of the Company at a price of CAD$0.65 until March 31, 2015. The Company actively manages its liquidity through cash, debt and capital stock management strategies to fulfill obligations associated with financial liabilities, mainly accounts payable, accrued liabilities and the debentures. To manage liquidity risk, the Company, among other things, prepares budgets and cash forecasts and monitors its performance against these projections. Management also monitors cash and working capital efficiency given current sales levels and seasonal variability. The 2012 Debentures and 2013 Debentures have a maturity date of October 31, 2016. In April 2015, the Company reached an agreement to restructure its debt outstanding under the 2012 Debentures and 2013 Debentures. See “Subsequent Events” for additional information on debt activity. The bridge loan debentures have a maturity date of April 30, 2016. Future capital requirements will depend on many factors, including, without limitation, the rate of revenue growth, the expansion of marketing and sales activities, the timing and extent of spending to support product development efforts and expansion into new territories, the timing of the release of new products and services and enhancements to existing products and services, acquisition activity, the timing of capital expenditures and expenses associated with web hosting and the continuing market acceptance of the Company’s products and services. Off-Balance Sheet Arrangements The Company’s off-balance sheet arrangements are comprised of operating leases entered into in the normal course of business. The Company has no other off-balance sheet arrangements and does not anticipate entering into any such arrangements other than in the normal course of business. Transactions with Related Parties In March 2015, ZG forgave an aggregate of $1,000,000 of indebtedness outstanding under the Company’s revolving line of credit. As partial consideration for the forgiveness of debt, Cricket Media, Inc. agreed, subject to certain conditions, to indemnify Miles Gilburne and Nina Zolt, the principals of ZG, from all payment obligations that may be incurred by them in connection with a personal guarantee they have provided in connection with the Company’s bank line-of-credit with The National Capital Bank of Washington, whereby they have guaranteed the repayment by Cricket Media, Inc. of $1,500,000 of indebtedness incurred by Cricket Media, Inc. pursuant to a commercial line of credit with The National Capital Bank of Washington prior to the restructuring of that debt in June 2015. ZG also provided a payment guaranty to The National Capital Bank of Washington related to the promissory note replacing the revolving bank line of credit. During the nine months ended September 30, 2015, the Company issued debentures associated with the bridge financing component of the Company’s overall debt restructuring. Of the $6.4 million in debentures

14
issued as of September 30, 2015, approximately $1.6 million are held by ZG, an affiliate of two members of the Company’s Board of Directors. As of September 30, 2015, $9,750,000 of the 2013 Debentures outstanding were held by existing investors and an affiliate of two members of the Company’s Board of Directors. In 2013, the Company entered into a publishing agreement with NeuPals for the translation and publication of Chinese language versions of the Company’s children’s magazines and content. NeuPals will pay royalty payments to the Company based on a percentage of NeuPals’ gross sales revenue from the sale of Chinese-translated magazines, books and back issues it translates (the “Derivatives”). The Company will pay to NeuPals royalty payments calculated as a percentage of the Company’s gross sales revenue from Derivatives sold outside of China. No revenues were earned and no royalties were incurred under this agreement during the three and nine months ended September 30, 2015. NeuPals and NeuEdu are affiliated with Neusoft Holdings. Financial Instruments and Other Instruments
The Company holds various forms of financial instruments, including cash, certificates of deposit, accounts receivable, convertible debentures, notes payable to related parties, accounts payable, finance leases and a bank promissory note. The nature of these instruments and its operations expose the Company to currency risk, credit risk, interest rate risk and liquidity risk. Liquidity risk See “Future Working Capital and Capital Expenditure Needs” in this MD&A for information about the Company’s liquidity risk. Interest rate risk Interest rate risk is defined as the risk that the fair value or future cash flows of a financial instrument held by the Company will fluctuate because of changes in interest rates. The 2012 Debentures have a fixed interest rate of 6.50% per annum and the 2013 Debentures have a fixed interest rate of 10.00% per annum. Additionally, the 2015 Bridge Debentures have a fixed interest rate of 5% per annum. The Company’s only exposure to interest rate risk from these debentures is from a cost of funds perspective. If interest rates rise, the value of the convertible debentures decreases. In March 2015, the Company entered into a binding memorandum of understanding to restructure the debt outstanding under the 2012 Debentures and 2013 Debentures. The Company was previously exposed to interest rate risk on its $1,500,000 bank line-of-credit as amounts borrowed accrue interest at the Wall Street Journal prime rate minus 0.50%, but not less than 4.5% per annum. Due to the low current market interest rates, exposure to interest rate risk is minimal. In April 2015 the Company restructured the line-of-credit to carry a fixed 5.0% interest rate with repayment due over five years, which took effect in June 2015. Under the new line-of-credit, which matures on September 30, 2020, the Company will make monthly payments of principal and interest of approximately $27,000 per month. Currency risk The Company is required to pay the principal and interest payments on the 2012 Debentures and the 2013 Debentures in CAD which creates an exposure to currency risk between CAD and the Company’s functional currency of USD. The related debenture agreements specify that for the computation of the principal and interest payments, any currency other than CAD shall be converted into CAD at the applicable Bank of Canada noon rate of exchange on the date which such computation is to be made. In March 2015, the Company signed a binding memorandum of understanding for a debt restructuring that would restructure the debenture debt outstanding in CAD into debt outstanding in USD.

15
Subsequent Events
In October 2015, the Company closed an additional tranche of its secured convertible debentures (the “Junior Bridge Debentures”) and has issued additional Junior Bridge Debentures in the aggregate principal amount of $250,000. The Junior Bridge Debentures are convertible into voting common shares or restricted voting common shares of the Company at the option of the holder at a conversion price of $0.25 per share. In the event that the Company raises aggregate gross proceeds of a minimum of $10 million pursuant to an equity financing of preferred shares (the “Financing”) and the $5,000,000 bridge loan described in the Company’s news release dated July 16, 2015 (the “Existing Bridge Loan”), collectively, all outstanding indebtedness under the Junior Bridge Loan will convert into, at the option of the holder: (A) preferred shares at a conversion price equal to the greater of: (i) 80% of the issue price per share under the Financing; and (ii) $0.25; or (B) voting common shares or restricted voting common shares at a price of $0.25 per share, or a combination of (A) and (B) at the holder’s option. These Junior Bridge Debentures expire on April 30, 2016. In November 2015, the Company issued additional Junior Bridge Debentures in the aggregate principal amount of $190,000. These Junior Bridge debentures were issued under the same terms as those issued in October 2015. Additionally, the Company extended the repayment terms associated with its related party line of credit. The repayment date of all outstanding principal and interest has been extended to April 30, 2016. All other terms remain unchanged.

16
Outstanding Share Data
The Company is authorized to issue an unlimited number of voting common shares, an unlimited number of restricted voting common shares and an unlimited number of preferred shares, issuable in series. The following table sets forth the details of voting common shares and restricted voting common shares outstanding as of November 13, 2015 and securities that are exercisable or convertible into voting common shares or restricted voting common shares. No preferred shares of the Company are outstanding as of November 13, 2015.
Type Number of
Shares Voting common shares 7,948,466 Restricted voting common shares(1) 23,117,199 Outstanding securities convertible into voting common shares and/or restricted voting common shares:
Cricket Media, Inc. stock options Number of voting common shares and/or restricted voting common shares issuable upon exercise of stock options
90,100
Cricket Media Group Ltd. stock options Number of voting common shares and/or restricted voting common shares issuable upon exercise of stock options
2,880,964
Total Cricket Media Group Ltd. common shares that would be issued upon conversion of Cricket Media, Inc.’s stock options and Cricket Media Ltd.’s stock options
2,971,064
Cricket Media, Inc. warrants(2) Number of voting common shares and/or restricted voting common shares issuable upon exercise of warrants
154,424
Cricket Media Group Ltd. warrants Number of voting common shares and/or restricted voting common shares issuable upon exercise of warrants
-
Total Cricket Media Group Ltd. common shares that would be issued upon conversion of Cricket Media, Inc.’s common and preferred warrants and Cricket Media Group Ltd.’s warrants
154,424
2012 Debentures Number of voting common shares issuable upon conversion of 2012 Debentures 800,000 2013 Debentures(3) Number of voting common shares issuable upon conversion of 2013 Debentures 1,000,000 Total voting common shares that would be issued upon conversion of 2012 and 2013 Debentures 1,800,000 Restricted stock units 125,385
Notes:
(1) Each restricted voting common share is convertible into one voting common share. (2) Common and preferred stock warrants issued by Cricket Media, Inc. are convertible into common shares of the Company
on a one-for-one basis, subject to adjustment based on stock splits, etc. These warrants are exercisable at the option of the holder and expire at various dates, depending on when they were issued, or the effective date of the first registration statement filed with the Securities and Exchange Commission, or the consummation of an acquisition or asset sale. The warrants to purchase common shares includes a performance warrant for the right to purchase 313,237 shares of Cricket Media, Inc. common shares, subject to specific vesting provisions which may or may not be met.
(3) Shares issuable upon conversion of the 2013 Debentures issued as of November 13, 2015 are as follows: 300,000 voting common shares for the conversion of the CAD$3,000,000 tranche of the 2013 Debentures issued
in March 2013 200,000 voting common shares for the conversion of the CAD$2,000,000 tranche of the 2013 Debentures issued
in April 2013

17
150,000 voting common shares for the conversion of the CAD$1,500,000 tranche of the 2013 Debentures issued on May,10 2013
125,000 voting common shares for the conversion of the CAD$1,250,000 tranche of the 2013 Debentures issued on May 31, 2013
225,000 voting common shares for the conversion of the CAD$2,250,000 tranche of the 2013 Debentures issued in August 2013.