crh medical corporation spec buy spec buy … · we reiterate the key factors that will be...
TRANSCRIPT

ACUMEN CAPITAL FINANCE PARTNERS LIMITED | SUITE 700 – 404 – 6th AVENUE SW | CALGARY, AB | T2P 0R9 MAIN PHONE: 403.571.0300 | TOLL FREE: 1.888.422.8636
January 15, 2016
New Year and Fresh Look at Our Coverage List
As the outlook for 2016 starts to crystallize, we are revisiting our assumptions and models for our coverage list names. Most of our companies have lost momentum as demand for small cap names weakened. Some of our better names are tracking the overall fall in the markets, while other names have more company specific factors that are adding downward momentum. Sorting through the names, we think there are opportunities that have surfaced for the patient investor. With Q3 reporting the last disclosure for many of our names, there is limited new information in many cases. In this document, we reiterate the key factors that will be constructive in understanding the next moves and add incremental information where available.
In general, it appears that many of our names are oversold with valuations below historical levels. While investors need to be vigilant and appropriately gauge near-term risks, being too cautious may overshadow longer-term potential. Companies in a position to allocate capital to growth initiatives without the need to tap the markets will have a clear advantage.
From a stock selection perspective, we don’t think it will be difficult for investors to get positive returns from CRH, GWR, and PFB in 2016. We also think AD has good potential, but the Company will need to quickly put to rest some of the partner problems that surfaced last year. Offsetting this, we see some of the names to be more range bound until more Company specific market fundamentals improve.
As Figure 1 shows, we are making revisions to certain target prices to reflect change in estimates as well as the heightened market risk. Price target changes include increases for SJ, and decreases for BDI, CMG, CVL, FFF, and GH.
FIGURE 1 | SPECIAL SITUATIONS COVERAGE LIST | CHANGES TO TARGET PRICES
Source: Acumen Capital Partners, Figures subject to rounding; Recommendation structure
Old New Old New
Alaris Royalty Corporation BUY BUY $35.00 $35.00
AlarmForce Industries Inc. SPEC BUY SPEC BUY $12.70 $12.70
Axia NetMedia Corporation BUY BUY $3.90 $3.90
Black Diamond Group Ltd. SPEC BUY SPEC BUY $10.90 $7.30
Brightpath Early Learning Inc. SPEC BUY SPEC BUY $0.360 $0.360
Cervus Equipment Corporation BUY BUY $16.40 $15.30
Computer Modelling Group BUY BUY $12.90 $10.50
CRH Medical Corporation SPEC BUY SPEC BUY $5.60 $5.60
DirectCash Payments Inc. BUY BUY $22.90 $22.90
Gamehost Inc. SPEC BUY SPEC BUY $11.30 $10.50
Global Water Resources Corp SPEC BUY SPEC BUY $8.30 $8.30
Input Capital Corp. SPEC BUY SPEC BUY $3.80 $2.60
K-Bro Linen Inc. BUY BUY $53.00 $53.00
MCAN Mortgage Corporation SPEC BUY SPEC BUY $13.30 $13.30
Mediagrif Interactive Technologies Inc. BUY BUY $23.00 $23.00
Northern Frontier Corp. HOLD HOLD $0.65 $0.42
People Corporation SPEC BUY SPEC BUY $3.50 $3.50
PFB Corporation SPEC BUY SPEC BUY $14.00 $14.00
Park Lawn Corp SPEC BUY SPEC BUY $14.40 $14.40
Stella-Jones Inc. BUY BUY $50.00 $52.50
CompanyRecommendation Target
Special Situations 2016 Outlook
ACUMEN CAPITAL | RESEARCH IDEAS. GROWTH. OPPORTUNITY.
Brian D. Pow, MBA | Vice President Research and Equity Analyst | (403) 571-0303 | [email protected] Oliver Shao | Associate Analyst | (403) 410-6840 | [email protected]
Mike McMeeken | Associate Analyst | (403) 571-0530 | [email protected]

January 15, 2016 ACUMEN CAPITAL | RESEARCH IDEAS. GROWTH. OPPORTUNITY.
Page 2 of 19
Small Cap Growth Update (2016 Outlook) Acumen Capital Finance Partners Limited #700, 404 – 6 Avenue SW | Calgary, AB | T2P 0R9| Main Phone: 403-571-0300
Figure 2 is a run-down of our coverage lists price performance.
FIGURE 2 | SPECIAL SITUATIONS COVERAGE LIST | STOCK PERFORMANCE
Source: Bloomberg, Acumen Capital Partners, Figures subject to rounding
DIVIDEND YIELDS
Figure 3 includes our dividend paying names. Now that many of our names have suffered a good degree of price compression, the yields are really starting to stand out. We are closely watching the payout ratios and the sustainability of the dividend for each Company. The higher yield stocks (> 6.0%) that appear to have a high prospect of well-being are AD, DCI, and MKP.
FIGURE 3 | SPECIAL SITUATIONS COVERAGE LIST | DIVIDEND YIELD & PAYOUT
Source: Bloomberg, Acumen Capital Partners, Figures subject to rounding
Company Ticker S/O (M)Market Cap
($M)
Recent Price
(Jan 14, 2016)
52 Week
Low
52 Week
High
1-Month
Return (%)
3-Month
Return (%)
1-Year
Return (%)
Alaris Royalty Corp. AD 35.8m $810.9m $22.67 $21.42 $37.21 2.8% (16.0%) (34.4%)
AlarmForce Industries Inc. AF 11.6m $125.77 $10.87 $9.87 $11.98 – (8.3%) (6.5%)
Axia NetMedia Corporation AXX 64.2m $186.1m $2.90 $2.72 $3.51 (3.7%) (10.5%) (8.5%)
Black Diamond Group Limited BDI 41.1m $204.7m $4.98 $4.89 $18.26 (17.7%) (45.0%) (51.7%)
BrightPath Early Learning Inc. BPE 120.6m $32.6m $0.27 $0.25 $0.45 (10.0%) (18.2%) (22.9%)
Cervus Equipment Corp. CVL 15.6m $205.3m $13.19 $12.71 $20.07 (4.4%) (8.8%) (31.2%)
Computer Modelling Group CMG 78.5m $675.4m $8.60 $8.22 $14.60 (4.4%) (27.5%) (21.2%)
CRH Medical Corporation CRH 71.0m $251.3m $3.54 $2.02 $5.50 (2.9%) (16.4%) 52.5%
DirectCash Payments Inc. DCI 17.6m $192.6m $10.97 $10.00 $19.08 5.2% (14.6%) (39.2%)
Gamehost Inc. GH 24.7m $200.8m $8.12 $7.90 $13.50 (9.7%) (18.2%) (38.5%)
Global Water Resources Corp GWR 8.7m $63.9m $7.30 $4.29 $8.92 0.7% 6.6% 66.9%
Input Capital Corp. INP 81.6m $134.7m $1.65 $1.55 $3.45 (2.9%) (36.3%) (25.7%)
K-Bro Linen Inc. KBL 8.0m $397.2m $49.74 $43.00 $57.68 0.1% (3.1%) 7.7%
MCAN Mortgage Corporation MKP 22.8m $259.0m $11.37 $10.40 $14.24 (4.9%) (12.9%) (16.7%)
Mediagrif Interactive Technologies Inc. MDF 15.0m $240.3m $16.00 $15.95 $18.44 (1.5%) (4.3%) (12.8%)
Northern Frontier Corp. FFF 27.8m $9.4m $0.34 $0.32 $0.80 (40.4%) (54.1%) (16.0%)
People Corporation PEO 45.0m $130.8m $2.91 $2.51 $4.84 (9.1%) (17.6%) 8.6%
PFB Corporation PFB 6.7m $66.0m $9.83 $4.18 $10.66 9.8% 13.5% 124.9%
Park Lawn Corp PLC 5.8m $68.6m $11.73 $10.40 $13.80 (2.3%) 2.9% (11.3%)
Stella-Jones Inc. SJ 69.1m $3,317.9m $48.00 $33.29 $54.15 (7.0%) 8.8% 43.5%
2016E Payout 3 Year Dividend
Annualized Paid Recent Price Target Price Ratio CAGR Note
Alaris Royalty Corp. $1.62 Monthly 7.1% 4.6% 80.8% 8.7% Hikes effective 6/2015 from $1.50 to $1.56, then 7/2015 to $1.62 p.a.
AlarmForce Industries Inc. $0.18 Quarterly 1.7% 1.4% 17.0% 21.6% Hike effective 4/2015 from $0.12 to $0.18 p.a.
Axia NetMedia Corporation $0.05 Quarterly 1.7% 1.3% 54.6% n/a
Black Diamond Group Limited $0.60 Monthly 12.0% 8.2% 33.2% (5.9%) Cut effective 11/2015 from $0.96 to $0.60 p.a.
BrightPath Early Learning Inc. n/a n/a n/a n/a n/a –
Cervus Equipment Corp. $0.85 Quarterly 6.4% 5.6% 40.8% 3.8% Hike effective 3/2015 from $0.84 to $0.85 p.a.
Computer Modelling Group $0.40 Quarterly 4.7% 3.8% 85.4% 7.7%
CRH Medical Corporation n/a n/a n/a n/a n/a n/a
DirectCash Payments Inc. $1.44 Monthly 13.1% 6.3% 48.5% 1.4%
Gamehost Inc. $0.88 Monthly 10.8% 8.4% 99.1% –
Global Water Resources Corp $0.34 Monthly 4.7% 4.1% 98.7% 0.0% Hikes effective 12/2015 from $0.288 to $0.312, then 8/2015 to $0.3396 p.a.
Input Capital Corp. n/a n/a n/a n/a n/a n/a
K-Bro Linen Inc. $1.20 Monthly 2.4% 2.3% 37.0% 1.4%
MCAN Mortgage Corporation* $1.16 Quarterly 10.2% 8.7% 100.0% 1.2% Hike effective 12/2015 from $1.12 to $1.16 p.a.
Mediagrif Interactive Technologies Inc. $0.40 Quarterly 2.5% 1.7% 28.0% –
Northern Frontier Corp. Susp n/a n/a n/a n/a n/a Continues to be suspended from F14 announcement
People Corporation n/a n/a n/a n/a n/a n/a
PFB Corporation $0.24 Quarterly 2.4% 1.7% 13.4% –
Park Lawn Corp $0.46 Monthly 3.9% 3.2% 35.9% 0.0%
Stella-Jones Inc. $0.32 Quarterly 0.7% 0.6% 10.4% 28.7% Hike effective 3/2015 from $0.28 to $0.32 p.a.
*Mortgage Investment Corps must pay 100% of taxable income in the form of a dividend.
Dividend Dividend YieldCompany

January 15, 2016 ACUMEN CAPITAL | RESEARCH IDEAS. GROWTH. OPPORTUNITY.
Page 3 of 19
Small Cap Growth Update (2016 Outlook) Acumen Capital Finance Partners Limited #700, 404 – 6 Avenue SW | Calgary, AB | T2P 0R9| Main Phone: 403-571-0300
UPCOMING REPORTING
Figure 4 shows the expected timings for our coverage list’s next set of reporting. We have reached out to the companies to get a sense of when the next financial report is expected. For certain names, we are using the prior year’s earnings release dates as a proxy for when we can expect the numbers.
FIGURE 4 | SPECIAL SITUATIONS COVERAGE LIST | REPORTING CHART
Source: Coverage List Companies, SEDAR
Alaris Royalty Corporation Q415 March 8, 2016
AlarmForce Industries Inc. Q415 January 21, 2016
Axia NetMedia Corporation Q415 March 10, 2016
Black Diamond Group Ltd. Q415 March 3, 2016
Brightpath Early Learning Inc. Q415 March 30, 2016
Cervus Equipment Corporation Q415 March 16, 2016
Computer Modelling Group Q316 February 10, 2016
CRH Medical Corporation Q415 Late February
DirectCash Payments Inc. Q415 March 21, 2016
Gamehost Inc. Q415 March 8, 2016
Global Water Resources Corp Q415 Late March
Input Capital Corp. Q316 Early February
K-Bro Linen Inc. Q415 Mid March
MCAN Mortgage Corporation Q415 Late February
Mediagrif Interactive Technologies Inc. Q316 February 9, 2016
Northern Frontier Corp. Q415 March 23, 2016
People Corporation Q116 January 25, 2016
PFB Corporation Q415 Early March
Park Lawn Corp Q415 Late April
Stella-Jones Inc. Q415 March 16, 2016
CompanyEarnings
Release
Expected
Date/Period

January 15, 2016 ACUMEN CAPITAL | RESEARCH IDEAS. GROWTH. OPPORTUNITY.
Page 4 of 19
Small Cap Growth Update (2016 Outlook) Acumen Capital Finance Partners Limited #700, 404 – 6 Avenue SW | Calgary, AB | T2P 0R9| Main Phone: 403-571-0300
ALARIS ROYALTY CORP. (TSX:AD)
Source: Coverage List Companies, SEDAR
Shares of AD fell 33.5% in F15, reflecting the challenging markets and a number of partner missteps. Looking at the early trading for 2016, the market appears to still be digesting the challenges of 2015. Despite recent partner missteps, AD still carries an attractive payout ratio in the face of these challenges, highlighting the power of the business model. AD is already seeing some activity as we start 2016.
Earlier this week, AD announced a new partnership contribution of~US$13.3M (~CAD$18.5M) into MAHC Holdings, LLC ("Mid-Atlantic Health Care", or "MAHC") effective December 31, 2015. MAHC is an operator of nursing homes and used the proceeds to purchase four facilities. The first year distribution of ~US$2.0M (~CAD$2.8M) translates to a 15% yield. The distribution is subject to an annual adjustment of +/- 5% based on the percent change in net revenue.
Centric Health Corporation (CHH:TSX, not covered) confirmed the sales of its physiotherapy, rehabilitation, and medical assessments business to a private equity group for $245.0M last week. Recall that Alaris sold ~50% of LifeMark Health to Centric Health in 2011 for ~$65.0M and in 2013, CHH repurchased ~$30.0M leaving ~$35.5M outstanding. The expected royalty from CHH for 2016 was ~$4.4M and AD had LifeMark recorded at a fair value of $38.4M. AD will redeploy the proceeds
As a result of its new and larger credit facility, the Company has the potential to execute on additional acquisitions and increase the dividend a number of times before needing to raise additional equity. The Company continues to move the files forward on a number of investment opportunities, and we expect the first half of the year to be fairly active. Our model calls for $175.0M of investment this year.
AD has a lot of imbedded value that is attractively priced at current levels. We recently revised our target to $35.00 (old $40.00) as a result of increasing the small cap risk premium in our DCF model to account for recent challenges and the current market environment.
ALARMFORCE INDUSTRIES INC. (TSX:AF)
Source: Coverage List Companies, SEDAR
BUY Alaris Royalty Corp. (AD:TSX)
Recent Share Price $22.67 2014 2015E 2016E 2017E12-Month Price Target $35.00 Revenue ($MM) $66.7 $79.6 $107.1 $137.2Capital Return 54.4% Y/Y Growth 34.5% 19.3% 34.6% 28.1%
Total Return 61.5% Normalized EBITDA ($MM) $57.4 $71.1 $91.9 $121.0Market Cap ($MM) $810.9 Y/Y Growth 30.6% 23.9% 29.2% 31.7%
S/O (mm) 35.8 Reported EPS (dil.) $1.58 $1.49 $1.73 $2.19Current EV ($MM) $869.6 Y/Y Growth 45.1% (5.5%) 15.9% 26.4%Financial Year End Dec-31Dividend (Monthly) $0.14 P/Sales 12.2x 10.2x 7.6x 5.9xDividend Yield 7.1% EV/Normalized EBITDA 15.2x 12.2x 9.5x 7.2x2016E Payout Ratio 80.8% P/Normalized EBITDA 14.1x 11.4x 8.8x 6.7x
P/E 14.4x 15.2x 13.1x 10.4x
Net Debt ($MM) $22.0 $58.8 $60.3 $167.2Net Debt/Normalized EBITDA 0.4x 0.8x 0.7x 1.4xDebt/Equity 0.1x 0.1x 0.1x 0.2x
SPEC BUY AlarmForce Industries Inc. (AF:TSX)
Recent Share Price $10.87 2013 2014 2015E 2016E12-Month Price Target $12.70 Subscribers 141,200 144,700 148,452 152,906Capital Return 16.8% Y/Y Growth 5.3% 2.5% 2.6% 3.0%
Total Return 18.5% Sales ($MM) $49.1 $52.6 $55.7 $57.3Market Cap ($MM) $125.8 Y/Y Growth 9.5% 7.1% 5.9% 3.0%
S/O (mm) 11.6 EBITDA ($MM) $12.8 $15.9 $14.4 $13.7Current EV ($MM) $120.6 Y/Y Growth 105.2% 23.9% (9.5%) (4.4%)
Financial Year End Oct-31 EPS (dil.) $0.45 $0.65 $0.38 $0.46Dividend (Quarterly) $0.05 Y/Y Growth 373.8% 45.9% (42.3%) 23.1%
Dividend Yield 1.7%2016E Payout Ratio 17.0% P/Sales 2.6x 2.4x 2.3x 2.2x
EV/EBITDA 9.4x 7.6x 8.4x 8.8xP/EBITDA 9.8x 7.9x 8.8x 9.2xP/E 24.2x 16.6x 28.8x 23.4x
Net Debt (Cash) ($MM) ($2.3) ($4.7) ($5.8) ($8.9)Net Debt/EBITDA 0.0x 0.0x 0.0x 0.0xDebt/Equity 0.0x 0.0x 0.0x 0.0x
January 15, 2016 ACUMEN CAPITAL | RESEARCH IDEAS. GROWTH. OPPORTUNITY.
Page 5 of 19
Small Cap Growth Update (2016 Outlook) Acumen Capital Finance Partners Limited #700, 404 – 6 Avenue SW | Calgary, AB | T2P 0R9| Main Phone: 403-571-0300
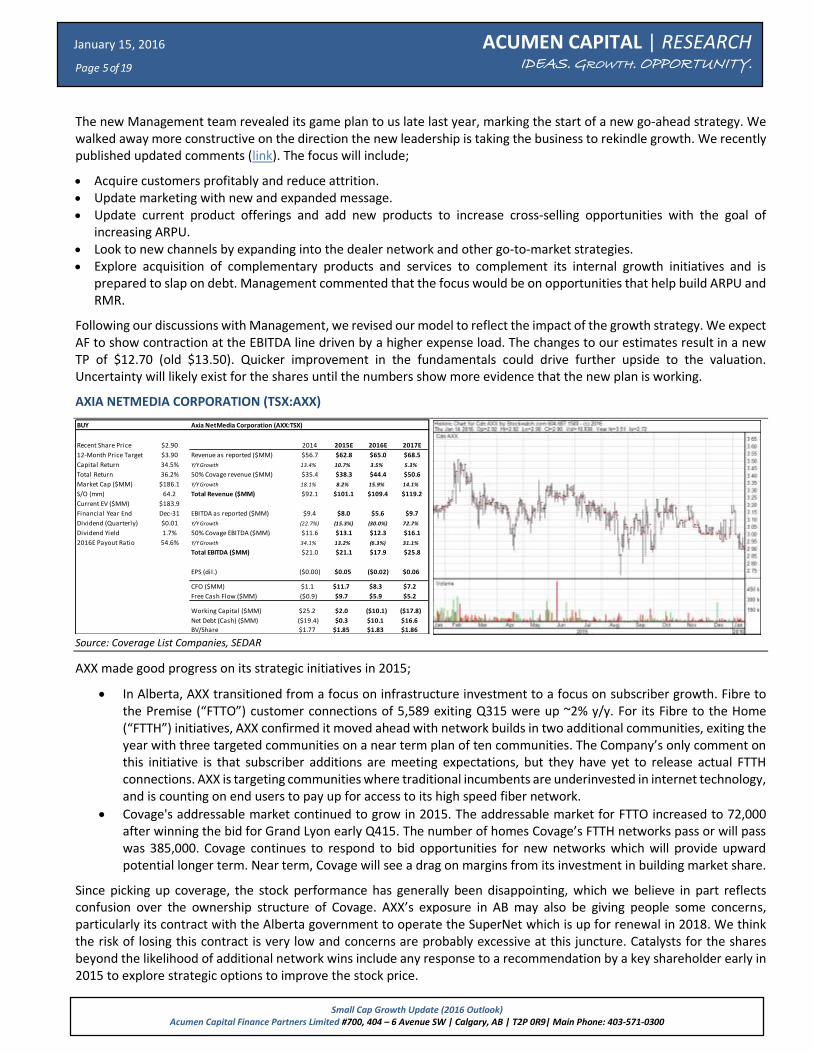
The new Management team revealed its game plan to us late last year, marking the start of a new go-ahead strategy. We walked away more constructive on the direction the new leadership is taking the business to rekindle growth. We recently published updated comments (link). The focus will include;
Acquire customers profitably and reduce attrition. Update marketing with new and expanded message. Update current product offerings and add new products to increase cross-selling opportunities with the goal of
increasing ARPU. Look to new channels by expanding into the dealer network and other go-to-market strategies. Explore acquisition of complementary products and services to complement its internal growth initiatives and is
prepared to slap on debt. Management commented that the focus would be on opportunities that help build ARPU and RMR.
Following our discussions with Management, we revised our model to reflect the impact of the growth strategy. We expect AF to show contraction at the EBITDA line driven by a higher expense load. The changes to our estimates result in a new TP of $12.70 (old $13.50). Quicker improvement in the fundamentals could drive further upside to the valuation. Uncertainty will likely exist for the shares until the numbers show more evidence that the new plan is working.
AXIA NETMEDIA CORPORATION (TSX:AXX)
Source: Coverage List Companies, SEDAR
AXX made good progress on its strategic initiatives in 2015;
In Alberta, AXX transitioned from a focus on infrastructure investment to a focus on subscriber growth. Fibre to the Premise (“FTTO”) customer connections of 5,589 exiting Q315 were up ~2% y/y. For its Fibre to the Home (“FTTH”) initiatives, AXX confirmed it moved ahead with network builds in two additional communities, exiting the year with three targeted communities on a near term plan of ten communities. The Company’s only comment on this initiative is that subscriber additions are meeting expectations, but they have yet to release actual FTTH connections. AXX is targeting communities where traditional incumbents are underinvested in internet technology, and is counting on end users to pay up for access to its high speed fiber network.
Covage's addressable market continued to grow in 2015. The addressable market for FTTO increased to 72,000 after winning the bid for Grand Lyon early Q415. The number of homes Covage’s FTTH networks pass or will pass was 385,000. Covage continues to respond to bid opportunities for new networks which will provide upward potential longer term. Near term, Covage will see a drag on margins from its investment in building market share.
Since picking up coverage, the stock performance has generally been disappointing, which we believe in part reflects confusion over the ownership structure of Covage. AXX’s exposure in AB may also be giving people some concerns, particularly its contract with the Alberta government to operate the SuperNet which is up for renewal in 2018. We think the risk of losing this contract is very low and concerns are probably excessive at this juncture. Catalysts for the shares beyond the likelihood of additional network wins include any response to a recommendation by a key shareholder early in 2015 to explore strategic options to improve the stock price.
BUY Axia NetMedia Corporation (AXX:TSX)
Recent Share Price $2.90 2014 2015E 2016E 2017E
12-Month Price Target $3.90 Revenue as reported ($MM) $56.7 $62.8 $65.0 $68.5
Capital Return 34.5% Y/Y Growth 13.4% 10.7% 3.5% 5.3%
Total Return 36.2% 50% Covage revenue ($MM) $35.4 $38.3 $44.4 $50.6
Market Cap ($MM) $186.1 Y/Y Growth 18.1% 8.2% 15.9% 14.1%
S/O (mm) 64.2 Total Revenue ($MM) $92.1 $101.1 $109.4 $119.2
Current EV ($MM) $183.9
Financial Year End Dec-31 EBITDA as reported ($MM) $9.4 $8.0 $5.6 $9.7
Dividend (Quarterly) $0.01 Y/Y Growth (22.7%) (15.3%) (30.0%) 72.7%
Dividend Yield 1.7% 50% Covage EBITDA ($MM) $11.6 $13.1 $12.3 $16.1
2016E Payout Ratio 54.6% Y/Y Growth 34.1% 13.2% (6.3%) 31.1%
Total EBITDA ($MM) $21.0 $21.1 $17.9 $25.8
EPS (dil.) ($0.00) $0.05 ($0.02) $0.06
CFO ($MM) $1.1 $11.7 $8.3 $7.2
Free Cash Flow ($MM) ($0.9) $9.7 $5.9 $5.2
Working Capital ($MM) $25.2 $2.0 ($10.1) ($17.8)
Net Debt (Cash) ($MM) ($19.4) $0.3 $10.1 $16.6
BV/Share $1.77 $1.85 $1.83 $1.86

January 15, 2016 ACUMEN CAPITAL | RESEARCH IDEAS. GROWTH. OPPORTUNITY.
Page 6 of 19
Small Cap Growth Update (2016 Outlook) Acumen Capital Finance Partners Limited #700, 404 – 6 Avenue SW | Calgary, AB | T2P 0R9| Main Phone: 403-571-0300
BLACK DIAMOND GROUP LTD. (TSX:BDI)
Source: Coverage List Companies, SEDAR
Black Diamond is a good Company with a great Management team in a challenging sector. All indications are that the sector will take some time to return to favor.
We are making revisions to our estimates for for 2016 (old: revenue $297.2M EBITDA $99.0M, new: revenue $245.6M EBITDA $76.1M) and 2017 (old: revenue $308.6M EBITDA $103.4M, new: revenue $256.4M EBITDA $80.0M), given the continued negative commentary for global energy markets. Even if we see a turnaround in pricing somewhere in 2016, we expect H116 to be challenging and believe there is considerable risk to the back half of the year as well. We are concerned about what the new royalty plan in Alberta could do to the oil sands market, which could add further pain for BDI shareholders. We see the potential for further contraction in the market should the government take aim at reducing oil sands production. The optionality of LNG activities is also taking longer to materialize.
As a result of our new estimates, the target price reduces to $7.30 (old $10.90) based on the peer F16e EV/EBITDA of 5.9x. We have historically seen BDI trade at a slight premium to peers to account for strong historical execution and the absence of manufacturing. In more normal times, we believe a range between 6.5x and 7.0x EV/NTM EBITDA is more appropriate for this business.
BRIGHTPATH EARLY LEARNING INC. (TSX-V:BPE)
Source: Coverage List Companies, SEDAR
We recently picked up coverage on BPE (link). We will need to watch enrollments closely given the weighted exposure to Alberta. The catalysts for the stock include better than expected enrollments, further evidence they can monetize the real estate, as well as events that add further diversification such as acquisitions in Ontario.
SPEC BUY Black Diamond Group Ltd. (BDI:TSX)
Recent Share Price $4.98 2014 2015E 2016E 2017E12-Month Price Target $7.30 Sales ($MM) $386.6 $288.3 $245.6 $256.4Capital Return 46.6% Y/Y Growth 11.4% (25.4%) (14.8%) 4.4%
Total Return 58.6% EBITDA ($MM) $139.6 $98.5 $76.1 $80.0Market Cap ($MM) $204.7 Y/Y Growth (1.1%) (29.5%) (22.7%) 5.1%
S/O (mm) 41.1 EPS (dil.) $0.81 $0.34 ($0.08) ($0.08)Current EV ($MM) $390.4 Y/Y Growth (35.6%) (58.3%) nmf 0.1%Financial Year End Dec-31Dividend (Monthly) $0.05 P/Sales 0.5x 0.7x 0.8x 0.8xDividend Yield 12.0% EV/EBITDA 2.8x 4.0x 5.1x 4.9x2016E Payout Ratio 33.2% P/EBITDA 1.5x 2.1x 2.7x 2.6x
P/E 6.1x 14.7x nmf nmf
Net debt ($MM) $175.9 $178.0 $187.5 $193.6Net debt/EBITDA 1.3x 1.8x 2.5x 2.4xDebt/Equity 0.5x 0.5x 0.6x 1.0x
SPEC BUY BrightPath Early Learning Inc. (BPE:TSX-V)
Recent Share Price $0.27 2014 2015E 2016E 2017E12-Month Price Target $0.36 Total Revenue ($MM) $50.8 $54.6 $60.4 $68.1Capital Return 33.3% Y/Y Growth 8.5% 7.4% 10.7% 12.8%
Market Cap ($MM) $32.6 Adj. EBITDA ($MM) $6.0 $6.4 $7.1 $8.8S/O (mm) 120.6 Y/Y Growth 95.3% 6.7% 12.4% 23.7%
Current EV ($MM) $51.4 AFFO ($MM) $4.46 $4.71 $5.60 $7.40Financial Year End Dec-31 Y/Y Growth 120.2% 5.8% 18.8% 32.1%
P/Sales 0.6x 0.6x 0.5x 0.5xEV/Adj. EBITDA 8.6x 8.1x 7.2x 5.8xEV/AFFO 11.5x 10.9x 9.2x 7.0x
Net Debt ($MM) $22.1 $23.0 $22.5 $19.8Net Debt/Adj. EBITDA 3.7x 3.6x 3.1x 2.2xNet Debt/AFFO 5.0x 4.9x 4.0x 2.7x
January 15, 2016 ACUMEN CAPITAL | RESEARCH IDEAS. GROWTH. OPPORTUNITY.
Page 7 of 19
Small Cap Growth Update (2016 Outlook) Acumen Capital Finance Partners Limited #700, 404 – 6 Avenue SW | Calgary, AB | T2P 0R9| Main Phone: 403-571-0300
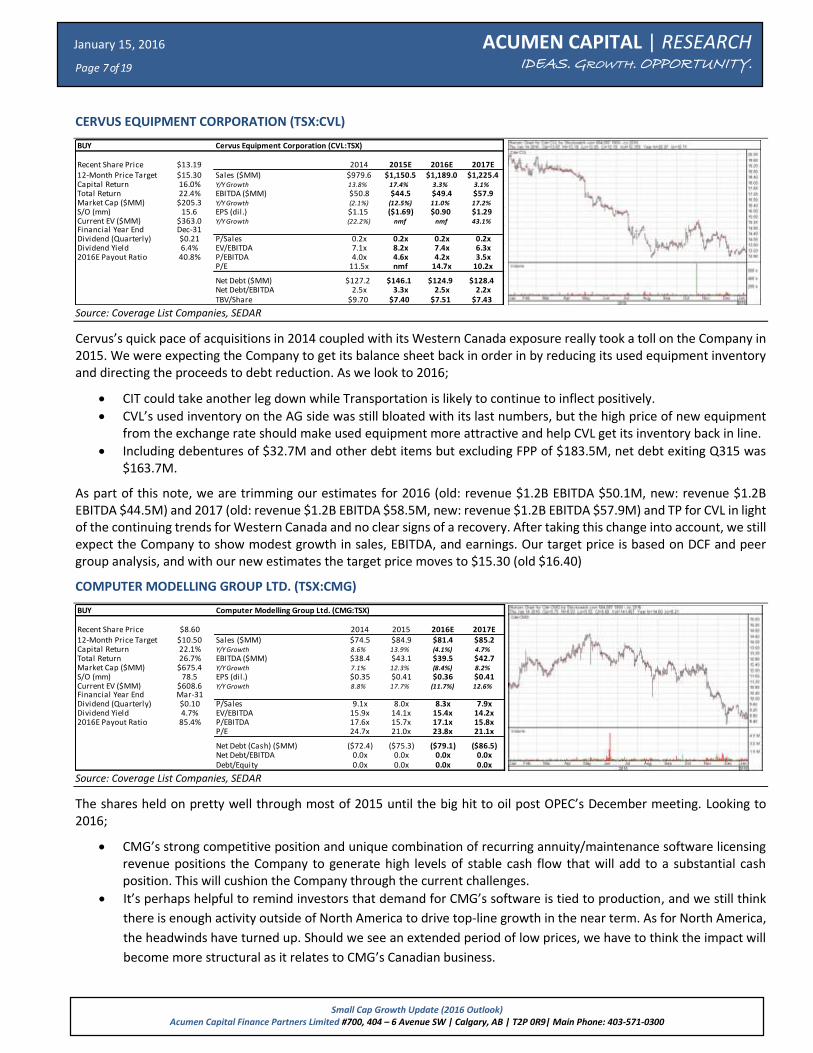
CERVUS EQUIPMENT CORPORATION (TSX:CVL)
Source: Coverage List Companies, SEDAR
Cervus’s quick pace of acquisitions in 2014 coupled with its Western Canada exposure really took a toll on the Company in 2015. We were expecting the Company to get its balance sheet back in order in by reducing its used equipment inventory and directing the proceeds to debt reduction. As we look to 2016;
CIT could take another leg down while Transportation is likely to continue to inflect positively.
CVL’s used inventory on the AG side was still bloated with its last numbers, but the high price of new equipment from the exchange rate should make used equipment more attractive and help CVL get its inventory back in line.
Including debentures of $32.7M and other debt items but excluding FPP of $183.5M, net debt exiting Q315 was $163.7M.
As part of this note, we are trimming our estimates for 2016 (old: revenue $1.2B EBITDA $50.1M, new: revenue $1.2B EBITDA $44.5M) and 2017 (old: revenue $1.2B EBITDA $58.5M, new: revenue $1.2B EBITDA $57.9M) and TP for CVL in light of the continuing trends for Western Canada and no clear signs of a recovery. After taking this change into account, we still expect the Company to show modest growth in sales, EBITDA, and earnings. Our target price is based on DCF and peer group analysis, and with our new estimates the target price moves to $15.30 (old $16.40)
COMPUTER MODELLING GROUP LTD. (TSX:CMG)
Source: Coverage List Companies, SEDAR
The shares held on pretty well through most of 2015 until the big hit to oil post OPEC’s December meeting. Looking to 2016;
CMG’s strong competitive position and unique combination of recurring annuity/maintenance software licensing revenue positions the Company to generate high levels of stable cash flow that will add to a substantial cash position. This will cushion the Company through the current challenges.
It’s perhaps helpful to remind investors that demand for CMG’s software is tied to production, and we still think
there is enough activity outside of North America to drive top-line growth in the near term. As for North America,
the headwinds have turned up. Should we see an extended period of low prices, we have to think the impact will
become more structural as it relates to CMG’s Canadian business.
BUY Cervus Equipment Corporation (CVL:TSX)
Recent Share Price $13.19 2014 2015E 2016E 2017E12-Month Price Target $15.30 Sales ($MM) $979.6 $1,150.5 $1,189.0 $1,225.4Capital Return 16.0% Y/Y Growth 13.8% 17.4% 3.3% 3.1%
Total Return 22.4% EBITDA ($MM) $50.8 $44.5 $49.4 $57.9Market Cap ($MM) $205.3 Y/Y Growth (2.1%) (12.5%) 11.0% 17.2%
S/O (mm) 15.6 EPS (dil.) $1.15 ($1.69) $0.90 $1.29Current EV ($MM) $363.0 Y/Y Growth (22.2%) nmf nmf 43.1%Financial Year End Dec-31Dividend (Quarterly) $0.21 P/Sales 0.2x 0.2x 0.2x 0.2xDividend Yield 6.4% EV/EBITDA 7.1x 8.2x 7.4x 6.3x2016E Payout Ratio 40.8% P/EBITDA 4.0x 4.6x 4.2x 3.5x
P/E 11.5x nmf 14.7x 10.2x
Net Debt ($MM) $127.2 $146.1 $124.9 $128.4Net Debt/EBITDA 2.5x 3.3x 2.5x 2.2xTBV/Share $9.70 $7.40 $7.51 $7.43
BUY Computer Modelling Group Ltd. (CMG:TSX)
Recent Share Price $8.60 2014 2015 2016E 2017E12-Month Price Target $10.50 Sales ($MM) $74.5 $84.9 $81.4 $85.2Capital Return 22.1% Y/Y Growth 8.6% 13.9% (4.1%) 4.7%
Total Return 26.7% EBITDA ($MM) $38.4 $43.1 $39.5 $42.7Market Cap ($MM) $675.4 Y/Y Growth 7.1% 12.3% (8.4%) 8.2%
S/O (mm) 78.5 EPS (dil.) $0.35 $0.41 $0.36 $0.41Current EV ($MM) $608.6 Y/Y Growth 8.8% 17.7% (11.7%) 12.6%Financial Year End Mar-31Dividend (Quarterly) $0.10 P/Sales 9.1x 8.0x 8.3x 7.9xDividend Yield 4.7% EV/EBITDA 15.9x 14.1x 15.4x 14.2x2016E Payout Ratio 85.4% P/EBITDA 17.6x 15.7x 17.1x 15.8x
P/E 24.7x 21.0x 23.8x 21.1x
Net Debt (Cash) ($MM) ($72.4) ($75.3) ($79.1) ($86.5)Net Debt/EBITDA 0.0x 0.0x 0.0x 0.0xDebt/Equity 0.0x 0.0x 0.0x 0.0x
January 15, 2016 ACUMEN CAPITAL | RESEARCH IDEAS. GROWTH. OPPORTUNITY.
Page 8 of 19
Small Cap Growth Update (2016 Outlook) Acumen Capital Finance Partners Limited #700, 404 – 6 Avenue SW | Calgary, AB | T2P 0R9| Main Phone: 403-571-0300
It is also worth noting that the Company generates ~74% of its revenue in USD which will help offset its weaker
Canadian business. We remain long-term bullish on CMG and at current levels, we believe CMG is attractive for
long-term investors, particularly with this recent pullback.
Given the current environment, we are adjusting our target price which is based on the simple average of historical 12-month forward P/E and DCF analysis. The change from our previous target is a result of a decrease of the forward PE multiple (old 33.5x/new 27.7x) and our DCF factors (old 17.5x/10%/new 17.5x/12%).
CRH MEDICAL CORPORATION (TSX:CRH)
Source: Coverage List Companies, SEDAR
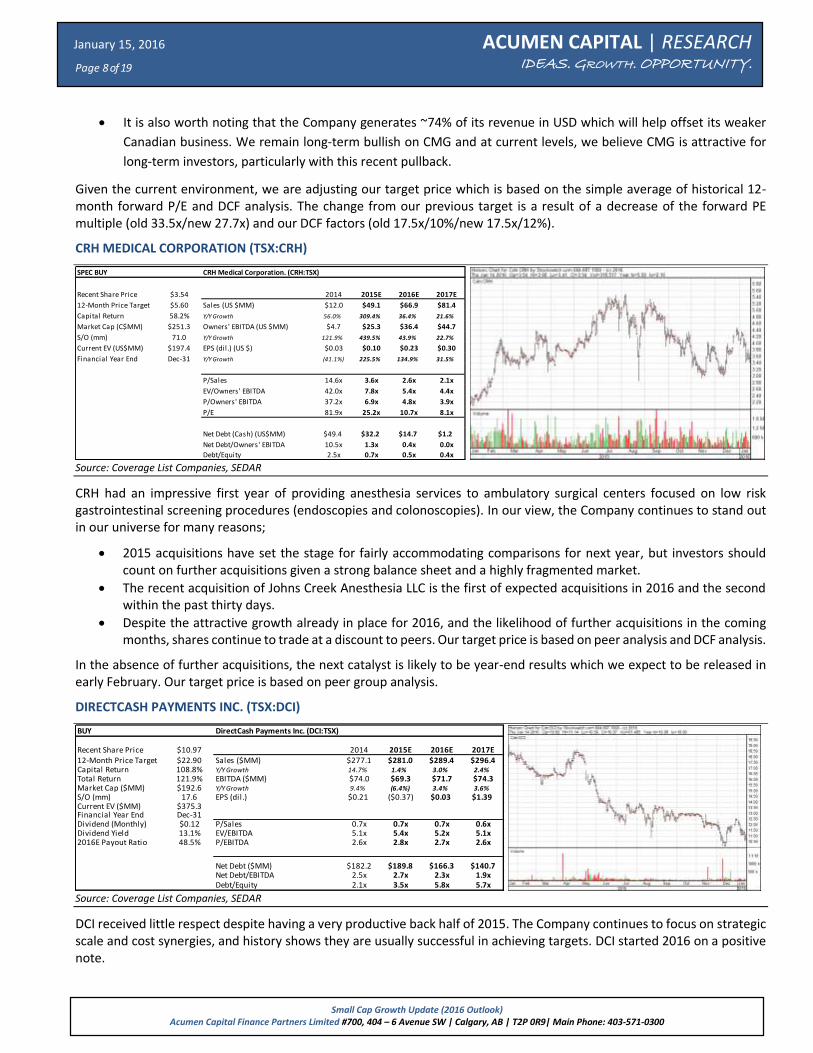
CRH had an impressive first year of providing anesthesia services to ambulatory surgical centers focused on low risk gastrointestinal screening procedures (endoscopies and colonoscopies). In our view, the Company continues to stand out in our universe for many reasons;
2015 acquisitions have set the stage for fairly accommodating comparisons for next year, but investors should count on further acquisitions given a strong balance sheet and a highly fragmented market.
The recent acquisition of Johns Creek Anesthesia LLC is the first of expected acquisitions in 2016 and the second within the past thirty days.
Despite the attractive growth already in place for 2016, and the likelihood of further acquisitions in the coming months, shares continue to trade at a discount to peers. Our target price is based on peer analysis and DCF analysis.
In the absence of further acquisitions, the next catalyst is likely to be year-end results which we expect to be released in early February. Our target price is based on peer group analysis.
DIRECTCASH PAYMENTS INC. (TSX:DCI)
Source: Coverage List Companies, SEDAR
DCI received little respect despite having a very productive back half of 2015. The Company continues to focus on strategic scale and cost synergies, and history shows they are usually successful in achieving targets. DCI started 2016 on a positive note.
SPEC BUY CRH Medical Corporation. (CRH:TSX)
Recent Share Price $3.54 2014 2015E 2016E 2017E
12-Month Price Target $5.60 Sales (US $MM) $12.0 $49.1 $66.9 $81.4
Capital Return 58.2% Y/Y Growth 56.0% 309.4% 36.4% 21.6%
Market Cap (C$MM) $251.3 Owners' EBITDA (US $MM) $4.7 $25.3 $36.4 $44.7
S/O (mm) 71.0 Y/Y Growth 121.9% 439.5% 43.9% 22.7%
Current EV (US$MM) $197.4 EPS (dil.) (US $) $0.03 $0.10 $0.23 $0.30
Financial Year End Dec-31 Y/Y Growth (41.1%) 225.5% 134.9% 31.5%
P/Sales 14.6x 3.6x 2.6x 2.1x
EV/Owners' EBITDA 42.0x 7.8x 5.4x 4.4x
P/Owners' EBITDA 37.2x 6.9x 4.8x 3.9x
P/E 81.9x 25.2x 10.7x 8.1x
Net Debt (Cash) (US$MM) $49.4 $32.2 $14.7 $1.2
Net Debt/Owners' EBITDA 10.5x 1.3x 0.4x 0.0x
Debt/Equity 2.5x 0.7x 0.5x 0.4x
BUY DirectCash Payments Inc. (DCI:TSX)
Recent Share Price $10.97 2014 2015E 2016E 2017E12-Month Price Target $22.90 Sales ($MM) $277.1 $281.0 $289.4 $296.4Capital Return 108.8% Y/Y Growth 14.7% 1.4% 3.0% 2.4%
Total Return 121.9% EBITDA ($MM) $74.0 $69.3 $71.7 $74.3Market Cap ($MM) $192.6 Y/Y Growth 9.4% (6.4%) 3.4% 3.6%
S/O (mm) 17.6 EPS (dil.) $0.21 ($0.37) $0.03 $1.39Current EV ($MM) $375.3 Y/Y Growth -276.0% -107.1% 5170.6%Financial Year End Dec-31Dividend (Monthly) $0.12 P/Sales 0.7x 0.7x 0.7x 0.6xDividend Yield 13.1% EV/EBITDA 5.1x 5.4x 5.2x 5.1x2016E Payout Ratio 48.5% P/EBITDA 2.6x 2.8x 2.7x 2.6x
Net Debt ($MM) $182.2 $189.8 $166.3 $140.7Net Debt/EBITDA 2.5x 2.7x 2.3x 1.9xDebt/Equity 2.1x 3.5x 5.8x 5.7x

January 15, 2016 ACUMEN CAPITAL | RESEARCH IDEAS. GROWTH. OPPORTUNITY.
Page 9 of 19
Small Cap Growth Update (2016 Outlook) Acumen Capital Finance Partners Limited #700, 404 – 6 Avenue SW | Calgary, AB | T2P 0R9| Main Phone: 403-571-0300
Recently, the Company announced the closing and settlement of all class action law suits. Initially, DCI had paid $2.0M when it executed the settlement agreement, and the announcement confirmed that DCI released the $7.0M previously held for CSF and an additional $3.0M of its own funds, with a remaining $2.5M to be paid in Q216.
With the release of all claims, this clears the way for DCI to acquire DC Bank. Recall that the agreed purchase price was $15.0M to be paid through the issuance of 1,154,734 common shares from treasury at a price of $12.99, and the original agreement was extended to August 2016. We see this as a positive that should take some further negativity away from the stock.
Uncertainty around the Company’s long-term growth model will continue to be a headwind. As a result of strong FCF, DCI appears to offer significant upside potential if the Company can successfully drive growth in its Australia business and continue demonstrating the strength in its Other Service business. Our target price is based on F16e EV/EBITDA (discounted by 20% to 8.4x) and DCF analysis (13.3% WACC, 7.5x exit multiple).
GAMEHOST INC. (TSX:GH)
Source: Coverage List Companies, SEDAR
The Company has been given the ABA label (Anything but Alberta) by a lot of investors. GH now trades at 6.9x EV/NTM EBITDA, below its ten year historical average.
With expectations of a weak market for oil, the Company is managing the challenges effectively. Softening of sales will be met with an entrenched cost focus in 2016 to meet its payout obligations. In terms of our target price, we are using DCF analysis (9.0x exit multiple and 12.5% WACC). We are adjusting our TP to $10.50 (old $11.30) as a result of increasing the small cap discount in our WACC calculation. Figure 5 shows how the Company’s share valuation has tracked since 2006, suggesting there is the potential for further downside price risk should we see an extended weakness of the Alberta economy.
FIGURE 5 | SPECIAL SITUATIONS COVERAGE LIST | GH HISTORICAL EV/NTM EBITDA
Source: Bloomberg, Acumen Capital Partners, Figures subject to rounding
SPEC BUY Gamehost Inc. (TSX:GH)
Recent Share Price $8.12 2014 2015E 2016E 2017E12-Month Price Target $10.50 Sales ($MM) $83.7 $78.4 $75.6 $77.5Capital Return 29.3% Y/Y Growth 7.9% (6.4%) (3.5%) 2.5%
Total Return 40.1% EBITDA ($MM) $36.7 $32.9 $31.6 $33.4Market Cap ($MM) $200.8 Y/Y Growth 7.6% (10.3%) (4.0%) 5.8%
S/O (mm) 24.7 EPS $0.95 $0.85 $0.78 $0.84Current EV ($MM) $213.3 Y/Y Growth 9.1% (10.7%) (8.1%) 7.3%
Financial Year End Dec-31Dividend (Monthly) $0.0733 P/Sales 2.4x 2.6x 2.7x 2.6xDividend Yield 10.8% EV/EBITDA 5.8x 6.5x 6.8x 6.4x2016E Payout Ratio 99.1% P/EBITDA 5.5x 6.1x 6.4x 6.0x
P/E 8.5x 9.6x 10.4x 9.7x
Net Debt ($MM) $20.4 $12.0 $11.1 $8.6Net Debt/EBITDA 0.6x 0.4x 0.4x 0.3xDebt/Equity 0.3x 0.2x 0.2x 0.2x
January 15, 2016 ACUMEN CAPITAL | RESEARCH IDEAS. GROWTH. OPPORTUNITY.
Page 10 of 19
Small Cap Growth Update (2016 Outlook) Acumen Capital Finance Partners Limited #700, 404 – 6 Avenue SW | Calgary, AB | T2P 0R9| Main Phone: 403-571-0300
GLOBAL WATER RESOURCES CORP. (TSX:GWR)
Source: Coverage List Companies, SEDAR
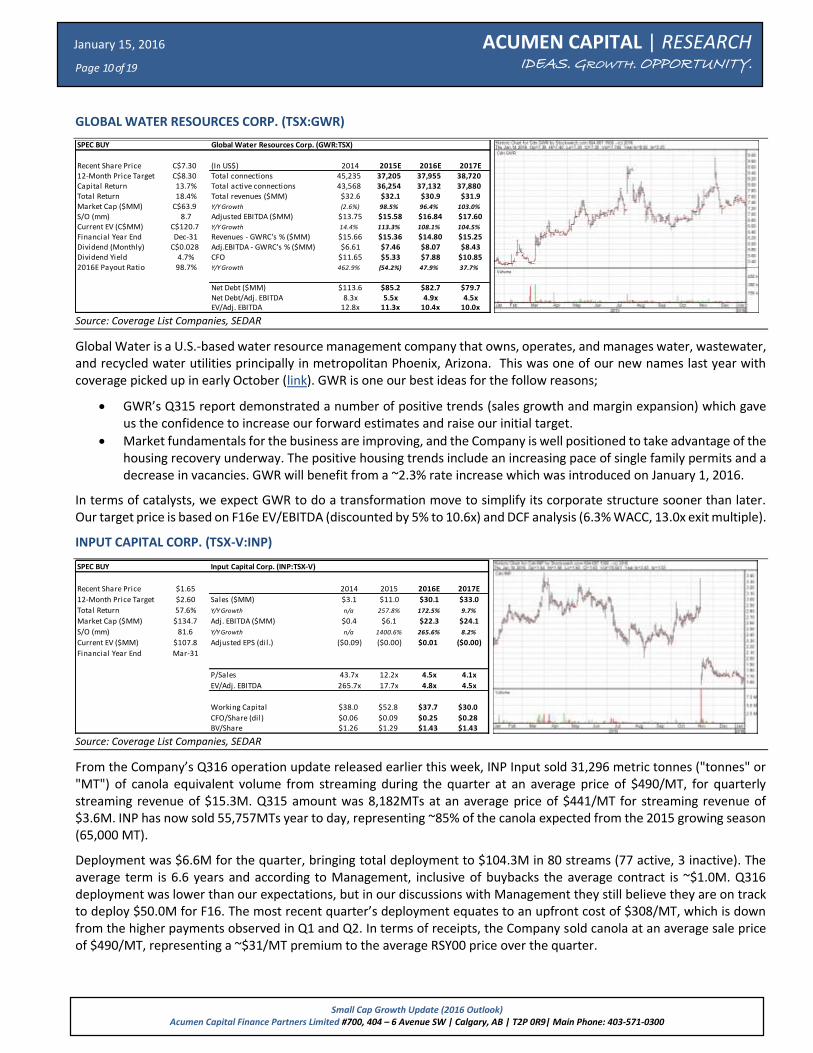
Global Water is a U.S.-based water resource management company that owns, operates, and manages water, wastewater, and recycled water utilities principally in metropolitan Phoenix, Arizona. This was one of our new names last year with coverage picked up in early October (link). GWR is one our best ideas for the follow reasons;
GWR’s Q315 report demonstrated a number of positive trends (sales growth and margin expansion) which gave us the confidence to increase our forward estimates and raise our initial target.
Market fundamentals for the business are improving, and the Company is well positioned to take advantage of the housing recovery underway. The positive housing trends include an increasing pace of single family permits and a decrease in vacancies. GWR will benefit from a ~2.3% rate increase which was introduced on January 1, 2016.
In terms of catalysts, we expect GWR to do a transformation move to simplify its corporate structure sooner than later. Our target price is based on F16e EV/EBITDA (discounted by 5% to 10.6x) and DCF analysis (6.3% WACC, 13.0x exit multiple).
INPUT CAPITAL CORP. (TSX-V:INP)
Source: Coverage List Companies, SEDAR
From the Company’s Q316 operation update released earlier this week, INP Input sold 31,296 metric tonnes ("tonnes" or "MT") of canola equivalent volume from streaming during the quarter at an average price of $490/MT, for quarterly streaming revenue of $15.3M. Q315 amount was 8,182MTs at an average price of $441/MT for streaming revenue of $3.6M. INP has now sold 55,757MTs year to day, representing ~85% of the canola expected from the 2015 growing season (65,000 MT).
Deployment was $6.6M for the quarter, bringing total deployment to $104.3M in 80 streams (77 active, 3 inactive). The average term is 6.6 years and according to Management, inclusive of buybacks the average contract is ~$1.0M. Q316 deployment was lower than our expectations, but in our discussions with Management they still believe they are on track to deploy $50.0M for F16. The most recent quarter’s deployment equates to an upfront cost of $308/MT, which is down from the higher payments observed in Q1 and Q2. In terms of receipts, the Company sold canola at an average sale price of $490/MT, representing a ~$31/MT premium to the average RSY00 price over the quarter.
SPEC BUY Global Water Resources Corp. (GWR:TSX)
Recent Share Price C$7.30 (In US$) 2014 2015E 2016E 2017E12-Month Price Target C$8.30 Total connections 45,235 37,205 37,955 38,720Capital Return 13.7% Total active connections 43,568 36,254 37,132 37,880Total Return 18.4% Total revenues ($MM) $32.6 $32.1 $30.9 $31.9Market Cap ($MM) C$63.9 Y/Y Growth (2.6%) 98.5% 96.4% 103.0%
S/O (mm) 8.7 Adjusted EBITDA ($MM) $13.75 $15.58 $16.84 $17.60Current EV (C$MM) C$120.7 Y/Y Growth 14.4% 113.3% 108.1% 104.5%
Financial Year End Dec-31 Revenues - GWRC's % ($MM) $15.66 $15.36 $14.80 $15.25Dividend (Monthly) C$0.028 Adj.EBITDA - GWRC's % ($MM) $6.61 $7.46 $8.07 $8.43Dividend Yield 4.7% CFO $11.65 $5.33 $7.88 $10.852016E Payout Ratio 98.7% Y/Y Growth 462.9% (54.2%) 47.9% 37.7%
Net Debt ($MM) $113.6 $85.2 $82.7 $79.7Net Debt/Adj. EBITDA 8.3x 5.5x 4.9x 4.5xEV/Adj. EBITDA 12.8x 11.3x 10.4x 10.0x
SPEC BUY Input Capital Corp. (INP:TSX-V)
Recent Share Price $1.65 2014 2015 2016E 2017E
12-Month Price Target $2.60 Sales ($MM) $3.1 $11.0 $30.1 $33.0
Total Return 57.6% Y/Y Growth n/a 257.8% 172.5% 9.7%
Market Cap ($MM) $134.7 Adj. EBITDA ($MM) $0.4 $6.1 $22.3 $24.1
S/O (mm) 81.6 Y/Y Growth n/a 1400.6% 265.6% 8.2%
Current EV ($MM) $107.8 Adjusted EPS (dil.) ($0.09) ($0.00) $0.01 ($0.00)
Financial Year End Mar-31 Y/Y Growth n/a n/a 3550.8% -116.5%
P/Sales 43.7x 12.2x 4.5x 4.1x
EV/Adj. EBITDA 265.7x 17.7x 4.8x 4.5x
Working Capital $38.0 $52.8 $37.7 $30.0
CFO/Share (dil) $0.06 $0.09 $0.25 $0.28BV/Share $1.26 $1.29 $1.43 $1.43
January 15, 2016 ACUMEN CAPITAL | RESEARCH IDEAS. GROWTH. OPPORTUNITY.
Page 11 of 19
Small Cap Growth Update (2016 Outlook) Acumen Capital Finance Partners Limited #700, 404 – 6 Avenue SW | Calgary, AB | T2P 0R9| Main Phone: 403-571-0300
With 15% of the 65,000MT total calendar 2015 crops remaining to be delivered, we assume delivery of the remaining ~9,300MTs will mainly be in Q416. Going forward, ~46,500MTs will be delivered on a yearly basis from the 77 current active contracts. Our current pricing assumptions reflect a canola prices of $480/MT for F17 and $460/MT thereafter, $62/MT cost per tonne upon delivery, and $247/MT of upfront cost based on INP’s mix of extensions and new contracts. In terms of deployment, we expect ~$25.0M of deployment in Q416 and $50.0M again for 2017, which assumes INP has access to a revolving credit to offset the $18.4M of inactive canola reserves.
Our target price of $2.60 is based on F17e EV/EBITDA (discounted by 40% to 8.7x) and DCF analysis (13.0% WACC, 10,0x exit multiple).
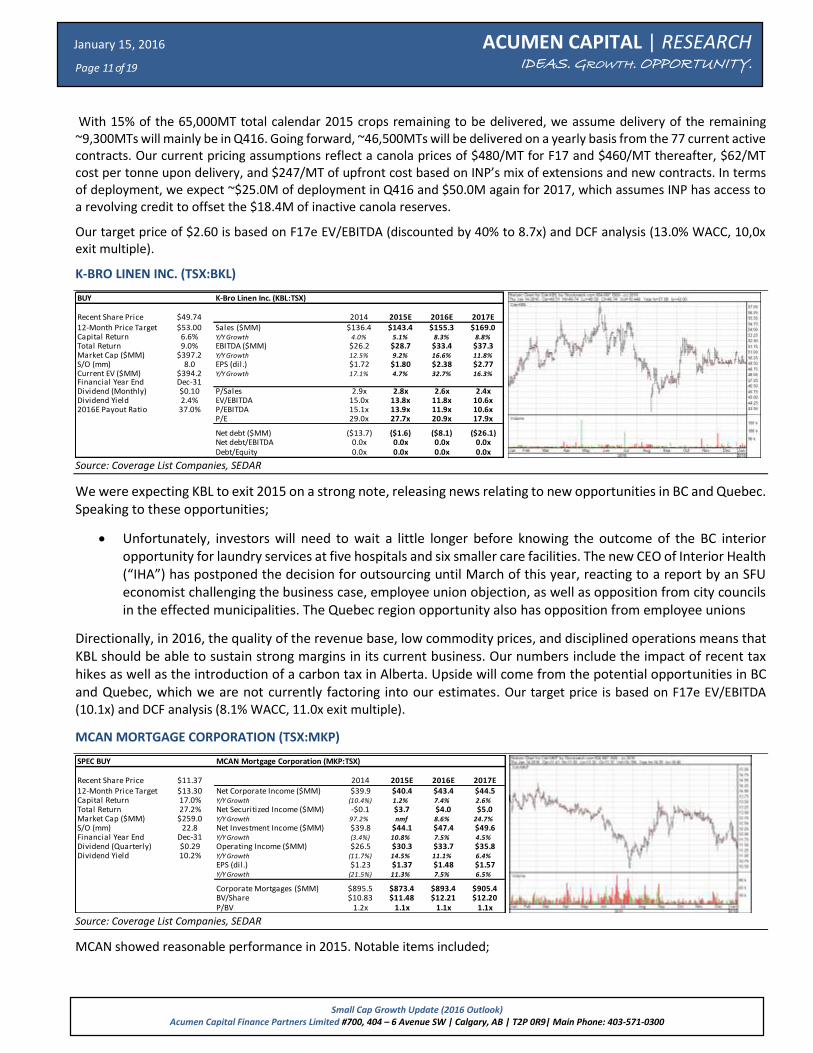
K-BRO LINEN INC. (TSX:BKL)
Source: Coverage List Companies, SEDAR
We were expecting KBL to exit 2015 on a strong note, releasing news relating to new opportunities in BC and Quebec. Speaking to these opportunities;
Unfortunately, investors will need to wait a little longer before knowing the outcome of the BC interior opportunity for laundry services at five hospitals and six smaller care facilities. The new CEO of Interior Health (“IHA”) has postponed the decision for outsourcing until March of this year, reacting to a report by an SFU economist challenging the business case, employee union objection, as well as opposition from city councils in the effected municipalities. The Quebec region opportunity also has opposition from employee unions
Directionally, in 2016, the quality of the revenue base, low commodity prices, and disciplined operations means that KBL should be able to sustain strong margins in its current business. Our numbers include the impact of recent tax hikes as well as the introduction of a carbon tax in Alberta. Upside will come from the potential opportunities in BC and Quebec, which we are not currently factoring into our estimates. Our target price is based on F17e EV/EBITDA (10.1x) and DCF analysis (8.1% WACC, 11.0x exit multiple).
MCAN MORTGAGE CORPORATION (TSX:MKP)
Source: Coverage List Companies, SEDAR
MCAN showed reasonable performance in 2015. Notable items included;
BUY K-Bro Linen Inc. (KBL:TSX)
Recent Share Price $49.74 2014 2015E 2016E 2017E12-Month Price Target $53.00 Sales ($MM) $136.4 $143.4 $155.3 $169.0Capital Return 6.6% Y/Y Growth 4.0% 5.1% 8.3% 8.8%
Total Return 9.0% EBITDA ($MM) $26.2 $28.7 $33.4 $37.3Market Cap ($MM) $397.2 Y/Y Growth 12.5% 9.2% 16.6% 11.8%
S/O (mm) 8.0 EPS (dil.) $1.72 $1.80 $2.38 $2.77Current EV ($MM) $394.2 Y/Y Growth 17.1% 4.7% 32.7% 16.3%Financial Year End Dec-31Dividend (Monthly) $0.10 P/Sales 2.9x 2.8x 2.6x 2.4xDividend Yield 2.4% EV/EBITDA 15.0x 13.8x 11.8x 10.6x2016E Payout Ratio 37.0% P/EBITDA 15.1x 13.9x 11.9x 10.6x
P/E 29.0x 27.7x 20.9x 17.9x
Net debt ($MM) ($13.7) ($1.6) ($8.1) ($26.1)Net debt/EBITDA 0.0x 0.0x 0.0x 0.0xDebt/Equity 0.0x 0.0x 0.0x 0.0x
SPEC BUY MCAN Mortgage Corporation (MKP:TSX)
Recent Share Price $11.37 2014 2015E 2016E 2017E12-Month Price Target $13.30 Net Corporate Income ($MM) $39.9 $40.4 $43.4 $44.5Capital Return 17.0% Y/Y Growth (10.4%) 1.2% 7.4% 2.6%
Total Return 27.2% Net Securitized Income ($MM) -$0.1 $3.7 $4.0 $5.0Market Cap ($MM) $259.0 Y/Y Growth 97.2% nmf 8.6% 24.7%
S/O (mm) 22.8 Net Investment Income ($MM) $39.8 $44.1 $47.4 $49.6Financial Year End Dec-31 Y/Y Growth (3.4%) 10.8% 7.5% 4.5%
Dividend (Quarterly) $0.29 Operating Income ($MM) $26.5 $30.3 $33.7 $35.8Dividend Yield 10.2% Y/Y Growth (11.7%) 14.5% 11.1% 6.4%
EPS (dil.) $1.23 $1.37 $1.48 $1.57Y/Y Growth (21.5%) 11.3% 7.5% 6.5%
Corporate Mortgages ($MM) $895.5 $873.4 $893.4 $905.4BV/Share $10.83 $11.48 $12.21 $12.20P/BV 1.2x 1.1x 1.1x 1.1x

January 15, 2016 ACUMEN CAPITAL | RESEARCH IDEAS. GROWTH. OPPORTUNITY.
Page 12 of 19
Small Cap Growth Update (2016 Outlook) Acumen Capital Finance Partners Limited #700, 404 – 6 Avenue SW | Calgary, AB | T2P 0R9| Main Phone: 403-571-0300
The Xceed single family residential mortgage products continue to contribute to the Company’s uninsured single family mortgage portfolio in corporate assets and insured market MBS mortgages in securitization assets.
MCAN continues to reap rewards from its equity interest in MCAP LP, reporting higher equity income.
MCAN reduced its exposure to Alberta construction and commercial (“C&C”) (down 6.3% to 23.8% of C&C lending in Q315) and migrated into other more stable markets (BC primarily). Credit quality proved to be strong.
The BOD approved a quarterly dividend bump from $0.28 to $0.29, reflecting its confidence in business.
We think MCAN will continue to post reasonable performance in 2016. Catalysts for the business include above average origination growth for both insured and unsecured mortgages in its corporate book, as well as a step up in securitization volumes during periods of seasonal strength.
MEDIAGRIF INTERACTIVE TECHNOLOGIES INC. (TSX:MDF)
Source: Coverage List Companies, SEDAR
MDF has limited growth opportunities with its current suite of B2B sites and remains focused on addressing their priorities for cash deployment. Excess cash-flow continues to be directed towards reducing debt and share buybacks, setting the Company up for the day when it can execute an acquisition. Operating expenses should remain fairly tight going forward as Management continues to exercise control over the margin.
We believe the near term slope of growth likely means the upside potential in the shares will be more difficult to achieve without some catalysts. Transformative M&A will be key to rekindle interest in the shares. At current prices, the shares trade at 9.0x EV/F16e EBITDA. Our target price is based on DCF analysis (12.0x exit multiple and 7.4% WACC) and F17e EV/EBITDA multiple of 12.1x.
NORTHERN FRONTIER CORP. (TSX-V:FFF)
Source: Coverage List Companies, SEDAR
While recent results were encouraging, the announced relieve of bank covenants and the general outlook for the oil and gas industry makes it difficult to be constructive on the name.
BUY Mediagrif Interactive Technologies Inc. (MDF:TSX)
Recent Share Price $16.00 2014 2015 2016E 2017E12-Month Price Target $23.00 Sales ($MM) $65.4 $70.2 $72.7 $76.6Capital Return 43.8% Y/Y Growth 7.7% 7.5% 3.4% 5.4%
Total Return 46.3% EBITDA ($MM) $24.3 $27.5 $28.9 $29.7Market Cap ($MM) $240.3 Y/Y Growth (3.3%) 13.1% 5.2% 2.7%
S/O (mm) 15.0 EPS (dil.) $0.80 $1.00 $1.14 $1.17Current EV ($MM) $261.9 Y/Y Growth (17.0%) 23.9% 15.0% 1.8%Financial Year End Mar-31Dividend (Quarterly) $0.10 P/Sales 3.7x 3.4x 3.3x 3.1xDividend Yield 2.5% EV/EBITDA 10.8x 9.5x 9.0x 8.8x2016E Payout Ratio 28.0% P/EBITDA 9.9x 8.7x 8.3x 8.1x
P/E 19.9x 16.1x 14.0x 13.7x
Net Debt (Cash) ($MM) $29.1 $17.9 $13.6 ($0.9)Net Debt/EBITDA 1.2x 0.7x 0.5x 0.0xDebt/Equity 0.3x 0.2x 0.2x 0.1x
HOLD Northern Frontier Corp. (FFF:TSX-V)
Current Share Price $0.34 2014 2015E 2016E 2017E
12-Month Price Target $0.42 Sales ($MM) $63.3 $50.8 $65.4 $73.7
Total Return 24.6% Y/Y Growth 321.7% (19.7%) 28.6% 12.7%
Market Cap ($MM) $9.4 EBITDA ($MM) $11.4 $5.7 $9.0 $11.3
S/O (mm) 27.8 Y/Y Growth 512.4% (49.9%) 56.7% 26.3%
Current EV ($MM) $56.1 EPS (dil.) ($1.78) ($0.16) ($0.08) ($0.02)
Financial Year End Dec-31 Y/Y Growth 141.0% (91.1%) 46.9% 78.6%
Dividend (Quarterly) Suspended
P/Sales 0.1x 0.2x 0.1x 0.1x
EV/EBITDA 4.9x 9.8x 6.2x 4.9x
P/EBITDA 0.8x 1.6x 1.1x 0.8x
P/E nmf nmf nmf nmf
Net Debt ($MM) $41.2 $44.6 $42.7 $35.1
Net Debt/EBITDA 3.6x 7.8x 4.8x 3.1x
Debt/Equity 1.6x 1.8x 1.7x 1.5x
January 15, 2016 ACUMEN CAPITAL | RESEARCH IDEAS. GROWTH. OPPORTUNITY.
Page 13 of 19
Small Cap Growth Update (2016 Outlook) Acumen Capital Finance Partners Limited #700, 404 – 6 Avenue SW | Calgary, AB | T2P 0R9| Main Phone: 403-571-0300
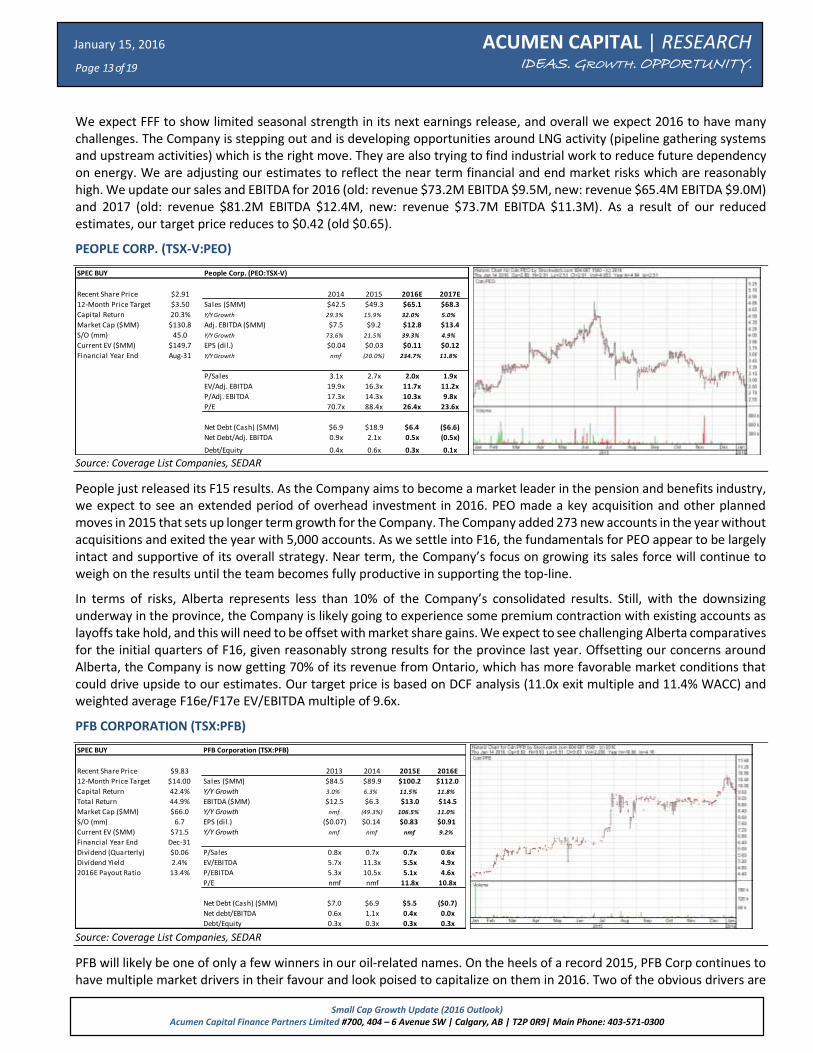
We expect FFF to show limited seasonal strength in its next earnings release, and overall we expect 2016 to have many challenges. The Company is stepping out and is developing opportunities around LNG activity (pipeline gathering systems and upstream activities) which is the right move. They are also trying to find industrial work to reduce future dependency on energy. We are adjusting our estimates to reflect the near term financial and end market risks which are reasonably high. We update our sales and EBITDA for 2016 (old: revenue $73.2M EBITDA $9.5M, new: revenue $65.4M EBITDA $9.0M) and 2017 (old: revenue $81.2M EBITDA $12.4M, new: revenue $73.7M EBITDA $11.3M). As a result of our reduced estimates, our target price reduces to $0.42 (old $0.65).
PEOPLE CORP. (TSX-V:PEO)
Source: Coverage List Companies, SEDAR
People just released its F15 results. As the Company aims to become a market leader in the pension and benefits industry, we expect to see an extended period of overhead investment in 2016. PEO made a key acquisition and other planned moves in 2015 that sets up longer term growth for the Company. The Company added 273 new accounts in the year without acquisitions and exited the year with 5,000 accounts. As we settle into F16, the fundamentals for PEO appear to be largely intact and supportive of its overall strategy. Near term, the Company’s focus on growing its sales force will continue to weigh on the results until the team becomes fully productive in supporting the top-line.
In terms of risks, Alberta represents less than 10% of the Company’s consolidated results. Still, with the downsizing underway in the province, the Company is likely going to experience some premium contraction with existing accounts as layoffs take hold, and this will need to be offset with market share gains. We expect to see challenging Alberta comparatives for the initial quarters of F16, given reasonably strong results for the province last year. Offsetting our concerns around Alberta, the Company is now getting 70% of its revenue from Ontario, which has more favorable market conditions that could drive upside to our estimates. Our target price is based on DCF analysis (11.0x exit multiple and 11.4% WACC) and weighted average F16e/F17e EV/EBITDA multiple of 9.6x.
PFB CORPORATION (TSX:PFB)
Source: Coverage List Companies, SEDAR
PFB will likely be one of only a few winners in our oil-related names. On the heels of a record 2015, PFB Corp continues to have multiple market drivers in their favour and look poised to capitalize on them in 2016. Two of the obvious drivers are
SPEC BUY People Corp. (PEO:TSX-V)
Recent Share Price $2.91 2014 2015 2016E 2017E
12-Month Price Target $3.50 Sales ($MM) $42.5 $49.3 $65.1 $68.3
Capital Return 20.3% Y/Y Growth 29.3% 15.9% 32.0% 5.0%
Market Cap ($MM) $130.8 Adj. EBITDA ($MM) $7.5 $9.2 $12.8 $13.4
S/O (mm) 45.0 Y/Y Growth 73.6% 21.5% 39.3% 4.9%
Current EV ($MM) $149.7 EPS (dil.) $0.04 $0.03 $0.11 $0.12
Financial Year End Aug-31 Y/Y Growth nmf (20.0%) 234.7% 11.8%
P/Sales 3.1x 2.7x 2.0x 1.9x
EV/Adj. EBITDA 19.9x 16.3x 11.7x 11.2x
P/Adj. EBITDA 17.3x 14.3x 10.3x 9.8x
P/E 70.7x 88.4x 26.4x 23.6x
Net Debt (Cash) ($MM) $6.9 $18.9 $6.4 ($6.6)
Net Debt/Adj. EBITDA 0.9x 2.1x 0.5x (0.5x)
Debt/Equity 0.4x 0.6x 0.3x 0.1x
SPEC BUY PFB Corporation (TSX:PFB)
Recent Share Price $9.83 2013 2014 2015E 2016E
12-Month Price Target $14.00 Sales ($MM) $84.5 $89.9 $100.2 $112.0
Capital Return 42.4% Y/Y Growth 3.0% 6.3% 11.5% 11.8%
Total Return 44.9% EBITDA ($MM) $12.5 $6.3 $13.0 $14.5
Market Cap ($MM) $66.0 Y/Y Growth nmf (49.3%) 106.5% 11.0%
S/O (mm) 6.7 EPS (dil.) ($0.07) $0.14 $0.83 $0.91
Current EV ($MM) $71.5 Y/Y Growth nmf nmf nmf 9.2%
Financial Year End Dec-31
Dividend (Quarterly) $0.06 P/Sales 0.8x 0.7x 0.7x 0.6x
Dividend Yield 2.4% EV/EBITDA 5.7x 11.3x 5.5x 4.9x
2016E Payout Ratio 13.4% P/EBITDA 5.3x 10.5x 5.1x 4.6x
P/E nmf nmf 11.8x 10.8x
Net Debt (Cash) ($MM) $7.0 $6.9 $5.5 ($0.7)
Net debt/EBITDA 0.6x 1.1x 0.4x 0.0x
Debt/Equity 0.3x 0.3x 0.3x 0.3x

January 15, 2016 ACUMEN CAPITAL | RESEARCH IDEAS. GROWTH. OPPORTUNITY.
Page 14 of 19
Small Cap Growth Update (2016 Outlook) Acumen Capital Finance Partners Limited #700, 404 – 6 Avenue SW | Calgary, AB | T2P 0R9| Main Phone: 403-571-0300
continued low commodity prices and favourable f/x rates. Low commodity prices have led to lower input costs and expanding margins, while the CAD/USD foreign exchange rates in the 0.75 range have boosted realized earnings as ~25% of PFB’s revenues come from the U.S.. While we don’t expect these factors to continue over the long-term, we agree with the “lower for longer” mentality with commodity prices, which should continue to benefit PFB for the foreseeable future.
In addition to this, PFB has multiple catalysts working in their favour: stricter Canadian building codes in effect, the Liberal governments proposed infrastructure spending plans, strong US construction fundamentals, and the recently closed acquisition of Poly Foam in Minnesota (at an attractive EBITDA multiple) will continue the company’s plans for further U.S. expansion.
We base our target price on DCF analysis (6.4x exit multiple and 13.2% WACC) and F16e EV/EBITDA multiple of 6.3x.
PARK LAWN CORPORATION (TSX-V:PLC)
Source: Coverage List Companies, SEDAR
PLC had a lot of activity exiting 2015, including two acquisitions and a financing. At a high level;
Ontario-based Basic Funerals (“BF”) was acquired for $0.7M in cash. The acquisition adds ~1,200 funerals per year, primarily in the Greater Toronto Area. BF is also expected to add ~700 cremations per year in Toronto and Ottawa.
PLC completed a subscription receipt offering with net proceeds of ~$22.9M with the proceeds primarily targeted to help finance the proposed acquisition of Michigan-based Midwest Memorial Group LLC (“MMG”). PLC is buying the membership interests of MMG for ~US$16M (subject to working capital and other adjustments), plus a potential earn-out. The acquisition is PLC’s first step into the U.S. market and adds 26 cemeteries (plus two others under management), nine of which include crematoria, in the Michigan area. We expect the transaction to close later this month. Upon satisfaction of the escrow release conditions holders of the subscription receipts will receive the equivalent amount of common shares.
PLC shares seem well positioned to outperform in 2016 from growth of its Canadian business and accretion from the MMG acquisition, which will likely be the next catalyst for the shares. Investors will be exposed to some risk around the success of integrating the recent acquisitions. We consider F17e as the Company’s first normalized year and therefore use F17e as the starting point for our DCF and peer multiple valuation exercise. Our target price of $14.40 is based on F17e EV/EBITDA multiple (9.1x) and DCF analysis (7.6% WACC and 11.0x exit multiple).
SPEC BUY Park Lawn Corporation
Recent Share Price $11.73 2014 2015E 2016E 2017E
12-Month Price Target $14.40 Total Revenue ($MM) $23.7 $28.5 $71.5 $79.3
Capital Return 22.8% Y/Y Growth 37.0% 20.2% 150.8% 11.0%
Total Return 24.1% Adjusted EBITDA ($MM) $5.7 $7.7 $13.2 $15.0
Market Cap ($MM) $68.6 Y/Y Growth 11.6% 36.6% 70.8% 13.4%
S/O (mm) 5.8 EPS (dil.) to Equity $0.35 $0.53 $0.67 $0.77
Current EV ($MM) $82.3 Y/Y Growth (23.1%) 50.7% 26.9% 14.7%
Financial Year End Dec-31
Dividend (Monthly) $0.04 P/Sales 2.9x 2.4x 1.0x 0.9x
Dividend Yield 1.3% EV/Adj. EBITDA 14.5x 10.6x 9.3x 8.0x
2016E Payout Ratio 35.9% P/EBITDA 12.1x 8.8x 7.0x 6.2x
P/E 33.3x 22.1x 17.4x 15.2x
Net Bank Debt ($MM) $9.9 $15.7 $21.1 $24.4
Net Bank Debt/Adj. EBITDA 1.7x 2.0x 1.6x 1.6x
Debt/Equity 0.0x 0.0x 0.0x 0.0x

January 15, 2016 ACUMEN CAPITAL | RESEARCH IDEAS. GROWTH. OPPORTUNITY.
Page 15 of 19
Small Cap Growth Update (2016 Outlook) Acumen Capital Finance Partners Limited #700, 404 – 6 Avenue SW | Calgary, AB | T2P 0R9| Main Phone: 403-571-0300
STELLA JONES INC. (TSX:SJ)
Source: Coverage List Companies, SEDAR
SJ was the big winner in our universe in 2015 (stock up 60.4%) benefiting from increased pricing, volume gains, and acquisitions. GM% was up strongly in Q315, driven by added efficiencies in the Company’s network with the scale in the business. The outlook remains strong with the momentum we saw pick up mid last year continue in 2016.
With the additional erosion of the CDN/USD exchange rate we are revising our 2016 sales and EBITDA up a touch. Catalysts for the shares include above average tie demand, more solid evidence for the pole replacement cycle, and quick integration of the Ram acquisition which was completed in October. Ram will accelerate SJ’s market position in the residential lumber category. Our target price is calculated using an average of a historical P/E multiple and DCF (WACC 6.3%). With the adjustment of estimates, we see our target price increase to $52.50. The stock is trading at a F16e P/E of 19.5x. SJ merits a premium multiple based on its marketing positioning, acquisition strategy, and strong business execution.
BUY Stella-Jones Inc. (SJ:TSX)
Recent Share Price $48.00 2014 2015E 2016E 2017E12-Month Price Target $52.50 Sales ($MM) $1,249.5 $1,543.3 $1,770.2 $1,902.9Capital Return 9.4% Y/Y Growth 23.6% 23.5% 14.7% 7.5%
Total Return 10.0% EBITDA ($MM) $176.3 $247.1 $285.6 $307.1Market Cap ($MM) $3,317.9 Y/Y Growth 13.7% 40.2% 15.6% 7.5%
S/O (mm) 69.1 EPS (dil.) $1.50 $2.04 $2.46 $2.67Current EV ($MM) $3,916.0 Y/Y Growth 12.1% 35.9% 20.4% 8.8%
Financial Year End Dec-31Dividend (Quarterly) $0.08 P/Sales 2.7x 2.1x 1.9x 1.7xDividend Yield 0.7% EV/EBITDA 22.2x 15.8x 13.7x 12.8x2016E Payout Ratio 10.4% P/EBITDA 18.8x 13.4x 11.6x 10.8x
P/E 31.9x 23.5x 19.5x 18.0x
Net debt ($MM) $444.6 $558.8 $545.0 $512.5Net debt/EBITDA 2.5x 2.3x 1.9x 1.7xDebt/Equity 0.7x 0.6x 0.6x 0.4x

January 15, 2016 ACUMEN CAPITAL | RESEARCH IDEAS. GROWTH. OPPORTUNITY.
Page 16 of 19
Small Cap Growth Update (2016 Outlook) Acumen Capital Finance Partners Limited #700, 404 – 6 Avenue SW | Calgary, AB | T2P 0R9| Main Phone: 403-571-0300
NOTES
January 15, 2016 ACUMEN CAPITAL | RESEARCH IDEAS. GROWTH. OPPORTUNITY.
Page 17 of 19
Small Cap Growth Update (2016 Outlook) Acumen Capital Finance Partners Limited #700, 404 – 6 Avenue SW | Calgary, AB | T2P 0R9| Main Phone: 403-571-0300
Disclosure Requirements Is this an issuer related or industry related publication? Issuer Industry Does the Analyst/Associate have a financial interest in securities of the subject issuer? If yes, nature of interest:
Alaris Royalty Corp.– Analyst family member owns common shares Yes No
AlarmForce Industries Inc. Yes No
Axia NetMedia Corporation Yes No
BrightPath Early Learning Inc. Yes No
Black Diamond Group Limited – Analyst family member owns common shares Yes No
Cervus Equipment Corporation Yes No
Computer Modelling Group Limited. – Analyst’s family members own common shares Yes No
CRH Medical Corporation Yes No
CWC Well Services Corp. Yes No
DirectCash Payments Inc. - Analyst and analyst’s family member owns common shares Yes No
Gamehost Inc. Yes No
Global Water Resources Corp Yes No
Input Capital Corp. Yes No
K-Bro Linen Inc. Yes No
MCAN Mortgage Corporation Yes No
Mediagrif Interactive Technologies Inc. Yes No
Northern Frontier Corp. Yes No
Park Lawn Corp. Yes No
People Corporation Yes No
PFB Corp Yes No
Stella-Jones Inc. Yes No
Is Acumen Capital Partners a market maker in the issuer’s securities at the date of this report? Yes No Does Acumen Capital Partners beneficially own more than 1% of any class of common equity of the issuer?
Yes No
Does Acumen Capital Partners or the Analyst/Associate have any actual material conflicts of interest with the issuer?
Yes No
Does the Analyst/Associate or Household member serve as a Director, Officer, or Advisory Board Member of the issuer?
Yes No
Has the Analyst/Associate received any direct compensation from the subject companies in the past 12 months?*
Yes No
Has Acumen Capital Partners managed or co-managed an offering of securities by the issuer in the past 12 months?
Alaris Royalty Corp. Yes No
AlarmForce Industries Inc. Yes No
Axia NetMedia Corporation Yes No
Black Diamond Group Limited Yes No
BrightPath Early Learning Inc. Yes No
Cervus Equipment Corporation Yes No
Computer Modelling Group Limited. Yes No
CRH Medical Corporation Yes No
CWC Well Services Corp. Yes No
DirectCash Payments Inc. Yes No
Gamehost Inc. Yes No
Global Water Resources Corp Yes No
Input Capital Corp. Yes No
K-Bro Linen Inc. Yes No
MCAN Mortgage Corporation Yes No
Mediagrif Interactive Technologies Inc. Yes No
Northern Frontier Corp. Yes No
Park Lawn Corp. Yes No
People Corporation Yes No
PFB Corp Yes No
Stella-Jones Inc. Yes No

January 15, 2016 ACUMEN CAPITAL | RESEARCH IDEAS. GROWTH. OPPORTUNITY.
Page 18 of 19
Small Cap Growth Update (2016 Outlook) Acumen Capital Finance Partners Limited #700, 404 – 6 Avenue SW | Calgary, AB | T2P 0R9| Main Phone: 403-571-0300
Has Acumen Capital Partners received compensation for investment banking and related services from the issuer in the past 12 months?
Alaris Royalty Corp. Yes No
AlarmForce Industries Inc. Yes No
Axia NetMedia Corporation Yes No
Black Diamond Group Limited Yes No
BrightPath Early Learning Inc. Yes No
Cervus Equipment Corporation Yes No
Computer Modelling Group Limited. Yes No
CRH Medical Corporation Yes No
CWC Well Services Corp. Yes No
DirectCash Payments Inc. Yes No
Gamehost Inc. Yes No
Global Water Resources Corp Yes No
Input Capital Corp. Yes No
K-Bro Linen Inc. Yes No
MCAN Mortgage Corporation Yes No
Mediagrif Interactive Technologies Inc. Yes No
Northern Frontier Corp. Yes No
Park Lawn Corp. Yes No
People Corporation Yes No
PFB Corp Yes No
Stella-Jones Inc. Yes No
Other disclosures:
Yes No
* Acumen has a pool for compensation purposes, which includes research analysts, investment banking personnel, sales people and institutional traders. Revenue in the pool includes trading commissions, advisory fees, new issue commissions and broker warrant proceeds.
Acumen Recommendation Structure: Buy, Speculative Buy , Hold, Reduce , Under Review , Tender Full Recommendation Structure explanation can be found at the Acumen Capital Partners website: www.acumencapital.com
The information transmitted is privileged, confidential, may be subject to copyright and is intended solely for the use of the individual or entity to which the transmission is addressed. This transmission is provided for informational purposes only, and does not constitute an offer or solicitation to buy or sell any securities discussed herein in any jurisdiction where such would be prohibited, nor in any jurisdiction where Acumen is not registered to do so. The views expressed are those of the sender and not necessarily those of Acumen Capital Finance Partners Limited or its subsidiaries. Any unauthorized use, distribution, review or disclosure is prohibited. If you received this in error, please notify the sender and delete or destroy this message and any copies. Acumen does or seeks to do business with companies covered in our research comments and reports. As a result, investors should be aware that the firm may be in a conflict of interest. Investors should consider this report as only a single factor in making their investment decision©2016.

January 15, 2016 ACUMEN CAPITAL | RESEARCH IDEAS. GROWTH. OPPORTUNITY.
Page 19 of 19
Small Cap Growth Update (2016 Outlook) Acumen Capital Finance Partners Limited #700, 404 – 6 Avenue SW | Calgary, AB | T2P 0R9| Main Phone: 403-571-0300
ACUMEN CAPITAL | STAFF LIST ACUMEN CAPITAL | PARTNERS
RESEARCH
Brian D. Pow, MBA Vice President Research, Equity Analyst (403) 571-0303 [email protected]
Trevor Reynolds Oil and Gas Research Analyst (403) 410-6842 [email protected]
Mike McMeeken Research Associate (403) 571-0530 [email protected]
Oliver Shao Research Associate (403) 410-6840 [email protected]
INSTITUTIONAL SALES
Brian Parker President & CEO, Institutional Sales (403) 571-2514 [email protected]
Douglas S. Gowland, C.A., CFA Vice President, Institutional Sales (403) 571-0317 [email protected]
Andre Drouillard, CFA Vice President, Institutional Sales (403) 571-0685 [email protected]
Robert Cooper, CFA Institutional Sales (403) 571-0324 [email protected]
TRADING
Liam Farrell Head Trader (403) 571-0318 [email protected]
David Waite Institutional Trading (403) 410-6730 [email protected]
Jesse Ahlan Institutional Trading (403) 571-0148 [email protected]
Crystal Bellefountaine Associate (403) 571-0314 [email protected]
INVESTMENT BANKING
Kelly Hughes Vice President, Investment Banking (403) 571-5036 [email protected]
Ian Thomson Vice President, Investment Banking (403) 571-0301 [email protected]
Shawn Ostrow Investment Banking Associate (403) 571-0319 [email protected]
RETAIL SALES
Robert Laidlaw Vice President (403) 571-2522 [email protected]
Imran Mulji Investment Advisor (403) 571-0112 [email protected]
Margaret Samson Investment Advisor Assistant (403) 441-0536 [email protected]
Sheldon LeLievre Vice President, Sr. Investment Advisor (403) 571-0315 [email protected]
Craig Madill Investment Advisor (403) 410-6018 [email protected]
Erin Williams Investment Advisor Assistant (403) 571-2416 [email protected]
Donny Woo Vice President, Sr. Investment Advisor (403) 571-2510 [email protected]
Darren Fong Investment Advisor (403) 441-2754 [email protected]
Alan Tolg Investment Advisor (403) 410-2042 [email protected]
Ron Cairns Investment Advisor (403) 410-2040 [email protected]
Scott Barnett Investment Advisor (403) 571-0532 [email protected]
Curtis Schirrmacher Investment Advisor (403) 571-0113 [email protected]
Preston Smith Investment Advisor (403) 571-2195 [email protected]
Grant Gowland Associate (403) 441-0537 [email protected]
Matthew Wiens Associate (403) 441-5672 [email protected]
TREASURY AND OPERATIONS
Cindy Marthaller Operations Manager (403) 571-8045 [email protected]
Myja Miller CFO, COO (403) 571-0308 [email protected]
Govind Achyuthan Chief Compliance Officer (403) 571-0689 [email protected]
Krystine Hebert Client Services (403) 571-0300 [email protected]
Acumen Capital Finance Partners Limited | Main Phone: 403-571-0300 | Trading Toll Free: 1-866-410-9039
www.acumencapital.com
| Suite 700, 404 – 6 Avenue SW Calgary, AB T2P 0R9 |