credit suisse healthcare conference - gsk › media › 2625 › abbas-hussain... · credit suisse...
TRANSCRIPT
Credit Suisse Healthcare Conference
Hong Kong, 14 November 2011
Abbas Hussain President, Emerging Markets & Asia Pacific,
GlaxoSmithKline

2
Q3 2011 Corporate performance
Q3 Earnings per share before major restructuring 28.5p (+1%)
Total turnover £7,104 m
Reported total sales +3%, Underlying total sales* +6%
Underlying sales growth in Emerging Markets (+11%), Japan (+57%) and USA (+1%), offsetting decline in Europe (-4%)
Consumer Healthcare growth +5%
Group sales outside USA and Europe £2.7 billion (+17%), representing around 38% of reported turnover
Dividend increased by 6% to 17p
2011 share buyback increased to up to £2.3bn (9mYTD total £1.8bn repurchased)
* excludes pandemic, Avandia and Valtrex

3
Emerging Markets & Asia Pacific Region is increasingly important to GSK
9 month YTD 2011Turnover and CER growth rates; Business performance* Underlying global sales growth excluding pandemic products, Avandia and Valtrex : 9montth YTD 2011= +5% ; 3Q11=+6%
US Pharma£5.2bn
EuropePharma£4.3bn
Rest of Pharma£0.6bn
Emerging Markets Pharma £2.7bn
Asia Pac Pharma £0.9bn
Consumer £3.9bn
+5%
-13%
+7%(+18%
underlying*)
-13%
-6%
ViiV(HIV)
£1.2bn+1%
GSK 9month YTD2011 Group turnover £20.4bn (-3%*)3Q11 £7.1bn (+3%*)
JapanPharma £1.5bn
-2%
+5%(+10%
underlying*)
4
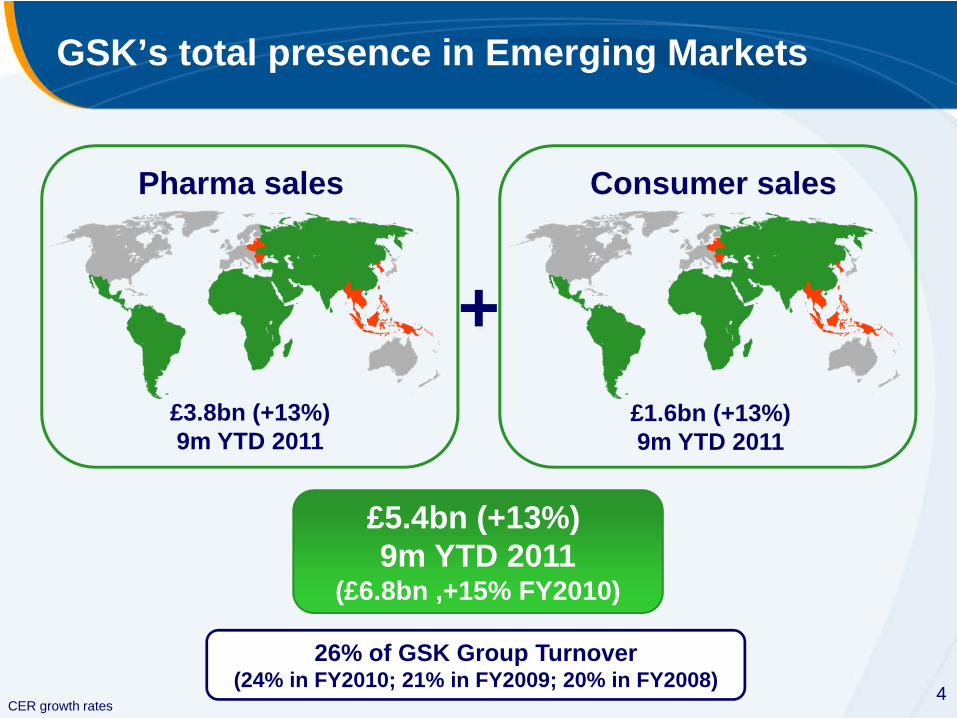
GSK’s total presence in Emerging Markets
£5.4bn (+13%) 9m YTD 2011
(£6.8bn ,+15% FY2010)
26% of GSK Group Turnover(24% in FY2010; 21% in FY2009; 20% in FY2008)
+£1.6bn (+13%)9m YTD 2011
£3.8bn (+13%)9m YTD 2011
Pharma sales Consumer sales
CER growth rates
5
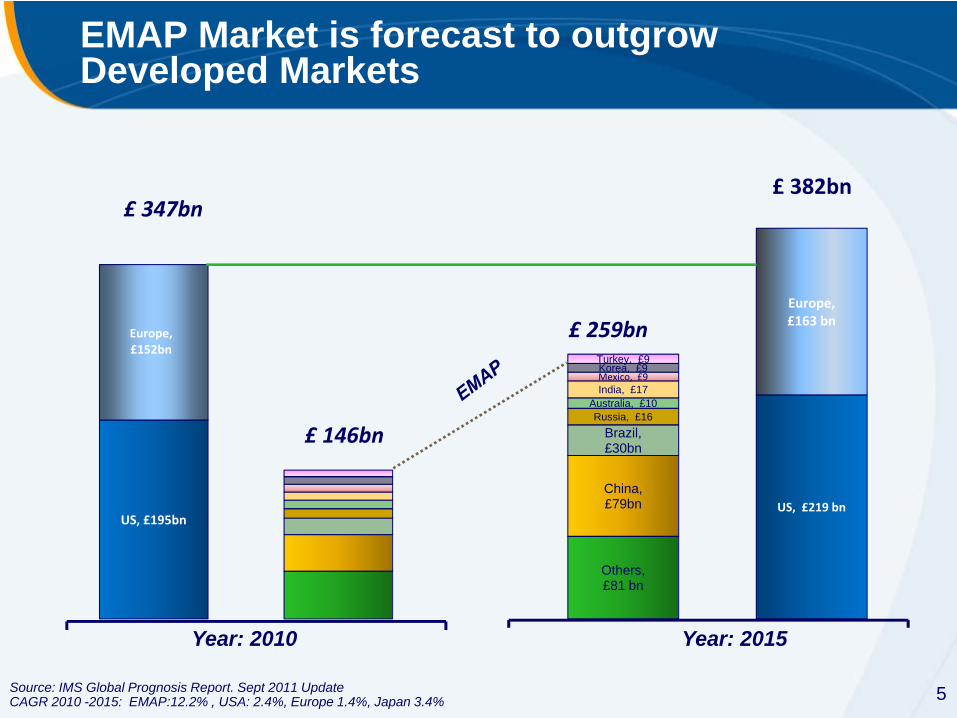
Year: 2010 Year: 2015
Source: IMS Global Prognosis Report. Sept 2011 UpdateCAGR 2010 -2015: EMAP:12.2% , USA: 2.4%, Europe 1.4%, Japan 3.4%
US, £195bn
Europe, £152bn
US, £219 bn
Europe, £163 bn
Others, £81 bn
China, £79bn
Brazil, £30bn
Russia, £16 Australia, £10
India, £17 Mexico, £9 Korea, £9 Turkey, £9
£ 382bn£ 347bn
£ 259bn
£ 146bn
EMAP Market is forecast to outgrow Developed Markets

6
Looking ahead: Key risks and uncertainties
Slowing market growth in EMAPIncreased protectionismPricing pressuresMarket inflationGeneric impactsWinning the war for talent

7
GSK Vision in Emerging Markets & Asia Pacific
To build the leading, pioneering pharmaceuticals company in EMAP bringing affordable, quality GSK medicines of value to more people who need them acrossthe Region
8
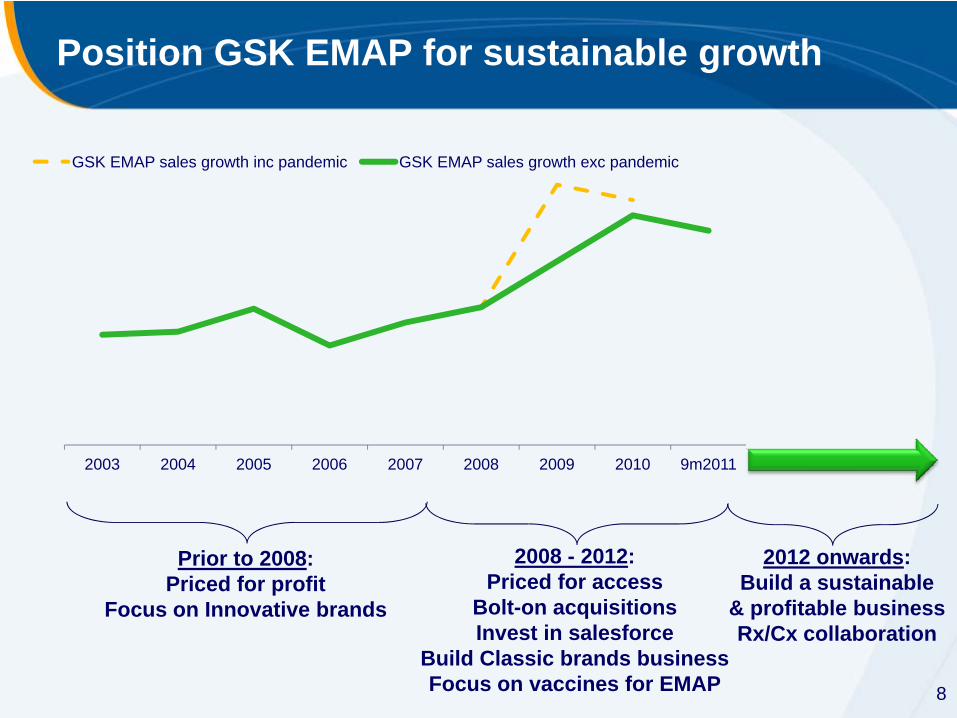
Position GSK EMAP for sustainable growth
2003 2004 2005 2006 2007 2008 2009 2010 9m2011
GSK EMAP sales growth inc pandemic GSK EMAP sales growth exc pandemic
Prior to 2008:Priced for profit
Focus on Innovative brands
2008 - 2012:Priced for access
Bolt-on acquisitionsInvest in salesforce
Build Classic brands businessFocus on vaccines for EMAP
2012 onwards:Build a sustainable
& profitable businessRx/Cx collaboration
9
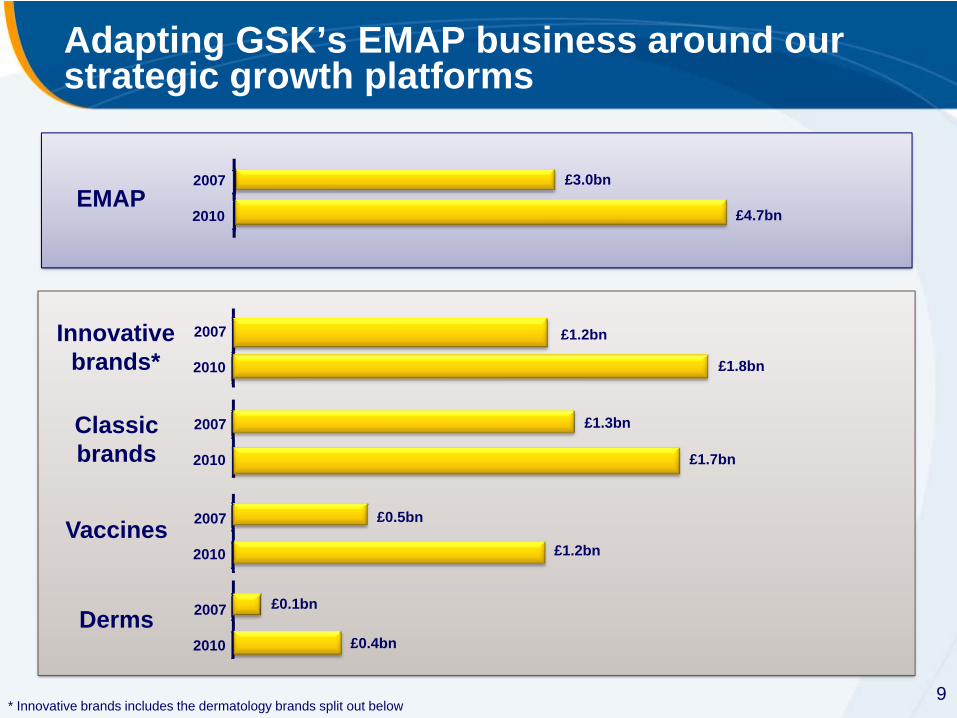
Adapting GSK’s EMAP business around our strategic growth platforms
2007
2010
2007
2010
2007
2010
2007
2010
2007
2010
EMAP
Innovativebrands*
Classicbrands
Vaccines
Derms
£3.0bn
£4.7bn
£1.2bn
£1.8bn
£1.7bn
£1.2bn
£0.4bn
£1.3bn
£0.5bn
£0.1bn
* Innovative brands includes the dermatology brands split out below

10
80% of GSK EMAP business is spread over 19 markets
0
50
100
150
200
250
300
350
400
450
SEPT
YTD
201
1 SA
LES
£M

11
Broad portfolio of brands representing 80% of GSK EMAP business
0
50
100
150
200
250
300
350
400
SEPT
YTD
201
1 SA
LES
£M
12
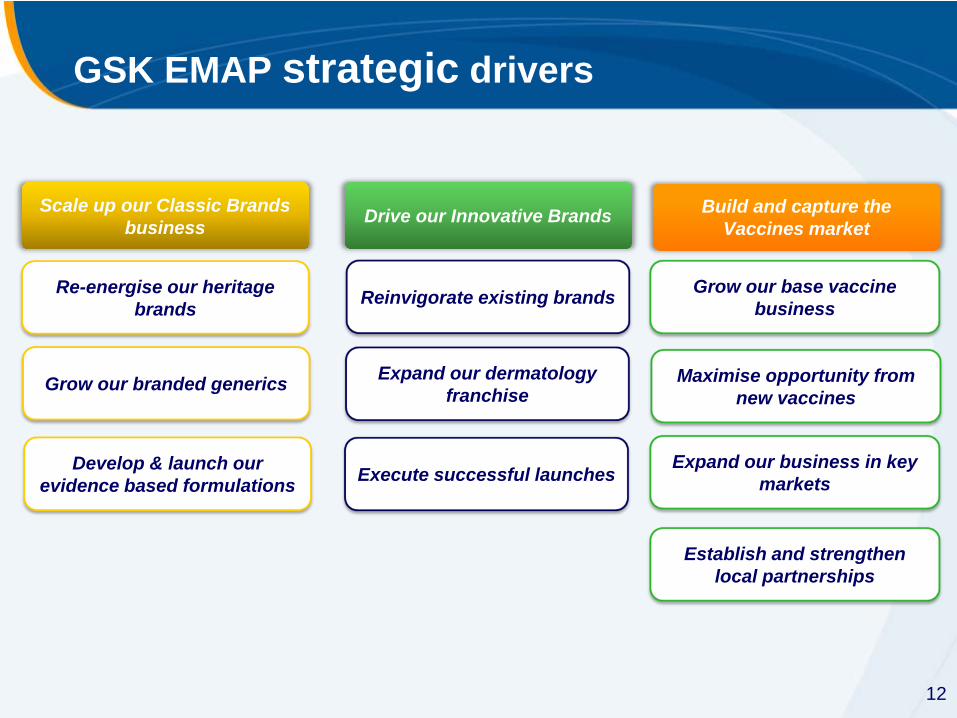
GSK EMAP strategic drivers
Scale up our Classic Brands business Drive our Innovative Brands Build and capture the
Vaccines market
Grow our base vaccine business
Maximise opportunity from new vaccines
Expand our business in key markets
Establish and strengthen local partnerships
Reinvigorate existing brands
Expand our dermatology franchise
Execute successful launches
Re-energise our heritage brands
Grow our branded generics
Develop & launch our evidence based formulations
13
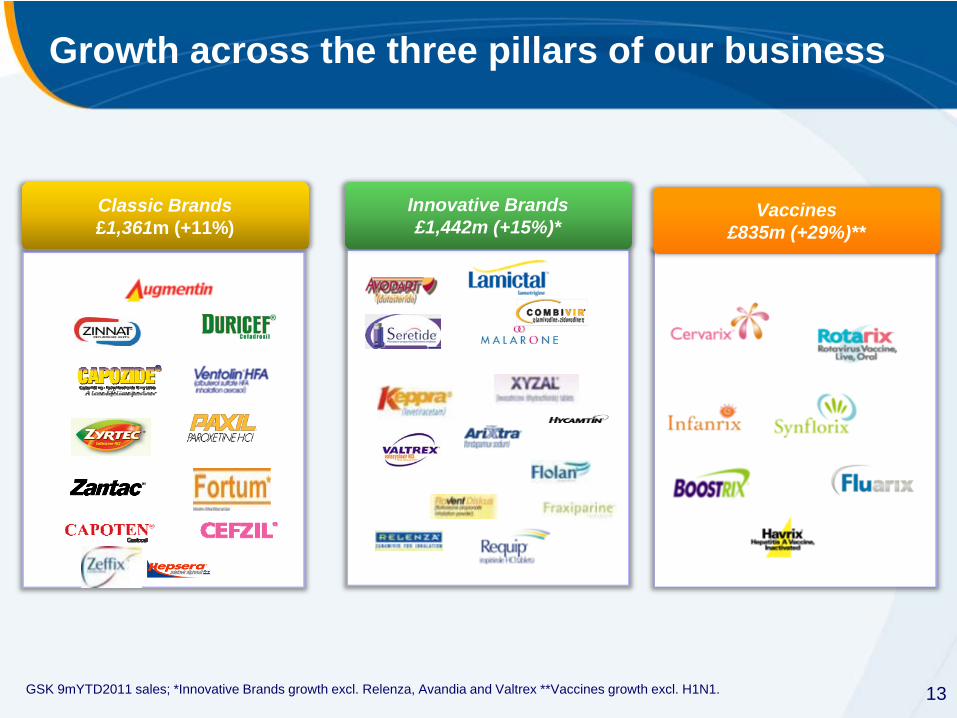
Growth across the three pillars of our business
Classic Brands £1,361m (+11%)
Innovative Brands £1,442m (+15%)*
Vaccines £835m (+29%)**
GSK 9mYTD2011 sales; *Innovative Brands growth excl. Relenza, Avandia and Valtrex **Vaccines growth excl. H1N1.
14
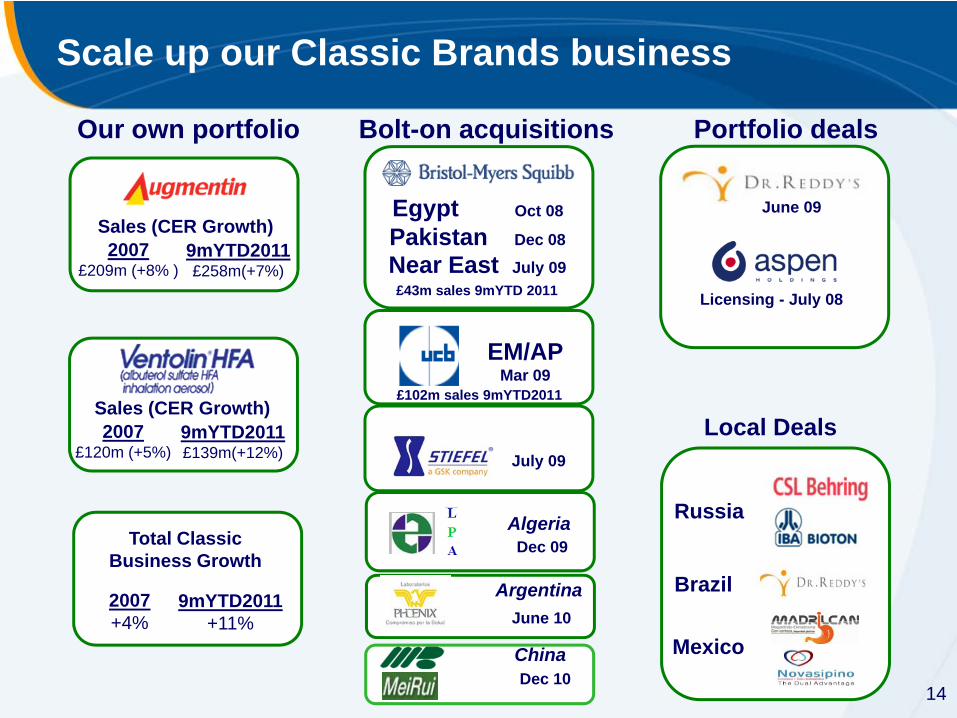
Scale up our Classic Brands business
Our own portfolio Bolt-on acquisitions Portfolio deals
Sales (CER Growth)2007
£120m (+5%)9mYTD2011£139m(+12%)
Egypt Oct 08
Pakistan Dec 08
£43m sales 9mYTD 2011Near East July 09
£102m sales 9mYTD2011
EM/APMar 09
July 09
June 09
Licensing - July 08
Total Classic Business Growth
2007+4%
9mYTD2011+11%
AlgeriaDec 09
Local Deals
Russia
Brazil
Mexico
ArgentinaJune 10
Sales (CER Growth)2007
£209m (+8% )9mYTD2011£258m(+7%)
ChinaDec 10
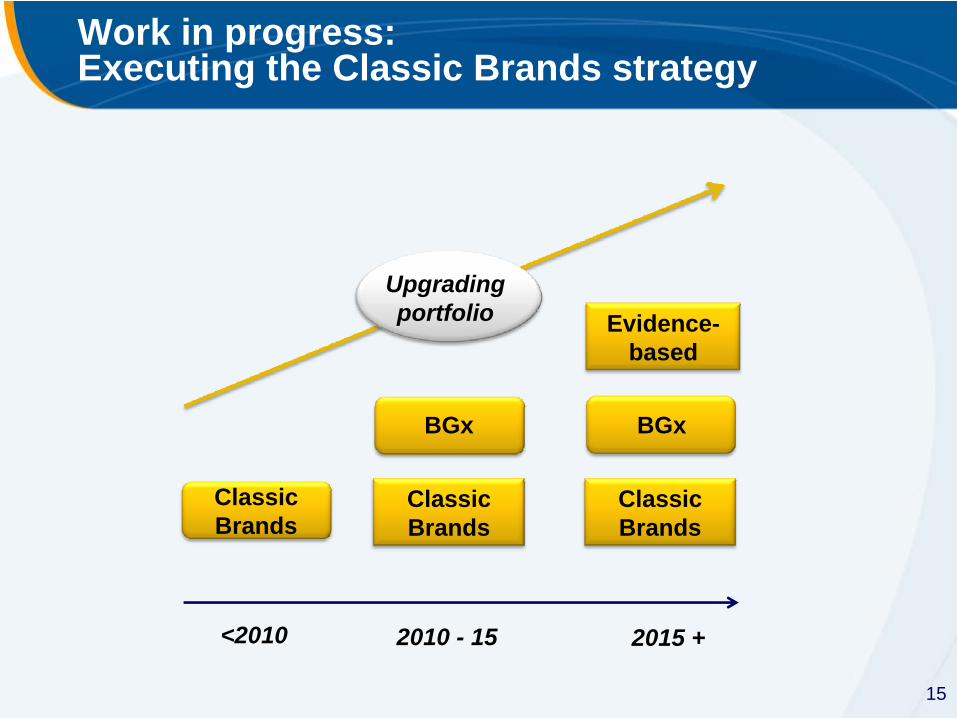
15
Work in progress: Executing the Classic Brands strategy
BGx BGx
2010 - 15 2015 +
Upgrading portfolio
Classic Brands
Classic Brands
<2010
Classic Brands
Evidence-based

16
Re-energising our heritage Classic brands: Augmentin
02468
10121416
2005 2008 20100
2
4
6
8
10
2005 2008 2010
Brazil Ukraine
Sale
s £
m
Sale
s £
m
+22% CAGR +48% CAGR

17
Network consolidation: – 60% of the network consolidated in 24 months.– Six site exits in three years
Improve Performance 43% productivity pack per FTE improvement and 21% cost per pack reduction in three years
In-sourcing Turkey, Philippines, Greece in-sourced
RESULTS: 48% volume increase in four years
Improving Market Access:Augmentin supply chain improvement

18
Re-energising our heritage Classic brands: Ventolin
0
2
4
6
8
10
12
2005 2008 20100
1
2
3
4
5
2005 2008 2010
China Chile
Sale
s £
m
Sale
s £
m
+31% CAGR
+34% CAGR

19
Drive our Innovative business
Core portfolio9mYTD2011 Turnover
£371m (+2%)
£138m (+12%)
£50m (+24%)
£67m(-9%)
New portfolio9mYTD2011 Turnover
Future portfolioNew products:
VotrientArzerraProliaBenlystaRelovairdarapladib
Targeted R&D developing EM-specific portfolio
Tykerb for gastric and H&N cancersLiver cancerMarket-specific fixed dose combinations
£52m (+27%)
£33m (+27%)
£42m (+46%)
£14m (+50%)
Source: GSK 9mYTD2011 EMAP sales; CER growth rates
20
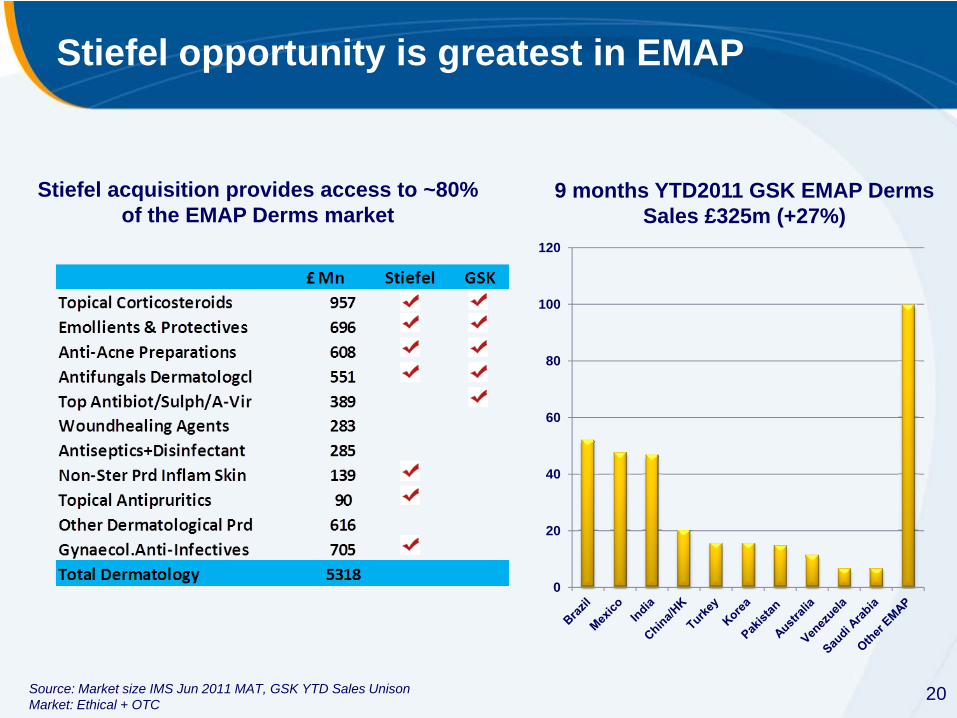
Stiefel opportunity is greatest in EMAP
Stiefel acquisition provides access to ~80% of the EMAP Derms market
9 months YTD2011 GSK EMAP Derms Sales £325m (+27%)
Source: Market size IMS Jun 2011 MAT, GSK YTD Sales UnisonMarket: Ethical + OTC
0
20
40
60
80
100
120

21
What is going well: 2010 access initiatives -Avamys and Avodart
0
1
2
3
4
2009 2010
Avodart
49%
Pack
s (m
illio
ns)
0
2
4
6
8
2009 2010
Avamys
184%
Pack
s (m
illio
ns)

22
0
500
1,000
1,500
2,000
2,500
3,000
3,500
2 3 4 5 6 7 8 9 101112 1 2 3 4 5 6 7 8 9 101112 1 2 3 4 5 6 7 8 9 101112 1 2 3 4 5 6
2008 2009 2010
Improving Market Access:price reduction of Avodart in Russia
packsSelling 5 fold number of units pm post price reduction
(Avodart is a self pay product in Russia)
Source: PharmExpert data
price reduction initiative since Jan’10
2011
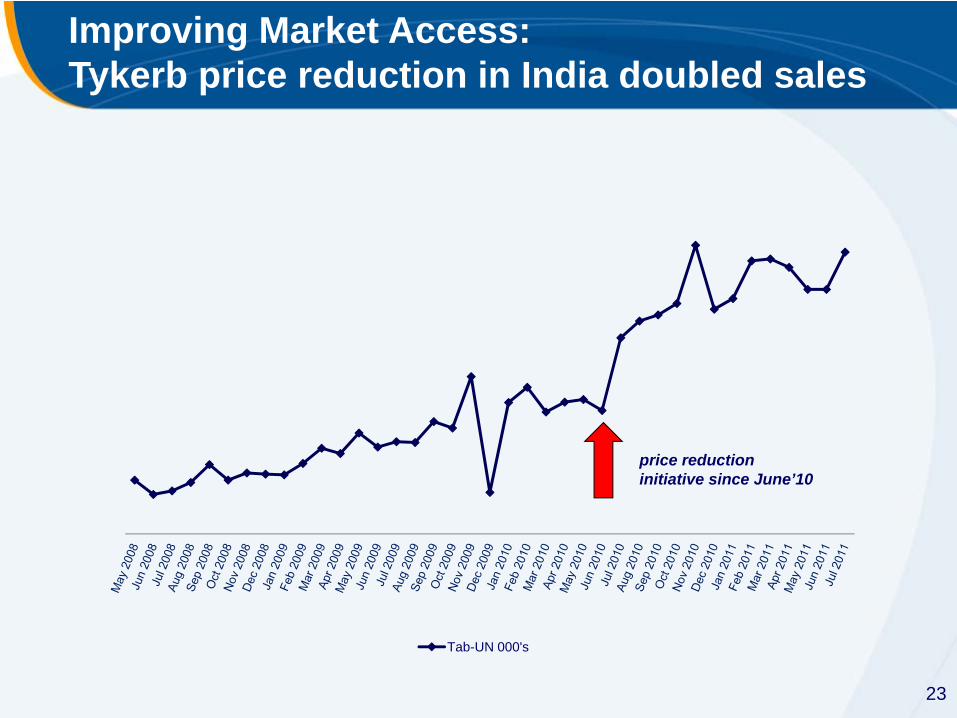
23
Tab-UN 000's
Improving Market Access:Tykerb price reduction in India doubled sales
price reduction initiative since June’10

24
Build and capture the Vaccines market
Significant marketgrowth potential
Growing government attentionto public health agenda
Large birth cohorts forpaediatric vaccines
Significant GSKgrowth potential
New geographies
Broad portfolio, well-positioned to provide for spectrum of needs
Local partnership is critical
Source: GSK estimates for market; GSK reported sales. (9mYTD 2011 EM AP vaccines data).*excluding pandemic vaccine
Total EMAP Vaccines Market 2010£3.2bn (+25%)
GSK has 38% of themarket and is growing faster
£835m (+29%*)GSK EMAP Vaccines
9mYTD2011
25
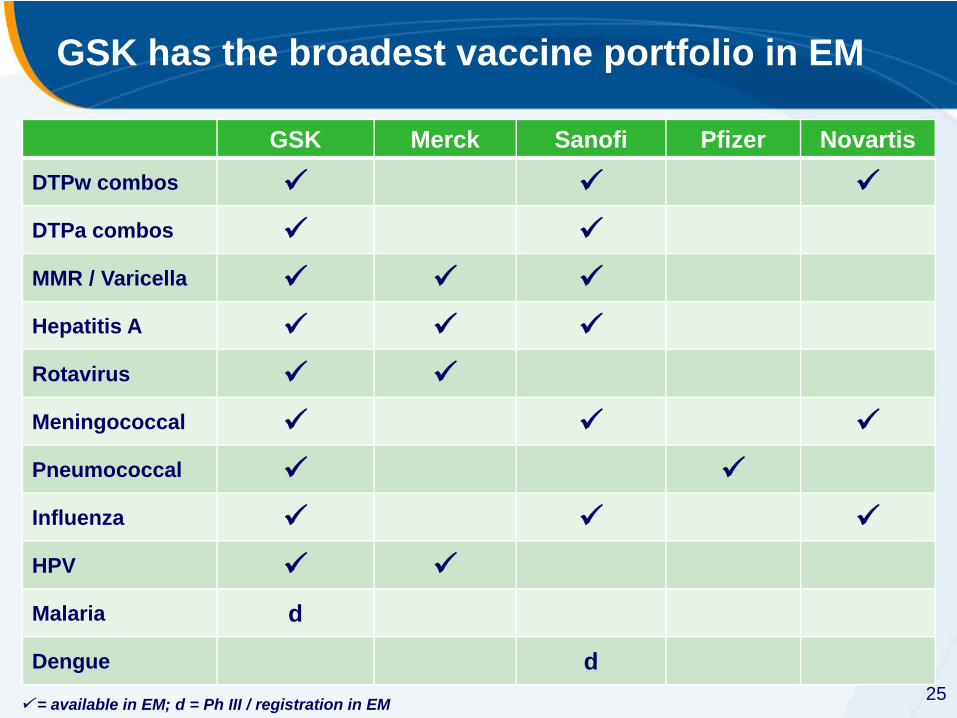
GSK Merck Sanofi Pfizer Novartis
DTPw combos
DTPa combos
MMR / Varicella
Hepatitis A
Rotavirus
Meningococcal
Pneumococcal
Influenza
HPV
Malaria d
Dengue d
GSK has the broadest vaccine portfolio in EM
= available in EM; d = Ph III / registration in EM

26
Strong launches are building the vaccines business
The best launch in a decade of new launches in GSK; £247m (+98%) EMAP sales during 9 months YTD2011Submitted in 114 & Approved in 78 countriesBrazil Fiocruz 10+ year contractMexico 3 year contract Added to new 6 countries UMVAMC 10 year contract for GAVI countries ($1.3bn)
Source: GSK 9mYTD2011 reported sales; CER growth rates

27
Key success factors for GSK in EMAP
Successfully identify and integrate M&A
targets
Attract and develop talented people
Leveraging volumes to deliver cost leadership
Market impact: expand sales forces to improve
market reach and execute commercial
strategy with excellence
Launch excellence on GSK pipeline
Strong presence and broad and relevant product portfolio

28
GSK Emerging Markets in 2015
EMAP market growth of 10% –12%
Our objective is to grow faster than the market2
Innovative
Classic
Vaccines
Innovative
Classic Vaccines
FY2010
2015 ambition
Outgrow the market Evolve our business
. 2 including organic growth and bolt-on acquisition strategy.

29
Operating profit margin
US 69
Europe 55
EMAP 34
1 Operating margin excluding R&D, legal and other unallocated pharmaceuticals costs, and including pandemic.
GSK’s reported regional margins exclude R&D and legal expenses which are heavily weighted towards Europe and US
EM AP has been in “investment mode”
EMAP margin expected to remain in mid-30s range
9m YTD 2011 Operating Profit Margin1(%)

30