credit risk, diversification and setting limits mark c. abbott, managing director, guardian life...
Post on 21-Dec-2015
213 views
TRANSCRIPT

Credit Risk, Diversification and Setting LimitsCredit Risk, Diversification and Setting Limits
Mark C. Abbott, Managing Director, Guardian LifeSaturday, November 23, 2002 - Columbia University Practitioners Conference in Mathematics of Finance

2
OutlineOutline• Overview• Market Concerns• Credit Risk Limits• Credit Risk Models• Credit Risk Diversification• Credit Risk Management Process
• Overview• Market Concerns• Credit Risk Limits• Credit Risk Models• Credit Risk Diversification• Credit Risk Management Process

3
Overview:Current State of the Credit MarketOverview:Current State of the Credit Market
• Although Fixed Income has recently outperformed equity, the Corporate Bond market has severely underperformed Treasuries
• The market has experienced rising defaults, downgrades, and an unprecedented number of Investment Grade credits falling into High Yield (a.k.a. “Fallen Angels”)– “Fallen Angels” are overwhelming the High Yield market as they number 14 of the top 25
issuers and comprise 20% of the total amount outstanding in High Yield
• Telecom/Energy have been at the core of the fundamental deterioration in credit with outsized spending to meet unrealistic demand expectations and aggressive expansions into energy trading in utilities
• Extreme market volatility and limited liquidity best characterizes the current state of the corporate bond market– Banks are restricting access to liquidity and the resulting illiquidity is contributing to the
credit market’s volatility
• Portfolio diversification is difficult to achieve given that 33% of amount outstanding and 42% of new issue volume are in the the top 25 names
• Survival depends on minimizing the occurrence and magnitude of distressed credits

4
Market ConcernsMarket Concerns
• What is contributing to the current credit volatility?–Bear equity market and corporate scandals–Credit recession (stressed credit market)–Liquidity crisis–Historically low rates–Economic recovery unclear
• What is contributing to the current credit volatility?–Bear equity market and corporate scandals–Credit recession (stressed credit market)–Liquidity crisis–Historically low rates–Economic recovery unclear
5
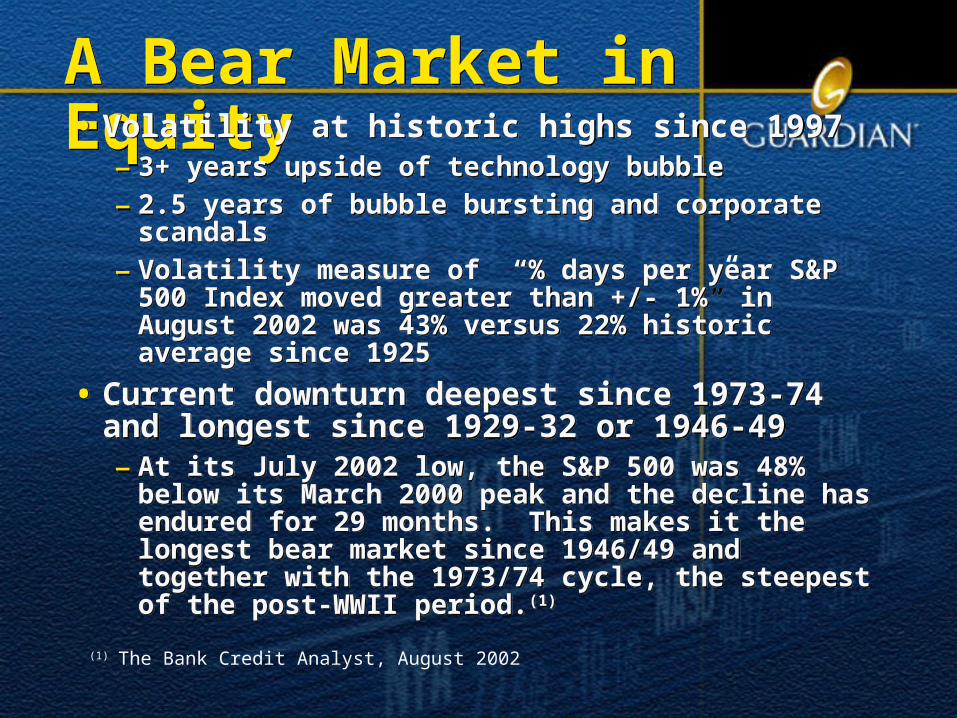
A Bear Market in EquityA Bear Market in Equity• Volatility at historic highs since 1997
– 3+ years upside of technology bubble– 2.5 years of bubble bursting and corporate scandals– Volatility measure of “% days per year S&P 500 Index
moved greater than +/- 1%” in August 2002 was 43% versus 22% historic average since 1925
• Current downturn deepest since 1973-74 and longest since 1929-32 or 1946-49– At its July 2002 low, the S&P 500 was 48% below its March
2000 peak and the decline has endured for 29 months. This makes it the longest bear market since 1946/49 and together with the 1973/74 cycle, the steepest of the post-WWII period.(1)
• Volatility at historic highs since 1997– 3+ years upside of technology bubble– 2.5 years of bubble bursting and corporate scandals– Volatility measure of “% days per year S&P 500 Index
moved greater than +/- 1%” in August 2002 was 43% versus 22% historic average since 1925
• Current downturn deepest since 1973-74 and longest since 1929-32 or 1946-49– At its July 2002 low, the S&P 500 was 48% below its March
2000 peak and the decline has endured for 29 months. This makes it the longest bear market since 1946/49 and together with the 1973/74 cycle, the steepest of the post-WWII period.(1)
(1) The Bank Credit Analyst, August 2002

6
A Bear Market in EquityA Bear Market in Equity• Valuations are still above historic
norms on almost every measure (Price/Earnings, DividendYield, Price/Book, Price/Sales), except for EarningsYield/BondYield (which is near fair value, as bond yields are at historic lows)
• Earnings remain under pressure
• Outflows from domestic equity mutual funds and foreign sales of US stocks has intensified since June 2002(2)
• Valuations are still above historic norms on almost every measure (Price/Earnings, DividendYield, Price/Book, Price/Sales), except for EarningsYield/BondYield (which is near fair value, as bond yields are at historic lows)
• Earnings remain under pressure
• Outflows from domestic equity mutual funds and foreign sales of US stocks has intensified since June 2002(2)
(2) Ned Davis Research Inc., September 2002

7
Recent Equity and Fixed Income Returns (For Periods Ended 10/31/2002)Recent Equity and Fixed Income Returns (For Periods Ended 10/31/2002)
Source: Lehman, Standard & Poors
Average Annual Returns
-12.21
-3.96
0.75
6.34
10.379.34
7.07 7.52
-20.14
-15.10
-25
-20
-15
-10
-5
0
5
10
15
1 Year 2 Years 3 Years 4 Years 5 Years
Ret
urn
%
S&P 500 Lehman Aggregate
5 Yr Cumulative Returns(Since End of October 1997)
3.82
41.45
-10
0
10
20
30
40
50
60
70
80
Oct-97
Apr-9
8
Oct-98
Apr-9
9
Oct-99
Apr-0
0
Oct-00
Apr-0
1
Oct-01
Apr-0
2
Oct-02
Ret
urn
%
S&P 500 Lehman Aggregate

8
Credit Market Under StressCredit Market Under Stress• Unprecedented numbers of distressed credits
(“Fallen Angels” are investment grade credits that have been downgraded to high yield)
– $115 billion Fallen Angels YTD through October 2002– Since 2001 default rates have exceeded 1991 highs– "Default rates have been rising continuously since 1999. It has been like a credit
recession for several years and I expect it to continue until default rates clearly have peaked.” Edward Altman, Ph.D. NYU Stern School of Business
– 2001 experienced the most ever Chapter 11 filings with 170 and pre-petition liabilities of $230 billion
• First half of 2002 had 74 filings totaling $130 billion
• Since June 1997 a series of financial crises have resulted in huge volatility in and widening of credit spreads; this has produced sustained negative excess returns in corporate issues
• Moody’s downgrade/upgrade ratio rose from 1.4 in 1998 to 4.1 • Moody’s year-to-year defaults rose from 1.3% in 1998 to 10.53% in June
2002 and are at 9.2% for September 2002
• Unprecedented numbers of distressed credits (“Fallen Angels” are investment grade credits that have been downgraded to high yield)
– $115 billion Fallen Angels YTD through October 2002– Since 2001 default rates have exceeded 1991 highs– "Default rates have been rising continuously since 1999. It has been like a credit
recession for several years and I expect it to continue until default rates clearly have peaked.” Edward Altman, Ph.D. NYU Stern School of Business
– 2001 experienced the most ever Chapter 11 filings with 170 and pre-petition liabilities of $230 billion
• First half of 2002 had 74 filings totaling $130 billion
• Since June 1997 a series of financial crises have resulted in huge volatility in and widening of credit spreads; this has produced sustained negative excess returns in corporate issues
• Moody’s downgrade/upgrade ratio rose from 1.4 in 1998 to 4.1 • Moody’s year-to-year defaults rose from 1.3% in 1998 to 10.53% in June
2002 and are at 9.2% for September 2002
Source: Lehman, Moody’s, Edward Altman

9
Liquidity CrisisLiquidity Crisis
• Credit contraction in bank lending and commercial paper is causing a “liquidity crisis”, reversing trend for last 5 years of 20% annual expansion– Bank lending is currently 15% lower than last July– Non-financial CP has contracted 47.7% to a low of
$179.5 billion in June 2002 from high of $343.3 billion in December 2000
• Financial leverage (ratio of current debt to total market capitalization) of corporations increased in 2002 to 26.6% (on $4.5 trillion), the highest level since the 1990-91 recession
Source: Lehman

10
Historical Lows For Interest RatesHistorical Lows For Interest Rates• Aggressive Fed easing with Fed Funds at 1.25% since November
6, 2002 cut of 50 bps– The resulting yield curve is the steepest since Fall 1992
• Rates at 4-decade lows– 10-year Treasury Note yield of 3.57% on October 9th was at a
44-year low– As of November 11, 2002 the 10-year has risen 58 bps from
this low• Historically low rates led to another mortgage refinancing wave
which is supporting consumer spending• Expectation is for interest rates to stay low this year, rising next
year as the yield curve to flatten from the short end
• Aggressive Fed easing with Fed Funds at 1.25% since November 6, 2002 cut of 50 bps– The resulting yield curve is the steepest since Fall 1992
• Rates at 4-decade lows– 10-year Treasury Note yield of 3.57% on October 9th was at a
44-year low– As of November 11, 2002 the 10-year has risen 58 bps from
this low• Historically low rates led to another mortgage refinancing wave
which is supporting consumer spending• Expectation is for interest rates to stay low this year, rising next
year as the yield curve to flatten from the short endSource: Bloomberg
UPDATE

11
Uncertainty of Economic RecoveryUncertainty of Economic Recovery• Blue Chip consensus GDP growth is forecast at 1.6% in
Q4-2002 and 3.3% in 2003.• Concerns that declines in equity markets and financial
wealth could reduce consumer spending and economic growth
• Continued concern: Geopolitical risk may disrupt recovery
• Blue Chip consensus GDP growth is forecast at 1.6% in Q4-2002 and 3.3% in 2003.
• Concerns that declines in equity markets and financial wealth could reduce consumer spending and economic growth
• Continued concern: Geopolitical risk may disrupt recovery
Source: Blue Chip Consensus Forecast

12
Investment Grade Corporate Cumulative Excess ReturnsInvestment Grade Corporate Cumulative Excess Returns
-0.24
0.55
-2.00
-1.00
0.00
1.00
2.00
3.00
4.00
5.00
6.00
Curv
e Ad
just
ed E
xces
s RO
R
Lehman Credit Index Cumulative Excess ROR Lehman Credit Index Ex Communications Cumulative Excess ROR
-0.24
0.55
-2.00
-1.00
0.00
1.00
2.00
3.00
4.00
5.00
6.00
Curv
e Ad
just
ed E
xces
s RO
R
Lehman Credit Index Cumulative Excess ROR Lehman Credit Index Ex Communications Cumulative Excess ROR
Period of Narrowing Corporate Spreads
A Series of Financial Crises
WorldcomEnron
Asia Crisis
Russia Collapse, LTCM
Technology Bubble Collapses

13
Source: Lehman
Corporate Bond ValuationsAnything But Telecom and Pipelines! (From December 31, 2001 through September 30, 2002)
Corporate Bond ValuationsAnything But Telecom and Pipelines! (From December 31, 2001 through September 30, 2002)
100
150
200
250
300
350
400
450
500
550
600
650
31-D
ec-0
1
14-J
an-0
2
28-J
an-0
2
11-F
eb-0
2
25-F
eb-0
2
11-M
ar-0
2
25-M
ar-0
2
8-Apr-0
2
22-A
pr-0
2
6-M
ay-0
2
20-M
ay-0
2
3-Ju
n-02
17-J
un-0
2
1-Ju
l-02
15-J
ul-0
2
29-J
ul-0
2
12-A
ug-0
2
26-A
ug-0
2
9-Se
p-02
23-S
ep-0
2
Date
Opt
ion
Adj
uste
d Sp
read
(bp)
Lehman Credit Index Lehman Wirelines Index
Lehman Pipelines Index Lehman Credit Index ex Wirelines & Pipelines

14
Avoiding Credit Disasters and Defaults is EssentialAvoiding Credit Disasters and Defaults is Essential
Fallen Angels
10 114
22 21 25
64
115.4
0
20
40
60
80
100
120
1995 1996 1997 1998 1999 2000 2001 2002 YTD
$ B
illio
ns
Fallen Angels
10 114
22 21 25
64
115.4
0
20
40
60
80
100
120
1995 1996 1997 1998 1999 2000 2001 2002 YTD
$ B
illio
ns
Source: Lehman (2002 YTD through October 31, 2002)
The first ten months of 2002 saw the largest number of Fallen Angels (Investment grade credits that have been downgraded to High Yield) in history (245 totaling $115.4 Billion).
The first ten months of 2002 saw the largest number of Fallen Angels (Investment grade credits that have been downgraded to High Yield) in history (245 totaling $115.4 Billion).
Niagara Mohawk
Telecommunications,TCI Comm, ITT
US West Capital, Columbia/HCA
Waste Management,
Rite Aid
Xerox, Conseco,
Finova
Enron, Calpine, JCPenney, PG&E,
Lucent, Mirant, S.Cal Edison, Delta Airlines,
KMart Worldcom, Qwest, Tyco,Williams Co.,
Georgia Pacific, USWest
Comm., AT&T Canada,
Dynegy, Nortel, Gap, Goodyear

15
Top 50 Fallen Angels from 1995-2002 YTDTop 50 Fallen Angels from 1995-2002 YTD
• WorldCom’s $22.8 Billion total public debt ranks as largest fallen angel
• Qwest’s $14.4 Billion is second
• Tyco’s $8.4 Billion is third• Williams’ $8.0 Billion is
fourth• Enron’s $6.8 Billion is sixth• Georgia-Pacific’s $5.7
Billion is in the top 10• May 2002 will be recalled for
a record $42.8 Billion of fallen angel debt moving into high yield
• July 2002 was next largest at $22.8 Billion
• Cumulative $115 Billion in principal of fallen angels in 2002 YTD is record high
• WorldCom’s $22.8 Billion total public debt ranks as largest fallen angel
• Qwest’s $14.4 Billion is second
• Tyco’s $8.4 Billion is third• Williams’ $8.0 Billion is
fourth• Enron’s $6.8 Billion is sixth• Georgia-Pacific’s $5.7
Billion is in the top 10• May 2002 will be recalled for
a record $42.8 Billion of fallen angel debt moving into high yield
• July 2002 was next largest at $22.8 Billion
• Cumulative $115 Billion in principal of fallen angels in 2002 YTD is record highSource: Lehman (2002 YTD through October 31, 2002)
* Index Exposure -- Actual balance sheet exposure may be higher.
*
Amount OutstandingRanking Fallen Angel Downgrade Date # of issues Before Downgrade After Downgrade ($ million)
1 WORLDCOM May 2002 18 Baa2 Ba2 21,790.02 QWEST May 2002 14 Baa3 Ba2 14,385.63 TYCO Jun 2002 12 Baa2 Ba2 8,389.64 WILLIAMS COMPANY Jul 2002 21 Baa3 B1 8,003.95 CALPINE CANADA ENERGY FIN Dec 2001 10 Baa3 Ba1 6,938.76 ENRON CORP Nov 2001 21 Baa2 B3 6,767.07 GEORGIA-PACIFIC May 2002 18 Baa3 Ba1 5,670.08 U.S. WEST COMMUNICATIONS Jul 2002 12 Baa3 Ba3 5,521.59 PENNEY J C Mar 2001 18 Baa3 Ba2 5,450.010 US WEST CAPITAL FDING May 1998 8 Baa1 Ba1 4,650.011 PACIFIC GAS + ELECTRIC Jan 2001 12 A1 B3 4,162.512 XEROX CORPORATION Dec 2000 12 Baa2 Ba1 3,944.213 TELE-COMMUNICATIONS Apr 1996 13 Baa3 Ba1 3,850.014 CONSECO INC Apr 2000 9 Baa3 Ba1 3,545.015 WASTE MANAGEMENT, INC. Aug 1999 13 Baa2 Ba1 3,350.016 TELLUS CORPORATION Jul 2002 2 Baa2 Ba1 3,300.017 MIRANT AMERICAN GENERATION Dec 2001 7 Baa3 Ba1 3,200.018 EDISON INTERNATIONAL INC Jan 2001 7 A2 Caa2 2,931.119 LUCENT TECHNOLOGIES INC Jun 2001 4 Baa3 Ba1 2,910.020 AT&T CANADA INC Feb 2002 6 Baa3 Ba3 2,864.621 DYNEGY INC Jun 2002 9 Baa3 Ba1 2,800.422 FINOVA CAPITAL CORP Aug 2000 8 Baa2 Ba1 2,800.023 DELTA AIR LINES Sep 2001 6 Baa3 Ba2 2,726.624 SERVICE CORP INTL Jan 2000 11 Baa3 Ba1 2,650.025 TCI COMM INC Apr 1996 6 Baa3 Ba1 2,600.026 NIAGARA MOHAWK POWER Oct 1995 13 Baa3 Ba2 2,385.227 COLUMBIA/HCA HEALTHCARE Feb 1998 11 Baa2 Ba1 2,331.228 NRG ENERGY Jul 2002 7 Baa3 B1 2,330.029 RITE AID CORP Oct 1999 10 Baa1 Ba2 2,300.030 INTERMEDIA COMMUNICATION Apr 2002 6 Baa2 Ba1 2,292.931 USA WASTE SERVICES INC Aug 1999 6 Baa3 Ba1 2,250.032 TENNECO INC Jul 1999 9 Baa1 Ba1 2,213.033 CROWN CORK & SEAL Nov 2000 9 Baa3 B2 2,200.034 MGM GRAND INC Jan 2002 7 Baa3 Ba1 2,200.035 NORTEL NETWORKS LTD-GLOBAL Apr 2002 5 Baa3 Ba3 2,200.036 K MART Dec 2001 6 Baa3 Ba2 1,829.037 LAIDLAW INC. Feb 2000 10 Baa3 Ba1 1,825.038 DANA CORP May 2001 7 Baa2 Ba1 1,800.039 MARCONI CORPORATION PLC Sep 2001 2 Baa2 Ba1 1,800.040 HILTON HOTELS Dec 2001 6 Baa3 Ba1 1,800.041 ITT CORP Mar 1998 4 Baa2 Ba1 1,750.042 GAP INC Feb 2002 4 Baa3 Ba3 1,700.043 SAKS INCORPORATED Jan 2001 5 Baa3 Ba1 1,650.044 UNITED AIR LINES INC May 2001 6 Baa3 Ba1 1,641.245 ROYAL CARIBBEAN Feb 2001 7 Baa3 Ba2 1,625.046 KANSAS GAS + ELECTRIC Mar 2000 8 Baa1 Ba2 1,524.147 PETROLEUM GEO-SERVICES Jul 2002 5 Baa3 Ba1 1,460.048 BROWNING FERRIS IND INC Jul 1999 6 Baa1 Ba3 1,450.049 ROGERS CANTEL INC. Jul 2002 4 Baa3 Ba3 1,375.450 GOODYEAR TIRE & RUBBER Jun 2002 4 Baa3 Ba1 1,350.0
87,634
Total 444 182,482.6
Moody's Quality
Credit Risk Management is Critical to PerformanceCredit Risk Management is Critical to Performance

16
High Yield Corporates: Index Returns and Default Rates
(From 1980 through September 30, 2002)
High Yield Corporates: Index Returns and Default Rates
(From 1980 through September 30, 2002)
-7.63%-20.0%
-10.0%
0.0%
10.0%
20.0%
30.0%
40.0%
50.0%
1980
1981
1982
1983
1984
1985
1986
1987
1988
1989
1990
1991
1992
1993
1994
1995
1996
1997
1998
1999
2000
2001
2002
YTD
*
Ret
urn
0%
2%
4%
6%
8%
10%
12%
Def
ault
Rat
e
High Yield Index Default Rate
-7.63%-20.0%
-10.0%
0.0%
10.0%
20.0%
30.0%
40.0%
50.0%
1980
1981
1982
1983
1984
1985
1986
1987
1988
1989
1990
1991
1992
1993
1994
1995
1996
1997
1998
1999
2000
2001
2002
YTD
*
Ret
urn
0%
2%
4%
6%
8%
10%
12%
Def
ault
Rat
e
High Yield Index Default Rate
Source: Lehman High Yield Index 1983-2002, * -7.63% Return is YTD through September 30, 2002, Credit Suisse First Boston (CSFB) Returns for 1980-1982, Moody’s Default Rates 1983-2002, *9.2% Default Rate is for annual period from October 2001- September 2002
Most years of peak default rates or following year are also years of high returns: 1982, 1986, 1991 and 1995

17
High Yield Spreads By Credit Quality(From January 31, 1990 Through September 30, 2002)High Yield Spreads By Credit Quality(From January 31, 1990 Through September 30, 2002)
Source: Credit Suisse First Boston (CSFB)Source: Credit Suisse First Boston (CSFB)
680968
2,376
0
1,000
2,000
3,000
4,000
1/31/199
0
7/31/199
0
1/31/199
1
7/31/199
1
1/31/199
2
7/31/199
2
1/31/199
3
7/31/199
3
1/31/199
4
7/31/199
4
1/31/199
5
7/31/199
5
1/31/199
6
7/31/199
6
1/31/199
7
7/31/199
7
1/31/199
8
7/31/199
8
1/31/199
9
7/31/199
9
1/31/200
0
7/31/200
0
1/31/200
1
7/31/200
1
1/31/200
2
7/31/200
2
Nom
inal
Spr
ead
(in b
ps)
BB B CCC

18
Paradigm Shift in Fallen AngelsParadigm Shift in Fallen Angels• Over 20% of the Lehman High Yield Index is now
comprised of former investment grade credits.• Returns fell more rapidly than ever in 2001-2002,
so the punishment for owning a distressed credit was severe.
• Good credit defense and index-like performance made for great performance
• Over 20% of the Lehman High Yield Index is now comprised of former investment grade credits.
• Returns fell more rapidly than ever in 2001-2002, so the punishment for owning a distressed credit was severe.
• Good credit defense and index-like performance made for great performance

19
Losses in Investment Grade Bonds Occur in Months Prior to DowngradesLosses in Investment Grade Bonds Occur in Months Prior to Downgrades
• Loss of value due to a downgrade occurs over a few prior months. Depending on the initial credit quality losses could stretch over 2 months for AAA-AA and up to 8 months for BAA
• The variability of the magnitude of the loss (i.e., Standard deviation) is very significant
Average Monthly Underperformance Due to Downgrade8/88 – 12/01
Source: Lehman

20
# distressed 24-month “Vintage Year” issues excess return vs. UST
1990 50 28.28% 1991 14 40.94%
...1998 29 19.33%1999 10 10.69% 2000 139 8.35% Years prior 2001 250 16.56% --------------------------------------------------------2001 54 -23.08%YTD Jun 2002 68 -24.21% Years since 2001 122 -23.71%
All Years 372 3.35%
Source: Lehman
Subsequent Excess Returns (vs. UST) of investment-grade bonds after distress**
Since 2001 Long Term Relative* Performance Subsequent to Distress was Negative for Investment Grade Bonds
Since 2001 Long Term Relative* Performance Subsequent to Distress was Negative for Investment Grade Bonds
Consistently positive excess returns subsequent to distress before 2001---------------------Since 2001 long horizon excess returns for distressed bonds have been negative because of the credit recession resulting from a liquidity crisis
* Relative to Treasuries
** Lehman defines a distressed investment-grade bond as… Rated Baa3 or higher; Fixed coupon; OAS to US Treasuries of 400bp or more; and Dollar price <80% of par.

21
Absolute vs. Relative Risk: A DebateAbsolute vs. Relative Risk: A Debate• A desire to limit absolute risk has led to increased
tracking error for credit defensive players that have limited issuer exposures.
• Index issuer considerations– Should indices represent the active investable universe of the few active
issues available? – Or should index providers keep large numbers of illiquid issues?– Should indices caps the max percentage for an individual issuer?
• Should limits be placed on the amount outstanding for currently dominant credits? – Fallen Angels comprise over 20% of Lehman High Yield Index
• A desire to limit absolute risk has led to increased tracking error for credit defensive players that have limited issuer exposures.
• Index issuer considerations– Should indices represent the active investable universe of the few active
issues available? – Or should index providers keep large numbers of illiquid issues?– Should indices caps the max percentage for an individual issuer?
• Should limits be placed on the amount outstanding for currently dominant credits? – Fallen Angels comprise over 20% of Lehman High Yield Index

22
Risk LimitsRisk Limits
• Divide investment grade corporates into groups by quality (AAA, AA, A, BBB), by sectors (or even subsectors), and by duration (0–2, 3-5, 6–10, 10+)
• High yield: diversify, diversify, diversify• Classic: Establish limits by groups and by specific
issuers overall• Contemporary: Use a combination of tracking error and
absolute limits

23
Quantitative Credit Risk MetricsQuantitative Credit Risk MetricsSpread• OAS• OAS volatility• Spread duration• Swap spread duration• Return• Excess return• Variance/Covariance of Spreads
or Excess Returns• Integrates well with Market Risk• Spreads can be difficult to
measure during periods of illiquidity
Spread• OAS• OAS volatility• Spread duration• Swap spread duration• Return• Excess return• Variance/Covariance of Spreads
or Excess Returns• Integrates well with Market Risk• Spreads can be difficult to
measure during periods of illiquidity
Default• CDS• CDS volatility• Default Probability • Loss Frequency• Loss Given Default• Transition Probability Matrix• Variance/Covariance of
Spreads• Credit VaR• Difficult to estimate during
periods of sparse defaults
Default• CDS• CDS volatility• Default Probability • Loss Frequency• Loss Given Default• Transition Probability Matrix• Variance/Covariance of
Spreads• Credit VaR• Difficult to estimate during
periods of sparse defaults

24
Quantititative Credit MeasuresQuantititative Credit Measures• Moody’s KMV EDFs • Moody’s RiskCalc PDs• CreditSights’ BondScore CREs• CSFB CreditRisk+• McKinsey CrPortView• RiskMetrics CreditMetrics/CreditGrades• Standard & Poor’s
• Moody’s KMV EDFs • Moody’s RiskCalc PDs• CreditSights’ BondScore CREs• CSFB CreditRisk+• McKinsey CrPortView• RiskMetrics CreditMetrics/CreditGrades• Standard & Poor’s

25
Model ComparisonModel Comparison

26
Model ComparisonModel Comparison

27
Quantititative Diversification ProductsQuantititative Diversification Products
Default related• Moody’s KMV• CreditGrades• Gifford Fong Associates
Spread/Return based• Lehman POINT• Barra TotalRisk
Default related• Moody’s KMV• CreditGrades• Gifford Fong Associates
Spread/Return based• Lehman POINT• Barra TotalRisk

28
Credit Risk Diversification by Sector and RatingCredit Risk Diversification by Sector and Rating
• Credit diversification across sectors can reduce portfolio volatility from concentration risk for credits that have a higher probability of becoming distressed or can experience higher volatility - thus reducing the standard deviation of returns
• Systematic vs. Idiosyncratic Risk• Contagion risk has hammered certain sectors where there have
been considerable bankruptcy filings and “fallen angels”; these sectors are slowly becoming more attractive
• Historically fixed income has a low probability of loss of principal• Credit differences result in diversification benefits
– Financial– Industrial– Telecom– Energy

29
Credit Diversification Downgrade Risk vs. Other Non-Systematic Risk
Credit Diversification Downgrade Risk vs. Other Non-Systematic Risk
• Downgrade only idiosyncratic size ratio for different ratings: Aa-Aaa:A:Baa = 9:4:1– Downgrade diversify requires 9 times more low grade Baa to high grade Aaa
• Idiosyncratic risk as stable-rated bonds experience “natural” spread volatility• Total idiosyncratic risk less differentiated by quality than downgrade risk alone
as indicated by size ratio for different quality ratings: Aa-Aaa:A:Baa = 4:3:1– Diversification of total idiosyncratic risk requires only 4 times as many Baa credit to Aaa credits
From ObservedPerformance of
Downgraded Bonds
DowngradeRisk
Other Non-Systematic Risk
Total Non-Systematic Risk
Aaa – Aa 73 141 159
A 168 165 236
Baa 622 231 664
Position Size Ratio 9:4:1 4:3:1
Source: Lehman, Lev Dynkin Aug 14, 2002, PRMIA New Frontiers in Credit Risk)
30
Diversification BalanceDiversification Balance
• Balance minimizing tracking error vs. maximizing return or risk adjusted return
• Too much diversification costs performance– Decreases security selection return from purchase of
cheaper bonds
• Balance minimizing tracking error vs. maximizing return or risk adjusted return
• Too much diversification costs performance– Decreases security selection return from purchase of
cheaper bonds
31
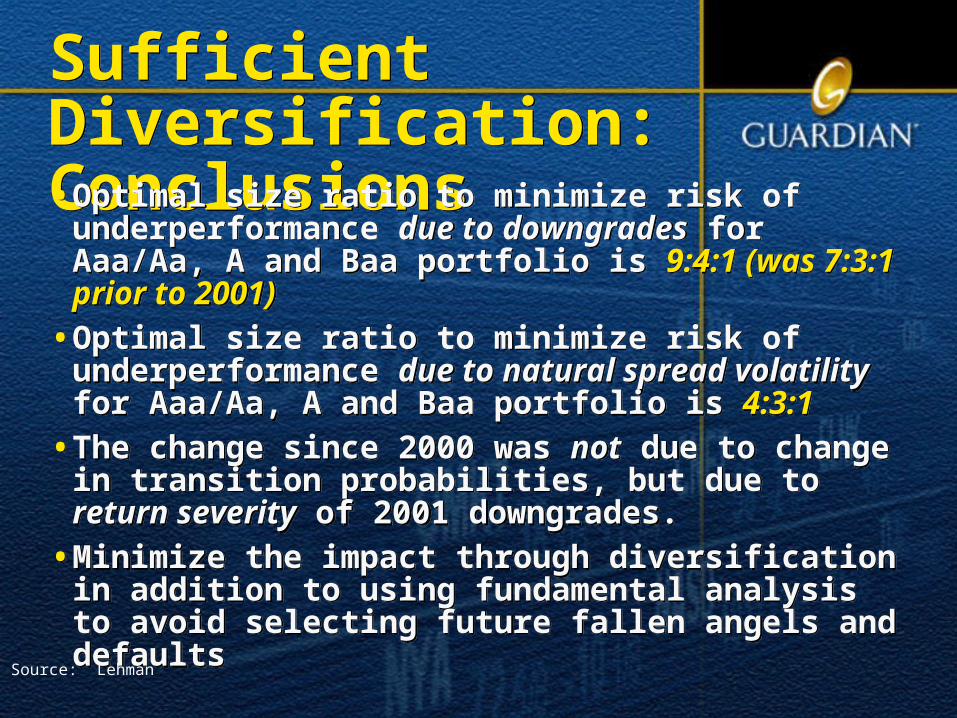
Sufficient Diversification: ConclusionsSufficient Diversification: Conclusions• Optimal size ratio to minimize risk of underperformance due to
downgrades for Aaa/Aa, A and Baa portfolio is 9:4:1 (was 7:3:1 prior to 2001)
• Optimal size ratio to minimize risk of underperformance due to natural spread volatility for Aaa/Aa, A and Baa portfolio is 4:3:1
• The change since 2000 was not due to change in transition probabilities, but due to return severity of 2001 downgrades.
• Minimize the impact through diversification in addition to using fundamental analysis to avoid selecting future fallen angels and defaults
• Optimal size ratio to minimize risk of underperformance due to downgrades for Aaa/Aa, A and Baa portfolio is 9:4:1 (was 7:3:1 prior to 2001)
• Optimal size ratio to minimize risk of underperformance due to natural spread volatility for Aaa/Aa, A and Baa portfolio is 4:3:1
• The change since 2000 was not due to change in transition probabilities, but due to return severity of 2001 downgrades.
• Minimize the impact through diversification in addition to using fundamental analysis to avoid selecting future fallen angels and defaults
Source: Lehman

32
Conclusions: Risk Management Oriented Portfolio Construction Process
Conclusions: Risk Management Oriented Portfolio Construction Process
• Balance fundamental credit analysis with quantitative measures, relative and defensive credit alerts
• Monitor absolute and relative issuer exposure, duration, convexity, spread duration and yield curve exposure
• Identify many small selective risks via security level spread, portfolio scenario and tracking error analyses
• Credit defense: Monitor changes using leading indicators like CDS data and Credit Risk default models like Ed Altman’s Z-score, Merton/Moody’s KMV or hybrids like CreditSights’ BondScore