credit exposure measurement fixed income & fx derivatives · 2015-01-10 · this methodology...
TRANSCRIPT

1
© P
hili
p S
ym
es,
2006
Credit Exposure MeasurementFixed Income & FX Derivatives
Dr Philip Symes

2
© P
hili
p S
ym
es,
2006
1. Introduction
Fixed Income Derivatives Exposure Simulation.
This methodology may be used for fixed income and FX derivatives.
This is Monte-Carlo based calculation as detailed (for general approach see MC For Finance presentation).
Calculates portfolio exposure and credit income deferral.

3
© P
hili
p S
ym
es,
2006
2. Contents
Generating Market Rate Scenarios.
Generating Foreign Exchange Scenarios.
Revaluation and Decomposition of Customer's Portfolio.
Interpolation Methodology.
Monte Carlo Simulations.
Credit Income Deferral for Derivatives based on Expected Exposure.

4
© P
hili
p S
ym
es,
2006
3. Generating IR Scenarios
Zero curves used for:– 1, 3 and 6 months;– 1, 2, 3, 4, 5, 7, 10, 15 and 30 years.
Three Basic Movements (BM) for interest rates:– Parallel shift (PS);– Steepening (ST);– Curvature (CU).
These can be shifted by ±1.645, ±0.8225 or 0 (PS only). Mean reversion based on Vasicek model. Diverges from √t behaviour.

5
© P
hili
p S
ym
es,
2006
4. Generating IR Scenarios (cont.)
rs=rt×e[ lPS⋅x PSlST⋅xSTlCU⋅xCU ]⋅c⋅22 1−e
−2 f261
¿
zero rate with maturity i under scenario s at point m
zero rate with maturity i today
factor loadings for BM (weekly)
contribution of BM to S: up, down or none
customer specific factor, 1 (by default) or greater
GROWTH FACTOR α is mean reversion speed (0.4576), κ is IR volatility scaling (1.6) and f is offset from m (weekdays)
6
© P
hili
p S
ym
es,
2006
5. Scaling Basic Movements
BM's account for 95% of variance in historical rates:– BM's are scaled to account for 100%.
Factor loadings are taken from 4 years of data (200 rates):– Weekly: taken at COB every Wed;– Correlated using eigenvalues of a covariance matrix.

7
© P
hili
p S
ym
es,
2006
6. Estimating Factor Loadings
Rc=[ ln∣r21, c
r11, c∣ ⋯ ln∣
r2m,c
r1m,c∣
⋮ ⋱ ⋮
ln∣rT1, c
rT−11, c ∣ ⋯ ln∣
rTm,c
rT−1 m ,c ∣]
correlation matrix
T is most recent
historical zero rate on date t with maturity i for currency c
∑=1
T−1Rc T×Rc covariance matrix
Factor loadings lBM come from the eigenvalues of the covariance matrix Σ

8
© P
hili
p S
ym
es,
2006
7. Generating FX Scenarios
Calculate FX scenarios as IR scenarios.
F=[ ln∣ f 21
f 11∣ ⋯ ln∣
f 2c
f 1c∣
⋮ ⋱ ⋮
ln∣f T1
f T−11 ∣ ⋯ ln∣
f Tc
f T−1c ∣]
histc = 52
T−1ln∣ f c T∣⋅ln∣ f c∣
historical FX volatility matrix
historical FX rate of currency c against credit line currency (CLC)
historical volatility of c w.r.t. CLC

9
© P
hili
p S
ym
es,
2006
7. Generating FX Scenarios
14 major currencies can be used as CLC. Other currencies classified as non-major short term
stable (NMSTS) or non-major snap (NMS). Table shows how different currencies are treated
depending on appreciation factor Xc:
Snap factor of 30% allows instantaneous depreciation.
FX Scenario Major NMSTS NMS
Historical volatility High volatility (2)Historical volatility
Depreciation, Xc<0<1 year: historical volatility; >1 year: high volatility (1)
Appreciation, Xc>0

10
© P
hili
p S
ym
es,
2006
7. Generating FX Scenarios
Historical simulation scenarios:
High volatility (1) – NMSTS:
High volatility (2) – NMS (with 30% snap factor):
S=F cexchist
c /261
S=F cex c hist
c 2highc 2
261−1
FX scenario
number of working days
appreciation of c w.r.t. CLC
S=F c˙min[0.7, exchigh
c /261]

11
© P
hili
p S
ym
es,
2006
7. Generating FX Scenarios (cont)
Collateralised transactions have the FX risk of the collateral added as a perturbation– This takes the same form as the historical scenario.
The model requires daily (10 day) or monthly (32 day)
margining with extra time for close-out.
Historical FX rates are normalised and correlated in the same way as the IR– The factor values are calculated for each BM based
on weekly, uncorrected factor loadings. Cholesky decomposition is used to create random
variables with this correlation.

12
© P
hili
p S
ym
es,
2006
8. Revaluation of Customer Portfolios
Revaluation under extreme IR scenarios. FIDES model can handle:
– 1+ legs from a trade;– Using yield curve to discount cash flows;– Margining during close-out periods (2+ weeks);– Change of zero curve over close-out;– Decomposition of trade legs (net and non-nettable).

13
© P
hili
p S
ym
es,
2006
8. Revaluation of Customer Portfolios
Aggregation of nettable trade legs:
– 8 extra MTM values required to calculate Δ;– These are 95% CL shifts of BM;– Instantaneous: not necessary to calculate non-
perturbed scenario over close-out period.
Distinctions between non-nettable transactions:– IR (nettable) and FX (non-net) trades;– FX trades cannot be aggregated.

14
© P
hili
p S
ym
es,
2006
9. Mutual Puts
“Mutual put” means that either party can unwind the transaction.
Counterparties are considered either “Pro” (MT friendly) and “non-pro”.
First upcoming mutual put is tenor reducing if transaction is collateralised or CP is a pro;
Mutual puts are treated as mandatory puts (obligation to surrender the security) in the system;
Cashflows are nettable only up to first mutual put date.

15
© P
hili
p S
ym
es,
2006
10. Interpolation Methodology
3 BM's described as 9 scenarios:– 4 PS scenarios (includes half up/down); – 2 for CU and ST;– No change scenario.
Correlated random variables of values from these scenarios held in column vector X.
MTM values are interpolated for each sub-portfolio:
M X=∑BM
M XM MTM value under scenario X
change in MTM value under different BM's
original MTM value

16
© P
hili
p S
ym
es,
2006
10. Interpolation Methodology
Interpolation for PS (4 scenarios):
M cmtX =2
u A−xPSc
u95M A2
uBxPSc
u95M B−M 0
no change MTM value
scenario MTM values: MA=↓,½↓,0,½↑MB=½↓,0,½↑,↑
95% movement: 1.645
scenario movement:uA=-½u95,0,½u95,u95
uA=u95,½u95,0,-½u95
random variable between ±½u95

17
© P
hili
p S
ym
es,
2006
10. Interpolation Methodology
Interpolation for ST & CU:
M cmtX = xBMcu ˙M−M 0
random variable +ve or -ve
scenario MTM value: M=↓ or ↑ scenario movement:
u=-u95 or u95

18
© P
hili
p S
ym
es,
2006
11. Interpolation Assumptions
Interpolation methodology assumes linearity:– Method checks monotonic behaviour; – Checks whether MTM values M↓≤M≤M↑ or M↓≥M≥M↑
for ST & CU and PS;– Warns if this is not the case.
Method checks accuracy of interpolated MTM values:– Checks are made per BM;– For ST & CU use average M value;– For PS have 3 formulae to include half movements;– Must be accurate to 25% threshold.

19
© P
hili
p S
ym
es,
2006
12. Monte Carlo Simulation
For one market rate scenario:– FIDES needs 1 random no. set per MC iteration (X);– Produces 75 non-negative MTM values;– An additional set is needed for collateralised
exposures (Y);– Y may have fewer elements than X.
Non-collateralised exposures easily calculated.
EcnX=∑
c−1
C
M cmnX F cm
X exposure
measuring point
netting agreement

20
© P
hili
p S
ym
es,
2006
13. Monte Carlo Simulation (cont)
Collateralised portfolios based on elements of x and y from now to m (measuring point);
– Calculate change in My; – Interpolate as described before.
Calculate change in exposure, Δxy:
– Converted to CLC;– Boundary conditions applied based on threshold and
minimum transfer amounts;– Limits on customers calling collateral.
cnxy=[M xM xy ] F y
c
FC−M x

21
© P
hili
p S
ym
es,
2006
13. Monte Carlo Simulation (cont)
Total exposure is given by:
Customer exposure profile Exy calculated from portfolio exposures:
– Use all nettings in same agreement;– Use 5,000 MC iterations.
Emx=∑
t[max 0,M cmt
x ]
Empxy=∑
nmax 0,Emn
x Emnxy Em
x

22
© P
hili
p S
ym
es,
2006
13. Monte Carlo Simulation (cont)
Can calculate expected exposure profile:– Use customer exposure profile.
Can calculate peak exposure profile:
– Peak is at 95th percentile: used for OBSI exposure.
⟨Emp⟩=
1S∑S E sm
p
Epeak mp =P95{ESM
p }S 95%-ile
customer
simulation run, s
from customer exposure profile
23
© P
hili
p S
ym
es,
2006
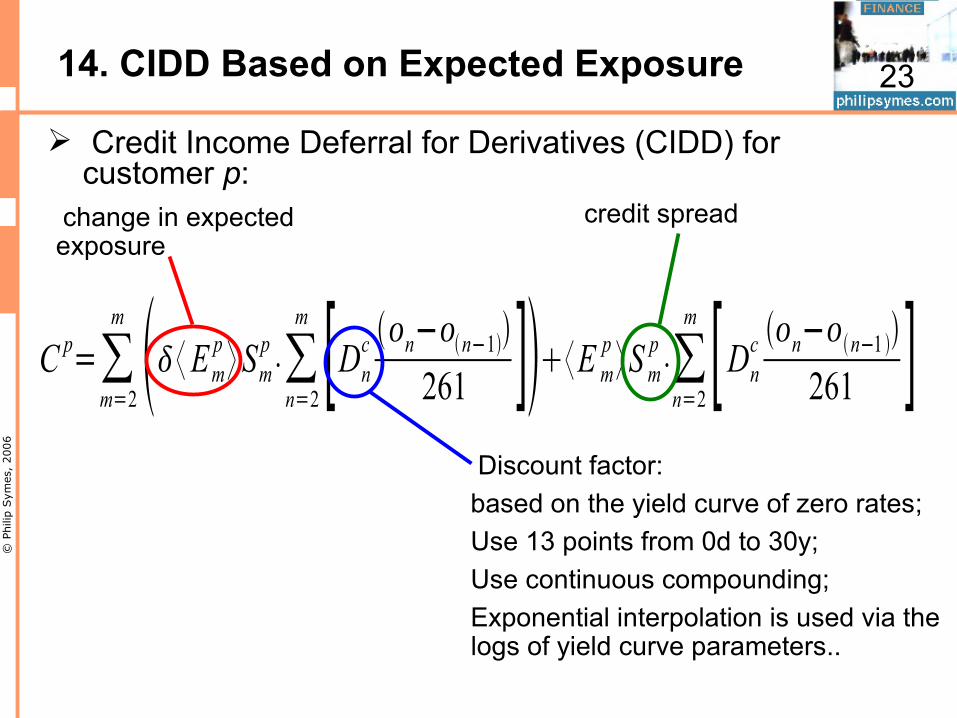
14. CIDD Based on Expected Exposure
Credit Income Deferral for Derivatives (CIDD) for customer p:
C p=∑m=2
m ⟨Emp ⟩ Smp ˙∑n=2m [Dnc n−n−1
261 ]⟨E mp ⟩Sm
p
˙∑n=2m [Dnc n−n−1
261 ] change in expected exposure
Discount factor: based on the yield curve of zero rates;Use 13 points from 0d to 30y; Use continuous compounding; Exponential interpolation is used via the logs of yield curve parameters..
credit spread

24
© P
hili
p S
ym
es,
2006
14. CIDD Based on Expected Exposure
ThereforeC = -2-2+9-8+20+6+7 = 28 Note that positive
changes in <E> reduce CCID.
There is an extra movement at the last point (i.e. 7).
Year 1 Year 2 Year 3 Year 4 Year 5 Year 6 Year 70
0.51
1.52
2.53
3.54
4.55
5.56
6.57
CCID Example
M
<E>
Example has m=7 years with exposures of 3,5,7,4,6,2,1. CIDD is the product of S (S=1 here), δ<E> and m. Using the equation given, the CCID is given by:[-2*1*1]+[-2*1*2]+[3*1*1]+[-2*1*4]+[4*1*5]+[1*1*6]+[1*1*7]

25
© P
hili
p S
ym
es,
2006
15. Summary
FIDES uses MC to calculate credit exposure.
The main elements of this are described in this presentation:
– Scenario generation;– Correlations;– Revaluations;– Interpolations.
Exposure profiles are then made on portfolio and client level:
– The client's CIDD is calculated.