creation of effective organization metrics
TRANSCRIPT

8/3/2019 Creation of Effective Organization Metrics
http://slidepdf.com/reader/full/creation-of-effective-organization-metrics 1/8
Quality Month (Nov~Dec 2011)
Creation of Effective Organizational Metrics that Lead to the 3 Rs of Business
Abstract Organizations are using Key Performance Indicators (KPIs) as financial and non- financial
measures or metrics that help them define and evaluate their progress towards long-term goals.
A key word in this description is "goals." Metrics that focus on performance to goals are subjectto being changed over time as objectives change and are also dependent upon management opinions
at some point in time.
This system, will center efforts on first creating an effective long-lasting, value-chainfunctional, „non-siloed‟ measurement system that has predictive metrics. This system, when
integrated with strategic planning and business improvement efforts, can help organizations movetoward achievement of the 3 Rs of business; i.e., everyone doing the Right things, and doing themRight, at the Right time.
Parameters for a Good Metric Measurements need to be management‟s eyes to the process, which stimulate the most appropriate
behavior. Measurements need to provide an unbiased process performance assessment that leads to
the 3 Rs of business.When process output performance is not accurately seen and reported relative to a desired resultthere is not much hope for making improvements. Generic measures for any process are quality, cost
and delivery. Most processes need a balanced measurement set to prevent optimizing one metric athe expense of overall process health. Metrics can also drive the wrong behavior if conducted in isolation
from the overall enterprise needs. When appropriate, the addition of a people-effectiveness measureassures balance between task and people management.
Good metrics provide decision-making insight that leads into the most appropriate conclusion
and action or non-action. The objective is the creation of an entity that is measurable, auditable, sustainableand consistent. Effective and reliable metrics require the following characteristics:
•
Business alignment:
Metrics consume resources for both data collection and analyses.Metrics need to provide insight to business performance, its issues, and its needs. Metrics surrounding
your business alignment can be found by looking at your value chain.
• Honest assessment: Creating metrics so that the performance of someone or an organization will appeargood has no value and can be detrimental to the organization. Metrics need to be able to provide an
honest assessment, whether good, bad, or ugly.
• Consistency: Identified components in any metric need to be defined at the outset and remain constantCriteria and calculations need to be consistent with respect to time.

8/3/2019 Creation of Effective Organization Metrics
http://slidepdf.com/reader/full/creation-of-effective-organization-metrics 2/8
Quality Month (Nov~Dec 2011)
• Repeatability and reproducibility: Measurements should have little or no subjectivity. We would likea recorded measurement response to have little or no dependence on who and when someone recorded
the response. • Actionability: Often measures are created for the sake of measuring, without any thought as to what
would be done if the metric were lower or higher. Include only those metrics that you will act on; that is,
either remove a degradation problem or hold the gain. When the metrics response is unsatisfactoryorganizations need to be prepared to conduct root-cause analysis and corrective or preventive actions.
• Time-series tracking: Metrics should be captured in time-series format, not as a snapshot of a point-in-time activity. Time-series tracking can describe trends and separate special-cause from common-cause
variability in predictable processes.
• Predictability: A predictability statement should be made when time-series tracking indicates that a
process is predictable.
• Peer comparability: In addition to internal performance measurements, benefits are achieved when
comparisons can be made between peer groups in another business or company. A good peercomparison provides additional analysis opportunities, which can identify improvemenpossibilities.
Metric utilization requires commitment and resource allotments; hence, it is important to do it right.
When organizations strive to become more metric driven, it is important to avoid „metric-design‟ and
„ metric-usage‟ errors. Common mistakes include the following:
• Creating metrics for the sake of metrics. Lloyd S. Nelson, director of Statistical Methods for the NashuaCorporation, stated, “the most important figures needed for management of any organization areunknown or unknowable.”
• Formulating too many metrics, resulting in no actions.
• Lacking metric follow-up.
• Describing metrics that do not result in the intended action.• Creating metrics that can have subjective manipulation.
If not exercised effectively, metrics can become a dark force where good energy is absorbed by bad stuff – a black hole where good resources are lost.

8/3/2019 Creation of Effective Organization Metrics
http://slidepdf.com/reader/full/creation-of-effective-organization-metrics 3/8
Quality Month (Nov~Dec 2011)
Creating Good Metrics Many current corporate practices/policies lead to the establishment of measurements and their reporting,
which is inconsistent with the above good-metric criteria. Organizations can achieve significant benefitsand reduce much wasted efforts if they have a process for metric creation so that the above good-metric
attributes are achieved.
To achieve the above objectives :
• Companies need to establish long-lasting metrics that originate from an assessment of whameasurements provide the most appropriate quantification of organizational value chain functiona
outputs in the area of cost, quality, and time.
• These metrics need to maintain basic continuity over time and be fundamentally independent fromchanges in leadership, strategies, and organizational structure.
• Metrics need to be reported in a format so that they can provide predictive statements when there is a
recent region of stability.• Metrics need to have peer-to-peer comparability. That is, one person does not provide a process
response output using a pie chart while another uses a stacked bar chart, noting that these forms ofreporting provide no process stability and predictive statements.
• The organization chart needs to be subordinate to the functional value chain created metrics.
When there is an organizational change, metric ownership can change but the basic
organizational metric structure and reporting format maintains consistency. • The metrics from a corporate value chain can be drilled down throughout the organization.
• Y =F( x); i.e., the output of a process is a function of the process‟ inputs and its steps. Dr. Lloyd S.Nelson stated, "If you can improve productivity, or sales, or quality, or anything else, by 5 percent
next year without a rational plan for improvement, then why were you not doing it last year?" The
simple setting of goals for metrics does not make it happen; this could be considered management byhope. Organizations need to have a system to analyze their metrics collectively so that they can
establish goals for value chain functional, operational, predicatively-reported metrics, which are mos
important to the business relative to meeting its financial satellite-level reported metric goals.
• Process improvement goals for value-chain functional metrics are to be established from an analytical-enterprise assessment of the business as a whole, evaluating, among other things, business constraints
e.g., focus on marketing and sales metric improvement, if the organization has excessive capacityand there is a financial goal to grow the business.
• Include value-chain-predictive metrics assessment when blending analytics with innovation todetermine strategies that lead to targeted projects for financial goal achievement. These targetedstrategies would then lead to functional value-chain metric improvement goals and
improvement/design projects that, when completed, truly impact the financial goals of the business aa whole. With this system, value-chain-metric improvement goals pull for projects that are mos
beneficial for the business in its entirety, which is in contrast to traditional push-for-project-creationsystem.

8/3/2019 Creation of Effective Organization Metrics
http://slidepdf.com/reader/full/creation-of-effective-organization-metrics 4/8
Quality Month (Nov~Dec 2011)
Value Chain and its Long-lasting, Business-systemBenefits
In many businesses today, the enterprise value chain is not viewed as a system of non-siloed processeswith performance measurements. Instead, organizations often report metrics in their area of the business
for how things are going every week, month, or quarter relative to goals. This form of goal-setting
reporting can lead to much firefighting and, in extreme cases, a meet- the-numbers-or-else culture that isfatal; e.g., Enron.
The value chain shown in Figure 1 describes what the enterprise does (rectangles in the figure) and
its performance measures of success (ovals in the figure), from a customer and business point of viewIn describing what the organization does, the center portion of the value chain can have procedural drill
downs with attached documents. Metrics for each of the functional steps are described within the
connected ovals.
With this described approach, the organization chart is subordinate to the value chain. In an enterprisethe value chain is long-lasting even through organization changes, where ownership of process functions
and metrics would change, when appropriate.

8/3/2019 Creation of Effective Organization Metrics
http://slidepdf.com/reader/full/creation-of-effective-organization-metrics 5/8
Quality Month (Nov~Dec 2011)
The value chain with its described function and its high-level 30,000-foot-level, operational metric and
satellite-level financial metrics is step 2 of an overall 9-step process, as shown in Figure 2, noting tha
strategy creation is step 5 in this overall process.
Let‟s now consider the metric portion of the value chain. With this approach, metrics are to have alignmen
to how the business is conducted. This is in contrast to creating metrics around the organization chart or
strategic plan objectives, where both can significantly change over time. It is important not only to
determine what should be measured but also to have a reporting methodology that is most beneficial tothe business as a whole.
Traditional Metric Reporting • Red-yellow-green scorecards can lead to resource-draining firefighting, where problem- identified
resolutions are often not long-lasting.
• Traditional metric reporting such as a table of numbers, stacked bar charts, and pie charts are notpredictive and have a similar decision-making view as to driving a car by only looking in the rearview mirror; i.e., an unhealthy behavior.
• Variance to metric goals can lead to playing games with the numbers and unhealthy behaviors.
• Improvement projects can lead to reported silo process improvement benefits, which do not positivelyimpact the big picture; e.g., we saved 100 million dollars but nobody can find the money.
•
The balanced scorecard alignment of metrics to strategies can lead to very subjective and unstablemetrics that are a function of leadership and economic/environmental changes.
Let‟s now examine how metrics are often traditionally reported. Traditional scorecards such as a table ofnumbers, stack bar chart, the balanced scorecard, and red-yellow-green report-outs as shown in Figure 3
describe what has occurred in the past for some time interval but do not make predictive statements.
Figure - 2

8/3/2019 Creation of Effective Organization Metrics
http://slidepdf.com/reader/full/creation-of-effective-organization-metrics 6/8
Quality Month (Nov~Dec 2011)
What an organization needs is predictive metric statements, which can be viewed collectively so that if
the predicted metric future performance is not what is desired for the organization as a whole, animprovement project can be created. This approach is in contrast to leadership brainstorming foprojects that someone is to work on.
Predictive Metrics
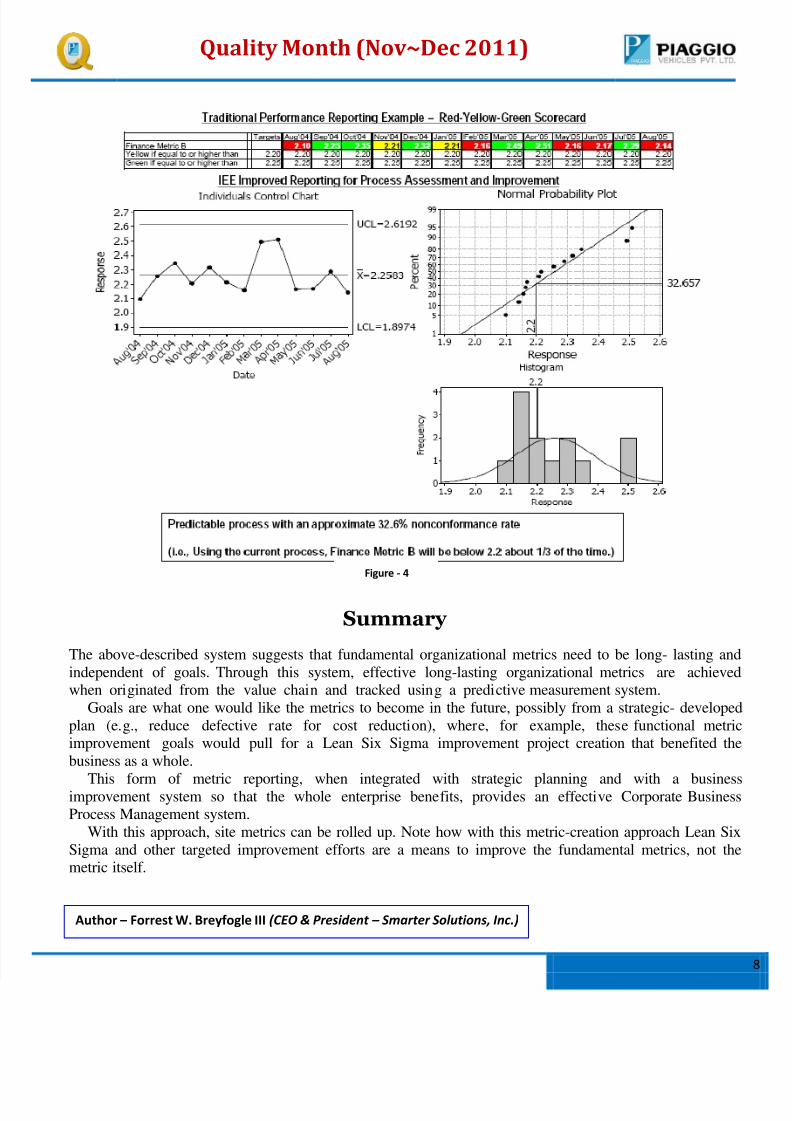
The red-yellow-green scorecard shown at the bottom of Figure 3 is from a corporation‟s actual
scorecard system. Let‟s now further examine this scorecard in Figure 4 where it is compared to a 30,000-
foot-level scorecard reporting system; i.e., where 30,000-foot-level is to represent a high- level-metric view,
like an airplane view of the earth.
This metric reporting system has two steps. The first step of this process is to analyze for predictability
The second step is the formulation of a prediction statement, when the process is considered predictable.
To determine predictability, the process is assessed for statistical stability using a 30,000-foot- leve
individuals control chart, which can detect if the process response has changed over time and is stable.When there is a current region of stability, data from this last region can be considered a random
sample of the future. For this example, note how the 30,000-foot-level control chart in Figure 4 indicates
Figure - 3

8/3/2019 Creation of Effective Organization Metrics
http://slidepdf.com/reader/full/creation-of-effective-organization-metrics 7/8
Quality Month (Nov~Dec 2011)
that nothing has changed, even though a traditional red-yellow-green scorecard showed the metricfrequently transitioned among red, yellow, and green. For the traditional scorecard, the performance leve
was red 5 out of the 13 recorded times.
Included in this figure is a probability plot that can be used to make a prediction statement. Much can be
learned about a process through a probability plot. Let‟s next examine some of these probability-plot-benefit characteristics.
The x-axis in this probability plot is the magnitude of a process response over the region of stabilit
while the y-axis is percent less than. A very important advantage of probability plotting is that da
do not need to be normally distributed for a prediction statement to be made. The y-axis scale dependent upon the distribution type; e.g., normal or log-normal distribution.
If the data on a probability closely follow a straight line, we act as though the data are from thedistribution that is represented by the probability plot coordinate system. Estimated populationpercentages below a specification limit can be made by simply examining the y-axis percentage value, as
shown in Figure 4. For this case, we estimate that about 33% of the time, now and in the future, we wilbe below our 2.2 specified criterion or goal.
There is a certain amount of technical training needed to create 30,000-foot-level metrics; however, the
interpretation of the chart is quite simple. In this reporting format, a box should be included below the chart
that makes a statement about the process. For this chart we can say that the process is predictable with an
approximate non-conformance rate of 32.8%. That is, using the current process, the metric response wil
be below the goal of 2.2 about 1/3 of the time.
As a business-management policy, red-yellow-green versus this form of reporting can lead to very
different behaviors. For this example, a red-yellow-green reporting policy would lead to fighting fires
about 33% of the time because every time the metric turned red, management would ask the questions“What just occurred? Why is our performance level now red?” while in actuality the process was
performing within its predictable bounds. Red-yellow-green scorecards can result in counter-productive
initiatives, 24/7 firefighting, the blame game, and proliferation of fanciful stories about why goals werenot met. In addition, these scorecards convey nothing about the future.
With this form of performance metric reporting, we gain the understanding that the variation in thisexample is from common-cause process variability and that the only way to improve performance is
through improving the process itself. With this system, someone would be assigned to work on
improving the process that is associated with this metric. This assumes that this metric improvement need is
where efforts should be made to improve business performance as a whole.
8/3/2019 Creation of Effective Organization Metrics
http://slidepdf.com/reader/full/creation-of-effective-organization-metrics 8/8
Quality Month (Nov~Dec 2011)
Summary The above-described system suggests that fundamental organizational metrics need to be long- lasting and
independent of goals. Through this system, effective long-lasting organizational metrics are achievedwhen originated from the value chain and tracked using a predictive measurement system.
Goals are what one would like the metrics to become in the future, possibly from a strategic- developed
plan (e.g., reduce defective rate for cost reduction), where, for example, these functional metricimprovement goals would pull for a Lean Six Sigma improvement project creation that benefited the
business as a whole.
This form of metric reporting, when integrated with strategic planning and with a businessimprovement system so that the whole enterprise benefits, provides an effective Corporate BusinessProcess Management system.
With this approach, site metrics can be rolled up. Note how with this metric-creation approach Lean Six
Sigma and other targeted improvement efforts are a means to improve the fundamental metrics, not themetric itself.
Figure - 4
Author – Forrest W. Breyfogle III (CEO & President – Smarter Solutions, Inc.)