creating value in a lower growth...
TRANSCRIPT

Creating Value in a Lower Growth EconomyTHE 2013 VALUE CREATORS REPORT AUSTRALIAN SUPPLEMENT

The Boston Consulting Group (BCG) is a global management consulting firm and the world’s leading advisor on business strategy. We partner with clients in all sectors and regions to identify their highest-value opportunities, address their most critical challenges, and transform their businesses. Our customised approach combines deep insight into the dynamics of companies and markets with close collaboration at all levels of the client organisation. This ensures that our clients achieve sustainable competitive advantage, build more capable organisations, and secure lasting results. Founded in 1963, BCG is a private company with 78 offices in 43 countries. For more information, please visit bcg.com

CREATING VALUE IN A LOWER GROWTH ECONOMY
THE 2013 VALUE CREATORS REPORT AUSTRALIAN SUPPLEMENT
October 2013| The Boston Consulting Group
NICHOLAS GLENNING
RAMESH KARNANI
GERRY HANSELL
ALAN WONG

2 | Creating Value in a Lower Growth Economy

The Boston Consulting Group | 3
CONTENTS
6 THE ROLE OF EXPECTATIONS IN THE MARKETReconciling Economic Performance and Market PerformanceA Return to Optimism? Tailoring your Strategy
14 PATHS TO VALUE CREATIONThe Growth-margin Trade-offWhere do I Start? Value Patterns and Value CreationREA Group: Discovering New Sources of Growth in AdjacenciesCSL: Managing Margins While Pursuing Growth in New FrontiersMonadelphous: Creating Demand Through Strong Customer RelationshipsImplications of Value Patterns for Executives
23 APPENDIX 1: ASX 200 MARKET CAPITALISATION BY INDUSTRY
24 APPENDIX 2: TSR PERFORMANCE BY INDUSTRY SECTOR
25 APPENDIX 3: ASX 200 TOP QUARTILE PERFORMERS
28 APPENDIX 4: METHODOLOGY AND SAMPLE

4 | Creating Value in a Lower Growth Economy
OVERVIEW
The Australian economy has emerged from recent crises with an air of cautious optimism. Yet despite the relatively favourable
conditions here, including good growth (3.1 percent over 2011–13) and a falling cash rate (currently 2.5 percent), our equities continue to lag global leaders.
In FY12-13, the ASX 200 provided a Total Shareholder Return (TSR) of 7.2 percent, lagging both the US S&P 500 at 12 percent, and Japan’s TOPIX.
This “great disconnect” between the economy and the market is a theme explored in The Boston Consulting Group’s (BCG) Global Value Creators Report 2013, “Unlocking New Sources of Value Creation”. In this local supplement, we put the spotlight on the Australian market to understand the drivers of growth and value creation and where the market and economy diverge.
In Australia, the driving force behind our “disconnect” appears to be the failure of the ASX 200 companies to meet investors’ expectations of their fundamentals. The reasons for this become evident when ana-lysing performance by industry.
Without doubt, some parts of the Australia markets have flourished this year, with record profits from banks and respectable returns from the large supermarket retailers. But it comes as no surprise that de-clines in the Mining/Materials industry, which accounts for almost one-third (31 percent) of the market, have hampered overall market expectations. Indeed, over the last two years the size of the industry—measured by market capitalisation—has shrunk dramatically, from being twice the size of Banks in 2011 to reaching parity in 2013. Fur-ther analysis shows that this pattern of diversity of performances ex-ists not only between industries, but within them. For example, the wide range in ROE within Mining/Materials reflects companies with very different starting points.
In a climate where attractive growth opportunities appear harder to come by, companies must still find ways to create sustainable value. The pathways they choose can be very different. While some compa-nies have aggressively pursued growth at the cost of margins, others have resigned themselves to a stable top-line while enforcing greater margin discipline. While the trade-offs between the two must be ac-knowledged, it is only with the right blend of growth and margins that shareholder value can be maximised.

The Boston Consulting Group | 5
To provide executives with another perspective on defining their com-pany’s strategy, we explore the concept of “value patterns”. Developed through research by BCG, value patterns identify how a company’s portfolio health, growth exposure, risk profile and valuation dynamics combine to define ten distinct “clusters” of company types. Compa-nies within each cluster come with specific “unlocks”, or strategic moves, that have been empirically shown to create value.
By applying this concept of value patterns to three Australian compa-nies, we provide an outside-in view of how they have successfully cre-ated sustainable value for their shareholders. Value patterns are not a one-size-fits-all playbook for companies. What they do offer is a differ-ent perspective based on what companies in similar positions have done, and what investors have empirically expected such companies to do. In a lower growth environment, this perspective may be crucial in navigating the trade-offs between growth and margins, and in turn defining a company’s path to creating sustainable value for sharehold-ers.

6 | Creating Value in a Lower Growth Economy
THE ROLE OF EXPECTATIONS IN THE MARKET
The Australian economy has emerged from recent crises with an air of cautious
optimism, as equity markets enjoy moderate returns. Yet despite the relatively favourable conditions here, our equities continue to lag global leaders. To understand why, it is first necessary to go beyond the headline numbers and identify what is happening at an indus-try, and in some cases, company, level.
Reconciling Economic Perfor-mance and Market PerformanceOver the last two years, the Australian econo-my has maintained GDP growth of 3.1 per-cent, surpassing the United States’ forecasted two-year growth rate of 2.3 percent despite similar levels of inflation (1.7–1.8 percent an-nually between 2011–13). Perhaps more im-portantly, the cash rate is at record lows, hav-
40
60
80
100
120
140
Jan 2013Jan 2012Jan 2011Jan 2010Jan 2009
Accumulation index(local currency, Jul 08–Jun 13)
% Five–year2 TSR
(FY09–13)
6.9 12.0
3.3 7.2
0.3 0.5
0.2 –7.1
–0.9 18.0
Crisis Consolidation Recovery
Japan (TOPIX)
Emerging markets
Europe (S&P EUR)
Australia (S&P ASX 200)
US (S&P 500)
%Two–year3 TSR
(FY12/13)
Source: Thomson Reuters Datastream; BCG analysis.1MSCI Emerging Markets Index. 201/07/2008 to 28/06/2013. 301/07/2011 to 28/06/2013.
Exhibit 1 | TSR Performance by CountryAustralian two-year TSR outperformed by US S&P 500 and Japan TOPIX

The Boston Consulting Group | 7
ing fallen a further 100 basis points since June last year. As the low cash rate has boost-ed share prices, many investors have turned to equities over interest-bearing assets.
Amid these positive signs of recovery, Austra-lia’s performance on the world stage still lags other large markets. While Australia has weathered the recent financial crises better than many of its counterparts, the ASX 200 provided a TSR of 7.2 percent over the FY12–13 period, lagging both the US S&P 500 at 12 percent, and Japan’s TOPIX at 18 percent (see Exhibit 1).
This “great disconnect” between the econo-my and the market is a theme explored in BCG’s Global Value Creators Report 2013, “Unlocking New Sources of Value Creation”. In this local supplement, we put the spotlight on the Australian market to understand the drivers of growth and value creation and where the market and economy diverge.
TSR is the sum of share appreciation and div-idend yield. This means the disparity be-tween economic performance and market performance can be explained in three ways. Either business fundamentals have failed to
meet expectations, and/or expectations on fu-ture earnings have fallen, and/or expectations on future cash flows are pessimistic.
With Australian GDP growth set to sit around 2.5 percent for the next year, the ASX 200’s forecast earnings per share (EPS) growth for FY13–14 is 15 percent—3 percentage points higher than the S&P 500. Given its average dividend yield is also 1.9 percentage points higher than the S&P 500, it appears that the driving force behind Australia’s “disconnect” is driven by the failure of the ASX 200 compa-nies to meet investors’ expectations of their fundamentals.
Recent evidence backs this up. In 2011, EPS growth for the ASX 200 was forecast at 15 percent growth between FY11–13. Revised forecasts have set this figure dramatically lower at -4 percent. In contrast, while the S&P 500’s revised forecast for the same peri-od also fell short—10 percent down from 14 percent—the gap is clearly much smaller. In these circumstances, companies in the S&P 500 have been rewarded while those in the ASX 200 companies have failed to capitalise on comparatively strong conditions in Austra-lia over the last two years.
0
50
100
150
200
250
Jan 2009 Jan 2013Jan 2012Jan 2011Jan 2010
Value of $100 invested in Aug 2008 (local currency)
Market value1
(AUD$b)
% Two–year2
TSR(2011–13)
353 21
108 16
93 17
85 –6
341 –18%
ASX 200 1,357 7%
Real estate
Consumer staples
Mining/materials
Energy
Banks
Source: Thomson Financial Datastream; S&P Capital IQ, BCG analysis. Note: Industries classified by GICS Sector groups, where the Financials Sector has been further broken into its Industry Group components. Consumer Staples includes Food & Drug Retailing and Food, Beverage & Tobacco.1As at 30/06/2013. 201/07/2011 to 28/06/2013.
Exhibit 2 | TSR Performance for the Largest 5 IndustriesClear divergence in industries as Mining/Materials continues decline and Banks outperform

8 | Creating Value in a Lower Growth Economy
Without doubt, some parts of the Australia markets have flourished, exceeding investor expectations. In particular, this year, banks have announced record profits and the large supermarket retailers have delivered respect-able returns. So what is driving the ASX 200’s sound, but not stellar, trajectory? The answer lies in disaggregating the market’s results by industry.
Exhibit 2 shows that Banks and Consumer Staples, which account for around one-third (34 percent) of the ASX 200 returned very healthy TSRs of 21 percent and 16 percent re-spectively over the last two years. While smaller in terms of market capitalisation, Telecommunications Services and Healthcare also performed admirably with two-year TSRs of 38 percent and 28 percent respective-ly (see Appendix 2). However, the picture was a very different one for Energy and Mining/Materials, which account for almost another third (31 percent) of the market. Their mar-ket capitalisation shrank dramatically, from being twice the size of Banks in 2011 to reaching parity in 2013, for the first time in a decade.
A Return to Optimism?At the heart of these relative industry perfor-mances is the interplay between a company’s fundamental value, and the value reflected by investor expectations. To better under-stand that interplay, BCG uses a proprietary valuation methodology to decompose the ASX 200’s market capitalisation into a mea-sure of “fundamental value” and an “expecta-tion premium”. Fundamental value is based on current financial performance and the as-sumption that growth rates and profitability will fade back to an industry average over time. Expectation premium is the difference between the company’s stock’s market capi-talisation and fundamental value (see Appen-dix 4).
A positive expectation premium signals that investors believe a company will outperform relative to a set of competitive and macroeco-nomic factors. Conversely, a negative expecta-tion premium indicates that growth in profits is expected to trail the rate implied by an in-dustry’s historical fade-to-average.
Since the sharp rise in investor pessimism last year, the market has rebounded back to a level just shy of historical levels (see Exhibit 3).
1.080.96
1.181.201.20
1.541.611.45
1.211.201.08
1.17
0.00
0.50
1.00
1.50
2.00Market value/fundamental value (ratio)
FY11
1.00
FY13EFY12FY10FY09FY08FY07FY06FY05FY04FY03FY02
PE ratio (30/06/13) 15.1x 13.8x 14.2x 13.9x 14.1x 16.4x 12.7x 14.3x 11.7x 12.2x 11.2x 13.6x
Market capitalisation ($b, 30/06/13)
627 576 697 927 1,246 1,501 1,392 1,122 1,290 1,441 1,241 1,357
Source: S&P Capital IQ, BCG Australian Market Database 2013.Note: Includes ASX 200 excluding Real Estate companies.
Exhibit 3 | Market Values and Fundamental Values over Time Rebound in market expectations, but still room to improve
The Boston Consulting Group | 9
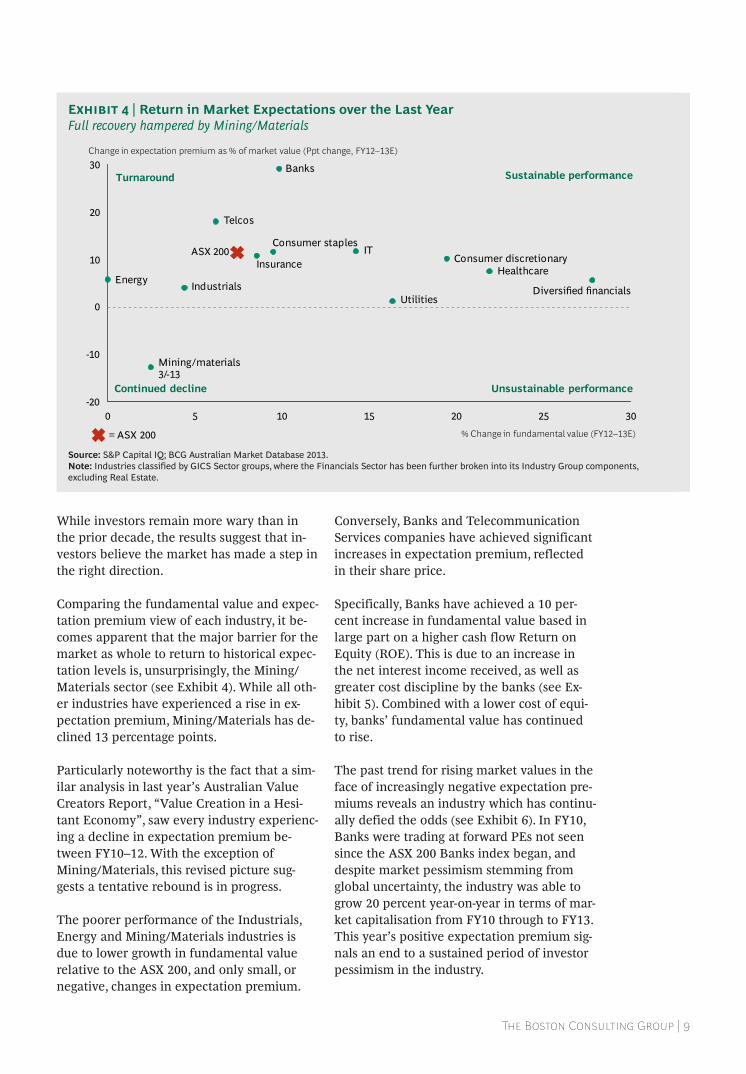
While investors remain more wary than in the prior decade, the results suggest that in-vestors believe the market has made a step in the right direction.
Comparing the fundamental value and expec-tation premium view of each industry, it be-comes apparent that the major barrier for the market as whole to return to historical expec-tation levels is, unsurprisingly, the Mining/Materials sector (see Exhibit 4). While all oth-er industries have experienced a rise in ex-pectation premium, Mining/Materials has de-clined 13 percentage points.
Particularly noteworthy is the fact that a sim-ilar analysis in last year’s Australian Value Creators Report, “Value Creation in a Hesi-tant Economy”, saw every industry experienc-ing a decline in expectation premium be-tween FY10–12. With the exception of Mining/Materials, this revised picture sug-gests a tentative rebound is in progress.
The poorer performance of the Industrials, Energy and Mining/Materials industries is due to lower growth in fundamental value relative to the ASX 200, and only small, or negative, changes in expectation premium.
Conversely, Banks and Telecommunication Services companies have achieved significant increases in expectation premium, reflected in their share price.
Specifically, Banks have achieved a 10 per-cent increase in fundamental value based in large part on a higher cash flow Return on Equity (ROE). This is due to an increase in the net interest income received, as well as greater cost discipline by the banks (see Ex-hibit 5). Combined with a lower cost of equi-ty, banks’ fundamental value has continued to rise.
The past trend for rising market values in the face of increasingly negative expectation pre-miums reveals an industry which has continu-ally defied the odds (see Exhibit 6). In FY10, Banks were trading at forward PEs not seen since the ASX 200 Banks index began, and despite market pessimism stemming from global uncertainty, the industry was able to grow 20 percent year-on-year in terms of mar-ket capitalisation from FY10 through to FY13. This year’s positive expectation premium sig-nals an end to a sustained period of investor pessimism in the industry.
-20
-10
0
10
20
30
0 5 10 15 20 25 30
Change in expectation premium as % of market value (Ppt change, FY12–13E)
Mining/materials
Insurance HealthcareIndustrials
Banks
Diversified financials
Telcos
Consumer discretionaryConsumer staples
IT
% Change in fundamental value (FY12–13E)
ASX 200
Utilities
Energy
3/-13
= ASX 200
Sustainable performance
Unsustainable performanceContinued decline
Turnaround
Source: S&P Capital IQ; BCG Australian Market Database 2013.Note: Industries classified by GICS Sector groups, where the Financials Sector has been further broken into its Industry Group components, excluding Real Estate.
Exhibit 4 | Return in Market Expectations over the Last YearFull recovery hampered by Mining/Materials

10 | Creating Value in a Lower Growth Economy
Decomposition of banks market capitalisation: fundamental value and expectation premium (FY08–13E)
400
300
200
100
0
–100
–29
FY09
202
211
–9
FY08
–73
FY11
309
–45
FY10
275
173
193
–20
Fundamental value
Expectation premium
(A$b)
FY13E
374
369
5
FY12
336
–12 –5 –12 –17 –28 1Banks expectation premium (% of market cap)
ASX 200 expectation premium (% of market cap)
218270 258
Market capitalisation
35 17 17 15 –4 8
Source: Thomson Reuters Datastream; BCG Australian Market Database 2013.Note: All values are in nominal terms. Exhibit based on weighted average data for all companies in sector. See Appendix for details. Market capitalisation shown is for financial year end.
Exhibit 6 | Positive Expectations in Banks after Sustained Pessimism
Net interest margin (%)
Provisions (A$b)
f
Cash flow ROE (%)1
Equity (A$b)
Fundamental (equity) value (A$b)
2.5
2.0
0.0
2.2
FY09 FY13E
2.2
FY12
2.1
FY11
2.2
FY10
2.2
FY08
2.1
19.420.619.715.2
21.3
9.710.710.711.4
20.4
9.4
06
12182430
FY13EFY12FY11FY10FY09
10.2
FY08Cost of EquityCash ROE
f
300
200
100
0
7%
FY13E
181
FY12
174
FY11
161
FY10
149
FY09
138
FY08
104
400
200
600
0
15% p.a.
FY12 FY13E
369336
FY11
309
FY10
275
FY09
211
FY08
193
Group cost to income ratio3 (%) 50
45
40
0FY13E
41.5
FY12FY08
46.243.0
FY09
43.143.1
FY10 FY11
42.0
15.0
10.0
5.0
0.0FY13E
6.10
FY12
6.67
FY11
5.50
FY10
8.56
FY09
13.25
FY08
6.56Lev. ratio2 0.52 0.47 0.48 0.45 0.44 0.44
Source: BCG Australian Market Database 2013.1Cash flow ROE includes the value of franking credits to shareholders. 2Leverage ratio is defined revenue/shareholder’s equity. 3Total expenses (excluding depreciation and amortisation)/total operating income
Exhibit 5 | Fundamental Value—Banks Increasing equity and falling cost of equity have led to sustained increases in fundamental value

The Boston Consulting Group | 11
That is not to say that Banks are without challenges. As credit growth falls faster than GDP and the implementation of Basel III in-creases the cost of capital and liquidity, Banks will need to closely scrutinise their cost base and maintain revenues by revising growth strategies and passing on some costs to con-sumers. While Banks have capitalised, in re-cent years, on a falling cash rate by passing on interest rate cuts more slowly since No-vember 2010, looking ahead, the cash rate is likely to increase as it reverts back to trend.
An industry with a markedly different growth story is Mining/Materials. This sector has seen a decline in cash flow Return on Invest-ment (ROI) driven by both decreasing cash margins and lower asset turns (see Exhibit 7). Although the decline has been offset to a de-gree by a fall in the cost of capital, fundamen-tal value has largely been propped up by con-tinued high levels of growth in gross investment. Considered together, these fac-tors suggest incremental investments in ca-pacity have yielded less productivity than in the past.
In Mining/Minerals, market capitalisation has fallen 20 percent year-on-year from FY11–13, fuelled entirely by deteriorating expectation premiums (see Exhibit 8). Looking back to FY08, over half of the value of these compa-nies was driven by high investor expectations that the industry would continue to defy the historical fade-to-average rate.
The current valuation of the Mining/Materials sector makes it clear that such opti-mism is no longer in force.
300
200
100
0
146
FY08
144
10%
FY13E
233
FY12
227
FY11
223
FY10
171
FY09
Cash margin (%)
Asset turns (x)
x
Cash flow ROI (%)1
Gross investment (A$b)
Fundamental (equity) value (A$b)
22.224.6
21.718.0
20.2 20.0
05
1015202530
FY13EFY12FY11FY10FY09FY08
20
15
10
0
9.6
8.5
FY13EFY12
8.8
11.8
FY11
9.9
15.5
FY10
10.1
12.9
FY09
10.3
11.4
FY08
11.1
14.8
WACCCFROI
f
1.0
0.5
0.0FY13E
0.49
FY12
0.54
FY11
0.64
FY10
0.61
FY09
0.64
FY08
0.74300
200
100
0
12%
FY13E
283
FY12
249
FY11
207
FY10
192
FY09
182
FY08
161
Source: BCG Australian Market Database 2013.Note: All Values are in nominal terms. Exhibit based on weighted average data for all companies in sector. FY13 figure is based on broker consensus forecasts where actual results are not yet available. See Appendix for details.1Cash flow ROI includes the value of franking credits to shareholders.
Exhibit 7 | Fundamental Value—Mining/MaterialsFundamental value has remained relatively flat for last three years despite increasing investment

12 | Creating Value in a Lower Growth Economy
% Return on equity, FY05–13 (weighted average)1
44
29
62
34
17 20
5562
2619
1117
61
30
15 14 14 13 12 12 11 8 8 7 6 2
22
8
–8–6
6 6
–46
–11–19
3 –2
–51–60
–40
–20
0
20
40
60
80
IT TelcosConsumdiscret Health'e Banks Insur'ce Indust'ls
Divers. finan'ls
Consumstaples Energy Utilities
Real estate
Mining/mater'ls
Market cap ($b, 30/6/13) 9 64 52 55 353 57 85 30 108 85 24 93 341
# companies 4 6 32 11 6 4 33 9 7 18 7 19 44
High
Low
Median
Source: S&P Capital IQ; BCG analysis.Note: Industry groupings based on GICS Sector groups, with the Financials Sector broken into its component Industry Groups (Banks, Diversified Financials, Insurance and Real Estate).1Calculated as the weighted annual Return on Equity (NPAT excluding non-recurring items divided by Total Equity) for all years where data is available.
Exhibit 9 | Returns within Industries Vary as much as Between Industries
Decomposition of banks market capitalisation: fundamental value and expectation premium (FY08–13E)
FY09FY08 FY11FY10
Fundamental value
Expectation premium
FY13EFY12
53 30 30 27 –5 –18Mining/materials expectationpremium (% of market cap)
ASX 200 expectation premium (% of market cap)
Market capitalisation
35 17 17 15 –4 8
200
300
100
0
400
–100
73207
146
62
233
–35
227
–11
223
83245
171
305
144
161
(A$b)
306
198216
Source: Thomson Reuters Datastream; BCG Australian Market Database 2013.Note: All values are in nominal terms. Exhibit based on weighted average data for all companies in sector. See Appendix for details. Market capitalisation shown is for financial year end, and has been adjusted to exclude dual-listed component of shares for BHPB and Rio Tinto.
Exhibit 8 | Expectations Continue Decline in Mining/Materials

The Boston Consulting Group | 13
Tailoring your StrategyWhile disaggregating the ASX 200 into com-ponent industries gives us better insight into the drivers of average performance, further analysis shows that this pattern of diversity exists not only between industries, but within them. For example, the wide range in ROE within Mining/Materials reflects companies with very different starting points, from a highly leveraged chemicals manufacturer at the upper end, through to resource compa-nies still in their exploration and evaluation phase at the lower end (see Exhibit 9).
The bigger issue for companies, no matter what industry they are in, or what particular formula of growth they have used to date, is how to move forward and chart a course to-wards value creation in a lower-growth con-text.
For companies currently winning favour from the markets, expectations represent a double edged sword. Unless these companies find ways to continue meet these expectations, de-spite slow economic conditions, they risk the ire of the markets. For companies at the other end of the scale—dominated by the resource companies mired in a low growth environ-ment—the priority is to identify a clear strat-egy to create value and then communicate and deliver it to restore investor confidence.
In either case, companies will need tailored strategies that reflect the idiosyncrasies of both their industry and their own organisation.
These strategies must acknowledge that the 3.8 percent in GDP growth enjoyed in 2012 is unlikely to be repeated in the near term. Fur-thermore, industries relying upon exports to China need to contend with a forecast for GDP to fall to levels below 8 percent—the lowest in over a decade.
All of this must be considered in the context of an Australian dollar falling back to levels
not seen in three years. The narrowing inter-est rate differential between Australia and the US, combined with a reviving US econo-my and gradual tapering Chinese growth are likely to put further downward pressure on the Australian–USD currency pair. While this is likely to provide some much-needed relief to export industries, retailers are likely to see higher prices for imported inventories. These retailers will find it difficult to create value without structurally adapting to the lower Australian dollar and ensuring that a differ-entiated offer is available to their customers.
In the remainder of this report, we examine the paths three companies have taken to achieve sustainable value creation in recent times.

14 | Creating Value in a Lower Growth Economy
PATHS TO VALUE CREATION
In a climate where attractive growth opportunities appear harder to come by,
companies must still find ways to create sustainable value. The pathways they chose to do that can be very different. While some companies have aggressively pursued growth at the cost of margins, others have resigned
themselves to a stable top-line while enforc-ing greater margin discipline.
In this part of the Value Creators supple-ment, we explore the trade-offs between growth and cost reduction, and share the findings of a deep empirical review by BCG
High
LowHighLow
Returns
Growth4321
Median
ROE = 11%
Five
High
LowHighLow
Returns (weighted % annual ROE1, FY08–13)
Growth (% revenue CAGR2, FY08–13)
4321
Median five–year revenue growth = 7%
ROE = 11%
Five–year TSR quartile3
Source: S&P Capital IQ; Thomson Reuters Datastream; BCG analysis. Note: List of companies based on ASX 200 excluding those that do not have five-year TSR history. Total number of companies remaining in the sample: 175.1Calculated as the weighted annual Return on Equity (NPAT excluding non-recurring items divided by Total Equity) for all years where data is available. Results were then ranked and plotted . 2Where FY13 results were not available, the Revenue growth (% CAGR) from FY08-12 was used. Results were then ranked and plotted. 3From 01/07/2008 to 28/06/2013. Cut-offs for quartiles 1, 2, and 3 are 23%, 7% and -17% respectively.
Exhibit 10 | Majority of Top-quartile Performers get there by Achieving Right Balance of Growth and Returns

The Boston Consulting Group | 15
into how three Australian companies took dif-ferent paths to create sustainable value for their shareholders.
The Growth-margin Trade-offGrowth and cost reduction are often seen as conflicting goals. Growth can come at the cost of margins in the form of higher R&D spend, higher advertising, marketing and selling costs, and/or lower prices. Conversely, cost re-duction can limit resources for growth and absorb valuable management bandwidth that could otherwise be directed at growth. To ex-acerbate the issue, companies may feel that their voracious appetite for cost reduction over the last few years has left them with very little room for new opportunities.
An interesting picture emerges if we consider the returns generated by the ASX 200 compa-nies in the context of their revenue growth (see Exhibit 10). Returns are here represented by weighted annual return on equity over the last five years.
What is readily apparent from the analysis is that in order to deliver superior returns, com-panies need to achieve the right blend of both growth and returns. While reducing costs and targeting capital spend is to be commended, even without growth, the results show that most companies with top-quartile five-year TSRs (23 percent or higher) have revenue growth above the healthy median of 7 percent.
BCG’s research suggests that the level of re-turns a company enjoys plays a part in deter-mining whether or not they should focus on growth, or returns. Many high ROE compa-nies that grow, even at the expense of their profitability, tend to be able to achieve top-quartile TSR performance. In contrast, im-provement in ROE is more important than growth for low ROE companies.
It is important for managers not to lose sight of the fact that increased earnings do not equate to value creation. For that reason, our analysis focused on ROE, which can be read-ily compared to cost of capital, rather than net earnings. Investments only create value when they generate a return over their cost
of capital. Where a company’s cost of capital ex-ceeds its level of returns, growth will amplify val-ue destruction as much as it will value creation. The fact that very few top-quartile perform-ers have low returns, irrespective of their lev-el of growth, confirms this.
Given each company faces very different competitive, economic and financial circum-stances, its starting position will influence which strategic moves it can make.
Where do I Start? Value Patterns and Value CreationIn 2012, BCG conducted a large quantitative study to assess how a number of factors de-fine a company’s starting position, as seen from an investor’s perspective. The sample involved about 6,000 companies in 60 coun-tries over the last 10 years.
The analysis focused on four factors to identi-fy distinct value patterns among a company’s investment thesis:
• Portfolio health: “Does the company enjoy a privileged competitive position, relative to the market and its industry, that produces attractive returns above its cost of capital?”
• Growth exposure: “Is the company positioned in such a way that it has the capacity and potential for quality growth?”
• Risk profile: “Considering the company’s debt and regulatory position, what are its risks and mitigants?”
• Investor expectations and valuation: “What expectations do investors have of a company and does the company’s valua-tion match their outlook?”
The interplay of these four factors gives rise to ten distinct value patterns—or “clusters”. We have termed these as: Healthy High Growth, Discovery, High Value Brand, Asset-light Services, Asset-heavy Discovery, Average (diversi-fied), Hard Assets, Utility-like, Deep Value, and Distressed1.

16 | Creating Value in a Lower Growth Economy
Clusters are industry agnostic, and indeed companies within an industry may span mul-tiple clusters. Just as a company’s strategy can transform its business model over time, material shifts in performance will move a company from one cluster to another.
In general, no more than half of companies in any given cluster will remain in the same cluster over a five year period. While some companies may move “up” to a high-multiple cluster, others may move “down” clusters. A further subset will cease to become public en-tities, with the main drive of this being merg-ers and acquisitions.
Our analysis identified 13 companies in Aus-tralia that have consistently beat ASX 200’s TSR in at least seven out of the last ten years, as well as performing in the top quartile of 10-year TSR performance (see Exhibit 11). By applying this concept of value patterns to three of those companies, we explored how they have successfully created sustainable value for their shareholders. These compa-nies were chosen because they offer insights into three distinct value patterns and their as-sociated “unlocks”, or strategic moves that create value within each cluster.
REA Group: Discovering New Sources of Growth in AdjacenciesREA Group is a global online real estate ad-vertising company for residential and com-mercial properties. Since launching reales-tate.com.au in 1998, the company now has 13 websites globally and is Australia’s largest property website. REA Group’s spectacular growth story is the result of continually in-vesting in R&D, leveraging partnerships and applying lessons to other markets.
By 2006, REA Group was generating $60 mil-lion in sales and had received the backing of News Corp, which took a majority stake in the company. Investors were valuing REA Group at as much as 10 times sales, and by the end of the year, the company had a mar-ket value just shy of $700 million. Fast for-ward to 2013 and REA Group has a market value of $3.6 billion as at 30 June, and has de-livered an annual TSR of 34 percent from 2006 through 2013 (see Exhibit 12).
Applying BCG’s value patterns lens, REA Group’s starting position in 2006 met the cri-teria of the healthy high growth cluster and quickly matured into the discovery cluster as higher margins replaced growth. Discovery
0
–20–30–40–50
2
4
6
8
10
603020100–10
Rea GroupMonadelphous
Mermaid Marine
CSLALSRamsay
10-year TSR (% p.a.)
Oil Search
Panaust
Years outperforming the market in TSR
CaltexComputershare
Sydney AirportArdent Leisure
Fletcher Building
OtherIndustrialsFinancials
Consumer staples & discretionaryMining, materials, energy
Telco, utilities
Top quartile 10-year TSR cut-off (17%)Sustainable value creators1 (13)
More than 7 years outperforming
the market
Less than 7 years outperforming
the market
Source: Thomson Reuters Datastream; BCG analysis.Note: List of companies based on ASX 200 excluding those that do not have a 10-year TSR history. Total number of companies remaining in the sample: 133.1Defined as those companies that achieved top quartile 10-year TSR performance, and have beaten the ASX 200 annual TSR performance in seven years or more.
Exhibit 11 | BCG has Identified 13 Sustainable Value Creators for the 10 year Period 2003–13

The Boston Consulting Group | 17
companies tend to be healthy technology in-novators with high R&D expenditures, but also relatively risky, requiring continual inno-vation to sustain high levels of value creation. About 5 percent of the companies in our 6,000-company sample are in the discovery cluster. Examples include Microsoft, NVIDIA, and Gilead.
Companies in this cluster earn very high re-turns and enjoy strong growth prospects. REA Group, for example, generated a cash flow ROI of 32 percent in 2013. Such results attract high multiples, and REA Group’s enterprise value is 14 times its invested capital (exclud-ing goodwill and intangibles).
These results, however, come at a price. The prospect of high returns attracts many com-petitive threats and, when combined with un-stable segment boundaries and rapid pipe-line depletion, discovery companies tend to be highly volatile. To chase high multiples, dis-covery companies must constantly push to ag-gressively seek growth opportunities while retain-ing their margins.
For those reasons, over a five year period, about half the companies in the discovery
cluster either matured into a lower-multiple cluster or ceased to be public entities. To be-come one of the success stories, REA Group has pursued three strategies which typically unlock value for discovery companies.
Consistently invest in R&D and inno-vationAt 3 percent, REA Group’s R&D as a percent-age of sales is well below that of most discov-ery companies. Yet this has not stopped it from constantly manoeuvring to stay ahead of the fast-moving technology curve in digital media and advertising. In 2010, REA Group launched its iPhone app for realestate.com.au, soon followed by the Android and iPad apps in 2011. More recently, REA Group intro-duced a first of its kind commercial property app linked to its realcommercial.com.au web-site, to allow users to search for commercial spaces such as offices and warehouses. These apps collectively surpassed 2.2 million down-loads in June 2013. Since June 2012 mobile traffic has increased 65%, and app visits are up 196%. In making these investments, the company has made a deliberate move to pro-tect its core, recognising that apps go further than mobile-optimised websites to secure brand loyalty.
Share performance TSR disaggregation
34117
28
0
10
20
30
40
50Sources of annual TSR (percentage points)
Salesgrowth
Marginchange
Multiple change
Cash flowdistribution
Total TSR
–12
0
200
400
600
800
1,000
2008 20132011 2012201020092007
Value of $100 invested in 2006
ASX 200Peer indexREA Group
Source: S&P Capital IQ; Thomson Reuters Datastream; BCG analysis.Note: In the chart on the left, the peer index includes CarSales.com Limited, Seek Limited, and Trade Me Group Limited. In the chart on the right, the contribution of each source of TSR is shown in percentage points of seven-year average annual TSR; any apparent discrepancies between sources of TSR and total TSR are due to rounding.
Exhibit 12 | Since 2006, REA Group has Multiplied Investors’ Money Nearly Eight-fold
18 | Creating Value in a Lower Growth Economy
Pursue adjacenciesTo grow further, REA Group leveraged its ex-pertise in providing a compelling online val-ue proposition to residential customers by venturing into the commercial real estate market with realcommercial.com.au. In 2007, REA Group expanded into the adjacent mar-ket of holiday accommodation with realholi-days.com.au. After building it into a growing concern, the company sold the business to HomeAway in 2011 in order to focus on its core businesses.
REA also sells advertising space on realestate.com.au and realcommercial.com.au to prop-erty developers and brands, capitalising on its base of three million visitors per month and its advertising relationships with News Corp.
Establish strong commercial pres-enceREA Group has also successfully used part-nerships to pursue adjacencies outside Aus-tralia. In these cases, it combines its expertise with the local knowledge, industry experi-ence and relationships of its partners. Exam-ples include Casa.it, originally purchased in partnership with Sky Italia, and Propertyfind-er.com, initially through partnership with
News International, but since divested.
Where revenues from Australia have grown at an annual 20 percent from 2008–13, inter-national revenues have risen 31 percent over the same period. As a result, the company is well placed to harness its expertise across in-ternational borders, greatly improving its ca-pacity to “beat the fade” and maintain its high level of growth.
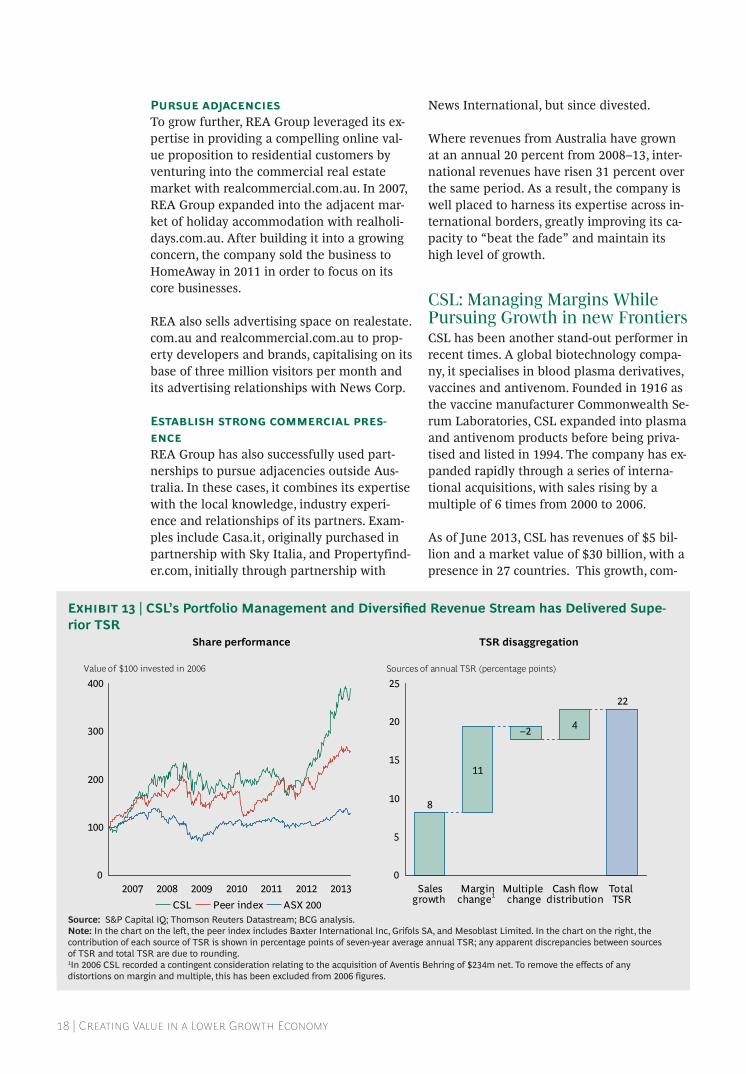
CSL: Managing Margins While Pursuing Growth in new FrontiersCSL has been another stand-out performer in recent times. A global biotechnology compa-ny, it specialises in blood plasma derivatives, vaccines and antivenom. Founded in 1916 as the vaccine manufacturer Commonwealth Se-rum Laboratories, CSL expanded into plasma and antivenom products before being priva-tised and listed in 1994. The company has ex-panded rapidly through a series of interna-tional acquisitions, with sales rising by a multiple of 6 times from 2000 to 2006.
As of June 2013, CSL has revenues of $5 bil-lion and a market value of $30 billion, with a presence in 27 countries. This growth, com-
Share performance TSR disaggregation
Sources of annual TSR (percentage points)
Salesgrowth
Marginchange1
Multiple change
Cash flowdistribution
Total TSR
2008 20132011 2012201020092007
Value of $100 invested in 2006
ASX 200Peer indexCSL
22
4
11
8
0
5
10
15
20
25
–2
0
100
200
300
400
Source: S&P Capital IQ; Thomson Reuters Datastream; BCG analysis.Note: In the chart on the left, the peer index includes Baxter International Inc, Grifols SA, and Mesoblast Limited. In the chart on the right, the contribution of each source of TSR is shown in percentage points of seven-year average annual TSR; any apparent discrepancies between sources of TSR and total TSR are due to rounding.1In 2006 CSL recorded a contingent consideration relating to the acquisition of Aventis Behring of $234m net. To remove the effects of any distortions on margin and multiple, this has been excluded from 2006 figures.
Exhibit 13 | CSL’s Portfolio Management and Diversified Revenue Stream has Delivered Supe-rior TSR
The Boston Consulting Group | 19
bined with an 11 percentage point increase in cash flow ROI (to 24 percent) has allowed it to deliver 22 percent annual TSR from 2006–13 (see Exhibit 13).
CSL’s starting position in 2006 placed it with-in the high-value brand cluster, which repre-sents about a one-fifth of our global sample.
High-value brand companies tend to enjoy privileged com-petitive positions in relatively stable markets.
They are not exposed to any one technology, patent or product, and benefit from the scale of their operations. This attractive profile nat-urally draws in investors, reflected in CSL en-joying a 7.9 times enterprise value to tangible invested capital. Examples of high-value brands around the world include IBM, Pfizer, Pepsi Co and Nike.
The pathway by which CSL has seen inves-tors’ money rise nearly four-fold since 2006 involves three specific “unlocks”, or strategies to create value.
Reinvest to support differentiationFor high-value brands, a key imperative is to continually maintain the strength of the com-pany’s business systems and proprietary sources of advantage. In a highly technical in-dustry, CSL has achieved this by signing li-censing agreements with other biotechnology companies so that it can rapidly develop new products for its pipeline.
In 2006, CSL entered into a technology collab-oration agreement with EvoGenix (now Ara-na). The agreement gave CSL access to Evo-Genix’s proprietary technologies to accelerate pipeline development, with the right to com-mercialise any resulting products. EvoGenix in return received funding as well as royalty payments. In 2007, this collaboration led to the development of humanised lead antibod-ies, and further progress in this field since.
It is not uncommon for companies to either
lack, or be unable to acquire, the capabilities needed to execute their strategies. CSL is a prime example of using partnerships to over-come this barrier.
Manage portfolio healthOver the past decade, CSL has carefully man-aged its portfolio health, divesting assets that drove low returns or added complexity.
For example, in 2003, CSL’s animal health di-vision generated sales of $65 million from vaccines targeted at livestock and companion animals. After a strategic review to determine the best way to maximise the value of the business, CSL sold the division to Pfizer for $170 million. In 2005, CSL divested its cell culture reagent business, JRH Biosciences, to an American company so that it could focus on its plasma business. The plasma business was further expanded through its acquisition of Aventis Behring in 2004, and Zenyth Ther-apeutics in 2006.
More recently, CSL created a new business unit—bioCSL—to separate its diagnostics, pharmaceutical and vaccine businesses from its plasma business. By making this separa-tion, CSL has signalled a commitment to shareholders to assess where it is creating val-ue and take the necessary steps to ensure it continues to maximise shareholder value.
Diversify revenue streamCSL’s footprint today is a far cry from its orig-inal beginnings as an Australia government agency. In diversifying its business into the faster growing markets of US and Europe, CSL ensured that its growth would not be geographically bound.
Where one-fifth of CSL’s sales came from the Asia Pacific region in 2006, now the region only accounts for one-eighth of sales. Reflect-ing this, over four-fifths of CSL’s employees are now based outside Australia despite it still being headquartered in Melbourne, led by American CEO, Paul Perreault.
CSL provides a prime example of the rewards that can come from pursuing growth off-shore where growth in a company’s domestic mar-ket is no longer the best way to create value. Its separation of business units also reflects

20 | Creating Value in a Lower Growth Economy
an appreciation that chasing growth for growth’s sake is not necessarily the path to sustainable value creation.
Monadelphous: Creating Demand Through Strong Customer Rela-tionshipsFrom simple beginnings in Perth in 1989, Monadelphous came of age during the re-sources boom that swiftly transformed West-ern Australia by providing diversified engi-neering services to the resources, energy and infrastructure sectors. Up until 2005, Mon-adelphous had been characterised by fairly stable growth and respectable returns, with revenue growing about 8 percent year on year from 2000–2004. From 2006, this growth exploded, with revenues growing 25 percent year on year from 2006–13. This rapid growth was reflected in Monadelphous’ market val-ue, which grew from $500 million in mid 2006 to $1.5 billion in 2013 despite the turmoil in the resources sector. Buoyed by this growth at no cost to margins, Monadelphous has deliv-ered 21 percent in annual TSR from 2006–13 (see Exhibit 14).
Monadelphous’ starting position in 2006 fit the asset-light services cluster. Companies in this value pattern are often intermediaries, aggregating products and services and lever-aging scale to effective distribution systems to create value for their clients and sharehold-ers. These companies typically enjoy moder-ately high returns, with very high capital turn-over. Commercial risk is moderate and debt levels are generally low, resulting in high val-uations driven by investors appreciating the low-risk reinvestment economics of these businesses. Examples of asset-light services include CostCo, Dell and Adecco. Although Monadelphous has since moved closer to be-ing a high-value brand, these characteristics still remain very much at its essence, with tangible invested capital driving 7.3 times its value in revenue, at a very healthy cash flow ROI of 23 percent.
For asset-light services, the typical pitfalls in-volve pursuing growth at the cost of capital in-tensity, complexity and/or margins. By retaining stable margins and a respectable level of growth, these companies are able to appease
investors and maintain their valuations. Only 7 percent of companies sampled in this clus-ter were successful in moving up into the healthy high growth, discovery, or high-value brand clusters over five years. Monadelphous was one of the few, and achieved it by suc-cessfully executing strategies particular to its cluster.
Evolve according to customer needsOne of Monadelphous’ main sources of growth has been meeting the full-service needs of clients by providing services across the changing lifecycle of projects. Beyond pro-viding construction services during the devel-opment phase of engineering projects, the company also offers maintenance and indus-trial services contracts when projects become operational. This adaptive offering has en-sured a steady flow of new work across mul-tiple business segments, as well as significant contract extensions from long-term custom-ers. For example, Monadelphous’ Engineering Construction segment has seen sales growth of 30 percent year-on-year since 2006, com-plementing 15 percent year-on-year growth in the Maintenance and Industrial Services seg-ment.
Since 2009, Monadelphous has undertaken a major construction contract on the $14.9 bil-lion Pluto liquid natural gas project for Wood-side Petroleum. In February 2012, the compa-ny was awarded a further three-year maintenance contract for facilities associate with the project. By constantly developing its expertise in immediate service adjacencies, Monadelphous has been able to position it-self as a trusted partner to its clients, ensur-ing that it grows alongside its clients.
Establish demand stickinessAs a result of Monadelphous’ ability to create long-lasting client relationships, the company has excelled in a further unlock of asset-light services—establishing demand stickiness through network effects, switching costs, and cross-product synergies.
With its solid reputation for delivering qual-ity work, Monadelphous has been able to se-cure recurring contracts, creating an environ-ment where clients are subject to high switching costs due to Monadelphous’ in-

The Boston Consulting Group | 21
depth experience in both the industry and its clients’ operations. Recent work includes fa-cilities management at Chevron’s Gorgon LNG Project and maintenance work at Rio Tinto’s West Pilbara iron ore operations.
Pursue disciplined M&A and organic growthSince 2011, Monadelphous has begun display-ing characteristics consistent with a high-val-ue brand cluster. Its business is developing a powerful competitive advantage driven by its relationships and expertise, while its cash flow ROI has risen from 18 percent in 2006 to 22 percent over the last few years.
As with CSL, Monadelphous has been diversi-fying its revenue stream, and this has been driven through small-scale acquisitions and joint venture agreements. In late 2010, Mon-adelphous acquired KT Pty Ltd, which spe-cialises in high-pressure gas pipeline and fa-cilities construction, strengthening its capabilities in the LNG industry. Then in 2011, Monadelphous acquired power asset management company PearlStreet Energy Services to expand its services into the power sector. This year, the company established a joint venture with AnaeCo Limited, which op-
erates in the infrastructure sector, to design and construct alternative waste treatment fa-cilities.
By continuing to complement organic growth with a disciplined approach to M&A, Mon-adelphous has defied Australia’s lower growth environment to deliver sustainable value to its shareholders. With the sustained decline in Monadelphous’ resource client base, it remains to be seen whether Monadel-phous can continue to buck this trend and create further value for its shareholders.
Implications of Value Patterns for ExecutivesValue patterns are not a one-size-fits-all play-book for companies. What they do offer is a different perspective based on what compa-nies in similar positions have done, and what investors have empirically expected such companies to do. In a lower growth environ-ment, this perspective may be crucial in navi-gating the trade-offs between growth and margins, and in turn defining a company’s path to creating sustainable value for share-holders.
Share performance TSR disaggregation
Sources of annual TSR (percentage points)
Salesgrowth
Marginchange
Multiple change
Cash flowdistribution
Total TSR
2008 20132011 2012201020092007
Value of $100 invested in 2006
ASX 200Peer indexMonadelphous
21
6
125
0
10
20
30
–11
0
200
400
600
800
Source: S&P Capital IQ; Thomson Reuters Datastream; BCG analysis.Note: In the chart on the left, the peer index includes UGL Limited, Clough Limited, and Leighton Holdings. In the chart on the right, the contribution of each source of TSR is shown in percentage points of seven-year average annual TSR; any apparent discrepancies between sources of TSR and total TSR are due to rounding..
Exhibit 14 | Monadelphous’ Strong Customer Relationships have Allowed it to Deliver Superior Returns through Growth

22 | Creating Value in a Lower Growth Economy
In shaping that path, executives must consider their particular situation, including issues not visible to those outside the company.
For the three-quarters of companies with a starting position defined by one clear profile, value patterns offer a way to frame an investment thesis which fits their specific cluster and under-stand what actions will spearhead value for shareholders.
For the remainder, which blend multiple clusters, the best strategy is to consider which clus-ters are most like the company and adopt a balanced approach.
For all companies, it is imperative to remain conscious of, and anticipate, how they are likely to shift from one cluster to another over time, and what the implications of this are for how investors view—and value—the company.
Notes
1. For more information on value patterns, and how a company can determine which pattern best describes its starting position, see “The CEO as Investor,” BCG article, May 2012; “Value Patterns: The Concept,” BCG article, May 2012; “How Value Patterns Work,” BCG article, June 2012; and Unlocking New Sources of Value Creation, the 2013 Value Creators report, September 2013.

The Boston Consulting Group | 23
APPENDIX 1: ASX 200 MARKET CAPITALISATION
BY INDUSTRY
Exhibit 15 shows the distribution of the ASX 200 market capitalisation by industry since 2000. While the split between Banks/Materials and the other groups has remained rela-
tively stable over time, the mix between these groups has changed considerably in many industries. As we would expect, the largest shifts have occurred in Banks, which grew in market value, and Mining/Minerals, which declined in market value.
100
80
60
40
20
0200820072006200520042003200220012000
ASX 200 % distribution of market cap by industry
20132012201120102009
ASX market cap ($ b, as at 30 Jun)
506 597 627 576 697 927 1,246 1,501 1,392 1,122 1,290 1,441 1,241 1,357
BanksMining/materialsConsumer staplesReal estateEnergyIndustrials
Telecommunication services
InsuranceConsumer discretionaryHealthcareDiversified financialsUtilitiesInformation technology
Source: S&P Capital IQ.Note: Market capitalisation figures reflect the full value of the ASX 200 companies, inclusive of dual-listed companies. Industries designated by GICS Sector, with the Financial Sector further broken down into its component Industry Groups.
Exhibit 15 | ASX 200 Market Capitalisation by IndustryCyclical shift between Banks and Mining/Materials in ASX 200

24 | Creating Value in a Lower Growth Economy
APPENDIX 2: TSR PERFORMANCE BY INDUSTRY SECTOR
Exhibit 16 shows the market value, five-year and two-year TSR performance, current and historical forward PE ratios and market value to book value for sectors on the ASX 200.
Banks 353 15 21 10.5 12.8 1.7
Materials 341 –9 –18 11.0 10.6 1.6
Consumer staples 108 12 16 14.9 17.2 2.1
Real estate 93 1 17 12.7 14.4 1.1
Energy 85 –6 –6 23.2 17.4 1.3
Industrials 85 –1 5 16.0 15.5 1.6
Telecom. services 64 11 38 10.9 15.4 4.4
Insurance 57 4 11 11.7 13.2 1.3
Healthcare 55 12 28 17.2 20.9 4.0
Consumer discretionary 52 4 12 10.9 15.6 1.5
Diversified financials 30 4 17 10.6 13.6 1.3
Utilities 24 7 16 15.1 15.7 1.2
IT 9 9 15 16.3 17.2 5.3Total 1,357 3 7 12.2 13.6 1.7
Five–year2
TSR 2008–13 (%)
Two–year3 TSR
2011–13 (%)PE ratio (28/6/13)
MV/BV4 (30/6/13)
PE ratio (30/6/11)
MV1 ($b) (30/6/13)
Source: S&P Capital IQ; Thomson Reuters Datastream; BCG analysis. Note: Industries classified by GICS Sector groups, where the Financials Sector has been further broken into its Industry Group components.1Market Capitalisation on ASX. 201/07/2008 to 28/6/2013. 301/07/2011 to 28/6/2013. 4Market value to book value.
Exhibit 16 | TSR Performance for Australian Indices

The Boston Consulting Group | 25
APPENDIX 3: ASX 200 TOP QUARTILE
PERFORMERS
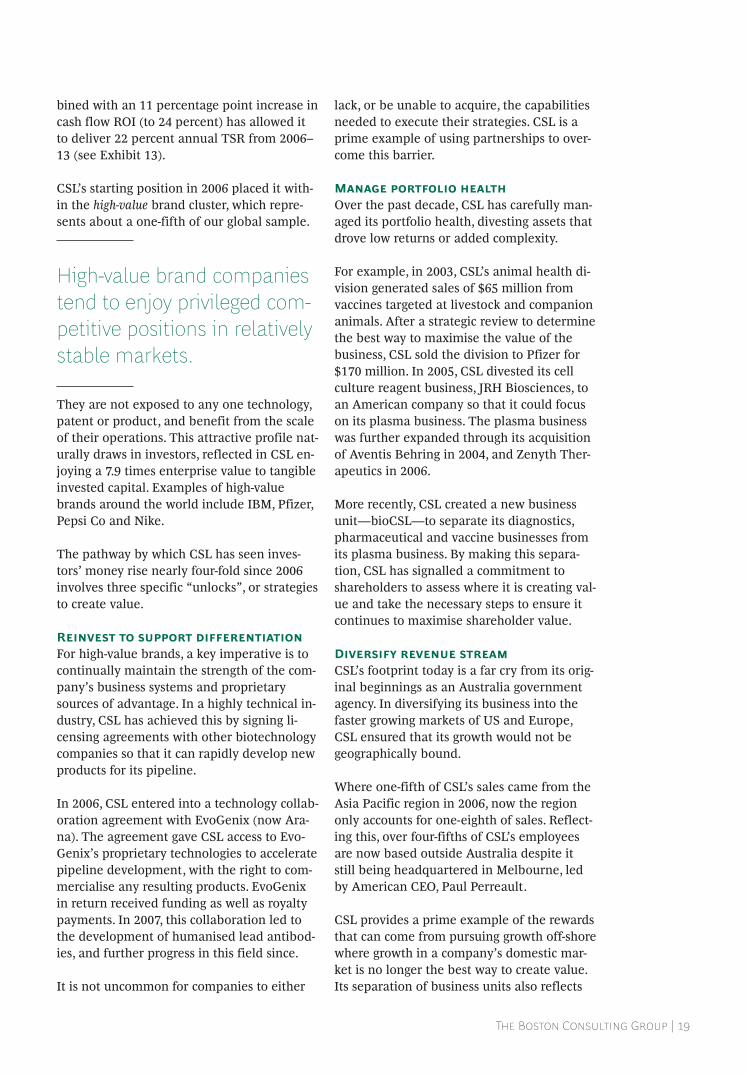
The table below lists the TSR performance of all companies in the top quartile of performers in the ASX 200. In a sharp contrast to last year, and indeed previous years,
Mining/Materials companies have a far less prominent role. Instead, the list presents a more balanced spread, with all industries being well-represented.
Rank Company Name Industry Market Cap as at 30 Jun 2013 (A$m)
Two-year TSR
1 Sirius Resources NL Materials 418 282.4
2 Magellan Financial Group Diversified Financials 1,473 182.7
3 G8 Education Limited Consumer Discretionary 669 80.5
4 iiNet Limited Telecommunication Services 1,000 58.5
5 Sirtex Medical Limited Healthcare 668 57.6
6 Drillsearch Energy, Limited Energy 449 57.4
7 Breville Group Limited Consumer Discretionary 918 54.9
8 REA Group Limited Consumer Discretionary 3,626 54.8
9 FlexiGroup Limited Diversified Financials 1,315 53.6
10 TPG Telecom Limited Telecommunication Services 2,794 49.8
11 carsales.com Limited IT 2,227 48.8
12 Twenty-First Century Fox, Inc. Consumer Discretionary 82,636 46.1
26 | Creating Value in a Lower Growth Economy
Rank Company Name Industry Market Cap as at 30 Jun 2013 (A$m)
Two-year TSR
13 Ramsay Health Care Limited Healthcare 7,182 44.9
14 Charter Hall Group Real Estate 1,170 44.7
15 M2 Telecommunications Group Limited
Telecommunication Services 1,043 41.8
16 Super Retail Group Limited Consumer Discretionary 2,352 41.7
17 CSL Limited Healthcare 30,034 40.5
18 Flight Centre Limited Consumer Discretionary 3,950 39.8
19 Domino's Pizza Enterprises Limit-ed
Consumer Discretionary 784 38.1
20 Telstra Corporation Limited Telecommunication Services 59,170 38.0
21 Aristocrat Leisure Limited Consumer Discretionary 2,360 37.7
22 Buru Energy Limited Energy 334 37.1
23 McMillan Shakespeare Limited Industrials 1,206 36.1
24 Treasury Wine Estates Limited Consumer Staples 3,767 33.9
25 Insurance Australia Group Limited Insurance 11,238 33.1
26 ResMed Inc. Healthcare 7,781 32.9
27 James Hardie Industries plc Materials 4,151 31.1
28 APA Group Utilities 5,006 30.5
29 GrainCorp. Limited Consumer Staples 2,867 30.3
30 Envestra Limited Utilities 1,788 29.4
31 Sigma Pharmaceuticals Limited Healthcare 890 29.0
32 DuluxGroup Limited Materials 1,545 28.3
33 Navitas Limited Consumer Discretionary 2,166 28.1
34 Senex Energy Limited Energy 673 28.0
35 InvoCare Limited Consumer Discretionary 1,245 28.0

The Boston Consulting Group | 27
Rank Company Name Industry Market Cap as at 30 Jun 2013 (A$m)
Two-year TSR
36 Suncorp Group Limited Insurance 15,336 27.8
37 Ardent Leisure Group Consumer Discretionary 682 27.4
38 Caltex Australia Limited Energy 4,874 26.9
39 Automotive Holdings Group Limit-ed
Consumer Discretionary 834 26.9
40 Amcor Limited Materials 12,235 25.3
41 Tatts Group Limited Consumer Discretionary 4,447 25.2
42 The Reject Shop Limited Consumer Discretionary 495 24.6
43 Goodman Group Real Estate 8,361 24.5
44 Perpetual Limited Diversified Financials 1,357 24.3
45 Spark Infrastructure Group Utilities 2,302 24.3
46 Telecom Corporation of New Zea-land Limited
Telecommunication Services 3,443 24.2
47 The SP AusNet group Utilities 3,967 23.0
48 Commonwealth Bank of Australia Banks 111,076 23.0
49 Sydney Airport Holdings Limited Industrials 6,291 22.7
50 Westpac Banking Corporation Banks 89,244 22.7
Source: S&P Capital IQ; Thomson Reuters Datastream.

28 | Creating Value in a Lower Growth Economy
APPENDIX 4: METHODOLOGY AND SAMPLE
What is meant by fundamentals?The two basic drivers of value creation are profitability and growth. Profitability is measured by the difference between cash flow return on investment (CFROI) and the weighted average cost of capital (WACC); this is often referred to as the economic spread. Growth is measured in terms of total gross investment.
These two drivers of value come together in the form of cash value added (CVA), a type of economic profit. The change in CVA is a measure of internal value creation—over the long term, it is more highly correlated to TSR than other accounting-based measures such as earn-ings per share growth.
What is “fundamental value”?BCG calculates the fundamental value of a company based on its current performance and a sustainable growth rate. The calculation is a capitalisation of the estimated future economic profits, similar to a Discounted Cash Flow (DCF) analysis, except that BCG’s method does not rely on a terminal value.
Instead, BCG uses a ‘double fade’ methodology that is founded on the notion that, over time, the profitability and growth rates of companies fade towards long-run industry averages. The concept of fade is empirically supported and is consistent with the workings of an efficient competitive market in which outperformance is competed away by rivals and underperfor-mance is forced up by capital market pressures.
What is the “expectation premium”?The expectation premium is the difference between market capitalisation and fundamental value. It gets its name from the fact that a difference between these two values implies the market has a different expectation regarding profitability and/or growth fade rates compared to the estimated base case intrinsic value.
What is the “outside-in” approach?In the 2004 edition of the Global Value Creators Report, BCG introduced an “outside-in” or market-based framework to help understand the dynamics of shareholder value creation. This framework is shown in Exhibit 17. This TSR decomposition framework recognises that, in ad-dition to measures of internal value creation such as CVA, it is important to understand how

The Boston Consulting Group | 29
the market is valuing what a company is do-ing.
How are financial services companies dealt with in the analysis?Due to the unique accounting framework used for financial services companies (that is, from the Banks and Insurers sectors), we treat financial services companies slightly dif-ferently to non-financial services companies. For financial services companies we make the following adjustments:
• Common Book Equity (that is, Book Equity excluding Preference Equity and Other Outside Equity Interests) and Cash Flow Return on Equity are used instead of Gross Investment and CFROI.
• EBITDA is not a useful measure for financial services companies. Therefore, in our outside-in TSR Decomposition framework, revenue growth is income growth, margin change is the change in the net profit after tax (NPAT) to total income ratio and the change in the multiple is the change in the Equity Value to NPAT multiple (that is, the P/E mul-tiple). Furthermore, Enterprise Value
equals Equity Value, and therefore there is no Net Debt Change factor for financial services companies.
What sample was used in the analysis?Our analysis is based on companies in the ASX 200 as at 30 June 2013 for which five-year returns are available (that is, companies that were listed as at 30 June 2008). For the purposes of fundamental analysis and TSR decomposition, we have again excluded real estate and infrastructure companies, consis-tent with last year’s edition. Companies with incomplete financials in 2008–09 were also excluded.
TSR19.7%
Cash flow
Cash flow yield
7.0%
Capital gains 12.7%
TaxesReinvestment
2 Valuation multiple
EBITDA multiple –1.4%change
1 Fundamental value
Sales growth 5.4%Margin change 8.7%
EBITDA growth 14.1%
3 Cash flow yield
Dividend yield 2.8%Share change 1.6%Net debt change 2.7%
Cash flow yield 7.0%
Example
Source: Thomson Financial Datastream; Thomson Financial Worldscope; Bloomberg; BCG analysis.Note: Actual company example; contribution of each factor shown in percentage points of annual TSR; apparent discrepancies with TSR total due to rounding.
BCG’s Decomposition Model Allows a Company to Identify the Sources of its TSR

30 | Creating Value in a Lower Growth Economy
NOTE TO THE READER
About the AuthorsNicholas Glenning is a Senior Partner and Managing Director in BCG’s Melbourne office and leads the firm’s Corporate Development Practice Area in Australia and New Zealand.
Ramesh Karnani is a Partner and Managing Director in the Sydney office and combines his experience as a senior investment banker with his knowledge of capital markets to advise clients on Corporate Devel-opment Issues.
Gerry Hansell is a Senior Partner and Managing Director in the Chi-cago office and a BCG Fellow.
Alan Wong is an Associate in the Sydney office and is a core member of BCG’s Corporate Development Practice Area.
About this SupplementSince its founding in 1963, The Bos-ton Consulting Group (BCG) has fo-cused on helping clients achieve competitive advantage. This has in-volved analysing drivers of value creation for clients across all indus-tries. Our Global Value Creators Re-port series analyses the world’s top-performing companies each year in order to build an understanding of what drives the out-performance of leading players across all industries. This report analyses the perfor-mance of large Australian compa-nies and canvasses the particular issues facing Australian managers.
About BCG’s Corporate Development Practice AreaBCG’s Corporate Development Practice Area combines BCG’s tra-ditional expertise in corporate strat-egy with extensive experience in
mergers and acquisitions and post-merger integration, a proprietary value management methodology and new analytic approaches for understanding and responding to the ways that capital markets value a company. We work closely with BCG’s industry experts to help cli-ents design and execute their cor-porate strategies, reengineer their portfolios, screen potential acquisi-tion targets and integrate them af-ter the deal is signed. We also make sure that corporate processes are aligned with the goals of the com-pany’s value creation strategy.
AcknowledgementsThis report is a product of BCG’s Corporate Development Practice. The authors would like to acknowl-edge the contributions of Marita Hastings, Kunlun Ouyang, and Stephanie Fielding to the writing of this report.
For Further InformationFor further information about the report or about BCG please contact:
Nicholas GlenningSenior Partner and Managing DirectorBCG Melbourne+61 3 9656 [email protected]
Ramesh KarnaniPartner and Managing DirectorBCG Sydney+61 2 9323 [email protected]
Gerry HansellSenior Partner and Managing DirectorBCG Chicago+1 312 993 [email protected]

© The Boston Consulting Group, Inc. 2013. All rights reserved.
For information or permission to reprint, please contact BCG at:E-mail: [email protected]: +1 617 850 3901, attention BCG/PermissionsMail: BCG/Permissions The Boston Consulting Group, Inc. One Beacon Street Boston, MA 02108 USA
To find the latest BCG content and register to receive e-alerts on this topic or others, please visit bcgperspectives.com.
Follow bcg.perspectives on Facebook and Twitter.
10/13

Abu DhabiAmsterdamAthensAtlantaAucklandBangkokBarcelonaBeijingBerlinBogotáBostonBrusselsBudapestBuenos AiresCanberraCasablanca
ChennaiChicagoCologneCopenhagenDallasDetroitDubaiDüsseldorfFrankfurtGenevaHamburgHelsinkiHong KongHoustonIstanbulJakarta
JohannesburgKievKuala LumpurLisbonLondonLos AngelesMadridMelbourneMexico CityMiamiMilanMinneapolisMonterreyMontréalMoscowMumbai
MunichNagoyaNew DelhiNew JerseyNew YorkOsloParisPerthPhiladelphiaPragueRio de JaneiroRomeSan FranciscoSantiagoSão PauloSeattle
SeoulShanghaiSingaporeStockholmStuttgartSydneyTaipeiTel AvivTokyoTorontoViennaWarsawWashingtonZurich
bcg.com|bcgperspectives.com
Printer: Spine text instructions
Title should be top aligned with top of the title on the front co-ver; bottom of BCG logo should bottom align with BCG logo on front cover
Title and Logo should match cap heights—adjust both to fit width of spine; allow «breathing room» for text
Creating Value in
a Lower G
rowth
Econom
y