creating maximum sustainable value. building winning teams ... · pt servo meda sejahtera (sms)...
TRANSCRIPT

Creating Maximum Sustainable Value.Building Winning Teams.Bigger and Better Adaro Energy.
EVERYTHING YOU NEED TO KNOW TO MAKE AN INFORMED INVESTMENT DECISION
Annual Report 2011
1 R
EASONS TO INVEST IN ADARO
NEW
EDITION
FULLY UPDATED
2

Financial Highlights
Net Sales and EBITDA Margin
(US$ millions)
EBITDA and Net Debt to EBITDA
Free Cash Flow and Cash from Operations to Capex
Net Income and Dividend Payout Ratio
Net sales has experienced strong growth the last fi ve years as we have increased production and achieved better pricing. EBITDA margin has been amongst the best in Indonesian coal.
Since 2007, EBITDA has grown signifi cantly, while net debt to EBITDA has improved, demonstrating a healthy balance sheet.
Free cash fl ow has remained positive and strengthened the last fi ve years, comfortably covering our capital expenditures.
Net income reached a record level in 2011 and has experienced a robust increase since 2007. We will continue to pay a dividend each year to our shareholders.
66.7%Increase in EBITDA YoY
32.9%Increase in Free Cash Flow YoY
123.7%Increase in Net Income YoY
46.7%Increase in Net Sales YoY
20112010200920082007
847638960352154
20112010200920082007
1,4728831,067506225
20112010200920082007
3,9872,7182,5911,8691,306
20112010200920082007
5522474179641
17.2%
27.1%
36.9%32.5%
41.2%
2.26x1.33x
0.45x1.16x 1.05x
4.6x
0.5x
6.6x
1.2x 1.1x
42.54%
21.24%
43.98%

Summary of Financial Performance (in million US$)
Net revenue 1,306 1,869 2,591 2,718 3,987
Cost of revenue -1,032 -1,433 -1,534 -1,889 -2,559
Gross profi t 274 436 1,057 829 1,428
Gross profi t margin 21.0% 23.3% 40.8% 30.5% 35.8%
Operating income 247 360 951 711 1,284
Operating margin 18.9% 19.3% 36.7% 26.2% 32.2%
Net income 41 96 417 247 552
EBITDA 225 506 1,067 883 1,472
EBITDA margin 17.2% 27.1% 41.2% 32.5% 36.9%
Total assets 1,553 3,347 4,530 4,470 5,659
Total liabilities 1,264 1,824 2,648 2,438 3,217
Stockholders' equity 289 1,523 1,882 2,032 2,442
Interest bearing debt 780 993 1,676 1,592 2,105
Cash and cash equivalents 88 221 1,199 607 559
Available-for-sale investments 184 100 - - -
Net debt 508 672 477 985 1,546
Net debt to equity (x) 1.76 0.44 0.25 0.48 0.63
Net debt to EBITDA (x) 2.26 1.33 0.45 1.16 1.05
Free Cash Flow (EBITDA - Capex) 154 352 960 638 847
Cash from Operations to Capex (x) 4.6 0.5 6.6 1.2 1.1
Earnings Per Share (EPS) in US$ 0.01500 0.00392 0.01297 0.00773 0.01721
2007 2008 2009 2010 2011
Summary of Operational Performance (in million tonnes)
Production volume 36.1 38.5 40.6 42.2 47.7
Sales volume 37.6 41.1 41.4 43.8 50.8
Overburden removal (Mbcm) 119.9 159.3 208.5 225.9 299.3
3,987
-2,559
1,428
35.8%
1,284
32.2%
552
1,472
36.9%
5,659
3,217
2,442
2,105
559
-
1,546
0.63
1.05
847
1.1
0.01721
2011
47.7
50.8
299.3
We recorded our twentieth straight year of annual production growth as coal production increased 13% to 47.7 million tonnes.
Strong revenue growth of 46.7% y-o-y due to double-digit production growth and robust thermal coal pricing. Average selling price for Adaro climbed 27.6%.
Our record net income of US$552 million included contribution to the government for taxes and royalties of US$450.5 million and US$405.4 million, respectively.
We maintained the best EBITDA margin in Indonesian thermal coal of 36.9%.
Strong balance sheet with net debt to EBITDA of 1.05x and access to cash and unutilized committed bank facilities totalling US$1.2 billion.
1
2
3
4
5
1
2
3
4
5

Adaro Energy Annual Report 2011 www.adaro.com2
Vision
Mission
Annual Report Mission
TO BE A LEADING INDONESIAN MINING AND ENERGY GROUP
We are in the business of mining and energy to:• Satisfy our customers’ needs.• Develop our people.• Partner with our suppliers.• Support the community and
national development.• Promote a safe and sustainable
environment.• Maximize shareholders’ value.
To create a balanced and relevant picture of the Company so as to keep our stakeholders informed.

Adaro Energy Annual Report 2011www.adaro.com 3
Content PT Adaro Energy TbkAnnual Report 2011
A Snapshot of Adaro Energy
Map of Our Operations
Our Corporate Structure
Why Adaro? 4 4
6
8
From Us to You
Letter from The Board of Commissioners
Letter from The Board of Directors
26
3026Running Adaro
Board of Commissioners
Board of Directors
Human Resources Management
A Discussion with Mr. Garibaldi Thohir
A Discussion with Mr. Christian Ariano Rachmat
Investing in Our Communities
35
42
52
60
61
62
35
Owning Adaro
Shareholders Information
Investor Relations
144
148144Governing Adaro
Status of Corporate Governance Practices152152Financial Report
Financial Review
A Discussion with Mr. David Tendian
Consolidated Financial Statements
164
171
174164
Additional InformationCorporate Identity
Key Personnel and Business Units
Management’s Responsibility for
Annual Report 2011
Glossary
269
270
272
273
269Management Report
68
87
88
98
100
112
116
122
131
132
143
68 Corporate Overview
A Discussion with Mr. M. Syah Indra Aman
Review of Coal Operations
A Discussion with Mr. Chia Ah Hoo
Our Subsidiaries
Occupational Health and Safety
Environmental Management
Exploration and Reserves
A Discussion with Mr. Sandiaga S. Uno
Investments for Future Performance
A Discussion with Mr. Andre J. Mamuaya

Adaro Energy Annual Report 2011 www.adaro.com4
A Snapshot of Adaro Energy
23
4
43
PT Adaro Indonesia (AI)Coal Contract of Work 100%
• Production: 47.7 Mt in 2011• Product: Sub-bituminous Coal
(“Envirocoal”) • License: First generation CCoW
valid until 2022• JORC Compliant Resources and
Reserves 2010 adjusted for coal mined in 2011:
Resources: 4,373 Mt Reserves: 891Mt• Operations: the largest single
site coal mine in the southern hemisphere, vertically integrated from pit to port
• Location: South Kalimantan• Customers: blue-chip power utilities • Pricing: annual price negotiation and
index-linked• Cost: low to middle production cost
compared to peers
1
PT Sarana Daya Mandiri (SDM)Dredging Barito River mouth and water toll contractor
PT Servo Meda Sejahtera (SMS) Coal Hauling Road (35%)
PT Saptaindra Sejati (SIS)Mining and Hauling Contractor (100%)
PT Indonesia Bulk Terminal (IBT)Coal and fuel Shipping Terminal (100%)
PT Maritim Barito PerkasaBarging and Shiploading (100% )
2
1
3
4
1
4South Kalimantan Power Project2 x 100 MW (65%)
1
2
3
PT Makmur Sejahtera Wisesa (MSW)2 x 30 MW coal fi red mine-mouth power plant
PT Bhimasena Power Indonesia (BPI)2 x 1,000 MW (34%)
PT Sejahtera Alam Energy (SAE)Geothermal
Ada
ro P
ower
Ada
ro L
ogis
tics
A Snapshot of Adaro Energy I Map of Our Operations1

Adaro Energy Annual Report 2011www.adaro.com 5
A Snapshot of Adaro Energy
141
32
1
1
2
5
IndoMet Coal project25% JV with BHP Billiton
• Product: Coking Coal• License: Third generation CCoW • Resources: 774 Mt• Location: Central Kalimantan
2
PT Bhakti Energi Persada (BEP)Coal Lease 10.2%
• Product: Sub-bituminous Coal • Location: East Kalimantan
5
• Product: Sub-bituminous Coal (“Ultima”)
• License: IUP granted in April 2010 for a period of 20 years
• JORC Compliant Resources and Reserves 2011
Resources: 286 Mt Reserves: 273 Mt• Location: South Sumatra
PT Mustika Indah Permai (MIP)Coal Lease 75%
3
• Product: Sub-bituminous Coal• License: IUP granted in March 2011
for a period of 20 years• Further drilling and coal analysis
to support JORC compliant will be resumed in 2012
• Location: South Sumatra
PT Bukit Enim Energi (BEE)Coal Lease 61.04%4
Alam Tri Abadi (Coal Mining)
LEGENDAdaro Power
Adaro Logistics
Adaro Mining Services

Adaro Energy Annual Report 2011 www.adaro.com6
Adaro Indonesia
Mining license holder- Thermal Coal
IndoMet Coal project
Mining license holder- Coking Coal
Mustika Indah Permai
Mining license holder- Thermal Coal
Bukit Enim Energi
Mining license holder- Thermal Coal
Jasapower Indonesia
Conveyor System
Maritim Barito Perkasa
Barging and ship loading
Sarana Daya Mandiri
Dredging Barito River mouth and water toll contractor
Saptaindra Sejati
Mining and hauling contractor
100%100%100%
25%
100%
61.04%
75%
51.20%
Alam Tri Abadi Adaro Mining Services Adaro Logistics
A Snapshot of Adaro Energy | Our Corporate Structure1
Adaro Energy has vertically integrated operations from Coal Mining to Power Generation
Our Corporate Structure

Adaro Energy Annual Report 2011www.adaro.com 7
Indonesia Bulk Terminal
Coal storage, blending, loading terminal and fuel facility
Indonesia Multi Purpose Terminal
Port Terminal
Servo MedaSejahtera
Haul Road and Barge Loading Port
CoaltradeServices Intl.
Coal export marketing
100% 100%
85%
35%
Adaro Marketing
Adaro Energy has vertically integrated operations from Coal Mining to Power Generation
Our Corporate Structure
CoaltradeServices Intl.
Coal export marketing
Adaro Marketing
CoaltradeServices Intl.
Coal export marketing
Adaro Marketing
Makmur Sejahtera Wisesa
2x30 MWMine-mouth Power Plant
Bhimasena Power Indonesia
IPP 2x1,000 MW
2x100MW
Project South Kalimantan
100%
34%
65%
Adaro Power

Adaro Energy Annual Report 2011 www.adaro.com8
invest inAdaro Energy
why
A Snapshot of Adaro Energy | Why Adaro1
Adaro Energy Annual Report 2011www.adaro.com 9
because...Supportive Macro Conditions1
Operational Excellence: Proven Track Record of Organic Growth2
Large Resources and Reserves of Indonesian Coal with Secure License Structure 3
Focus on Indonesia4
Approach to Growth and Value Creation5
Execution of Value Creation Strategy6
Responsible Corporate Citizen7
Exceptional Safety Record8
Financial Strength9
Total Returns to Shareholders10
Experienced Management Team and Our People 11
Reputable Shareholders and Our Approach to Governance 12
Adaro Energy Annual Report 2011www.adaro.com 9

Adaro Energy Annual Report 2011 www.adaro.com10
1
• Asia is expected to make up 76% of total global seaborne trade in 2021 and contribute 82% of the growth from 2010 to 2021.
• India and China are expected to contribute over 50% of the growth from 2010 to 2021 and together will take up to 33.5% of total global seaborne demand, an increase from 23.6% in 2010.
Coal Natural gas
Hydro Others
1,000
2,000
16,000
8,000
14,000
6,000
12,000
4,000
0
2010
2013
2015
2017
2019
2021
2023
2025
2027
2029
2008
2010
2011
2012
2014
2016
2018
2020
2022
2024
2030
2028
2006
2004
2002
2000
0500
1500
2000
2,500
3,000
Coal
Other renewable
Nuclear
Solid fuels
fuel oil
Gas
Hydro
0
20
40
60
80
100
120
2010
2011
2012
2013
2014
2015
2016
2018
2019
2020
Source: Wood Mackenzie Source: Wood Mackenzie Source: Wood Mackenzie Coal Market Service, Thermal Coal: Trends in Global Markets, December 2011
Robust industry fundamentals and outlook strong demand for low CV coal
2009
2010
2011
2012
2013
2014
2015
2016
2017
2018
2019
2020
2021
Demand: 5,105 Kcal/kg
Mt
Demand: 4,029 Kcal/kg
0
20
40
60
80
100
120
ChinaIndiaIndonesia
Coal is a key source of generating electricity in target markets
Demand for Adaro Indonesia’s Coal Specifi cation is Expected to Grow Signifi cantly
Coal is used to fuel more than two-thirds of power generation by China and India, who together are expected to dominate 70% of the Asia Pacifi c market by 2030. Wood Mackenzie predicts Asia Pacifi c’s thermal coal demand to grow at a CAGR of 4% for the foreseeable future and will continue to dominate the seaborne thermal coal trade.
Economic growth in non-OECD Asia countries acts as the main driver for energy demand as much of the increase in non-OECD Asia’s demand for energy is driven by electricity generation and industrial sectors’ needs (IEO, 2011).
New coal-fi red power plants totaling 579 GW are expected in the next 20 years in Asia, predominantly in China, India, Vietnam and Indonesia. These projects will approximately require an additional 1.7 billion tonnes of coal per year.
Domestic coal consumption for electricity generation
Mt
TWh
TWh
Supportive Macro Conditions: Exposure to Expand Emerging Market and Attractive Thermal Coal Industry

Adaro Energy Annual Report 2011www.adaro.com 11
20092008 2010 20112007200620052004200320022001 200019991998199719961995199419931992
1.0
17.7
1.4
20.8
2.4
22.5
5.5
24.3
8.6
26.7
10.9
36.1
13.6
38.5299.3
17.715.5
40.6 42.2
47.7
10.99.4
36.134.4
40.448.2 56.1
5.4
66.0
12.9
85.6
26.8
119.9
22.7
159.3
208.5
225.9
24.6
122.8
30,11.0 1.0 2.1
Wara
Paringin
Tutupan
Overburden Removal (Mbcm)
Historical Production Volume (Mt)
Operational Excellence: Proven Track Record of Organic Growth
We recorded our twentieth straight year of uninterrupted annual production growth from our concession in South Kalimantan, which is the largest single site mine in the southern hemisphere. We take pride in having grown production every year despite past economic crisis and diffi cult weather conditions. Our operational excellence has assisted us in partnering with several global blue-chip companies on projects.
In 2011, we increased coal production 13% to 47.7 million tonnes and overburden removal 32% to 299.9 million bcm from three pits within our concession; Tutupan, Wara, and Paringin. One of our key growth strategies is continued focus on organic growth from our current reserve base. We look to maintain our production track record as we seek organic growth largely from our E4000 (Wara) coal.
Our Strategy to Improve Effi ciency and Cost Control
2
Robust industry fundamentals and outlook strong demand for low CV coal
Project Reason Project Cost Spend Through Q411
Completion Date
Overburden crusher conveyor
Transport 34 Mbcm overburden annually
US$ 212 million US$ 94 million Q1 2013
Mine-mouth power plant 2x30 MW
Power operations in South Kalimantan and our overburden crusher conveyor
US$ 160 million US$ 110 million Q4 2012
Kelanis Expand our capacity to 70 Mt from 55 Mt
US$ 55 million US$ 20 million Q4 2012
Increase truck size Improve operating effi ciency and reduces pit congestion
NA NA Ongoing
Adaro has amongst the lowest costs in the coal mining industry and consistently delivers the highest EBITDA margin in Indonesian coal.

Adaro Energy Annual Report 2011 www.adaro.com12 Adaro Energy Annual Report 2011 www.adaro.com12 www.adaro.com
Large Resources and Reserves of Indonesian Coal with Secure License Structure
3
Adaro Energy Annual Report 2011
AS
H %
(adb
)
20
15
10
5
0
envirocoal
30
2.5
2.0
1.5
1.0
0.5
0.0
Nitr
ogen
% (d
af)
envirocoal
30
2.5
2.0
1.5
1.0
0.5
0.0
Tota
l Sul
fur
% (a
db)
envirocoal
1% - 2.5% Ash Content (Adb)
0.9% Nitrogen Content (Daf)
0.1%Sulphur Content (Adb)
• Lowest ash content among coals produced for global export trade, providing consumers with signifi cant cost savings
• Blending Envirocoal with higher ash coal reduces the on-costs associated with ash disposal
• Reduces deposition rates in boilers improving thermal effi ciency and reducing maintenance costs
• Envirocoal is amongst the 10 lowest coals by nitrogen content
• Enables consumers to reduce the costs associated with removing nitrous oxides from the fl ue gases
• Results in more net power for sale and lower electricity production cost
• Regulation of emissions of sulphur oxides has required some consumers to install fl ue gas desulphurization equipment or to reduce the sulphur content in the blend of coals.
• Envirocoal’s ultra low sulphur content enables consumers to meet regulated standards and delay capital expenditure, reducing the cost of plant operation.
• Desulphurization units can cost up to 20% of the total capital expenditure of a new power station
Adaro Energy (Equity Adjusted) Consolidated JORC Compliant Coal Resources (*please refer to “Exploration and Reserves” section for the full disclosure)
GroupOperating Company
Calculated as at December 31 2011 Using Adjusted 2011 Mine Production & the December 2010 PT Adaro Indonesia JORC Statement
As at December 31 20104 Calculated Changes to Adaro Energy’s Coal Resources 2011 vs 2010
Total Measured, Indicated & Inferred Coal Resources (Mt)
Measured Coal Resources (Mt)
Indicated Coal Resources (Mt)
Inferred Coal Resources (Mt)
Total Measured, Indicated & Inferred Coal Resources (Mt)
Measured Coal Resources (Mt)
Indicated Coal Resources (Mt)
Inferred Coal Resources (Mt)
Total Measured, Indicated & Inferred Coal Resources 2011 vs 2010 (Mt)
Total Measured, Indicated & Inferred Coal Resources 2011 vs 2010 (%)
Total Adaro Energy
PT. Adaro Indonesia1,2
PT. Mustika Indah Permai3
4,588 1,651 1,437 1,499 4,426 1,517 1,410 1,499 162 3.7%
1 Based on Adaro Indonesia’s 2010 JORC Coal Resource and Reserve Statement adjusted by subtracting 53 Mt of in-situ coal removed by mining during 20112 1 Mt of in-situ coal was removed from North Paringin by mining in 20113 Based on the JORC Report of PT. Mustika Indah Permai (MIP) dated January 2012 4 Small differences between 2010 Resource tonnages in this table and those stated in the 2010 Adaro Energy Annual Report based on cumulative rounding errors
1 Based on Adaro Indonesia’s 2010 JORC Coal Resource and Reserve Statement adjusted by subtracting 47 Mt of coal produced during 2011 2 No JORC Coal Reserves were declared for North Paringin in 2010 however 1 Mt of coal was mined in 2011 3 Based on the JORC Report of PT. Mustika Indah Permai (MIP) dated January 2012 4 Small differences between 2010 Reserve tonnages in this table and those stated in the 2010 Adaro Energy Annual Report based on cumulative rounding errors
Adaro Energy (Equity Adjusted) Consolidated JORC Compliant Coal Reserves (*please refer to “Exploration and Reserves” section for the full disclosure)
GroupOperating Company
Calculated as at December 31 2011 Using Adjusted 2011 Mine Production & the December 2010 PT Adaro Indonesia JORC Statement
As at December 31 20104 Calculated Changes to Adaro Energy’s Coal Reserves 2011 vs 2010
Total Proved & Probable Coal Reserves (Mt)
Proved Coal Reserves (Mt)
Probable Coal Reserves (Mt)
Total Proved & Probable Coal Reserves (Mt)
Proved Coal Reserves (Mt)
Probable Coal Reserves (Mt)
Total Measured, Indicated & Inferred Coal Reserves 2011 vs 2010 (Mt)
Total Measured, Indicated & Inferred Coal Reserves 2011 vs 2010 (%)
Total Adaro Energy Coal Reserves
PT. Adaro Indonesia1,2 PT. Mustika Indah Permai3
1,095 830 265 938 699 239 157 16.8%
Adaro has a very large JORC compliant resource and reserve base of 4.6 billion tonnes and 1.1 billion tonnes, respectively. At Adaro Indonesia, we hold a 1st generation Coal Contract of Work (CCoW), which provides us greater comfort in the dynamic regulatory environment of natural resources. Our CCoW, does not allow for changes in our contract with the government and is more secure than subsequent license types. We pay a 45% tax rate and 13.5% of net sales in royalty under a CCoW.
Currently, we sell two different products from our concession in South Kalimantan, which have heat values of approximately 5,000 kcal/kg (E5000 - Tutupan, Paringin) and 4,000 kcal/kg (E4000 - Wara). Our coal is marketed as Envirocoal and is one of the most environmentally friendly coals with extremely low ash, nitrogen, and sulfur content.
Adaro Energy Annual Report 2011 www.adaro.com

Adaro Energy Annual Report 2011www.adaro.com 13
Focus on Indonesia 4
Indonesia is now recognized as an emerging market leader, with 2011 GDP growth of 6.54%. Furthermore, Indonesia is resource rich and enjoys close proximity to those other emerging nations, namely China, India and South Korea. Indonesia is the world’s largest exporter of coal and the country’s coal production capacity is estimated to reach 500 million tonnes by 2020, of which 50% is low-rank coal (Wood Mackenzie, 2008).
The rising demand for coal-fi red power generation is also expected to drive production growth of Indonesian low-rank coal. Much like reforms to regulation, challenges exist. Growth targets for installation of new generation capacity have slipped, so an objective view should be taken when considering the numbers. Despite this, PLN and private industry projects are under construction and coal fi red generation capacity is reported to double between 2011 and 2019 to 31.2GW.
With our performance in 2011 we moved one step closer to achieving our vision to be a leading Indonesian energy and mining company. We are proudly Indonesian and our focus is Indonesia.
Resources: 85.25 BtReserves: 14.80 Bt
Resources: 75.03 BtReserves: 13.22 Bt
7.8%1.4%
24.1%
66.6%
Medium RankLow Rank
High Rank Very High Rank
Resources: 160.65 (Bt)Reserves: 28.02 (Bt)
Indonesian Coal

Adaro Energy Annual Report 2011 www.adaro.com14
5Approach to Growth and Value Creation
Production ramp up and mine planning
Majority of organic growth will come from Wara mine
Implementation of OPCC, mine-mouth power plant and control of barge cycle time
Chip sealing of hauling road, dredging of channel etc
have been initiatives in past that brought down costs
substantially
Acquisition of large coal deposits at different locations
in Kalimantan and Sumatra islands
Acquired concessions in South Sumatra, more in due
diligence. Partnering with BHP on Coking Coal
Investment into IPPs
First Indonesian company to participate in IPPs in a signifi cant way. Partnering
with reputable global players in IPP sector
Action Plan
Organic growth from current reserve base
Focus on improving effi ciency of coal supply chain and cost
control
Increase reserves, diversify product, locations and
licenses
Continue to deepen integration
Growth Strategy
Adaro Energy continues to focus on creating maximum sustainable value from Indonesia coal. However, our strategy has shifted from not only developing a single site concession in South Kalimantan, but also incorporating acquisitions of coal deposits in Indonesia into our growth plan to reach 80 million tonnes of production in the medium term.
We will continue to develop infrastructure and improve our coal supply chain to realize effi ciencies and strengthen our distinctive position in the market. Moreover, we have further integrated our coal supply chain by moving downstream into power.
Our approach to value creation can be summarized by four key strategies; organic growth from the current reserve base, improving the effi ciency of our coal supply chain, increasing and diversifying reserves, products and locations and deepening integration.
Adaro Energy Annual Report 2011 www.adaro.com14

Adaro Energy Annual Report 2011www.adaro.com 15
6Execution of Value Creation Strategy
We are executing on our value creation strategy. We have made investments in a number of infrastructure development projects that are on track and progressing well, further improving effi ciency and lowering costs. We also acquired interests in two coal deposits and one logistic company in South Sumatra to diversify our operations and increase reserves.
We deepened integration by moving further downstream into power and establishing the JPower-Adaro-Itochu consortium to build a 2,000 MW coal-fi red power station in Central Java, which will be one of the largest in Asia.
Acquisition Price/ Ownership Date Location Asset License / Expiry
ExpectedOperation
IndoMet Coal (IMC)JV with BHP
US$335m25%
March 2010
Central Kalimantan
Greenfi eld -coking coal
CCoWNA
TBA
Mustika Indah Permai(MIP)
US$222.5m75%
August2011
South Sumatra Greenfi eld -thermal coal
IUP2030
2012
Bukit Enim Energi(BEE)
US$67m61%
October2011
South Sumatra Greenfi eld -thermal coal
IUP2031
TBA
Servo Meda Sejahtera(SMS)
US$22m35%
October2011
South Sumatra Logistics - haul road and port
NA 2012
Bhakti Energi Persada (BEP)
US$66m10%
June 2011
East Kalimantan Greenfi eld -thermal coal
IUPNA
TBA
Adaro Energy Annual Report 2011www.adaro.com 15

Adaro Energy Annual Report 2011 www.adaro.com16
Responsible Corporate Citizen7
By championing the principles of mutual respect, partnership,
long-term and sustainable commitment, Adaro’s Corporate
Social Responsibility (CSR) programs encompass four key
areas, economic development, educational enhancement, health
improvement, and social cultural promotion.
The aim is to support the enhancement of community welfare that
will ultimately lead to the creation of sustainable and independent
post-mine communities.
We also attempt to preserve the environment, create a productive
community and be a good local partner through all our programs.
In 2011, Adaro Energy and its subsidiaries allocated Rp91 billion
(~US$10 million) for these programs.
• Record contribution to nation with corporate income tax of US$450.5 million and royalties of US$405.4 million
• We increased community development spending by 70% to US$10 million
Adaro Energy Annual Report 2011 www.adaro.com16
Adaro Energy Annual Report 2011www.adaro.com 17Adaro Energy Annual Report 2011www.adaro.com 17
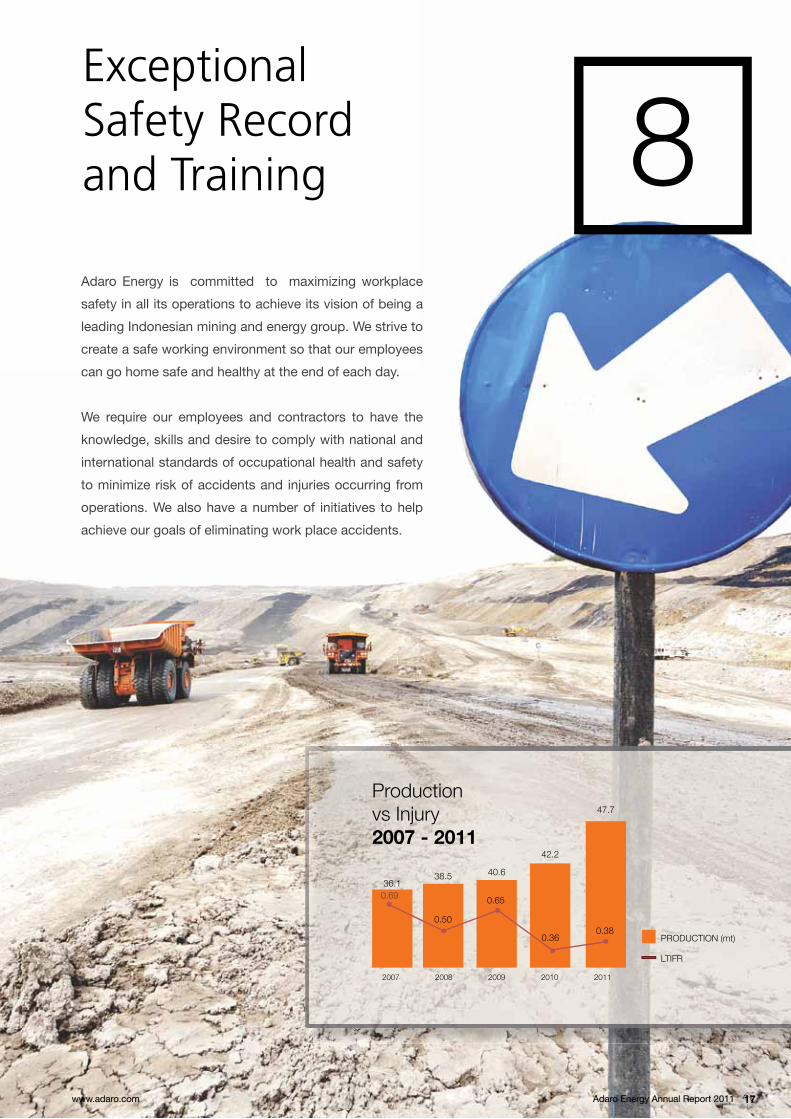
2007 2008 2009 2010 2011
36.138.5 40.6
42.2
47.7
0.69
0.50
0.65
0.360.38
Production vs Injury 2007 - 2011
PRODUCTION (mt)
LTIFR
Adaro Energy is committed to maximizing workplace
safety in all its operations to achieve its vision of being a
leading Indonesian mining and energy group. We strive to
create a safe working environment so that our employees
can go home safe and healthy at the end of each day.
We require our employees and contractors to have the
knowledge, skills and desire to comply with national and
international standards of occupational health and safety
to minimize risk of accidents and injuries occurring from
operations. We also have a number of initiatives to help
achieve our goals of eliminating work place accidents.
Exceptional Safety Recordand Training 8
Adaro Energy Annual Report 2011www.adaro.com 17

Adaro Energy Annual Report 2011 www.adaro.com18
9
20112010200920082007
3,9872,7182,5911,8691,306
18.9% 19.3%
36.7%
26.2%32.2%
20112010200920082007
847638960352154
4.6x
0.5x
6.6x
1.2x 1.1x
Debt Maturity Profi le in 2012
USD Syndicated Loan Facility
USD Senior Credit Facility (SIS)
2019 Bond
OCBC NISP Tbk Facility (SDM)
New 10yr US$ Term Loan
Cumulative % of Total Debt
Finance Leases
Amortizing RCF
Key Lenders to the Group
A large group of relationship banks and bond holders continue to be very supportive of Adaro.At end of December 2011, Adaro Energy had approximately $700 million undrawn facilities
Exceptional Access to Capital
• US$800 million 10 year, non call 5, Reg S/144A, Guaranteed Senior Notes Currently rated at Ba1 and BB+ from Moody’s and Fitch.
• US$400 million 7 year, concluded with 12 banks. Undrawn $100 million.
• US$750 million 10 year bank loans club deals with key relationship banks. Undrawn $600 million.
Net Sales (in US$ mn)& Operating Margin
Free Cash Flow (in US$ mn)& Cash from Operations to Capex
20112010200920082007
1,4728831,067506225
2.26x1.33x
0.45x1.16x 1.05x
20112010200920082007
5522474179641
17.2%
27.1%
41.2%
32.5%36.9%
EBITDA (in US$ mn)& Net Debt to EBITDA
Net income (in US$ mn)& EBITDA Margin
49%54%
60%
15
97%100%
1
2012 2013 2014 2015 2016 2017 2018 2019 2020 2021
8%
5 3
40
100
21%
4
100
19
150
38%
230
534
100
45%
87.5
3245 4 38
56
94%
800
6860
43
71
35
94
36
21
24
Financial Strength:Good Access to Capital, Healthy Balance Sheet, Robust Profi tability and Strong Cash Generation

Adaro Energy Annual Report 2011www.adaro.com 19
283.0%Adaro210.9%
Jakmine Index
JCI Index
ICB Subsector (Coal)
Bloomberg Asia Pac Mining
202.7%
193.7%
68.1%
3-year Stock Performance
Security Price Appreciation Total Return CAGR
ADRO IJ Equity 264.95% 282.95% 56.45%
JCI Index 181.98% 202.73% 44.66%
JAKMINE Index 188.53% 210.88% 45.95%
ICB Subsector (Coal) 167.49% 193.65% 43.20%
Bloomberg Asia Pac Mining 58.49% 68.13% 18.91%
Adaro Energy’s Dividend
Fiscal Year Dividend Payout Ratio Dividend Per Share (IDR) Dividend Yield*
2010 43.98% 30.35 1.47%
2009 21.24% 29.00 2.41%
2008 42.54% 11.80 1.12%
* Dividend yield is calculated by dividing dividend per share by average stock price for associated fi scal yearSource: Bloomberg and Company estimates
10Total Returns to Shareholders
Over the last three years, Adaro has returned signifi cant shareholders return for those investors who have held our stock during this time frame. As mining is not a short-term business, our focus is to create long-term value for all of our shareholders who support us as we seek to create maximum sustainable value from Indonesian coal. Adaro will consistently pay a cash dividend each year; however, our main use of cash will be to invest in the growth of our business.
Adaro Energy Annual Report 2011www.adaro.com 19Adaro Energy Annual Report 2011www.adaro.com 19

Adaro Energy Annual Report 2011 www.adaro.com20
Experienced Management Team and Our People11
Leadership continuity is key to successful execution of Adaro Energy’s strategy and navigating through challenging times
2005*
16.9
2011
18.7
11%
84
2005* 2011
1,0031094%
2005*
26.7
2011
47.779%
Production (Mt)
Profi t Before Tax (US$ mn)
Mine Life (Years)
1.0x
2005*
6.3x
2011
(83)%
2005*
1.32
2011
0.42
(68)%
697
2005* 2011
3,987482%
Sales (US$ mn)
Net Debt/EBITDA
Lost Time Injury Frequency Rate
Experienced Management Team with Proven Track
Record
More than 135 years
of combined industry
experience
Average 12 years with Adaro
Energy
Combined 75 years with Adaro
Energy
• Benefi ts from experience and active participation of key shareholders• High operating and safety standards• Prudent fi nancial policies• Strong corporate governance and regulatory compliance
* Represents PT Adaro Indonesia only

Adaro Energy Annual Report 2011www.adaro.com 21Adaro Energy Annual Report 2011www.adaro.com 21
Reputable Shareholders and Our Approach to Governance 12
Edwin SoeryadjayaTeddy RachmatBoy Garibaldi ThohirBenny SubiantoSandiaga Uno
together hold
63%}
• 1/3 of Board of Commissioners are independent commissioners• Audit Committee consists of 3 independent members• Conduct regular internal audit of operations• Disclosure meets or exceeds with international standards
• Top Performing Listed Companies 2010 by Investor Magazine• International Coal Producer of the Year by McCloskey• 3rd Fastest Growing Company in Asia by Platts • One of highest tax payers on Jakarta Stock Exchange in 2008
and 2009• PROPER Green Award for the 3rd consecutive time from Ministry
of Environment• Only coal company to ever receive the PROPER Green Award • Best CEO in Mining 2010 by Ministry of Energy and Mineral
Resources
Reputable and Supportive Shareholders
Strong Corporate Governance Structure In-line with International Best Practices
Wide Recognition Across the Board
Adaro Energy Annual Report 2011www.adaro.com 21

Adaro Energy Annual Report 2011 www.adaro.com22
September 30th 2011We received Aditama (gold) award 2011 for environmental management excellence in coal sector from the Director General Mineral and Coal, Mr. Thamrin Sihite.
October 6th 2011 The JPower-Adaro-Itochu Consortium received Letter of Intent (LoI) to construct a 2,000MW coal-fi red power plant in Central Java province.
1
7
2
8
3
9
PT Saptaindra Sejati (SIS) refi nanced its existing 2008 US$300 million fi ve-year loan with a US$400 million seven-year syndicated bank loan.
February 18th 2011 March 5th 2011 April 20th 2011
October 10th 2011PT Alam Tri Abadi (ATA), a wholly owned subsidiary of PT Adaro Energy, signed a deed of transfer shares to acquire a 35% interest in PT Servo Meda Sejahtera (SMS) for Rp200 billion from PT Servo Infrastruktur (SI).
Adaro Energy on the Forbes Global 2000 list at #1,527.
Adaro held its Annual General Meeting of Shareholders (AGMS) and Extraordinary General Meeting of Shareholders (EGMS) and distributed its fi nal dividend payment constituting 43.98% of 2010 Net Income, or amounting Rp970.77 billion.
Q1 Q2Jan Feb Mar Apr May Jun Jul
2011 Important Dates and Share Price Information
Sha
re p
rice
(Rp)
0
500
1,000
1,500
2,000
2,500
3,000
2,675
5
1
43
1 24
Adaro Energy BBG World Coal IndexHSBC Global Mining Index Bloomberg Coal Index
Jakarta Mining Index
A Snapshot of Adaro Energy 1

Adaro Energy Annual Report 2011www.adaro.com 23
August 19th 2011PT Alam Tri Abadi (ATA), a wholly owned subsidiary of PT Adaro Energy, signed a share purchase agreement to acquire a 75% stake of PT Mustika Indah Permai (MIP) for US$222.5 million (post tax US$ 234.2 million) from Elite Rich Investment Limited.
Most Read Adaro News on Bloomberg:
4
10
5
11
6
12
May 31st 2011
October 14th 2011 November 30th 2011 December 9th 2011PT Alam Tri Abadi (ATA), a wholly owned subsidiary of PT Adaro Energy, signed a deed of transfer shares to acquire 46% interest in PT Bukit Enim Energi (BEE) for US$46 million from Lucky Star Corporation, Oriental Holdings Ltd., and BrightPath Corporation. The group owns 61.04% of BEE.
We received PROPER Award with Green Rating for the fourth consecutive year from the Ministry of Environment of Republic Indonesia, Prof. Dr. Balthasar Kambuaya.
We delivered our fi rst shipment of E4000 (Wara) coal to Hong Kong Electric Company Limited (HKE), HK.
Adaro, Komatsu and United Tractors launched Bio Diesel Fuel Pilot project in Indonesia to achieve sustainable environmentally friendly mining operations in our mining operations.
July 4th 2011PT Adaro Indonesia closed a US$750 million 10-year unsecured loan facility from our relationship banks, after previously receiving US$1 billion commitment for this 10-year bank loan.
2011 Important Dates and Share Price Information
Q3 Q4Jul Aug Sep Oct Nov Dec
0
1000
50,000
100,000
150,000
200,000
250,000
300,000
-50
-40
-30
-20
-10
0
10
1,770
23
8
5
6
7
9 1012
11
Volu
me
(000
)
Ret
urn
(%)
1 Bumi, Adaro to help Indonesia Coal Output Rise 71% , WoodMac Says
2 Adaro to Buy Majority Stake in Bhakti Energi Persada This Year
3
4
5
Indonesia May Increase Coal Production 8,3 Percent in 2012
Adaro Indonesia Gets 10 Years, $750 Million Bank - Loan Agreement
Adaro, Bumi Advance as a UBS Forecasts China Coal Imports to Rise

Adaro Energy Annual Report 2011 www.adaro.com24
Map of Existing Operations
1
2
34
5
6
7 8
Adaro Energy Annual Report 2011 www.Adaro.com24
A Snapshot of Adaro Energy | Map of Our Operations1
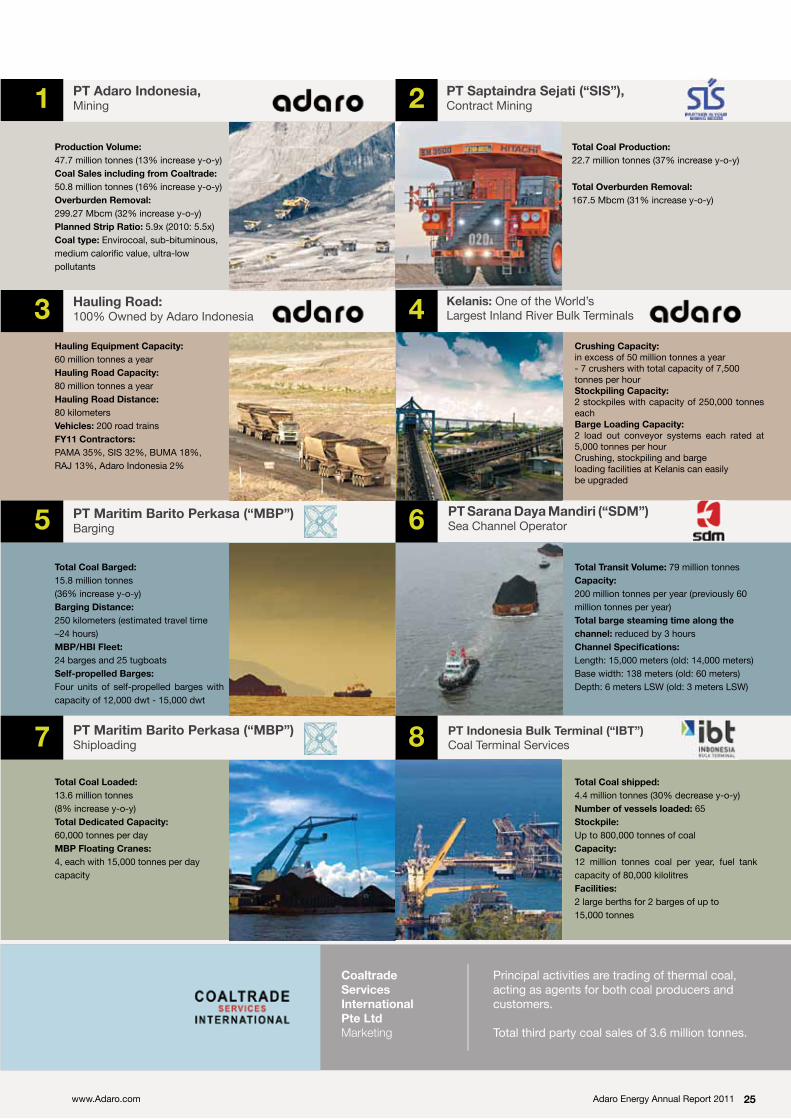
PT Adaro Indonesia, Mining
Production Volume:47.7 million tonnes (13% increase y-o-y)Coal Sales including from Coaltrade: 50.8 million tonnes (16% increase y-o-y)Overburden Removal:299.27 Mbcm (32% increase y-o-y)Planned Strip Ratio: 5.9x (2010: 5.5x)Coal type: Envirocoal, sub-bituminous,medium calorifi c value, ultra-lowpollutants
Total Coal Production: 22.7 million tonnes (37% increase y-o-y)
Total Overburden Removal: 167.5 Mbcm (31% increase y-o-y)
PT Saptaindra Sejati (“SIS”),Contract Mining1 2
Hauling Road: 100% Owned by Adaro Indonesia
Kelanis: One of the World’s Largest Inland River Bulk Terminals
Hauling Equipment Capacity: 60 million tonnes a yearHauling Road Capacity: 80 million tonnes a yearHauling Road Distance: 80 kilometers Vehicles: 200 road trainsFY11 Contractors:PAMA 35%, SIS 32%, BUMA 18%,RAJ 13%, Adaro Indonesia 2%
Crushing Capacity: in excess of 50 million tonnes a year- 7 crushers with total capacity of 7,500tonnes per hourStockpiling Capacity:2 stockpiles with capacity of 250,000 tonnes eachBarge Loading Capacity:2 load out conveyor systems each rated at 5,000 tonnes per hourCrushing, stockpiling and bargeloading facilities at Kelanis can easilybe upgraded
3 4
PT Maritim Barito Perkasa (“MBP”) Barging
PT Sarana Daya Mandiri (“SDM”) Sea Channel Operator
Total Coal Barged: 15.8 million tonnes (36% increase y-o-y)Barging Distance:250 kilometers (estimated travel time –24 hours)MBP/HBI Fleet: 24 barges and 25 tugboatsSelf-propelled Barges:Four units of self-propelled barges with capacity of 12,000 dwt - 15,000 dwt
Total Transit Volume: 79 million tonnesCapacity:200 million tonnes per year (previously 60million tonnes per year)Total barge steaming time along thechannel: reduced by 3 hoursChannel Specifi cations:Length: 15,000 meters (old: 14,000 meters)Base width: 138 meters (old: 60 meters)Depth: 6 meters LSW (old: 3 meters LSW)
5 6
PT Maritim Barito Perkasa (“MBP”) Shiploading
PT Indonesia Bulk Terminal (“IBT”) Coal Terminal Services
Total Coal Loaded:13.6 million tonnes(8% increase y-o-y)Total Dedicated Capacity: 60,000 tonnes per dayMBP Floating Cranes:4, each with 15,000 tonnes per day capacity
Total Coal shipped:4.4 million tonnes (30% decrease y-o-y) Number of vessels loaded: 65Stockpile: Up to 800,000 tonnes of coalCapacity: 12 million tonnes coal per year, fuel tank capacity of 80,000 kilolitresFacilities:2 large berths for 2 barges of up to15,000 tonnes
7 8
Coaltrade Services InternationalPte Ltd Marketing
Principal activities are trading of thermal coal, acting as agents for both coal producers and customers.
Total third party coal sales of 3.6 million tonnes.
Adaro Energy Annual Report 2011www.Adaro.com 25

Adaro Energy Annual Report 2011 www.adaro.com26
Adaro Energy achieved a historical milestone in 2011 as we reached 20 years of uninterrupted production growth and record financial results in the midst of a challenging global situation. We are continuously striving to grow and diversify our products and operations and are further enhancing our coal supply chain downstream into the power sector, enabling us to reach our overall long term goal of creating maximum sustainable value from Indonesian coal by building a bigger and better Adaro.
Year End Results
We are pleased with our strong 2011 operational and financial performance. Our achievements were possible due to normal weather conditions throughout the year, the arrival of new and larger sized heavy equipment and quality performance by our mining contractors. We produced 47.7 million tonnes of coal and had sales volumes of 50.8 million tonnes, increasing year over year by 13% and 16%, respectively. Due to higher mining costs, resulting from a higher stripping ratio and longer overburden hauling distances, Adaro Energy’s costs of revenue increased 35% to US$2.56 billion. However, we sustained a robust EBITDA (earning before interest taxes depreciation and amortization) of US$1.47 billion, increasing 66.7% from last year, and amongst the best EBITDA margins in Indonesian coal of 37%. Adaro is currently Indonesia’s second largest thermal coal producer in terms of tonnage, operates the largest single coal mine-site in Indonesia, and is a significant supplier of thermal coal to the global seaborne market. Adaro is vertically integrated, either directly or indirectly, and controls all aspects of its business from exploration to marketing. With a present production of approximately 48 million tonnes per year, we are executing plans to boost production to 80 million tonnes per year in the medium term. Adaro has approximately 4.6 billion tonnes of coal resources and 1.1 billion tonnes of reserves based on JORC studies completed in
Dear Shareholders,
Edwin SoeryadjayaPresident Commissioner
“ As a publicly listed mining and energy company, good corporate governance goes hand-in-hand with our Corporate Social Responsibility (CSR). Our commitment to support the local communities and preserve the environment, in which we operate, has been demonstrated in the past and continues to define our business practices.
Letter From the Board of Commissioners
From Us to You | Letter from the Board of Commissioners2

Adaro Energy Annual Report 2011www.adaro.com 27
2011 and 2012 adjusted by 2011 Adaro Indonesia coal production.
Our operations at Adaro Indonesia’s Wara pit will be the key organic growth driver in order to achieve our medium term production goal. In 2011, E4000 (Wara) contributed 5.4 million tonnes to total production. Going forward, we expect production at Wara will increase supported by strong demand from developing Asia.
Projects and Business Development Progress
We continue to develop infrastructure and improve our coal supply chain to realize efficiencies and strengthen our distinctive position in the market. Moreover, we have further integrated our coal supply chain by moving downstream into power as well as diversifying our product offerings and increasing our reserve base through acquisitions of coal deposits in Indonesia.
2x30 MW Coal-fired Mine-mouth Power Plant
Adaro Energy’s 2x30 MW coal-fired mine-mouth power plant aims to reduce our dependency on oil by powering our overburden crushing and conveying system, which will reduce overburden truck hauling, in addition to providing power to other parts of our mining operations. The plant is owned and will be operated by our subsidiary, PT Makmur Sejahtera Wisesa (MSW), with a total estimated cost of US$160 million. At year end 2011, the total spending on this project reached US$111.8 million. The plant will be fuelled by approximately 300,000 tonnes of E4000 coal per year. The physical progress of the plant is on track and is expected to be in full operation in late 2012.
Overburden Crushing and Conveying System
The out of pit overburden crushing and conveying system is currently being installed. The system will reduce the cost of transporting the overburden material to the dump location, decreasing dependency on the use of diesel. It has a capacity to crush and transport 12,000 tonnes per hour of overburden material equivalent to approximately 34 million bank cubic meters (Mbcm) annually. The project is projected to cost in excess of US$212 million with an expected reduction in operating costs by US$1.00-US$1.20 per bcm compared to the existing use of trucking. The total spending at year end 2011 was US$94.7 million and the project is expected to commence commercial operation in 2013.
Expanding Capacity at Kelanis River Terminal
Our coal crushing, stockpiling and barge loading facilities are located at the Kelanis river terminal with a capacity of 55 million tonnes per year. The upgrade of the existing Kelanis facilities to more than 70 million tonnes per year by the end of 2012 is underway and progressing well. The total estimated cost for this project is US$55 million. Our plan includes upgrading and replacing existing hoppers, upgrading existing as well as adding new conveyor belts, and adding two new barge loading conveyors.
IndoMet Coal project with BHP Billiton
Further studies to identify development options across the seven Coal Contracts of Work (CCoWs) of the IndoMet Coal (IMC) project continued towards the end of 2011. In the IndoMet Coal project, Adaro has an interest of 25% and the remaining 75% is owned by BHP Billiton. Adaro is delighted to have this project together with BHP Billiton, a global leader in the resources industry and the world’s largest coking coal producer, in developing this world class asset, which we expect will create significant shareholder value.
JPower-Adaro-Itochu Consortium Signed a PPA for a 2,000 MW Central Java Power Plant Project
In early October, PT Bhimasena Power Indonesia (BPI), a company established by the JPower-Adaro-Itochu consortium, signed a Power Purchase Agreement (PPA) with PT PLN (Persero) for the 2,000 MW Central Java Power Plant (CJPP) project with a total project cost of approximately US$4 billion. The PPA includes the construction of the power plant and a 25-year supply of electricity to PLN. The Government of the Republic of Indonesia (represented by the Ministry of Finance), Indonesia Infrastructure Guarantee Fund (IIGF) and BPI also will guarantee PLN’s payment obligation for the CJPP project under the PPA. This is the first formalized public-private partnership (PPP) in Indonesia under a guarantee provided by the IIGF and part of the Master Plan for Acceleration and Expansion of Indonesian Economic Development. This power plant is the first in Indonesia to use advanced environmentally friendly, technology and will serve as a model of high-efficiency power generation. The power plant will utilize Indonesian sub-bituminous coal as fuel, with Adaro Indonesia as the primary coal supplier. The construction is expected to commence in 2012 with commercial operations by 2016-2017.

Adaro Energy Annual Report 2011 www.adaro.com28
In moving downstream to the power sector, we have reviewed several Independent Power Producer (IPP) projects located in Indonesia and will continue to do so.
Acquisitions of Coal Mines and Logistics Company in South Sumatra
As part of our efforts to increase our reserves, Adaro Energy continues to look for potential acquisitions of coal deposits in Indonesia employing three selection criteria namely size, location, and quality. In 2011, we acquired two greenfield coal projects in South Sumatra and one logistics company. In mid-August, we purchased a 75% stake in PT Mustika Indah Permai (MIP) for US$222.5 million (post tax US$234.2 million). MIP holds an IUP permit which was granted in April 2010 for a period of twenty years and covers an area of approximately 2,000 hectares. As of December 15th, 2011, the total JORC Compliant Coal Resources for MIP were 286 million tonnes, of which 273 million tonnes are JORC Compliant Coal Reserves with an average calorific value of 4,281 kcal/kg (GAR).
In early October, Adaro acquired a 35% interest in PT Servo Meda Sejahtera (SMS) for Rp200 billion. We carried out this transaction to support and develop our coal logistics operations in the South Sumatra Province. SMS is constructing a dedicated haul road and common user coal port, which will provide coal hauling and barge loading services in South Sumatra.
In mid-October, Adaro Energy bought an additional 46% stake for US$46 million to become the majority shareholder in PT Bukit Enim Energi (BEE) with a 61.04% stake in total. BEE is a coal mining company developing a greenfield coal project in South Sumatra. BEE holds an IUP permit which was granted in March 2011 for a period of twenty years which covers an area of 11,130 hectares. Marston, an international mining consultant, carried out engineering studies of the coal potential of the MIP and BEE mines, on which the valuation was based. Additional drilling and coal analysis are required before a JORC compliant statement of Resources and Reserves can be issued for BEE in 2013.
These acquisitions are part of Adaro’s strategic plan to continuously grow and develop both organically and inorganically, creating maximum value from Indonesian coal.
Corporate Social Responsibillity And Community Development
As a publicly listed mining and energy company, good corporate governance goes hand-in-hand with our Corporate Social Responsibility (CSR). Our commitment to support the local communities and preserve the environment, in which we operate, has been demonstrated in the past and continues to define our business practices.
Our CSR programs have become embedded in every activity we do, particularly in our mine site. In addition, Adaro employs the Millenium Development Goals as guidance in implementing our community development programs. We realize that we must not only bring temporary benefits to our surroundings but also sustainable benefits that contribute to the establishment of an independent society based on a harmonic relationship with the natural environment. In fact, we are in the process of developing a mining closure model to ensure we achieve sustainable community development.
Aside from our extensive community programs, Adaro applies strict standards on all phases of its operations through an Environmental Policy and Master Plan to ensure that negative impacts are minimized. Land affected by mining is reclaimed beyond what is required by the regulations. The reclamation encompasses planting of commercial crops, creating fish and shrimp farms, and developing other usages. We continuously monitor air and water quality as well as implement strict programs for air, water and waste handling.
Our efforts and commitment in applying best environmental practices have earned us recognitions. We are delighted to have received the PROPER Green award for four consecutive years from the Ministry of Environment for social programs and environmental rehabilitation. In addition, we received a total of nine awards for our CSR programs in community health, education and economic development from the Ministry of Social Affairs, the Coordinating Ministry of People’s Welfare and Enterprise Asia.
Corporate Governance and Compliance
We meet the various requirements of the capital market and exchange regulatory authorities; however, we still continuously seek to improve and develop our corporate governance structure in-line with best practices.
From Us to You | Letter from the Board of Commissioners2

Adaro Energy Annual Report 2011www.adaro.com 29
The Board of Commissioners oversees all major aspects of the management of Adaro through routine and ad-hoc board meetings, as well as the activities of the Audit Committee. We have made great progress aligning our best practices and standards with the goals, mission and vision of Adaro Energy; yet, we strive to continuously improve our corporate governance. Our efforts and commitment have gained recognition as we achieved several awards from both international and domestic institutions. We received an award from Corporate Governance Asia, an international institution, while domestically we received an award for the Most Improved Governance from the Indonesian Institute for Corporate Directorship (IICD) and an award as Indonesia Trusted Companies based on Investor and Analysts’ Assessment Survey from the Indonesian Institute for Corporate Governance (IICG).
We believe that strong corporate governance is not only a set of procedures and policies to comply with the regulations, but also applies to corporate governance of all our activities and businesses and is a perpetual system that ensures the interests of stakeholders and the sustainability of the company.
Dividend Distributions
The 2011 Annual General Meeting of Shareholders, which was conducted on April 20th, 2011, approved the use of 43.98% net profit for the fiscal year 2010 final dividend payment of Rp970,773,946,700 or Rp30.35 per share. This dividend included an interim dividend of Rp315,061,725,700, which was paid on December 10th, 2010. On November 8th, 2011, the BOC and BOD approved a distribution of the fiscal year 2011 interim dividend in the amount of US$75,167,010.70 or US$0.00235 per share based on the unaudited financial statements as of September 2011. The dividend was paid in rupiah using the Indonesia Central Bank middle rate as of recording date (December 1st, 2011) at a conversion rate from USD to rupiah of Rp9,085/USD. Therefore, the amount of interim dividend paid in rupiah was Rp682,892,292,209.50 or Rp21.35 per share.
Change of the Board of Directors
On April 20th, 2011, Adaro Energy’s Extraordinary General Meeting of Shareholders also approved the appointment of the Board of Directors, for a five year term. Therefore, the Board of Directors is as follows:
President DirectorGARIBALDI THOHIRVice President DirectorCHRISTIAN ARIANO RACHMATDirectorANDRE J. MAMUAYADirectorSANDIAGA S. UNODirectorDAVID TENDIANDirectorCHIA AH HOODirectorM. SYAH INDRA AMAN
Closing Remarks
Adaro delivered on our guidance in 2011 with a strong operational and financial performance. We continue to improve our coal supply chain to realize efficiencies through project development and by moving downstream into power. We also made acquisitions in South Sumatra in order to diversify our product offerings and increase our reserve base.
We are pleased to have received national and international awards for our accomplishments during the year in the areas of corporate governance, environment, social welfare, and business and financial performance. All of these achievements demonstrate our efforts to create sustainable value to all of our stakeholders.
As a closing remark, I would like to extend my sincere appreciation to the Board of Directors, employees, customers and all of our stakeholders for their commitment and efforts during the year. We count on their ongoing trust and support to ensure our sustainable growth for the many years to come.
Edwin SoeryadjayaPresident Commissioner
On behalf of the Board of Commissioners,

Adaro Energy Annual Report 2011 www.adaro.com30
We view that adhering to our responsibilities as a corporation and acting fairly and equitably is not just the right thing to do, it is a social investment in our future success.
“
Garibaldi ThohirPresident Director & Chief Executive Officer
Dear Shareholders,
Letter From the Board of Directors
I am delighted to report the year 2011 was an extraordinary year of transformation and profitability for your company. We are even more excited and encouraged about our future plans and are convinced we are on the right track to build long term efficient assets that will create sustainable long term value, not only for our shareholders but also for our other key stakeholders such as our loyal employees, our communities and our country.
Here at Adaro Energy, our vision has real meaning and gives every team member the focus needed to succeed. With our performance in 2011, we moved one step closer to achieving our vision to be a leading Indonesian energy and mining company. We not only want to be a great company adhering to international standards, we are and we want to be known as a world class Indonesian company.
The year 2011 was the 20th year of uninterrupted annual production growth, a track record we are all very proud of. It was another great year operationally as we hit the top end of our targets and delivered record-breaking overburden and coal volumes, profits and cash flows. We focused on flawless execution. After many years of careful planning we are happy to report we succeeded in closing a number of important deals in 2011. And although we used considerable cash in making growth investments, we were able to not only further strengthen our capital structure, but also pay our shareholders a considerable cash
From Us to You | Letter from the Board of Directors2
Adaro Energy Annual Report 2011www.adaro.com 31
dividend. As we look forward, we plan to deliver further growth and sustainable value creation. To do that we are improving operations at Adaro Indonesia, continuing to put our customers first, diversifying our locations and products, and moving down stream into less risky power generation.
We are very proud of the team in South Kalimantan. Such dedication and hard work. Our mining contractor, SIS, has done very well in continuing to increase its production, now conducting about one third of Adaro’s mining. Our barging and logistics firm, MBP, is working up to 50% of Adaro’s barging and already delivers 50% of the floating crane volumes. It continues to get better each year.
Hitting Our Targets, Increasing our Size, Sustaining Our Track Record
In 2011, we produced 47.7 million tonnes of thermal coal, an increase of 13% over 2010, which included 5.4 million tonnes of our new product, E4000, sourced from our Wara pit within our long running Adaro Indonesia concession in South Kalimantan. This production result was towards the top end of our target range of 46-48 million tonnes.
We believe it is important to put the production performance of 2011 in the right context. In 2011, we added 5.5 million tonnes of coal production. While the rate of growth might not seem large, the actual volume is huge and is not far off the combined size of two average-sized Australian coal mines, which on average produce 3.5 million tonnes per year and can take three or four years to start.
With our performance in 2011, Adaro Indonesia retains its position as the operator of the largest single concession coal mine in not only Indonesia, but also, the southern hemisphere. We have maintained this growth for many years, even increasing the rate of growth as the mine increased in size and matured.
In terms of the performance of the company, we must also consider the task of overburden removal. There is no chance of coal production increasing unless we first remove and dispose of the overburden. Our track record over the past few years in terms of increasing overburden extraction and disposal, all of which is done in a safe, efficient and environmentally-friendly fashion that in most instances exceeds international best practices, has been remarkable and 2011 was no different. In 2011, we increased overburden extraction by 32% to 299 million bank cubic meters.
To give you a sense of the volume of overburden we removed in 2011, if we theoretically built a tower using 299 million bank cubic meters of overburden, where the base of the tower is the size of a typical football pitch, the tower would rise up into the stratosphere, a full 60 kilometers into the sky. Each bank cubic meter of overburden weighs approximately two tonnes.
But it is not just the weight and volume, it is also the long overburden hauling and coal hauling distances that make our production increases so remarkable. After extraction, the coal is transported along our privately held hauling road over distances averaging 75 kilometers to our Kelanis river terminal. From there, our coal travels another 240 kilometers to reach our open sea anchorage and transshipment area, called Taboneo, at the mouth of the Barito river, near Banjarmasin.
We hope our shareholders as well as other stakeholders can appreciate the huge scale of Adaro Indonesia’s operations and the enormous effort it takes to increase production every year. However, we have done it every year for twenty years and intend to continue. In order to maintain our dependable and reliable operations, which our customers demand, we are making significant investments in the infrastructure and human resources at Adaro Indonesia, as well as maintaining our close partnerships with our dedicated contractors, local communities and other stakeholders. But we also must diversify our locations and coal products so as to confirm to our long term loyal customers that we will continue to be their dependable and reliable supplier, now and in the decades to come.
As we grow aggressively to achieve our medium term target of 80 million tonnes, the large investments we are making to automate the overburden hauling and reduce consumption of diesel, to improve the infrastructure and the human resources, assure our customers that they can continue to rely on us. We will continue to adhere to the same high quality, safety and service standards our stakeholders have come to enjoy and we will not be distracted as we make growth investments and diversify into power and other coal deposits, from maintaining and further improving Adaro Indonesia, our core asset and main source of cash flows.
In terms of our average sales price, our marketing teams negotiated prices that slightly exceeded our target range. The product mix in 2011 had a greater portion of the E4000, which is our new lower priced, as well as lower cost, coal and we are delighted to report it is rapidly gaining acceptance by power plants throughout the Asian region.
Our Adaro Energy cash cost of US$41.21 per tonne came in slightly above our target range of US$38-US$40 per tonne. The reason for the 14% increase is due to higher than expected diesel fuel prices and longer overburden hauling distances, as well as increases in other costs associated with barging, crushing, consumables and maintenance.
Despite the increase in our cash cost, due to the robust pricing environment and the acceptance of the E4000, we were able to improve our EBITDA margin to 37%, and once again delivered the highest EBITDA margin in Indonesian coal. The fears that some of our shareholders had about the E4000 and its impact on our margins did not materialize. In fact we sometimes

Adaro Energy Annual Report 2011 www.adaro.com32
make as much EBITDA per tonne on the E4000 (Wara) coal as do on our E5000 (Tutupan) coal. We believe the long term outlook for E4000 is good and its acceptance also encourages us to make further investments in other sub-bituminous coal deposits in Indonesia.
As a result of the higher than expected average sales price, and our strong operational performance, our EBITDA increased 73.4% to US$1.47 billion, which exceeded our EBITDA guidance of US$1.1 – US$1.3 billion.
In order to maintain reliable and safe operations, we increased our capital expenditures. In 2011, we aimed for capital expenditures of US$625 million, with more than half to be spent on heavy equipment, and met our target.
Our Strategy
One of the achievements of 2011 was to improve our blueprint for the future. We revisited our assumptions and narrowed our focus. While our strategy has broadened since our listing in 2008, and it is no longer solely about increasing production and efficiency at Adaro Indonesia, it is still very focused. Everything we do is ultimately about creating maximum sustainable value from Indonesian coal.
It is a very good time to be in the coal business and to be Indonesian and we are even more encouraged as we work even harder and commit even more resources to achieving success. We will always aim for good returns, high margins, maintaining a strong balance sheet and on creating long-term low cost assets. We will not be reckless, we will consider all relevant opportunities and decide to invest based only on the merits of the transaction for Adaro.
Our goal is to become not only bigger but also better. We see a bright future for Adaro Energy and for our country.
Typically the coal mining business can be described as long term, capital intensive and slow yielding, and it requires specialized knowledge. We encourage our shareholders to also take a similar medium and long-term view, for example by looking at the next three to five years.
We believe since 2008 a structural change has occurred in the coal sector and the era of cheap coal is over. Our analysis suggests declining grades of coal qualities, more and costlier processing requirements, lengthening transportation distances and higher oil prices are leading to continual annual increases in producers’ costs, notably in important coal producing countries such as Australia, China and India.
This trend, when combined with strong demand growth in emerging market Asia, technological enhancements to upgrade low rank coal, advancements in power production that allow for the efficient use of previously unusable low rank coals and the lack of practical
energy alternatives, will sustain higher coal prices and create increasing and sustainable demand for the lower heat value sub-bituminous coal, of which we have been experts for the past 20 years.
As well as continuing to focus on consistent organic growth at Adaro Indonesia, we are also looking to increase our coal reserves and diversify in terms of location, products and license maturities. We are seeking to acquire large deposits of coal in Indonesia. We are aiming to have significant operations in what we have identified as the four main coal-producing provinces: South Sumatra, South Kalimantan, East Kalimantan and Central Kalimantan.
In terms of coal products, we want to be able to offer our forty nine customers, all of whom are end users, such as power plants and cement factories, the coal that will best meet their needs. We will do this while providing our industry-leading reliability and customer service that defines the Adaro brand name.
We are also keen to diversify our license maturities so we can mitigate the risk of our permits coming up for renewal at the same time.
We believe the acquisition strategy we have developed will allow us to grow our reserves and production at a more rapid and reliable pace. It brings assurance to our customers, who need to know that as we grow to 80 million tonnes in the medium term, their fuel supply needs will not be put in any kind of jeopardy.
As well as acquiring new coal deposits in Indonesia, we are also deepening our integration by moving downstream into power generation. We believe this move is a logical extension of our coal supply chain, which we finished integrating in 2009. Having succeeded in completing vertical integration from pit to port, we now wish to deepen our integration from pit to power. We see numerous benefits from moving into Indonesia’s power sector.
Building a Strong Organization: Our People and Winning Teams
In order to succeed, we must build a strong organization. We need to replicate what we have done at Adaro Indonesia, not just operationally but also organizationally. This means finding the right people and putting them in the right place. We recognize strengthening our organization and building a winning team will not be easy, but we are encouraged by the success of our recent growth. Back in 2005, we produced around 25 million tonnes and 100 million bank cubic meters of overburden, far less than what we produced in 2011. While production has escalated, so too has everything else. We are a larger but also a more complicated organization.
So building a strong organization means getting or developing and retaining the right people. This is so crucial and we are working hard on that front. In 2011, we added 2,000 graduates to our work force.
Letter of from Board of Director2

Adaro Energy Annual Report 2011www.adaro.com 33
There are two ways to get the right people. One way is to build from scratch the capabilities of our people and have success. This is effective but takes a long time. The other way is to hire the best of the best from Indonesia and all around the world. Here at Adaro we employ both strategies. We built the Adaro Institute, which opened on May 23rd, 2011, to help develop the skill set and quality of our workforce. We also hired many highly qualified experts, some of whom you will read about in this report.
We do not believe in superman or superwoman, we believe in a super team!
Our Philosophy of Value Creation and Decision Making
Adaro is a unique combination of the old and the new, Indonesian owned and operated, yet also employing and partnering with foreigners, conservative yet rapidly growing, the largest supplier to the domestic market but also a major exporter, tightly controlled by a group of Indonesian business groups, yet no one has majority control. Some people ask us, what makes Adaro work, what is the glue that holds it all together and creates such progress? How does Adaro approach creating value?
Our philosophy of creating value at Adaro is similar to the one our controlling shareholders have used when building other strong Indonesian companies: be an asset to the nation. This affects our decision making in many ways. We want to build a top class organization, one that always delivers operational excellence. We do not just want to be landlords that collect the rent. Our number one goal is to create maximum sustainable value from Indonesian coal by building a bigger and better Adaro Energy. This is how we are now and how we will continue to be an even bigger asset to the nation.
Four Indonesian families, and an individual businessman, through their four business groups, each own a minority stake in Adaro Energy, but together we own a combined 63% interest. The families each have Board representation and Adaro Energy is for each one their largest and most significant investment. The representatives of the four families spend every day working for Adaro Energy and they actively manage the business together with the other Board members, all of whom are independent professionals. We can function effectively because of the trust between us. We have been working together for over four decades. We all believe very strongly in consensus. This approach has made Adaro and is what helps makes it all work.
But at the same time it is challenging as everyone has a different mindset. Adaro Energy has evolved so much in the past few years. Right now the external environment is very supportive, and there are such great opportunities that could take us in so many different directions. We have a responsibility to our
shareholders and all of our stakeholders; therefore, we have to be careful not to go one bridge too far so to speak.
The thing that makes it all work for us, the thing that keeps us all working together is a shared passion for Adaro. Everything we do is all about what’s best for Adaro.
We as the Board must be the example for all the other winning teams in the organization. We must set the right tone and create the right culture so that our insistence on no politics can be seen and therefor better adhered to. The most valuable thing is a conducive culture. With a good culture, you cultivate productive supportive teams and from that comes increased shareholder value.
Being a Responsible Corporate Citizen
We believe our first duty is to all of our shareholders to create maximum sustainable value from Indonesian coal by building winning teams that create a bigger and better Adaro Energy. We believe creating shareholder value is not inconsistent with also doing the right thing by all of our other stakeholders. Adaro Energy must focus on building long-term low cost assets and on long-term value creation. We believe Adaro Energy’s long term and sustainable success will not be achieved overnight and without the support of multiple stakeholders. Given we are not a get-rich-quick organization, we must think of others, and also those that are less fortunate. We view that adhering to our responsibilities as a corporation and acting fairly and equitably is not just the right thing to do, it is a social investment in our future success.
Going Beyond Compliance
We are happy we continue to go “beyond compliance” in terms of our responsibilities to manage the environment, support local communities and to help develop the nation.
For the fourth year in a row, in 2011, we received the green level for the PROPER ranking from the Ministry of the Environment.
We remained the largest supplier to the domestic market. While we have always had to prioritize domestic market as part of the terms of our Contract of Work, recently Indonesia introduced a regulation called the Domestic Market Obligation, which requires coal miners to provide a certain percentage of their production to the local market. We are delighted we not only met our obligation, we exceeded it.
Our New Investments In Coal
In terms of creating maximum long-term value from Indonesian coal, we have incorporated acquisitions of Indonesian coal deposits into our strategy. In 2011, we spent US$377 million to acquire controlling stakes in

Adaro Energy Annual Report 2011 www.adaro.com34
Garibaldi ThohirPresident Director &
Chief Executive Offi cer
which improves operating effi ciency and reducing pit congestion, which we estimate lowers costs by 14% compared to smaller trucks.
Our Targets for 2012
In 2012, we are aiming for production of 50 to 53 million tonnes, with 8 to 10 million tonnes from our Wara pit, which is sold under the brand name E4000. Due mostly to a higher blended strip ratio, which we have decided to increase to 6.4x, we are guiding our Adaro Energy coal cash cost to be within a range of US$40 to US$45 per tonne. We view the increased spending on overburden removal as an investment in our future, not a cost increase. For EBITDA, we are expecting US$1.2 –to US$1.5 billion.
Capital Expenditures in 2012
Not including spending on the IMC or other acquisitions, we forecast our capital expenditures to range between US$650 million and US$700 million in 2012, with almost half, or US$325 million allocated to heavy equipment purchases. We also plan to spend US$150 million on the OPCC and the Kelanis expansion, US$50 million on the MSW power plant, US$15 million on our IBT coal terminal and US$50 million on our new coal deposit in South Sumatra, MIP. We are also expecting to spend US$75 million on routine maintenance.
Thank You
Finally, I would like to thank all of our stakeholders. In particular I would like to thank our dedicated and loyal workforce and contractors and our valued long term customers. I would also like to thank you, our shareholders, for your continued support as we aim to create maximum sustainable value from Indonesian coal and build a bigger and better Adaro Energy.
two coal deposits and a coal logistics company, all located in the coal-rich province of South Sumatra. We also bought a 10% stake in a large coal deposit in East Kalimantan, in which we hope to eventually acquire a controlling stake. These investments add to the fi rst coal acquisition we made, in March 2010, when we bought 25% in IndoMet Coal (IMC) for US$335 million.
In terms of our coal joint ventures, we made meaningful progress. The IMC, or IndoMet Coal, is a metallurgical coal project in Central Kalimantan 75% owned by BHP Billiton. During 2011, we improved the trust and confi dence building and were very encouraged with both the project and our partnership. BHP Billiton is doing a great job and we are happy to play our role. They announced a phased approach to development is planned, commencing in early 2012, with construction of a road and associated infrastructure in support of future mine development.
Our other ventures, which made good progress, were PT Mustika Indah Permai (MIP), a South Sumatran thermal coal deposit that we acquired in August of 2011 and PT Servo Meda Sejahtera (SMS), which owns a dedicated hauling road in South Sumatra, that we acquired a 35% stake in October 2011. We are proud of the achievements and progress made at MIP and SMS and we expect production to begin in 2012.
In developing successful joint ventures, we will rely heavily on the business model we developed over 20 years of successful operation in South Kalimantan and we look forward to these joint ventures commencing commercial operations.
Funding
We also had an excellent year in terms of accessing the funds we need to maintain and grow our business. In 2011, we were able to secure another “fi rst” when on July 4 we closed a US$750 million, ten year bank loan, the longest duration for a private sector deal in Indonesia. The challenge is how to manage suffi cient growth while also maintaining a strong balance sheet. In 2011, we grew and made acquisitions to spur future growth, yet we also improved the balance sheet with net debt to EBITDA of 1.05 times. We will be selective in making funding decisions and will concentrate on preserving our cash balance and maintaining our strong fi nancial structure, which is the strongest it has ever been.
Cost Reduction
To reduce the impact of higher strip ratios and high fuel costs, we have several strategies to improve effi ciency and cost control initiatives, including the US$212 million Overburden Crusher and Conveyor (OPCC) system, the US$160 million MSW mine-mouth power plant and the US$55 million Kelanis river terminal capacity expansion to 70 million tonnes a year. As well, we are also increasing average truck size,
Letter of from Board of Director2
On behalf of the Board of Directos,

Adaro Energy Annual Report 2011www.adaro.com 35
Distinguished Board of Commissioners
Acclaimed AchievementsIndonesian Entrepreneur Of The Year • Best CEO In Asia • Long Serving Executives Of Astra International Group • Senior Executive Of The Kuok/Kerry Group Investment • Distinguished
Government Economics Advisor • Successful Business Leaders In Their Own Right

Adaro Energy Annual Report 2011 www.adaro.com36
Indonesian Citizen, 62, was awarded his Bachelor of Business Administration degree from the University of Southern California in 1974 and is married with three children.
Mr. Soeryadjaya joined PT Astra International in 1978 and left as the Vice President Director in 1993. The Soeryadjaya family founded and owned Astra International from 1957 to 1992. He successfully spearheaded the financial restructuring of Astra from 1987 to 1990 and led Astra’s IPO in February 1990. Mr. Soeryadjaya was awarded ‘Indonesian Entrepreneur of the Year 2010’ by Ernst and Young, and in 2011 was listed in Ernst & Young World Entrepreneur of the Year Hall of Fame. A long-time proponent of education, he is active in the community through his roles as Chairman of Yayasan Universitas Kristen Indonesia and as Co-Founder of the William Soeryadjaya Foundation.
He is currently the President Commissioner of PT Adaro Energy, PT Adaro Indonesia and among others PT Saratoga Investama Sedaya, PT Pulau Seroja Jaya, PT Global Kalimantan Makmur, PT Lintas Marga Sedaya, PT Saratoga Sentra Business, PT Dianlia Setyamukti, PT Alberta Investama Sedaya, PT Mitra Global Telekomunikasi Indonesia, PT Pandu Dian Pertiwi, PT Saratoga Sedaya Utama, PT Saptaindra Sejati, PT Alam Tri Abadi, and PT Adaro Strategic Investments. He is also the Commissioner of among others, PT Bhaskara Utama Sedaya and PT Mitra Pinasthika Mustika.
Mr. Edwin SoeryadjayaPresident Commissioner
Running Adaro | Board of Commissioners3

Adaro Energy Annual Report 2011www.adaro.com 37
Indonesian citizen, 68, completed his education in Mechanical Engineering from the Bandung Institute of Technology in 1968.
He is the Vice President Commissioner of PT Adaro Energy, a Commissioner of PT Alam Tri Abadi, PT Adaro Indonesia, PT Jasapower Indonesia, PT Dianlia Setyamukti, and PT Adaro Strategic Investments, as well as the President Commissioner of PT Adira Dinamika Multifinance Tbk. He also serves as the President Director of PT Triputra Investindo Arya.
He started his career at Astra in 1969, as a General Manager of the Heavy Equipment Division (1971-1973), Marketing Director (1973-1976), Group Director (1977-1980), Vice President Director (1981-1984), President Director (1984-1998), Commissioner (1998-2000), elected as President Director (2000-2002) for the second time and then President Commissioner (2002-2005). He also held several key positions at PT United Tractors, including President Director (1977-1984) and Commissioner (1984-1999).
He was a prior member of the National Economic Board (1999-2000), Commissioner of PT Multi Bintang Tbk. (2002- 2007) as well as Commissioner of PT Unilever Indonesia Tbk (1999-2009). Mr. Rachmat was named “Best CEO 1994 in Asia” by CEO of the Year Europe and Asia 1994 Financial World.
Mr. Theodore Permadi RachmatVice President Commissioner

Adaro Energy Annual Report 2011 www.adaro.com38
Indonesian citizen, 69, completed his education at the Bandung Institute of Technology in 1969. He is a Commissioner of PT Adaro Energy, PT Alam Tri Abadi, PT Adaro Indonesia, PT Adaro Strategic Investments, and PT Dianlia Setyamukti. He is also the President Director of PT Persada Capital Investama.
He began his career at PT Astra International Tbk as a manager in 1969. He then joined PT United Tractors as a director in 1972 and President Director in 1984. He served as a Director (1979-1990), Vice President Director (1990-1998) and Commissioner (1998-2000), and Vice Chairman (2000-2006) of PT Astra International Tbk. He served as a President Director (1984) of PT United Tractors, before being appointed as commissioner and President Commissioner in 1997-1999. He was also the President Commissioner (1995-2001) and Commissioner (2001-2003) of PT Berau Coal.
Mr. Ir. SubiantoCommissioner
Running Adaro | Board of Commissioners3

Adaro Energy Annual Report 2011www.adaro.com 39
Malaysian citizen, 47, is a Commissioner of PT Adaro Energy and has had more than 15 years financial and corporate management experience within the Kuok Group of companies in Singapore, Thailand, Hong Kong, and China.
Currently oversees the Kuok Group’s investments and operations in Indonesia which include sugar cane plantations, sugar milling, flour milling and hotels. He also serves as a Director for PPB Group Berhad, a company listed on the KLSE, Malaysia.
Mr. Lim Soon HuatCommissioner

Adaro Energy Annual Report 2011 www.adaro.com40
Indonesian citizen, 72, he earned a Bachelor’s degree from the Bandung Institute of Technology in 1962 and a Dipl. Ing. Balistic Engineer from the University of Belgrade, Yugoslavian Military Science and Industry Institute in 1966 and Army ABRI Sesko education in 1979. He served in the army until 1981, retiring as Lieutenant Colonel.
He is an Independent Commissioner of PT Adaro Energy. He is also a member of the Audit Committee of PT Mahaka Media Tbk., Independent Commissioner and Chairman of the Audit Committee of PT Pembangunan Jaya Ancol Tbk, President Commisioner of PT Jakarta Propertindo, Head of Center for Entrepreneurship Development, Al Azhar Indonesia University (UAI), Independent Consultant of Corporate Governance, Internal Audit and Corporate Culture.
He served as a Manager, Director, and Commissioner for PT United Tractors Tbk from 1982 to 1998, Senior Vice President for Astra from 1989 to 1997, President Director for PT Astra Mitra Ventura from 1992 to 1997, Director for Asia Region for GIBB Ltd. from 1997 to 1999, and Executive Vice President for PT Raja Garuda Mas from 2000 to 2002.
Mr. Ir. Palgunadi Tatit SetyawanIndependent Commissioner
Running Adaro | Board of Commissioners3

Adaro Energy Annual Report 2011www.adaro.com 41
Indonesian citizen, 51, earned his Chemical Engineering degree from the Bandung Institute of Technology in 1984, and PhD in Economics in 1995 from Boston University, USA.
He is currently a member of The National Economic Committee (Komite Ekonomi Nasional) and an Independent Commissioner of Bank Central Asia. Previously held position as President Commissioner of PT Perusahaan Pengelola Aset (PPA) (2008-2009), after previously serving as Vice President Director of PT Perusahaan Pengelola Aset (2004-2008). In addition, he had held various positions in the Government and private sector, among others, the Special Staff of the Minister of Finance (2007-2010), the Secretary of Financial System Stability Committee (2008-2009), Chairman of Indonesia’s Infrastructure Development Financing (2004-2005), Special Staff of Coordinating Minister of Economy RI (2004-2005), Executive Director of PT Danareksa (2002-2004), Deputy Coordinator for Finance Minister Assistance Team, RI (2000-2004), Chief Economist and Head of Division of PT Danareksa (1995-2002), founder of Danareksa Research Institute (1995), Consultant at the World Bank (1994-1995), Consultant to the Asian Development Bank (2000-2001), Staff Planning in the Ministry of Industry (1985-1990), and Process Engineer at PT Pupuk Kujang / Fertillizer Industry (1985).
Dr. Ir. Raden PardedeIndependent Commissioner

Adaro Energy Annual Report 2011 www.adaro.com42
Experienced Management Team with Proven Track Record
Combined 75 years with Adaro
Energy
More than 135 years of
combined industry experience
Average 12 years with Adaro Energy
Benefits from experience and active participation of key shareholders’ representatives
High operating and safety standards
Prudent financial policies
Strong corporate governance and regulatory compliance
Running Adaro | Board of Directors3

Adaro Energy Annual Report 2011www.adaro.com 43
Indonesian citizen, 46, earned his Bachelor degree from the University of Southern California in 1988 and an MBA from Northrop University, Los Angeles, United States of America in 1989.
He is the President Director of PT Adaro Energy, PT Alam Tri Abadi, PT Adaro Indonesia, PT Dianlia Setyamukti, and PT Adaro Strategic Investments. President Commissioner of PT Jasapower Indonesia, PT Adaro Power, PT Mustika Indah Permai, PT Servo Meda Sejahtera, PT Bhakti Energi Persada, PT Adaro Mining Technologies, and Commissioner of PT Indonesia Bulk Terminal and a group of 7 CCOW companies in which Adaro holds a 25% JV interest with BHP Billiton (IndoMet Coal project) since 2010. He is also the President Director of PT Trinugraha Thohir, PT Padangbara Sukses Makmur and also serves as the President Commissioner of PT Trinugraha Food Industry, PT Wahanaartha Harsaka, PT Wahanaartha Motorent and is a Commissioner of PT Karunia Barito Sejahtera and PT Wahana Ottomitra Multiartha Tbk.
It is my personal responsibility to ensure we are doing the right thing for our communities. We had a great year, but there is still so much to do. As well as making the necessary expenditures for development programs and other initiatives, we also need to spend more time interacting with and being a part of our communities.
Mr. Garibaldi ThohirPresident Director & Chief Executive Officer“
(please see page 60, A Discussion with Mr. Garibaldi Thohir)

Adaro Energy Annual Report 2011 www.adaro.com44
Mr. Christian Ariano RachmatVice President Director & Deputy CEO
Indonesian citizen, 39, earned his Bachelor of Industrial Engineering from Northwestern University in 1995.
He is the Vice President Director of PT Adaro Energy, Director of PT Alam Tri Abadi, PT Adaro Indonesia, PT Dianlia Setyamukti, Orchard Maritime Logistics, PT Adaro Strategic Investments, and PT Triputra Investindo Arya. He is the Commissioner of PT Saptaindra Sejati, PT Indonesia Bulk Terminal, PT Jasapower Indonesia, PT Adaro Power, PT Mustika Indah Permai, PT Maritim Barito Perkasa, PT Harapan Bahtera Internusa, PT Bhakti Energi Persada, PT Adaro Mining Technologies and President Commissioner of PT Makmur Sejahtera Wisesa, and PT Adaro Logistics.
Past experience includes Business Analyst at A.T. Kearney (USA) (1995-1996), Operations Researcher and Supply Chain Manager of Toyota Motors (1996-1998) and Director at Triputra Group (1999-present).
“
Running Adaro | Board of Directors3
We are focused on people and reserves. Building a strong organization means getting and retaining the right people and putting them in the right place. Coal is a non-renewable resource, and while we have a lot of coal already, we must diversify into multiple coal provinces and at multiple sites.
(please see page 61, A Discussion with Mr. Christian Ariano Rachmat)

Adaro Energy Annual Report 2011www.adaro.com 45
Indonesian citizen, 41, completed his engineering education at the department of Industrial Mechanical Engineering of Tokyo Denki University (Japan) in 1994 and graduated from the American College, Los Angeles (USA) in Business Administration in 1996.
He is the Director of Corporate Affairs of PT Adaro Energy, President Director of PT Jasapower Indonesia, PT Adaro Logistics, PT Adaro Power, PT Adaro Mining Technologies, and Orchard Maritime Logistics. He also serves as a Director at PT Alam Tri Abadi, PT Adaro Indonesia, PT Mustika Indah Permai, PT Adaro Strategic Investments, PT Dianlia Setyamukti, and PT Persada Capital Investama.
He is also the President Commissioner of PT Bhimasena Power Indonesia – a consortium of JPower-Adaro-Itochu, PT Indonesia Multi-Purpose Terminal, and Commissioner of PT Saptaindra Sejati, PT Makmur Sejahtera Wisesa, PT Harapan Bahtera Internusa, PT Pandu Alam Persada, PT Adaro Persada Mandiri and PT Tri Nur Cakrawala. He served as a Director of PT Anugrahtimur Sejatiperdana from 1997 to 2000.
Mr. Andre J. MamuayaDirector, Corporate Affairs “ In the long term, we see power as an important
minority part of our revenues, providing good returns and more stability than coal as well as creating demand for low rank coals. We will consider the power projects, which commercially and politically make sense for us.
(please see page 143, A Discussion with Mr. Andre J. Mamuaya)

Adaro Energy Annual Report 2011 www.adaro.com46
Mr. Sandiaga S. UnoDirector, General Affairs “Indonesian citizen, 42, graduated Summa Cum Laude with a Bachelor of Business Administration from the Wichita State University in 1990 and obtained a Masters of Business Administration from George Washington University in 1992.
He is a Director of PT Adaro Energy, PT Alam Tri Abadi, and PT Adaro Indonesia. He is the founding partner of Saratoga Capital, a private equity firm he co-founded with Edwin Soeryadjaya in 1998. Saratoga Capital focuses its investments in natural resources and infrastructure opportunities in Indonesia and Southeast Asia. He also co-founded a boutique investment firm, PT Recapital Advisors in 1997.
He is also the President Commissioner of PT Indonesia Bulk Terminal and PT Adaro Persada Mandiri as well as Commissioner in PT Makmur Sejahtera Wisesa, PT Saptaindra Sejati, PT Jasapower Indonesia, and PT Mustika Indah Permai. He is the President Director of PT Saratoga Investama Sedaya, and Director in PT Dianlia Setyamukti, and PT Adaro Strategic Investments.
Since June 2010, Mr. Uno served as a member of the National Economic Council appointed by the President of Republic of Indonesia and he was the Chairman of the Indonesian Young Entrepreneurs Association (HIPMI) from 2005-2008.
“ Indonesia is a great place to be right now, and I believe we are just getting started. Indonesia’s GDP growth will one day rival and then surpass that of our larger faster growing regional neighbors such as India and China.
Running Adaro | Board of Directors3
(please see page 131, A Discussion with Mr. Sandiaga S. Uno)

Adaro Energy Annual Report 2011www.adaro.com 47
Indonesian citizen, 45, graduated with the Honors and Distinction in Economics and Marketing in 1989 and earned his MBA in Economics and Finance from the University of Illinois in 1991.
He is PT Adaro Energy’s Director of Finance, Chief Financial Officer and Director in PT Adaro Indonesia, PT Alam Tri Abadi, PT Jasapower Indonesia, PT Indonesia Bulk Terminal, Orchard Maritimie Logistics, PT Adaro Mining Technologies, and PT Bhimasena Power Indonesia. He also serves as Commissioner for PT Bhakti Energi Persada.
He has worked in the coal industry in Indonesia since 2003 with several CCA first generation companies. He formerly held senior level positions in several international banks and private equity firms in the US and Indonesia from 1991 to 2002 and from 2005 to 2006.
Mr. David TendianDirector & Chief Financial Officer “From the perspective of the finance department,
our greatest achievement was probably the US$750 million 10-year bank loan that we closed on July 4th, on the back of the challenges caused by the Euro crisis. I was also very pleased with our investments in South Sumatra as they are part of the drive to diversify and increase our reserves so as to create sustainable value from Indonesian coal.
(please see page 171, A Discussion with Mr. David Tendian)

Adaro Energy Annual Report 2011 www.adaro.com48
Mr. Chia Ah HooDirector & Chief Operations Officer
Malaysian citizen, 52, earned his Bachelor of Applied Science (Civil Engineering) from the University of Windsor (Canada) in 1984.
He is the Director of Operations of PT Adaro Energy, Director of PT Adaro Indonesia, PT Alam Tri Abadi, PT Jasapower Indonesia, PT Bhakti Energi Persada, and the President Director of PT Indonesia Bulk Terminal, and PT Mustika Indah Permai. He has been appointed as a Director in a group of 7 CCOW companies in which Adaro holds a 25% JV interest with BHP Billiton (IndoMet Coal project) since 2010. He has over 25 years experience in civil construction projects and open-cut mining projects throughout South East Asia. He joined Adaro in 1991 as Operations Manager of Kalimantan operations and held the position of General Manager of Adaro Indonesia from 1998 to 2005.
“
Running Adaro | Board of Directors3
We had a record year of operational and financial performance. I am happy that we continue to go “beyond compliance” in terms of our responsibilities to manage the environment, contribute to local communities and to help build the nation. For the fourth year in a row, we received the green level for the PROPER ranking from the Ministry of the Environment.
(please see page 98, A Discussion with Mr. Chia Ah Hoo)

Adaro Energy Annual Report 2011www.adaro.com 49
Board of Directors
Indonesian citizen, 44, earned his Law degree from the Faculty of Law, University of Indonesia in 1990 and his Lex Legibus Magister (LLM) from University of Washington, School of Law, in 1992. He is Director and Chief Legal Officer of PT Adaro Energy and Director in a group of 7 CCOW companies in which Adaro holds 25% JV interest with BHP Billiton (IndoMet Coal Project) since 2010. He is also a President Director in PT Adaro Persada Mandiri, and a Director in PT Adaro Logistics, PT Jasapower Indonesia, and PT Adaro Mining Technologies.
He also serves as the Commissioner of PT Indonesia Multi-Purpose Terminal, PT Adaro Power, PT Maritim Barito Perkasa, PT Harapan Bahtera Internusa, and PT Mustika Indah Permai. He previously worked as a practicing lawyer in Lubis Ganie Surowidjojo Law Firm and in Minang Warman Sofyan SH & Associates before joining Adaro in 1996 as a Chief Legal Officer.
Mr. M. Syah Indra AmanDirector & Chief Legal Officer “ We view adhering to our responsibilities as a
corporation, being fair and equitable, is not just as the right thing to do, it is an investment in our future success.
(please see page 87, A Discussion with Mr. M. Syah Indra Aman)

Adaro Energy Annual Report 2011 www.adaro.com50
Running Adaro3
Our Senior Managers
Building Winning Teams for
Running Adaro 3

Adaro Energy Annual Report 2011www.adaro.com 51
Our Senior Managers
A Bigger And Better Adaro Energy

Adaro Energy Annual Report 2011 www.adaro.com52
HumanResourcesManagement
We believe that our employees are our most critical assets as we continue to create maximum sustainable value from Indonesian coal. The importance of our people is reflected in the theme of our President Director’s message of 2012, “Build a Winning Team for a Bigger and Better Adaro”.
All our employees are treated equally regardless of their country of origin, race, gender, religion and age. We aim to create a favorable environment for our employees to excel in a high-growth environment. We work hard to establish various programs with the aim to attract and retain talented people, and develop their knowledge, skills and loyalty at all levels and by doing so provide future leaders for the Company.
Our employees are our most critical assets as we continue to create maximum sustainable value from Indonesian coal
Djohan NurjadiHRGA & IT GM
Djohan has over 16 years of experience in Human Resources Management. Prior to joining Adaro Energy in 2008, he held senior positions in ERA Indonesia and PT Hero Supermarket Tbk. Djohan has a degree in mechanical engineering from Trisakti University.
In this Chapter
Running Adaro | Human Resources Management3

Adaro Energy Annual Report 2011www.adaro.com 53
The importance of our people is reflected in the theme of our President Director’s Message of 2012 “Build a Winning Team for a Bigger and Better Adaro”
Adaro Institute was officially opened on May 23rd 2011 to develop the skills level as well as instill the highest of ethical and social standards through-out Adaro Energy.
The number of permanent employees at Adaro Energy increased 20% to 7,630 employees.
A Snapshot of Adaro Energy
From Us to You
Running Adaro
Management Report
Owning Adaro
Governing Adaro
Financial Report
Additional Information
1
2
3
4
5
6
7
8
04
26
35
68
144
152
164
269
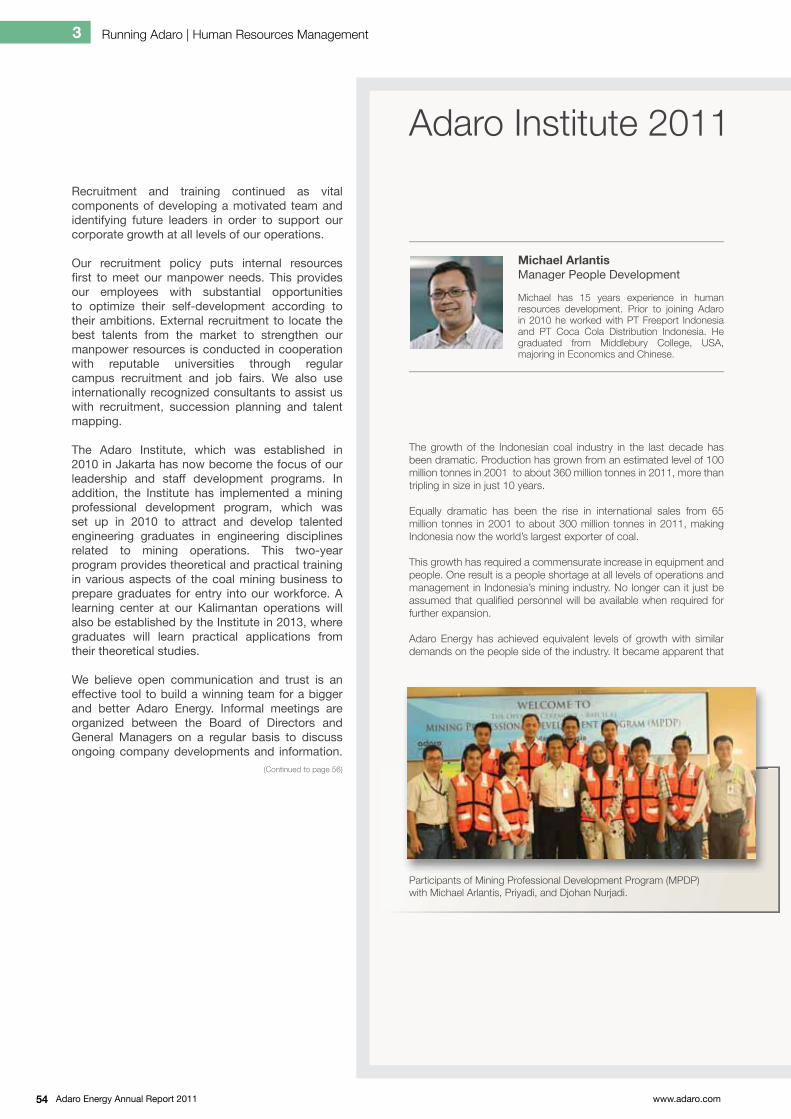
Adaro Energy Annual Report 2011 www.adaro.com54
Recruitment and training continued as vital components of developing a motivated team and identifying future leaders in order to support our corporate growth at all levels of our operations.
Our recruitment policy puts internal resources fi rst to meet our manpower needs. This provides our employees with substantial opportunities to optimize their self-development according to their ambitions. External recruitment to locate the best talents from the market to strengthen our manpower resources is conducted in cooperation with reputable universities through regular campus recruitment and job fairs. We also use internationally recognized consultants to assist us with recruitment, succession planning and talent mapping.
The Adaro Institute, which was established in 2010 in Jakarta has now become the focus of our leadership and staff development programs. In addition, the Institute has implemented a mining professional development program, which was set up in 2010 to attract and develop talented engineering graduates in engineering disciplines related to mining operations. This two-year program provides theoretical and practical training in various aspects of the coal mining business to prepare graduates for entry into our workforce. A learning center at our Kalimantan operations will also be established by the Institute in 2013, where graduates will learn practical applications from their theoretical studies.
We believe open communication and trust is an effective tool to build a winning team for a bigger and better Adaro Energy. Informal meetings are organized between the Board of Directors and General Managers on a regular basis to discuss ongoing company developments and information.
Adaro Institute 2011
The growth of the Indonesian coal industry in the last decade has been dramatic. Production has grown from an estimated level of 100 million tonnes in 2001 to about 360 million tonnes in 2011, more than tripling in size in just 10 years.
Equally dramatic has been the rise in international sales from 65 million tonnes in 2001 to about 300 million tonnes in 2011, making Indonesia now the world’s largest exporter of coal.
This growth has required a commensurate increase in equipment and people. One result is a people shortage at all levels of operations and management in Indonesia’s mining industry. No longer can it just be assumed that qualifi ed personnel will be available when required for further expansion.
Adaro Energy has achieved equivalent levels of growth with similar demands on the people side of the industry. It became apparent that
Participants of Mining Professional Development Program (MPDP) with Michael Arlantis, Priyadi, and Djohan Nurjadi.
Michael ArlantisManager People Development
Michael has 15 years experience in human resources development. Prior to joining Adaro in 2010 he worked with PT Freeport Indonesia and PT Coca Cola Distribution Indonesia. He graduated from Middlebury College, USA, majoring in Economics and Chinese.
(Continued to page 56)
Running Adaro | Human Resources Management3

Adaro Energy Annual Report 2011www.adaro.com 55
Adaro Institute 2011
to continue its growth path Adaro will have to develop and grow its own operator and staff skills.
The decision was made to set up the Adaro Institute for this training and development. Suitable and senior staff were recruited or reallocated from within the Adaro organization for the Institute, facilities were established and the Jakarta training and development center was offi cially opened on the 23rd of May 2011. In his opening address, Mr. Teddy Rachmat stressed that the aims of the Institute were to develop the skills level of all employees and to instill the highest of ethical and social standards throughout Adaro Energy.
During the year, Adaro Institute launched many key training and development programs for Adaro employees, selected graduates, and prospective students. A total of 4,624 training employees participated in basic leadership and managerial capability development programs in 2011.
Employee Development Programs
In Basic Competency Development, Adaro Institute provided training for Value-Driven Capability, English Profi ciency and Computer Literacy. The Institute conducted 47 batches of basic-value driven courses to 946 participants. There were 54 employees who passed the English Profi ciency training from six different levels of profi ciency with each level running for seven months. In 2011, we conducted for the fi rst time in-house computer training for Microsoft Offi ce modules with a total of 250 participants learning how to use the modules at various levels.
The Institute has trained 1,137 employees in leadership modules and 1,167 employees in managerial competencies, exceeding the 948 targeted employees. As part of professional competency development, the Institute also assists Adaro Energy and Adaro
Indonesia in organizing training for project management, presentation skills and human resources. In addition, it also assists other subsidiaries within Adaro Group in other non-technical and technical competency based training subjects.
Graduate Development Programs
The Mining Professional Development Program (MPDP) is an initial development program designed for identifying and developing talented S1 graduates from various engineering backgrounds, including mining, geology, geotech and civil. The Institute initiated the program in January 2011 and has recruited two batches with a total of 22 participants. The graduates have been learning the various aspects of the coal mining industry from pit to port, including mine exploration, exploitation, health, safety, environmental and production statistical analysis. The curriculum is designed not only for in-class learning of the operational aspects on a theoretical basis, but also on practical and experimental learning. The program participants also learn leadership and managerial aspects to improve their soft skills in managing people and business situations. Adaro Institute plans to source and develop two more batches in anticipation of future business needs as we continue to grow in 2012. The Institute also expects to launch another program for graduates with a focus on marketing.
Internship Program
Adaro Institute believes that by having a well-structured internship program, we will be able to identify and select potential talent from an early stage. In 2011, Adaro Institute also launched the revised Adaro Internship Program (AIP) to strategically develop students during the program and source potential talent for future business needs. Since the program was revised and re-launched, the Institute has accepted 19 internship participants in various functions, from mining operations to administration, with fi ve of them coming from overseas.
President Director, Garibaldi Thohir, and Director of Operations, Chia Ah Hoo, at the opening of Adaro Institute

Adaro Energy Annual Report 2011 www.adaro.com56
exchange to promote synergy. The Board of Commissioners and Directors also meets with all levels of staff during various events each year to communicate management’s objectives and goals and reinforce team spirit.
We benchmark ourselves against other coal mining and energy companies to ensure that our policies are in-line with industry best practices, using consultants to assist us with audits on remuneration and job satisfaction levels. The success of our programs in 2011 can be judged by our workforce
Adaro Energy’s HR, GA and IT Team
retention rate of 97%, which was better than the industry standard.
Since the early days of its operations, Adaro has consistently created a working environment that values togetherness among employees and between employees and management. This philosophy has been the foundation for building our winning team and will continue to be our focus for the future.
Lanny Anggraeni HRGA Deputy GM
Lanny has over 15 years of experience in Human Resource Management and Operations. Prior to joining Adaro in 2011 she worked with Nokia Indonesia, Johnson & Johnson Indonesia, and Nutrifood Indonesia. Lanny has an MBA degree in HR Management from University of Illinois at Chicago, USA, and a Management degree from Tarumanagara University.
2009
1.40
1.97
2.47 97% 95%
2010 Adaro Energy
Others2011
Adaro Energy Training Cost (US$ million) Our retention rate is higher than the industry standard in 2011
Running Adaro | Human Resources Management3
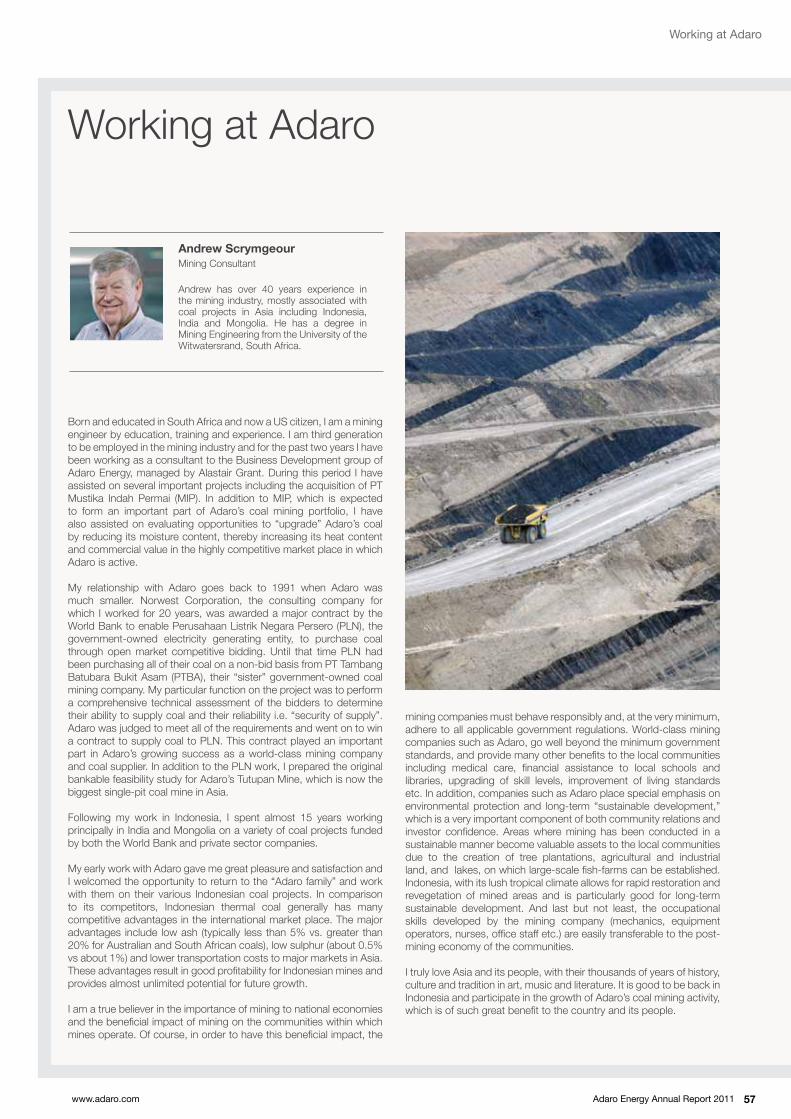
Adaro Energy Annual Report 2011www.adaro.com 57
Born and educated in South Africa and now a US citizen, I am a mining engineer by education, training and experience. I am third generation to be employed in the mining industry and for the past two years I have been working as a consultant to the Business Development group of Adaro Energy, managed by Alastair Grant. During this period I have assisted on several important projects including the acquisition of PT Mustika Indah Permai (MIP). In addition to MIP, which is expected to form an important part of Adaro’s coal mining portfolio, I have also assisted on evaluating opportunities to “upgrade” Adaro’s coal by reducing its moisture content, thereby increasing its heat content and commercial value in the highly competitive market place in which Adaro is active.
My relationship with Adaro goes back to 1991 when Adaro was much smaller. Norwest Corporation, the consulting company for which I worked for 20 years, was awarded a major contract by the World Bank to enable Perusahaan Listrik Negara Persero (PLN), the government-owned electricity generating entity, to purchase coal through open market competitive bidding. Until that time PLN had been purchasing all of their coal on a non-bid basis from PT Tambang Batubara Bukit Asam (PTBA), their “sister” government-owned coal mining company. My particular function on the project was to perform a comprehensive technical assessment of the bidders to determine their ability to supply coal and their reliability i.e. “security of supply”. Adaro was judged to meet all of the requirements and went on to win a contract to supply coal to PLN. This contract played an important part in Adaro’s growing success as a world-class mining company and coal supplier. In addition to the PLN work, I prepared the original bankable feasibility study for Adaro’s Tutupan Mine, which is now the biggest single-pit coal mine in Asia.
Following my work in Indonesia, I spent almost 15 years working principally in India and Mongolia on a variety of coal projects funded by both the World Bank and private sector companies.
My early work with Adaro gave me great pleasure and satisfaction and I welcomed the opportunity to return to the “Adaro family” and work with them on their various Indonesian coal projects. In comparison to its competitors, Indonesian thermal coal generally has many competitive advantages in the international market place. The major advantages include low ash (typically less than 5% vs. greater than 20% for Australian and South African coals), low sulphur (about 0.5% vs about 1%) and lower transportation costs to major markets in Asia. These advantages result in good profitability for Indonesian mines and provides almost unlimited potential for future growth. I am a true believer in the importance of mining to national economies and the beneficial impact of mining on the communities within which mines operate. Of course, in order to have this beneficial impact, the
mining companies must behave responsibly and, at the very minimum, adhere to all applicable government regulations. World-class mining companies such as Adaro, go well beyond the minimum government standards, and provide many other benefits to the local communities including medical care, financial assistance to local schools and libraries, upgrading of skill levels, improvement of living standards etc. In addition, companies such as Adaro place special emphasis on environmental protection and long-term “sustainable development,” which is a very important component of both community relations and investor confidence. Areas where mining has been conducted in a sustainable manner become valuable assets to the local communities due to the creation of tree plantations, agricultural and industrial land, and lakes, on which large-scale fish-farms can be established. Indonesia, with its lush tropical climate allows for rapid restoration and revegetation of mined areas and is particularly good for long-term sustainable development. And last but not least, the occupational skills developed by the mining company (mechanics, equipment operators, nurses, office staff etc.) are easily transferable to the post-mining economy of the communities.
I truly love Asia and its people, with their thousands of years of history, culture and tradition in art, music and literature. It is good to be back in Indonesia and participate in the growth of Adaro’s coal mining activity, which is of such great benefit to the country and its people.
Working at Adaro
Andrew ScrymgeourMining Consultant
Andrew has over 40 years experience in the mining industry, mostly associated with coal projects in Asia including Indonesia, India and Mongolia. He has a degree in Mining Engineering from the University of the Witwatersrand, South Africa.
Working at Adaro

Adaro Energy Annual Report 2011 www.adaro.com58
Educational Background Doctorate Master Degree Bachelor Degree Diploma High School Grand Total
PT Adaro Explorasi Indonesia 10 10
PT Adaro Energy 31 91 15 8 145
PT Adaro Indonesia 1 14 284 100 409 808
PT Adaro Power 2 7 9
PT Alam Tri Abadi 1 7 32 2 1 43
PT Indonesia Bulk Terminal 1 54 8 216 279
PT Indonesia Multi Purpose Terminal 1 2 2 5
PT Jasapower Indonesia 7 1 1 9
PT Makmur Sejahtera Wisesa 2 44 4 56 106
PT Mustika Indah Permai 1 10 1 12
PT Sarana Daya Mandiri 1 17 11 29
PT Saptaindra Sejati 858 456 4,243 5,557
Coaltrade Services International 5 3 8
PT Maritim Barito Perkasa 7 42 36 487 572
Adaro Bangun Negeri Foundation 28 10 38
Grand Total 2 67 1,491 625 5,445 7,630
10,625
2,539
13,164
Engineer
Non Engineer
8,324
16,611
Kalimantan Origin
Non Kalimantan Origin
2011201020092008
7,630
6,242
4,2464,237
Engineer vs. Non Engineer (Permanent and Contract)
Number of Permanent Employees at Adaro Energy
Total Contractor - Kalimantan origin vs Non Kalimantan origin
8,287
Audit Committee
Board of Commissioner
President Director& Chief Executive Officer
Vice President Director & Deputy CEO
Corp. Planning GM
Director & Chief Financial
Officer
MarketingDirector
Senior Counsel
Legal
GM CorporateSecretary
GM BusInessDevelopment
Director, General Affairs
Group Marketing &Commercial
Director
Director & Chief Legal
Officer
Director, Corporate Affairs
Director & Chief Operations Officer
Technical Advisor
Chief CSROfficer
GM ExternalRelation
GM CorporateInternal Affair
GM InternalAudit
GM CorporateFinance
Sr. VP CorporateFinance
GMInvestor Relation
MiningOperations &
Logistic
TechnicalAdvisorProject
GM HRGA-ITGM HSEGM
Finance &Accounting
Our Organization Structure
Our Employee Educational Background
Running Adaro | Human Resources Management3

Adaro Energy Annual Report 2011www.adaro.com 59
Visit Our Current Job Opening at: www.adaro.com/career
Adaro focuses on the continuous development of its employees as key assets of the Company, and ensures smooth successions of key people for sustainable long term growth and development.
We are always on the look out for individuals with the passion and drive to be part of our team that thrives on team work, commitment and exellence to create a better future.

Adaro Energy Annual Report 2011 www.adaro.com60
What is Adaro’s vision for the future?
Unlike what I believe perhaps happens at some other companies, here at Adaro Energy, the words of our vision have real meaning and give every member of our winning teams the focus needed to succeed. With our performance in 2011 we moved one step closer to achieving our vision to be a leading Indonesian mining and energy group. We adhere to and for the most part exceed international standards; however, we are proudly Indonesian and are focused on Indonesian coal.
What is your dream for Adaro Energy?
There is still so much work to do, but I believe we are on track to become amongst Indonesia’s fi rst Global 500 companies (Fortune magazine’s equivalent of the Fortune 500, except it is global). We have been consistent in implementing our strategy over the past several years. As mining shareholders, we know our dream will not occur over night; however, with our proven business model and with our winning teams, we are one step closer to realizing our dream.
One of your personal key priorities is community relations - how do you view Adaro’s performance in this area?
It is my personal responsibility to ensure we are doing the right thing for our communities. We had a great year, but there is still so much to do. As well as making the necessary expenditures for development
programs and other initiatives, we also need to spend more time interacting with and being a part of our communities. While I believe the level of interaction with the community members is good, I want it to improve and become even more hands on.
What do you see as your main challenge?
The biggest challenge is facing and solving the social problems, which in some cases is probably the side effect of a fast growing economy. Indonesia is getting richer but we have to be mindful of the income gap and that it does not widen too much further. I see it as absolutely necessary that as we build a bigger and better Adaro Energy and create long term shareholder value that we ensure sustainable value creation and make the necessary social investments. Like in everything we do, there must be balance. Social problems are complicated and not technical in nature so we must always be very mindful.
How will you meet this challenge?
I believe in our business model. I believe it has created tremendous sustainable value since operations began in 1992. I believe as we make acquisitions and develop coal deposits elsewhere in Indonesia that we will not only make good profi ts, but also will bring huge social benefi ts to the communities. The multiplier effect on local economies from our existing and new mines and the power plants we are building is huge, as well as the large amount of employment, taxes and royalties that our operations generate.
A DiscussionMr. Garibaldi Thohir,President Director &Chief Executive Offi cer
with

Adaro Energy Annual Report 2011www.adaro.com 61
A DiscussionMr. Christian Ariano Rachmat,Vice President Director &Deputy CEO
with
What do you want for Adaro Energy?
I want to build a great company.
How are you going to do that?
We aim to create maximum sustainable shareholder value from Indonesian coal by making a bigger and better Adaro Energy. This means continued annual production growth from Adaro Indonesia, improved coal supply chain effi ciency through better and increased vertical integration and investments, including moving downstream into power, and increased coal reserves though exploration and acquisitions.
What is your number one focus?
We are focused on people and reserves. We are getting closer with reserves with the successful acquisitions we carried out in 2011. Coal is a non-renewable resource, and while we have a lot of coal already, we must diversify into multiple coal provinces and at multiple sites.
In terms of people, we must build a strong organization. We need to replicate what we’ve done at Adaro Indonesia, not just operationally but also organizationally. This means fi nding the right people and putting them in the right place.
So building a strong organization means getting or developing and retaining the right people. This is so crucial and we are working hard on that front. In 2011, we added 2,000 graduates to our work force. There are two ways to get the right people. One is, like Astra International, to build from scratch the capabilities of your people and have great success. This is effective but it also takes a long time. The other way, is like what Mr. Lee Kwan Yew did in developing Singapore, which is to hire the best of the best from Indonesia and all around the world.
What acquisition opportunities are you looking at?
We are currently assessing different opportunities to acquire large coal deposits in Kalimantan. The opportunities that are available play to our competitive advantage and two decades of experience (low-rank, inland coal mines). We will consider all relevant opportunities and decide based only on the merits of the transaction for Adaro. We are in no rush, we have large reserves already, and we will be very selective.
What is your passion?
I am a happy person and a family man; I feel blessed. I know it sounds boring, perhaps even cliché, but it is the truth: my work is my passion.

Adaro Energy Annual Report 2011 www.adaro.com62
Investing in Our Communities
4 Running Adaro | Investing in Our Communities
In this Chapter

Adaro Energy Annual Report 2011www.adaro.com 63
We are fully aware that coal is a non-renewable natural resource that must be managed and used wisely and effi ciently to create optimum benefi ts for all stakeholders, including the communities living around the mine area and adjacent operations. Garibaldi Thohir, our President Director has declared, “the proper and responsible management of natural resources, including coal, will generate benefi ts for the future generation”.
By championing the principles of mutual respect, partnership, long-term and sustainable commitment, Adaro’s Corporate Social Responsibility (CSR) programs encompass four key areas, i.e. economic development, educational enhancement, health improvement, and social cultural promotion. The aim is to support the
enhancement of community welfare that will ultimately lead to the creation of sustainable and independent post-mine communities. We also attempt to preserve the environment, create a productive community and be a good local partner through all our programs. In 2011, Adaro Energy and its subsidiaries allocated Rp91 billion (~US$10 million) for these programs.
We established Adaro Bangun Negeri (YABN), a non-profi t foundation responsible for creating a self-suffi cient community during and after Adaro’s operations, as well as working together with the regional government to support our community empowerment and mine closure planning program. We use various Governmental regulations as well as ISO 26000 as references for program implementation. We also employ the Global Reporting Initiative (GRI) as guidance for reporting.
In 2011, our CSR and environmental programs gained recognition from both national and international institutions. We won a total of seven awards (2 platinum awards, 2 gold awards and 3 silver awards) from the Ministry of Social Affairs in collaboration with Corporate Social for Community Development. We also won four awards in recognition of our CSR and environmental programs from the Coordinating Ministry of People’s Welfare. In addition, we received international recognition called Asia Responsible Entrepreneurship Award for our Maternal, Newborn & Child Health Program from Enterprise Asia.
Mohammad EffendiChief CSR Offi cer Adaro Energy,Director Adaro Power
Effendi joined Adaro in 2010. He is in charge of Adaro Group’s CSR programs and implementation including developing Adaro Bangun Negeri Foundation. Effendi is also one of directors in Adaro Power. He previously worked for Unilever Indonesia as Vice President Supply Chain and received his Electrical Engineering degree from ITB.
Adaro Energy and its subsidiaries allocated Rp91 billion (~US$10 million) to invest in our communities in the area of economic, educational, health and social cultural development.
Our corporate social responsibility and environmental programs gained numerous recognitions from both national and international institutions.
Rel
ated
Info
rmat
ion
116 Environmental Management
118 Paringin:Our Responsibility to Environment and Communities
120 Update on Biodiesel fuel Pilot Project
Map of our corporate social responsibility programs
A Snapshot of Adaro Energy
From Us to You
Running Adaro
Management Report
Owning Adaro
Governing Adaro
Financial Report
Additional Information
1
2
3
4
5
6
7
8
04
26
35
68
144
152
164
269

Adaro Energy Annual Report 2011 www.adaro.com64
Adaro Bangun Negeri Foundation:
Our Future is the future of the Communities
As a company that manages non-renewable natural resources, we are well aware that our existence within the communities surrounding our mine area is not perpetual. Therefore, in 2009 we established a non-profit foundation, Adaro Bangun Negeri Foundation to make long term and strategic contributions by supporting Adaro’s CSR activities to ensure sustainability. The foundation implements CSR activities in the area of economic, educational, health, and social cultural development and share the same focus as Adaro’s CSR activities. Some of the programs designed to attain this focus are:
Health
In order to ensure our alignment with the Millenium Development Goal targets, sustainability of programs and to ensure effective implementation of our programs, Adaro implements its health programs based on the notion that health standards are strongly connected to local life styles and cultures. This means, changing a culture cannot be attained by merely implementing an activity in a single community or group but has to be widespread. Therefore, in 2011, Adaro launched its Maternal, Newborn & Child Health Program program with the focus of building Centers for Parental Education and the revitalization of Integrated Health Service Centers with coverage area of 10 villages for each center.
In addition, we also conducted coaching activities for School Health Units in 16 schools and cultivated a culture of healthy living through a Clean and Healthy Behavior program in 11 villages.
Corporate Social Responsibility Programs
Some highlights of projects that we have recently implemented include:
a.) Increase the communities’ source of income by taking into account the local potential and culture
The activities promoted to increase the communities’ income consist of Rural Economic Movement, Independent Village Development, Top-Quality Rubber Plantation Development, and business coaching in the areas of agriculture, handicrafts, business and regional flagship products.
Since micro, small, and medium enterprises often have difficulty in accessing finance, we established a microfinance institution named Banua Bauntung Microfinance Institute. We established this Microfinance Institute in 2005 to provide serious entrepreneurs and potential entrepreneurs of small businesses with easy access to financing. This institution now has three branches in different regencies and had disbursed Rp49.2 billion to 26,344 customers as of December 2011.
The three most successful businesses that have enjoyed this financing benefit are “Tiga Wanyi” in honey trading; “Makmur Jaya” in fisheries; and “Riser Service” who provides electrical services. These three enterprises have all received awards from the Coordinating Ministry of Peoples’ Welfare and the Ministry of Social Affairs of Indonesia for their success in developing small businesses.
4
AbdurrahmanCSR Department Head
Abdurrahman has over 20 years experience in community development and environmental project. Prior to joining Adaro in 2006, he worked at Centre for Agribusiness Development, Indoprima Advise Management, and Dharma Bhakti Astra Foundation. He has a Degree in Agricultural and Resources Economic, from Bogor Agricultural University (IPB).
Running Adaro | Investing in Our Communities
In 2008 we applied for a loan to LKM Banua Bauntung, a microfinance institution fostered by PT Adaro Indonesia as initial capital to open a drinking water refill station business. Our business has grown rapidly since. We are grateful to be able to start and develop the business as it is today because of Adaro through its fostered LKM. LKM Banua Bauntung has good service and we hope that it can expand its service to small entrepreneurs.
We Grow Because of Adaro“
Owner of Drinking Water Refill Station “Rezky Ajib”
Abdul Karim

Adaro Energy Annual Report 2011www.adaro.com 65
b.) Enhance human resources quality and utilize the region’s economic potential
We recognize the strategic role of human resources in accelerating the nation’s development. Therefore, enhancement of human resources quality is included in the strategy to transform non-renewable resources into renewable resources. We pursue this with various activities such as improving teacher quality, upgrading the quality of schools, improving educational infrastructures, supporting nine-year compulsory education and environment-oriented schools, supporting teachers’ participation in the national teacher conference, supporting an extensive scholarship program, and establishing a house of learning.
The “Saraba Kawa” house of learning is a learning center for the youth of Tabalong Regency of South Kalimantan province to express their creativity and to learn to build intellectual, critical, social, and independent qualities.
Established in 2010 under collaboration of the Adaro Bangun Negeri Foundation and a local NGO, this learning center provides a variety of activities through facilities such as a library, multimedia center, creative center, appreciation center, and care center. Currently, around 800 people, including students – primary school to college, professionals, and susceptible groups or uneducated children are registered as members.
To ensure sustainability and self-sufficiency, “Saraba Kawa” runs profit generating units such as an internet cafe and online payment system for electricity and telephone bills. It also produces and markets recycled handicraft from unused materials. Saraba Kawa will open new branches in other areas surrounding Adaro’s operations to reach more community members.
Education
In 2011, Adaro built an Early Childhood Education Center to be a model education center for others in the area as we believe that character building should be started early in life. This education center also provided coaching to 9 other early childhood centers. Currently, 180 young children are educated in 10 centers in 10 districts of Tabalong regency.
In addition to this activity, Adaro also develops other educational programs specifically designed for elementary schools, middle schools, teachers and school principals, village libraries, and school libraries.
Economy
Economic development activities are conducted by the business development unit, which focuses on agribusiness development, the development of micro, small, and medium enterprises running handicraft and service businesses and the development of rural food and energy security.
As a concrete expression of our intention to be good corporate citizen, Adaro interacts with the local communities through active participation in social activities such as the religious activities during Ramadhan, Eid-ul Adha and on the Social Solidarity Day.
Infrastructure Development as the “Heritage” for the Communities
Being aware of the communities’ needs for Islamic religious facilities, Adaro is constructing an Islamic Center in Tabalong that will consist of a grand mosque, hajj manasik (hajj practice) facility consisting of Tawaf, Jumroh and Sai, and other facilities to support Islamic evangelical activities. The complex will be completed in 2012. In collaboration with Tabalong community and Indonesian Council of Ulemas (Majelis Ulama Indonesia), Adaro is also preparing a professional institution to be responsible for management of the Islamic Center. In 2012, Adaro also plans to build a new hygenic traditional market and a multi-purpose building in Paringin district. These facilities are expected to contribute to the economic growth of Balangan regency and the surrounding areas.
Adaro Bangun Negeri Foundation: Our Future is the future of the Communities
after I was directly involved in one of Adaro’s social responsibility programs. PT Adaro Indonesia continues to support the Seraba Kawa house of learning center to enhance the quality of young people at Tabalong Regency to express their creativity and build their. intellectual qualities.
“I used to see Adaro as
environmental offender, but I
changed my view “NGO Founder and Executive Director of Seraba Kawa Learning Center
Firman Yusi
Adaro provided school libraries for high school students

Adaro Energy Annual Report 2011 www.adaro.com66
Scholarship Program
Scholarship for Tertiary Education (Beasiswa Utusan Daerah - BUD)
2011 marked the second year we granted university scholarships to qualified students from our neighboring communities of Balangan, Tabalong, and Barito to pursue college education at Bogor Agricultural University in Bogor, West Java or Lambung Mangkurat University in Banjarmasin. Our objective is to optimize the potential of the region’s best students with the hope that these students will return to their home villages once they complete their education and develop the communities with their skills.
The courses and skills offered are aligned with the needs of the regions, so that the program will support the acceleration of the region’s development. For the students choosing to study at Bogor, the majors offered are related to general agriculture such agronomy, and horticulture, forest product technology, land resources management, community development, and resources and environmental economics. Meanwhile, Lambung Mangkurat University at Banjarmasin offers a medical school program.
A total of 37 students are now enrolled at the two universities with the scholarships covering education and living costs for a 5 year period. On top of the Scholarship for Regional Representatives programs, we also provide other scholarships, i.e. scholarship for high achievers, scholarship for less fortunate students, scholarship for model schools, scholarship for Holy Qur’an memorization, and scholarship for indigenous peoples.
Teacher Quality Enhancement through National Teacher Conference
We realize the critical role that teachers hold in uplifting the education process, thus we have a number of programs that contribute to teachers’ quality enhancement. One of them is by facilitating the participation of the best teachers from our neighboring area in an annual National Teachers Conference.
The conference took place in November 2011 in Atmajaya University, Jakarta. We sent 30 teachers from two regencies in South Kalimantan, and one regency in Central Kalimantan. In order to participate in this program, the teachers went through a selection process held in collaboration with local education offices. The selection included essay writing and other achievements.
Community Skills Training for Mine Jobs
Our subsidiary, PT Saptaindra Sejati (SIS), offers an Operator Preparation Program (OPP) and Mechanics Preparation Program (MPP) as part of our commitment together with regional government to reduce the regional’s unemployment rate. The programs offered include various heavy-equipment operating and mechanical training, which is also advantageous for us as we need to increase the need for skilled workers for our operations. We have offered these programs since 2008 and is aimed to develop high schools and vocational schools graduates who fulfill the criteria including academic records, psychological test, and physical examination.
To date, the program has admitted 721 students for OPP and 58 students for MPP from 36 schools from Tabalong, Balangan, Hulu Sungai Utara, East Barito and South Barito regencies, with training periods ranging from 6 to 12 months.
The learning method includes theory and field work with the curriculum consisting of the introduction to mining operations; introduction to heavy equipment, dozer, excavator and dump truck; work health, safety and environment; as well as psychological and physical training in collaboration with the local Military District Command (Kodim).
In 2011, we allocated more than Rp3.6 billion for the two training programs, and the allocation will be increased to Rp4.4 billion in 2012 to accommodate a target of 250 participants. These two training programs will continue into the future in support of the creation of skilled, disciplined, and competitive communities surrounding the mining area.
4
Bambang SusantoExternal Relations GM
Bambang Susanto joined Adaro in 2010. He has over 35 years experience in Indonesian mining industry having worked at Inco, KPC, and Freeport Indonesia. He was the first Executive Director of the Indonesian Coal Mining Association. He has a degree in Mining Engineering from the Bandung Institute of Technology.
Running Adaro | Investing in Our Communities

Adaro Energy Annual Report 2011www.adaro.com 67
We supported this activity to help improve teaching performance, as well as to share and develop perspectives and keep up with the latest developments in education. This will in turn inspire the teachers to be more innovative in conducting the learning process and produce high quality students.
c.) Enhance Community Health Standard
In addition to conducting economic and educational programs, we also conducted community health enhancement programs. The activities included in this program are the Maternal, Newborn & Child Health, Pregnancy Awareness, Integrated Children Nutrition, Health Infrastructure, and Clean Water, as well as providing free health service, infection control, and free cataract surgeries.
Since its inception in 2003, the free cataract surgeries program performed in “Magic Cars” – the nickname for the mobile eye clinics where cataract surgeries under international standards are performed – have returned the eye-sight and enhanced the quality of life for more than 4,000 people. This program is implemented in six regencies surrounding our area of operations. In conducting this activity, we collaborate with the local office of health and target the rural poor as the main recipient of this aid.
In the past, there was social jealousy between Adaro and the community. However it does not happen now as the community realizes that Adaro has helped them in many areas, and it is up to them to utilize the assistance provided for future development. We expect Adaro to continue their programs and educating the local community in several areas such as hygiene and healthy lifestyle.
Adaro Helps in
Various Areas“
Housewife, Activist of Tabalong Local Community
Eli Durgawati

Adaro Energy Annual Report 2011 www.adaro.com68
Corporate Overview
Sustaining Growth And Diversification
With nearly 48 million tonnes of coal produced in 2011, Adaro remains one of Indonesia’s largest coal companies and a top five exporter in the global seaborne thermal coal market. Our coal comes from three pits within a 36,000 hectare concession in South Kalimantan, i.e. Tutupan, Paringin, and Wara. The latest JORC compliant study conducted in December 2010 with total in-situ coal mined in 2011 shows 891 million tonnes of reserves and 4.4 billion tonnes of resources of Envirocoal from this concession.
After twenty years of uninterrupted annual organic growth, we started to embark on exploration and acquisition of other coal concessions in Indonesia. In the second half of 2011, we acquired two greenfield coal concessions in South Sumatra in order to increase reserves, as well as to diversify location, license maturity and product mix. Along with these acquisitions, we also bought equity in a coal logistics company, which owns a dedicated coal hauling road and barge loading port, to service both concessions.
Management Report | Corporate Overview4
Adaro is one of Indonesia’s largest coal companies and a top five exporter in the global seaborne thermal coal market
In this Chapter

Adaro Energy Annual Report 2011www.adaro.com 69
Corporate Overview
Coal is the world’s most abundant and widely distributed fossil fuel with coal resources accounting for 82% of the world’s non-renewable energy resources (IEA, 2010).
The average calorific value of thermal coal produced in Indonesia has decreased from 5,533 kcal/kg (GAR) in 2005 to 5258 kcal/kg (GAR) in 2010 (Wood Mackenzie, 2011).
A Snapshot of Adaro Energy
From Us to You
Running Adaro
Management Report
Owning Adaro
Governing Adaro
Financial Report
Additional Information
1
2
3
4
5
6
7
8
04
26
35
68
144
152
164
269

Adaro Energy Annual Report 2011 www.Adaro.com70
We plan to replicate our proven South Kalimantan business model in South Sumatra. These acquisitions demonstrate the implementation of our business strategy, put in place more than twelve months ago, to seek acquisitions of undeveloped coal concessions in Indonesia. These acquisitions also establish our presence in Indonesia’s coal-rich provinces of South Kalimantan (Adaro Indonesia), Central Kalimantan (IndoMet Coal Project with BHP Billiton), and South Sumatra (PT Mustika Indah Permai and PT Bukit Enim Energi), hence minimizing single-site concession risk.
While we continue to focus on coal mining as our core business, in 2011, our subsidiary, PT Adaro Power formed PT Bhimasena Power Indonesia, a consortium with J-Power and Itochu, to build and operate a 2 x 1,000 MW Independent Power
Europe & Eurasia
South & Central America
North America
Asia Pacific
Middle East & Africa
of Uninterupted GrowthTwenty Years
Distribution of proved reserves in 1990, 2000 and 2010 (%)
20052004200320022001 200019991998199719961995199419931992
1.0
17.7
40.4
1.4
20.8
48.2
2.4
22.5
56.1
5.5
5.4
24.3
66.0
8.6
12.9
26.7
85.610.9
26.8
13.6
22.7
15.5
24.6
9.4
Wara (Mt) Tutupan (Mt) Paringin (Mt) Overburden Removal (Mcbm)
30.1
1.0 1.0 2.1
Management Report | Corporate Overview4
Producer (IPP) plant in Central Java, one of Southeast Asia’s largest coal-fired power plants. This milestone completes our vertical integration from pit-to-power and is a key factor in achieving our vision to be a leading Indonesian mining and energy group. In the future, we expect power to become an essential part of our business as we expect that the demand for power in Indonesia will increase to support the country’s economic growth. Our power division will deliver stable, more predictable returns while at the same time create a market for our low rank coal.
41.4
1.46.4
22.8
22.8
1990TOTAL 981,780
milion tones
35.8
2.26.3
26.1
29.7
2000TOTAL 984,211
milion tones
35.4
1.53.8
28.5
30.9
2010TOTAL 860,938
milion tones
Source: BP Statistical Review of World Energy, June 2011
Rel
ated
Info
rmat
ionOur Subsidiaries:
PT Adaro Power111
2 GW Central Java Power Plant (CJPP) Project
142

Adaro Energy Annual Report 2011www.adaro.com 71
Why Coal?
Coal is the world’s most abundant and widely distributed fossil fuel with coal resources accounting for 82% of the world’s non-renewable energy resources (IEA, 2010). With proven global reserves of nearly 1,000 billion tonnes, at current production levels, coal reserves would be able to meet 150 years of demand while oil and gas are expected to last for 46 and 63 years, respectively (IEA, 2010).
The coal industry is generally divided into two segments, thermal coal and coking coal. Thermal coal, considered as the most abundant and the cheapest source of energy, is widely used to generate electricity through a combustion process. Thermal coal dominates the world’s mix of energy sources for electricity generation, fuelling more than 40% of the world’s electricity (Wood Mackenzie, 2011). While coking coal, which contains higher heat/calorific value is mainly used in iron and steel manufacturing process.
High
Cost efficient sources of energyCost of generating electricity - Cents/KWh
Global electricity by fuel
Low
TWh
Wind
Gas
Coal
Nuclear
0 5 10 15
20092008 2010 201120072006
36.1
119.9
38.5
159.3
225.9 299.3
40.642.2
47.7
34.4
122.8
Industry Overview
Industry Overview
35,000
30,000
20,000
15,000
25,000
10,000
5,000
0
2.9%
3.2%
4.3 %
5.0%
2000 2006 2010 2015 2020
CoalHydroOilRenewableGasNuclear
Other
China
Global Electricity Output by Fuel
Salim Wibowo HalimCorporate Planning GM
Salim has had over 19 years of experience in Finance and Accounting. He re-joined Adaro in 2008 and previously worked with auditing firm Prasetio, Utomo, and Co. He has a bachelor degree in Accounting and a Master Degree in Strategic Management from Gadjah Mada University.
Source: Wood Mackenzie Coal Market Service, Thermal Coal: Trends in Global Markets, December 2011
Source: International Energy Agency: Nuclear Energy Agency
208.5

Adaro Energy Annual Report 2011 www.adaro.com72
Low rank coal production growth
2007
2008
2009
2010
2011
2012
2013
2014
2015
2016
2017
2018
2019
2020
Operation Expansions
New Project
0
50
100
150
200
250
300
Low Rank Coal: Coal for the future
The mining industry in general is facing a downward trend in ore quality and coal is no exception. The scarcity of high heat value coal has promoted a structural change in the coal industry. The average calorific value of thermal coal produced in Indonesia has decreased from 5,533 kcal/kg (GAR) in 2005 to 5,258 kcal/kg (GAR) in 2010 (Wood Mackenzie, 2011), as higher quality coal reserves diminish. Even with the decline in its coal calorific value, Indonesia is still the world’s largest exporter of coal. This is due to the growing demand of electricity in emerging Asia countries with a relatively close vicinity to Indonesia, the increasing number of Ultra Super Critical boilers designed to use low-rank coal, and the large reserve base compared to domestic consumption in Indonesia.
Management Report | Corporate Overview4
Indonesia marketable production by coal type
2006
2005
2007
2008
2009
2010
2011
2012
2013
2014
2015
2016
2017
2018
2019
2020
0
100
200
300
400
500
600 Metallurgical
Mt
Mt
Metallurgical
Sub-Bit Sub-Bit
Low-Rank Low-Rank
Bituminous
UndefinedProduction
Bituminous
Indonesia energy curves - Limited growth in traditional bitumous supply
Indonesia production outlook - Shift towards sub-bituminous and low rank production from known operations
2008
2010
2012
2014
2016
2018
2020
2022
2024
2026
2028
2030
2032
2034
2036
2045
2042
2044
2038
2040
Electricity continues to be the biggest driver for the growing demand in energy. A large part of demand for electricity comes from emerging Asian economies, spearheaded by China and India, as these two economies require ample supply of power to support their economic growth. Coal is expected to play a vital role in electricity generation worldwide as it is the cheapest fuel in electricity generation. Coal is expected to remain as the dominant source of energy worldwide as electricity demand is expected to grow 76% between 2007 - 2030.
Source: Wood Mackenzie Coal Supply Service, Indonesian Low Rank Coal Positioned to Dominate, 18 September 2008.
Source: Wood Mackenzie Coal Supply Service, An Insight into Indonesia’s Coal Quality Shift, 01 October 2009
Source: Wood Mackenzie Coal Supply Service, Indonesian Low Rank Coal Positioned to Dominate, 18 September 2008.
Rel
ated
Info
rmat
ion
Adaro Believes in Growth of Sub-bituminous Coal
74
2009 2012 2020
Low
Ran
kCoa
l Qua
lity
Production Volume
Sub
-bit
Bitu
mou
s
Source: Wood Mackenzie Coal Supply Service, An Insight into Indonesia’s Coal Quality Shift, 01 October 2009
5400 Kcal/kg (GAR)
4500 Kcal/kg (GAR)

Adaro Energy Annual Report 2011www.adaro.com 73
Location of advanced PCC plants and their share in coal-fired power generation: (IEA, Power Generation from Coal, 2011
Indonesia’s coal production capacity is estimated to reach 500 million tonnes by 2020, 50% of which is low-rank coal (Wood Mackenzie, 2008). A lower strip ratio for Indonesia’s low-rank coal results in less production cost, attracting investments in the development of low-rank coal deposits. In addition, lower FOB cash cost for Indonesian low-rank coal is a comparative advantage over other seaborne thermal coal sources. The soaring demand for coal-fired power generation is also expected to drive production growth of Indonesian low-rank coal.
Previously, high CV coal was the primary fuel in coal-fired power plants, while lower heat value coal acted as the blending agent. However, more coal-fired power producers are investing in Ultra-Super Critical (USC) boiler technology, which enables the use of lower heat value coal as fuel. Higher awareness of emission reduction also acts as one of the drivers in the growth of USC technology as improvements in USC plants efficiency ratio reduce CO2 emissions by half of the standard plant. USC plants are now the standard power plants operating in countries such as Germany, Korea, and China.
However, the real benefit of using USC boilers lies within the high efficiency of fuel burning, which can reach up to a 50% efficiency ratio, making it more attractive to use low-rank coal as fuel. The financial benefits from greater fuel efficiency can offset the additional capital needed to buy such technology, as using low-rank coal will result in lower coal procurement cost. The global average plant efficiency will likely rise and mainly driven by the introduction of USC technology (European Commission Joint Research for Energy, 2007).
In addition, development of low-rank coal enhancement initiatives such as coal gasification and coal upgrading continues to evolve. Once these enhancement initiatives are proven to function effectively on a commercial scale, the demand for low-rank coal will increase more.
Low Rank Coal: Coal for the future
Share of supercritical plants in coal-fired power generations. (%)
0
10
20
30
40
50
60
70
80
Korea
Japa
n
Kazak
stan
Ukraine
Denmark
Chines
e Taip
eiUSA
Netherl
ands
German
y
Greece
Russia
China 2
006
Austra
lia
China m
id 20
07
Canad
a
China E
nd 20
09
China 2
004
India
Adrian LembongBusiness Development GM,Director IBT,Director Adaro Power
Adrian had over 8 years experience in Proceess Engineer, including working assignments in German, France and Mexico prior to joining Adaro in 2006. He previously worked for Sudchemie AG with his last position being responsible for the Marketing and Technical Application in the Asia Pacific Region. He holds a Degree in Chemical Engineering from Karlsruhe University.
We initially only mined, extracted and transported the coal to the port. However, It all changed when PT Adaro Indonesia introduced mining activities with sustainability principle in 2004. It is a challenge for us to continue operate at the highest level while at the same time create stakeholders value. We started to conduct activities beyond mining, such as establishing the Institute for Educational Potensial Development of Adaro & Patners (LP3AP). We grew with PT Adaro Indonesia.
We are challenged by Adaro’s
Sustainability Concept“
Project Manager of PT Pamapersada Nusantara (Business Partner)
Agus Dwiwidianto
Rel
ated
Info
rmat
ion
140 Continue in the Lookout for Potential Coal Deposits in Indonesia to Support Growth

Adaro Energy Annual Report 2011 www.adaro.com74
2010 saw Adaro’s second sub-bituminous coal brand penetrate the seaborne and domestic coal market. Branded Envirocoal 4000, or simply ‘E4000’, total production from the Wara pit was 2.5 million tonnes. In production terms it was a humble beginning when compared to Adaro’s big brother brand, Envirocoal 5000 (E5000), which produced over 40 million tonnes in the same period. E4000 bears its name from the typical heat value or kilocalories per kilogram (Kcal/kg) on a gross as received basis. E4000 also retains ‘Enviro’ in its title as, like E5000, the ash, sulphur and nitrogen content is extremely low, which makes it one of the world’s most environmentally friendly coals.
In 2011, production of E4000 increased 115% to 5.4 million tonnes. In combination with production, sales growth was strong and demand exceeded available supply. This robust market support continued to bolster plans for expansion of the brand. In 2012, production is expected to grow by a further 3.5 million tonnes to a respectable 9 million tonnes. Additional production expansions are planned in subsequent years.
Supplementing the continued growth of the Adaro Indonesia brands, Adaro Energy made significant inroads into the development of low cost greenfield projects in South Sumatra. Coals from these projects are expected to support market development and growth of Adaro’s other sub-bituminous coals.
Adaro Indonesia made its mark in 2011 as the largest coal supplier to the Indonesian domestic market. In addition to Adaro’s ongoing support of the domestic power and general industry sectors, Adaro’s export coal sales were to 49 customers in 17 countries worldwide. Given this success, Adaro is also widely recognized as a leader in the development of sub-bituminous coal for international markets.
Adaro’s proven track record for development and delivery of sub-bituminous coal has not been without challenges. It is worthwhile to reflect on the rapid rate of demand change for the E5000 brand. More than likely it’s a forgotten fact that E5000, now a premium sub-bituminous coal, was not always held in such high regard. During the early 90’s Adaro’s E5000 sub-bituminous coal was certainly not supported as it is today. Market scepticism regarding the supply of
coal outside the typical Newcastle coal spec of 6322kcal/kg was more typically the norm. The notion that coal with a heat value in the range of 5000kcal/kg would be readily accepted by Japanese, Korean, Taiwanese and Malaysian buyers was considered dubious at best.
For the naysayers, it could be most certainly said that the boat has been put out to sea given the market success of coal with a typical heat value of 5000kcal/kg. Adaro Indonesia alone has increased production year on year from 15.5 million tonnes in 2000 to 47.7 million tonnes in 2011. Further, Indonesian coal production as a whole increased from a mere 77 million tonnes in 2000 to 329 million tonnes in 2011. Not to say that 100% of this growth is attributed to coal with a typical heat value of 5000kcal/kg, nonetheless the remarkable ramp-up will give a good sense of the misplaced scepticism given Indonesia’s vast sub-bituminous coal reserves. The total production numbers also give Indonesia the crown as the world’s largest exporter of thermal coal.
The question beckons, “What has been the catalyst for the remarkable ramp-up and what factors support future growth of Adaro Energy’s sub-bituminous coal?”
Let’s start by looking at the domestic picture. Indonesia is now recognized as an emerging market leader, with 2011 GDP growth of 6.54%. Furthermore, Indonesia is resource rich and enjoys close proximity to those other emerging nations, namely China, India and South Korea, which form part of the macro-economic pillars of today’s global growth. From a regulation perspective, the Indonesian Government has challenges to overcome. To overcome these regulatory challenges, government and industry participants, both domestic and abroad, have partnered to invoke structural change and promote growth. These micro and macro factors certainly set the scene for continued robust domestic development.
Supporting Indonesia’s aggressive growth is an equally aggressive expansion plan of the national power grid. Much like reforms to regulation, challenges exist. Growth targets for installation of new generation capacity have slipped, so an objective view should be taken when considering the numbers. Despite this, PLN and private
Adaro Believes in Growth of Sub-bituminous Coal
Management Report | Corporate Overview4
Neil LittleSenior Marketing Manager
Neil joined Adaro in 2010 and has over six years experience in coal marketing and logistics. He previously worked for QCoal, and QRNational Coal, and Queensland Rail Operations. Neil studied Business Management and Finance at Queensland University of Technology and has a Masters of Integrated Freight System Management from Melbourne University.
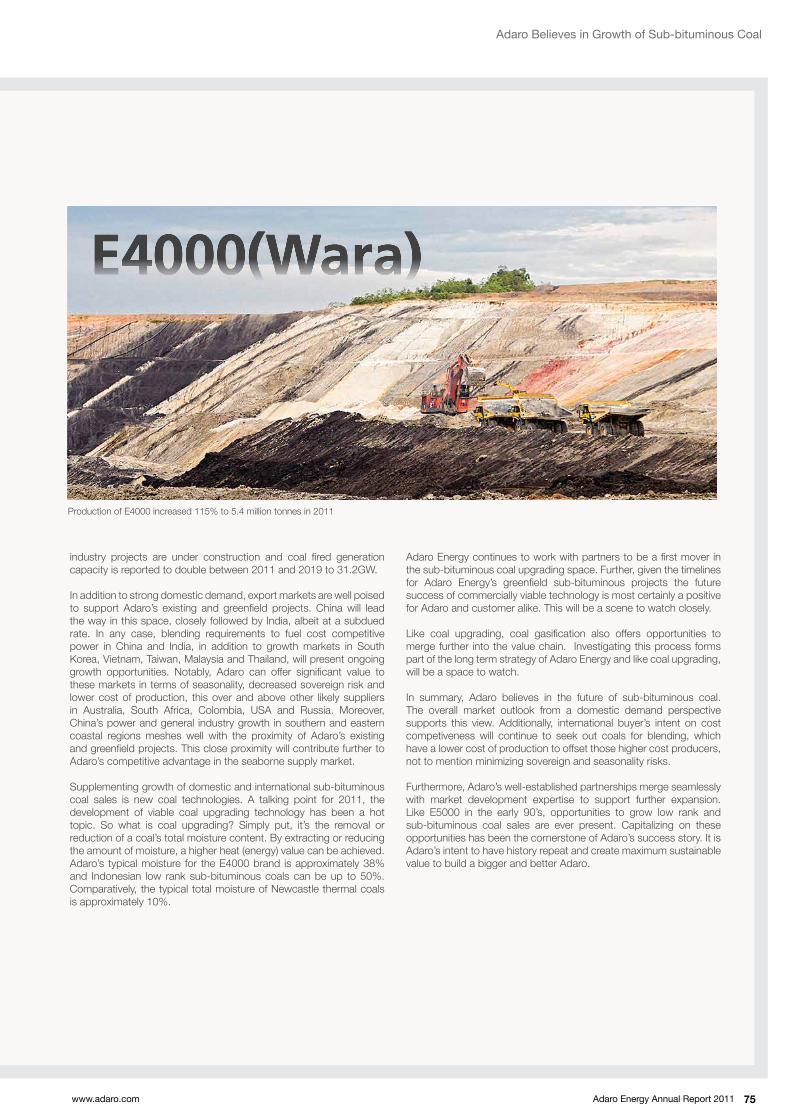
Adaro Energy Annual Report 2011www.adaro.com 75
Adaro Energy continues to work with partners to be a fi rst mover in the sub-bituminous coal upgrading space. Further, given the timelines for Adaro Energy’s greenfi eld sub-bituminous projects the future success of commercially viable technology is most certainly a positive for Adaro and customer alike. This will be a scene to watch closely.
Like coal upgrading, coal gasifi cation also offers opportunities to merge further into the value chain. Investigating this process forms part of the long term strategy of Adaro Energy and like coal upgrading, will be a space to watch.
In summary, Adaro believes in the future of sub-bituminous coal. The overall market outlook from a domestic demand perspective supports this view. Additionally, international buyer’s intent on cost competiveness will continue to seek out coals for blending, which have a lower cost of production to offset those higher cost producers, not to mention minimizing sovereign and seasonality risks.
Furthermore, Adaro’s well-established partnerships merge seamlessly with market development expertise to support further expansion. Like E5000 in the early 90’s, opportunities to grow low rank and sub-bituminous coal sales are ever present. Capitalizing on these opportunities has been the cornerstone of Adaro’s success story. It is Adaro’s intent to have history repeat and create maximum sustainable value to build a bigger and better Adaro.
industry projects are under construction and coal fi red generation capacity is reported to double between 2011 and 2019 to 31.2GW.
In addition to strong domestic demand, export markets are well poised to support Adaro’s existing and greenfi eld projects. China will lead the way in this space, closely followed by India, albeit at a subdued rate. In any case, blending requirements to fuel cost competitive power in China and India, in addition to growth markets in South Korea, Vietnam, Taiwan, Malaysia and Thailand, will present ongoing growth opportunities. Notably, Adaro can offer signifi cant value to these markets in terms of seasonality, decreased sovereign risk and lower cost of production, this over and above other likely suppliers in Australia, South Africa, Colombia, USA and Russia. Moreover, China’s power and general industry growth in southern and eastern coastal regions meshes well with the proximity of Adaro’s existing and greenfi eld projects. This close proximity will contribute further to Adaro’s competitive advantage in the seaborne supply market.
Supplementing growth of domestic and international sub-bituminous coal sales is new coal technologies. A talking point for 2011, the development of viable coal upgrading technology has been a hot topic. So what is coal upgrading? Simply put, it’s the removal or reduction of a coal’s total moisture content. By extracting or reducing the amount of moisture, a higher heat (energy) value can be achieved. Adaro’s typical moisture for the E4000 brand is approximately 38% and Indonesian low rank sub-bituminous coals can be up to 50%. Comparatively, the typical total moisture of Newcastle thermal coals is approximately 10%.
Adaro Believes in Growth of Sub-bituminous Coal
Production of E4000 increased 115% to 5.4 million tonnes in 2011
E4000(Wara)
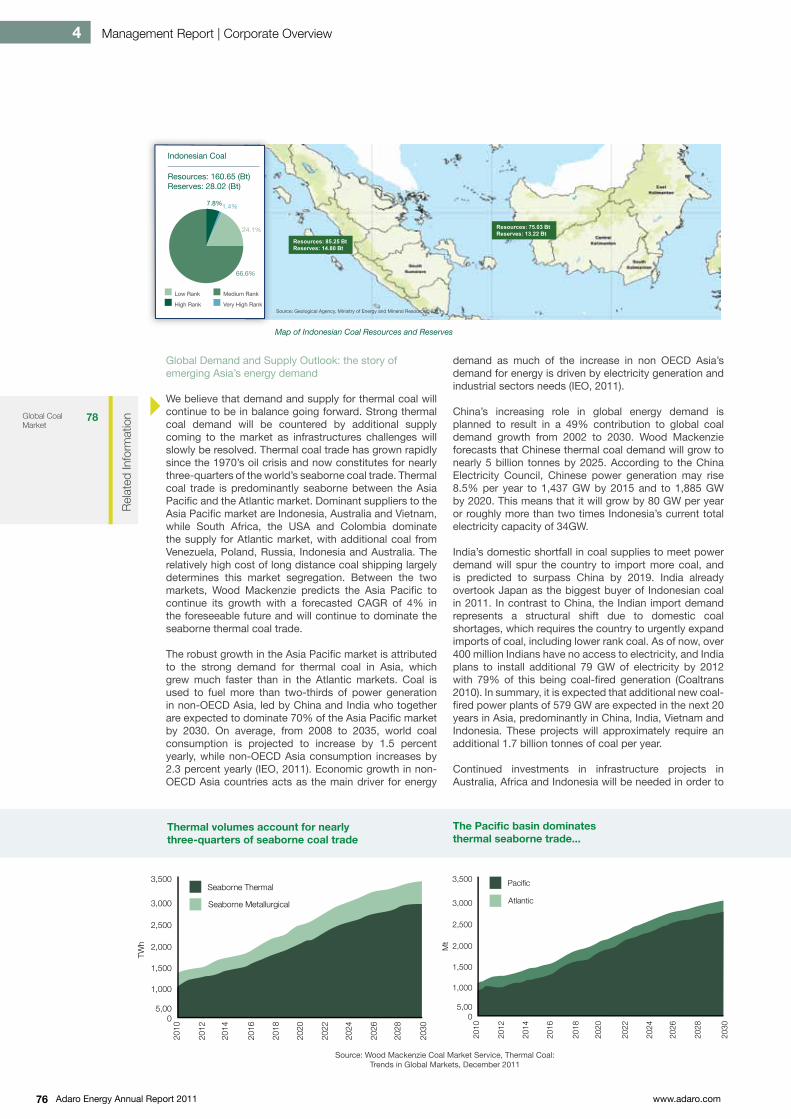
Adaro Energy Annual Report 2011 www.adaro.com76
Global Demand and Supply Outlook: the story of emerging Asia’s energy demand
We believe that demand and supply for thermal coal will continue to be in balance going forward. Strong thermal coal demand will be countered by additional supply coming to the market as infrastructures challenges will slowly be resolved. Thermal coal trade has grown rapidly since the 1970’s oil crisis and now constitutes for nearly three-quarters of the world’s seaborne coal trade. Thermal coal trade is predominantly seaborne between the Asia Pacifi c and the Atlantic market. Dominant suppliers to the Asia Pacifi c market are Indonesia, Australia and Vietnam, while South Africa, the USA and Colombia dominate the supply for Atlantic market, with additional coal from Venezuela, Poland, Russia, Indonesia and Australia. The relatively high cost of long distance coal shipping largely determines this market segregation. Between the two markets, Wood Mackenzie predicts the Asia Pacifi c to continue its growth with a forecasted CAGR of 4% in the foreseeable future and will continue to dominate the seaborne thermal coal trade.
The robust growth in the Asia Pacifi c market is attributed to the strong demand for thermal coal in Asia, which grew much faster than in the Atlantic markets. Coal is used to fuel more than two-thirds of power generation in non-OECD Asia, led by China and India who together are expected to dominate 70% of the Asia Pacifi c market by 2030. On average, from 2008 to 2035, world coal consumption is projected to increase by 1.5 percent yearly, while non-OECD Asia consumption increases by 2.3 percent yearly (IEO, 2011). Economic growth in non-OECD Asia countries acts as the main driver for energy
Management Report | Corporate Overview4
demand as much of the increase in non OECD Asia’s demand for energy is driven by electricity generation and industrial sectors needs (IEO, 2011).
China’s increasing role in global energy demand is planned to result in a 49% contribution to global coal demand growth from 2002 to 2030. Wood Mackenzie forecasts that Chinese thermal coal demand will grow to nearly 5 billion tonnes by 2025. According to the China Electricity Council, Chinese power generation may rise 8.5% per year to 1,437 GW by 2015 and to 1,885 GW by 2020. This means that it will grow by 80 GW per year or roughly more than two times Indonesia’s current total electricity capacity of 34GW.
India’s domestic shortfall in coal supplies to meet power demand will spur the country to import more coal, and is predicted to surpass China by 2019. India already overtook Japan as the biggest buyer of Indonesian coal in 2011. In contrast to China, the Indian import demand represents a structural shift due to domestic coal shortages, which requires the country to urgently expand imports of coal, including lower rank coal. As of now, over 400 million Indians have no access to electricity, and India plans to install additional 79 GW of electricity by 2012 with 79% of this being coal-fi red generation (Coaltrans 2010). In summary, it is expected that additional new coal-fi red power plants of 579 GW are expected in the next 20 years in Asia, predominantly in China, India, Vietnam and Indonesia. These projects will approximately require an additional 1.7 billion tonnes of coal per year.
Continued investments in infrastructure projects in Australia, Africa and Indonesia will be needed in order to
The Pacifi c basin dominates thermal seaborne trade...
Thermal volumes account for nearly three-quarters of seaborne coal trade
Resources: 85.25 BtReserves: 14.80 Bt
Resources: 75.03 BtReserves: 13.22 Bt
7.8%1.4%
24.1%
66.6%
Medium RankLow Rank
High Rank Very High Rank
Resources: 160.65 (Bt)Reserves: 28.02 (Bt)
Indonesian Coal
Source: Wood Mackenzie Coal Market Service, Thermal Coal: Trends in Global Markets, December 2011
Mt
Pacifi c
Atlantic
2,500
5,00
2,000
3,500
1,500
3,000
1,000
0
2010
2012
2014
2016
2018
2020
2022
2024
2026
2028
2030
Seaborne Thermal
Seaborne Metallurgical
2,500
5,00
2,000
3,500
1,500
3,000
1,000
0
TWh
2010
2012
2014
2016
2018
2020
2022
2024
2026
2028
2030
Source: Geological Agency, Ministry of Energy and Mineral Resources, 2011
Map of Indonesian Coal Resources and Reserves
Rel
ated
Info
rmat
ionGlobal Coal
Market 78
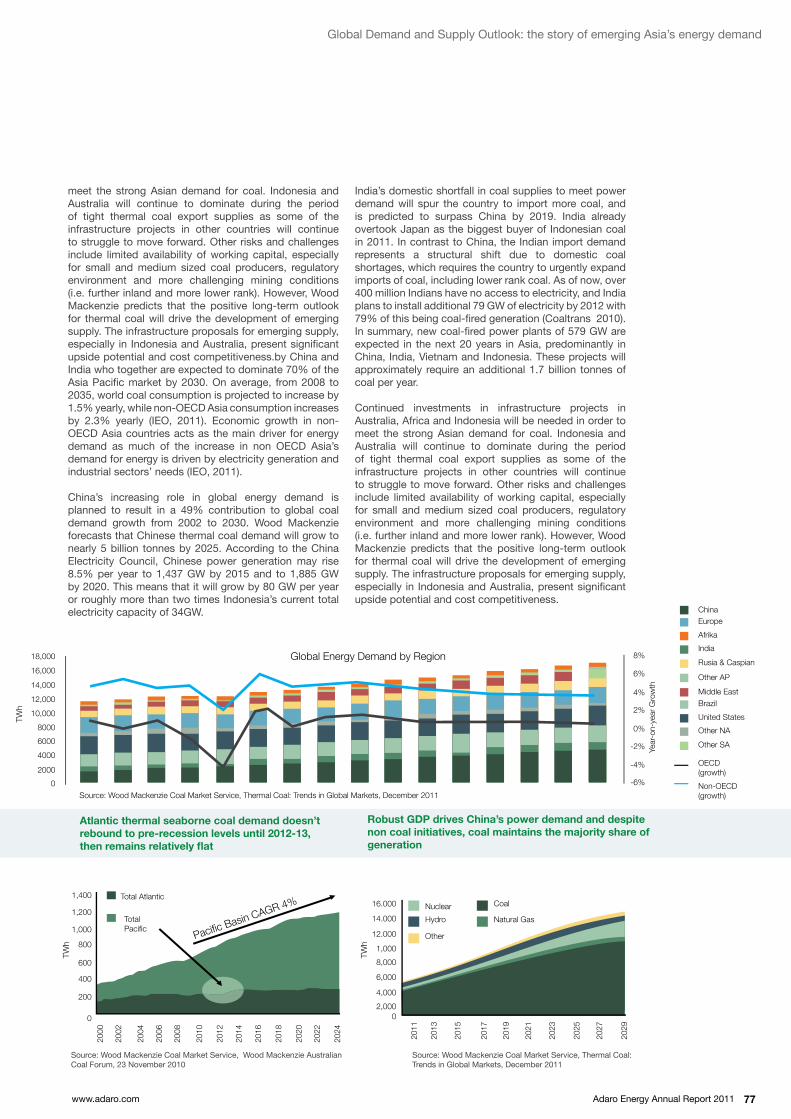
Adaro Energy Annual Report 2011www.adaro.com 77
Source: Wood Mackenzie Coal Market Service, Wood Mackenzie Australian Coal Forum, 23 November 2010
meet the strong Asian demand for coal. Indonesia and Australia will continue to dominate during the period of tight thermal coal export supplies as some of the infrastructure projects in other countries will continue to struggle to move forward. Other risks and challenges include limited availability of working capital, especially for small and medium sized coal producers, regulatory environment and more challenging mining conditions (i.e. further inland and more lower rank). However, Wood Mackenzie predicts that the positive long-term outlook for thermal coal will drive the development of emerging supply. The infrastructure proposals for emerging supply, especially in Indonesia and Australia, present signifi cant upside potential and cost competitiveness.by China and India who together are expected to dominate 70% of the Asia Pacifi c market by 2030. On average, from 2008 to 2035, world coal consumption is projected to increase by 1.5% yearly, while non-OECD Asia consumption increases by 2.3% yearly (IEO, 2011). Economic growth in non-OECD Asia countries acts as the main driver for energy demand as much of the increase in non OECD Asia’s demand for energy is driven by electricity generation and industrial sectors’ needs (IEO, 2011).
China’s increasing role in global energy demand is planned to result in a 49% contribution to global coal demand growth from 2002 to 2030. Wood Mackenzie forecasts that Chinese thermal coal demand will grow to nearly 5 billion tonnes by 2025. According to the China Electricity Council, Chinese power generation may rise 8.5% per year to 1,437 GW by 2015 and to 1,885 GW by 2020. This means that it will grow by 80 GW per year or roughly more than two times Indonesia’s current total electricity capacity of 34GW.
India’s domestic shortfall in coal supplies to meet power demand will spur the country to import more coal, and is predicted to surpass China by 2019. India already overtook Japan as the biggest buyer of Indonesian coal in 2011. In contrast to China, the Indian import demand represents a structural shift due to domestic coal shortages, which requires the country to urgently expand imports of coal, including lower rank coal. As of now, over 400 million Indians have no access to electricity, and India plans to install additional 79 GW of electricity by 2012 with 79% of this being coal-fi red generation (Coaltrans 2010). In summary, new coal-fi red power plants of 579 GW are expected in the next 20 years in Asia, predominantly in China, India, Vietnam and Indonesia. These projects will approximately require an additional 1.7 billion tonnes of coal per year.
Continued investments in infrastructure projects in Australia, Africa and Indonesia will be needed in order to meet the strong Asian demand for coal. Indonesia and Australia will continue to dominate during the period of tight thermal coal export supplies as some of the infrastructure projects in other countries will continue to struggle to move forward. Other risks and challenges include limited availability of working capital, especially for small and medium sized coal producers, regulatory environment and more challenging mining conditions (i.e. further inland and more lower rank). However, Wood Mackenzie predicts that the positive long-term outlook for thermal coal will drive the development of emerging supply. The infrastructure proposals for emerging supply, especially in Indonesia and Australia, present signifi cant upside potential and cost competitiveness.
Global Energy Demand by Region
0
4000
2000
6000
8000
10,000
12,000
14,000
16,000
18,000
0%
2%
-2%
4%
-4%
-6%
6%
8%Ye
ar-o
n-ye
ar G
row
th
Source: Wood Mackenzie Coal Market Service, Thermal Coal: Trends in Global Markets, December 2011
Europe
Other AP
China
Middle EastBrazil
Other NA
United States
Other SA
India
Rusia & Caspian
Afrika
OECD (growth)
Non-OECD (growth)
Atlantic thermal seaborne coal demand doesn’t rebound to pre-recession levels until 2012-13, then remains relatively fl at
TWh
TWh
TWh
Pacifi c Basin CAGR 4%1,400
1,200
1,000
800
600
400
200
0
2000
2002
2004
2006
2008
2010
2012
2014
2016
2018
2020
2022
2024
Total Atlantic
Total Pacifi c
Coal
Natural Gas
Nuclear
Hydro
Other
1,000
2,000
16.000
8,000
14.000
6,000
12.000
4,000
0
2011
2013
2015
2017
2019
2021
2023
2025
2027
2029
Robust GDP drives China’s power demand and despite non coal initiatives, coal maintains the majority share of generation
Source: Wood Mackenzie Coal Market Service, Thermal Coal: Trends in Global Markets, December 2011
Global Demand and Supply Outlook: the story of emerging Asia’s energy demand

Adaro Energy Annual Report 2011 www.adaro.com78
Global Coal Market
The global coal industry experienced an eventful 2011. The price recovery for coal that started in the fourth quarter of 2010 continued into the first three quarters of 2011 with the globalCOAL Newcastle Index hovering around the US$120/tonne level. However, the market weakened during the last quarter and settled at US$121.36/tonne, US$8.60 below the peak in January.
2010 2011 2012 2014 2015 2020 2025 2030
Dem
and
Thermal Coal Consumption 3,034.6 3,255.7 3,494.9 3,748.1 4,254.3 6,476.3 6,403.0 6,982.6
Generation 1,615.4 1,783.5 1,949.1 2,150.5 2,517.4 3,482.8 4,283.1 4,785.8
All Other Consumption 1,419.2 1,472.2 1,545.8 1,597.6 1,736.9 1,993.6 2,119.9 2,196.8
Sup
ply
Thermal Coal Production 2,916.3 3,113.9 3,358.2 3,568.6 4,030.1 4,986.1 5,486.9 5,850.1
Thermal Coal Exports 19.1 21.0 20.0 19.6 15.1 21.5 19.0 18.6
Landborne Thermal Coal Exports 0.0 0.0 0.0 0.0 0.0 0.0 0.0 0.0
Seaborne Thermal Coal Exports 19.1 21.0 20.0 19.6 15.1 21.5 19.0 18.6
Thermal Coal Imports 137.4 162.8 156.7 199.1 239.3 511.8 935.1 1,151.1
Landborne Thermal Coal imports 1.5 7.8 12.7 16.7 19.2 24.5 35.9 57.8
Seaborne Thermal Coal Imports 135.9 155.0 144.0 182.4 220.1 487.3 899.2 1,093.3
Seaborne Thermal Coal imports (kcal/kg) 5,748 5,806 5,821 5,879 5,758 5,756 5,887
Total Thermal Coal Supply 3,034.6 3,255.7 3,494.9 3,748.1 4,254.3 5,476.4 6,403.0 6,982.6
China Thermal Coal Supply and Demand Balance (Base Case)
Rodrigo EcheverriMarket Research and Strategy Manager
Rodrigo has over eight years experience in coal production and marketing with previous experience in Cerrejon mine in Colombia and its sales arm, CMC in Ireland. Cerrejon and CMC are jointly owned by BHP Billiton, Anglo American, and Xstrata. He has a B.Sc. in Mechanical Engineering from Universidad del Norte, Colombia and a M.Sc. in Engineering from the University of British Columbia, Canada.
Jan-
10
140
130
120
110
100
90
80
Feb-
10
Mar
-10
Apr
-10
May
-10
Jun-
10
Jul-1
0
Aug
-10
Sep
-10
Oct
-10
Nov
-10
Dec
-10
Jan-
11
Feb-
11
Mar
-11
Apr
-11
May
-11
Jun-
11
Jul-1
1
Aug
-11
Sep
-11
Oct
-11
Nov
-11
Dec
-11
2010 2011
$/m
t
Global Coal Newcastle Index
The first quarter of 2011 was arguably one of the most remarkable periods in recent coal history. In December 2010, most of the northern hemisphere was being battered by one of the strongest winters in the last few decades, bringing most of Europe and North America to a standstill. By the time most major coal importers returned to the market to refill their depleted stocks, the Queensland floods provided another shock, constraining Australian metallurgical and thermal supply for several months. Simultaneously, the political turmoil in the Middle East resulted in a rally in oil prices, with a direct impact on oil-linked gas contracts in Europe, placing coal again into the equation as the cheapest fuel for power generation even after accounting for the price of carbon dioxide in the European Trading Scheme.
The unfortunate events of the March 2011 earthquake and tsunami in Japan had significant, long-lasting implications for the coal market. Most directly, the damage to several coal-fired power plants along the Japanese east coast caused a loss of capacity equivalent to approximately 12 million tonnes per year. However, this effect proved to be only temporary with most coal units back in operation by the end of the year. On the other hand, most of the replacement capacity for the damaged units came from gas in the form of LNG, which further supported internationally traded gas prices and indirectly enhanced the competitiveness of coal.
Most importantly, the Fukushima disaster caused a long-lasting setback to the nuclear industry, as this source of energy came to be distrusted worldwide by the public, governments and investors. The safety of many nuclear power plants, both in the operation and planning stages came under scrutiny. The first and most visible policy change was the review of the life extension plan for German nuclear plants built before 1980. The de-commissioning of seven nuclear plants in Germany created an immediate surge in coal consumption, supporting coal fundamentals further throughout 2011. The combination of the previously mentioned factors proved once again that coal is a reliable fuel that can provide much needed stability in times of uncertainty.
Management Report | Corporate Overview4

Adaro Energy Annual Report 2011www.adaro.com 79
China: A solid importer
Another important factor in the market in 2011 was the consolidation of China as one of the top three coal importers in the world. After an increase of more than 30 million tonnes in thermal coal imports in 2010, a major market unknown was whether China would become a solid importer rather than a swing player in the market. An important development in 2011 was that, despite the strength in international market prices, total Chinese imports in 2011 remained at levels similar to those in the previous year . This is further proof that the intention of the Chinese utilities is to remain active in the international coal market, sourcing competitive coals in order to complement their domestic supply chain. Additionally, it is important to see the continued growth of Indonesian coal exports into China in spite of falling domestic prices in China. The lower cost of sub-bituminous Indonesian coals, on a delivered energy basis, was welcomed by Chinese end-users and the demand for this grade of coal in most of coastal China is likely to become permanent rather than arbitrage-driven. Additionally, as cape-size facilities have become available, freight has become cheaper for power plants, especially in the northern coastal region, cementing Indonesian coals as a permanent part of the supply mix.
The above factors contribute to a solid outlook for thermal coal imports into China, as supported by Wood Mackenzie’s forecast, which shows continued growth of coal imports into China despite a substantial increase in China’s own production.
India: Cementing a place among the top importers
As expected, India provided significant support to the international coal market in 2011, with new coal-fired units being commissioned along coastal regions designed for coal imports. By the end of the year, India’s coal imports surpassed more than 90 million tonnes and ranked amongst other big importers such as Japan, China and South Korea.
Another factor of extreme interest is the increase in the Indonesian share of coal imports, particularly low-grade coals. In 2010, South African coal accounted for almost one-third of total thermal coal imports, but as new plants have been built to take advantage of the economics of lower-grade coals, the share of Indonesian coal has increased to almost 80%. This trend is expected to become even more significant in future years.
Indonesia: The Crash Program and DMO
The anticipated surge in coal demand from the first 10,000 MW Crash Program sponsored by PLN fell short of expectation as the
commissioning of several power plants in 2011 encountered delays or technical glitches.
Estimated domestic demand by the power industry in 2011 was 66.3 million tonnes, an increase of 10.8 million tonnes over 2010. Further growth of 3.22 million tonnes is expected in 2012 as commercial operations of the new units are progressively achieved. Additionally, the cement and industrial sectors contributed a demand growth of 3.2 million tonnes in 2011.
As the Domestic Market Obligation (DMO) came in full force in 2011, Adaro succeeded at placing 10.66 million tonnes on the domestic market, surpassing its 2011 DMO target of 18.41% set by the government.
Demand - Rest of the world
Korea increased its coal intake due to a combination of factors, mostly the commissioning of new coal-fired units, but also the increased blend of lower-CV coals into their generation mix as power plants took advantage of the economics of Indonesian sub-bituminous coal. In spite of all the bleak forecasts for coal imports into Europe, the market grew in 2011 by more than 15 million tonnes due to higher gas prices in the continent. This type of growth is not expected to remain in the future, but the trend shows that coal still plays an important role in fuel switching dynamics even in a heavily regulated environment.
The other sources of growth included Turkey, Chile and Brazil, all with new capacity for coal imports.
Supply
Once more Indonesia took the top spot in exports growth worldwide, providing more than half of the additional tonnes needed by the international market. Australia only attained modest growth, mostly because of the disruptions of the Queensland floods in the first quarter.
A surprising development was the addition of approximately 15 million tonnes of thermal exports by the USA. This development came about as prices in Europe became more attractive to domestic prices in the USA, especially for high-sulphur coal from the Illinois basin, which can be burned only as a blend by plants in Europe with desulphurization units. Furthermore, low grade coals from Powder River basin also found their way into the Asian market.
The remaining share of the growth was taken by Colombia and Russia, which found strength in the European and South American markets.
Thermal Coal Imports into India - by Grade
High energy coal
Low energy coal
2006 2008 2010 2012 2014 2016 2018 2020 2022 2024 2026 2028 2030
250
200
150
100
50
0
Source: Wood Mackenzie
Global Coal MarketM
t

Adaro Energy Annual Report 2011 www.adaro.com80
Marketing Envirocoal
All coal within our concession area is sub-bituminous characterized by low pollutant traits of low ash, sulphur, and nitrogen content. This coal is trademarked as Envirocoal. We service 49 customers in 17 countries, primarily blue-chip power utilities and some cement producers, and have developed loyal, diversified, long-term relationships with our customers. We offer volume-based contracts with annual price negotiation. Prices are either fixed or set with reference to index prices, while costs are effectively managed through our vertically integrated coal supply chain.
Our experienced combustion engineers, also known as our technical marketing team, visit all customers to provide advice on boiler operation and optimization when using Envirocoal as fuel.
Management Report | Corporate Overview4
Edwin TsangMarketing Director AI,President Director Coaltrade
Edwin Tsang joined the company in October 2006. He is currently the Marketing Director of Adaro Indonesia and Director of Coaltrade Singapore. Prior to this he had over 25 years of experience in the coal industry, firstly with China Light and Power as Fuel Supply Engineer in the 1980s, then with the Sydney based mineral and energy consultancy firm – Barlow Jonker, as a member of the coal consultancy team in the early 1990s and finally as Managing Director of Total Energy Hong Kong. He holds a Bachelor of Science Degree in Mechanical Engineering from Hong Kong University and an MBA from the Chinese University of Hong Kong.
Others 12%
Korea 5%
Malaysia 5%
Taiwan 6%
Hongkong 6%
America 7% China
9%Spain 6%
Japan 11%
India 10%
Indonesia 23%
Geographical breakdown of customer
Export E5000Domestic E4000
10%4%
86%
Cement
Power
Others
3.1%
96.9%
1.6%
98.4%
Type of coal sales domestically
Customer type by % volume E4000 sales destination

Adaro Energy Annual Report 2011www.adaro.com 81
Marketing Envirocoal
In addition to top class customer service, we emphasize consistent coal quality, and maintain our reliability as well as dependability.
The low pollutant traits of Envirocoal earn it the reputation as amongst the best environmental solid fuel available, as Envirocoal’s gaseous emissions and particulate airborne emissions are lower than any other solid fuel. Envirocoal’s captured ash wastes are very low compared to other coals. The chemical composition of airborne and captured ash wastes from Envirocoal renders them benign and suitable for recycling. Furthermore, Envirocoal is able to generate economic benefi ts. Once a power plant is built, the cost of electricity or steam is aggregated into fuel cost, maintenance cost and operating cost. With its expanding sales, Envirocoal has shown itself to be competitive with higher rank coals on per unit of energy basis, as lessened impacts from ash reduce the maintenance costs of pulverizers, coal pipes, boiler tubes, and other equipment along the coal path.
Lastly, Envirocoal can be used in meeting environmental regulations without the need for Flue Gas Desulphurisation units (FGD). This largely reduces capital and operational costs by eliminating the need for a scrubber. In terms of the technical benefi ts of Envirocoal, the coal’s high surface area, combined with high volatile matter, results in excellent ignition, stable combustion and near complete char burnout, with combustion effi ciency often greater than 99.7%.
We sell two kinds of Envirocoal, E5000 (Tutupan and Paringin) and E4000 (Wara). Wara commenced production in 2010 and produced 5.4 million tonnes in 2011, more than a two-fold increase from the previous year. Since production commenced, E4000 has been gaining international acceptance, even though it has a lower calorifi c value and higher moisture content compared to E5000. In
2011, Wara received additional demand from Hong Kong and added Thailand in its customer base. Currently, customers of this product consist of power utilities in India, China, Indonesia, South Korea, and Thailand.
Competition
E5000 has three main competitors in the environmental, sub-bituminous coal market, while E4000 has more than twelve competitors. We compete with the other producers on price, certainty of delivery, and established record of quality. Adaro’s customers continue to select us as their supplier of choice most importantly because of our reliability and certainty of future supply. The competitive advantages that we have over our Indonesian competitors lies on our large proven coal reserves, strong relationships we have built with our mining contractors, our vertically integrated business model, proven track record of supplying quality Envirocoal to our customers and our fi nancial strength to support growth. We also believe that we hold competitive advantages over Australian and South African competitors when selling Envirocoal to customers in Asia given our relative geographic proximity to such customers.
Japan
South Korea
East Coast US
Hongkong
China
Indonesia
Thailand
New Zealand
Malaysia
India
SpainItaly
United Kingdom
E5000
E4000
Geoff PalmerMarketing GM
Geoff has over 35 years experience in coal operations and coal marketing with Kaltim Prima Coal and Westar Mining’s Canadian coal operations prior to joining Adaro in 1997. He has a degree in Physical Metallurgy from the British Columbia Institute of Technology.
Rel
ated
Info
rmat
ion
97 Technical Marketing Report

Adaro Energy Annual Report 2011 www.adaro.com82
Indonesia’s Regulatory Environment
The Indonesian Constitution declares that all natural resources within Indonesia shall be managed by the State and utilized for the Citizen’s welfare. Indonesia has introduced several regulations affecting the mining industry with the most recent one being Law No. 4 of 2009 regarding Mineral and Coal Mining (“Law No. 4/2009”), also known as the New Mining law which replaces the preceding mining Law No. 11 of 1967 regarding Basic Provisions of Mining. The introduction of the New Mining Law represented signifi cant change to the previous Indonesian mining regulatory regime. Some of the implementing regulations of Law No.4/2009 are as follows:
• In September 2009, the Minister of Energy and Mineral Resources issued Ministerial Regulation No. 28 of 2009 regarding The Conduct of Mineral and Coal Mining Services Business, which provides a legal framework for the use of mining services in conducting mineral and coal mining activities in Indonesia. Among others, this regulation provides specifi c requirements in the use and appointment of mining services contractors.
• In December 2009, the Minister of Energy and Mineral Resources issued Ministerial Regulation No. 34 of 2009, regarding Domestic Market Obligation for Mineral and Coal. This regulation obligate mining companies to sell a portion of their production to domestic customers for the sake of national interest (“Domestic Market Obligation” or “DMO”) and applies to all types of coal and mineral. For 2011, the Government established a DMO of 24.17% as stated in the Minister of Energy and Mineral Resources Decree No. 2360/K/30/MEM/2010 which was amended to 18.41% by the issuance of Minister of Energy and Mineral Resources Decree No. 1334.K/32/DJB/2011.
• In February 2010, the Government of Republic of Indonesia released two implementing regulations for Law No. 4/2009 which is Government Regulation No. 22 of 2010 regarding Mining Areas (GR No. 22/2010) and Government Regulation No. 23 of 2010 (GR No. 23/2010) regarding Mining Business Activities. GR No. 22/2010 deals with the establishment of mining areas under the new mining business license (“Ijin Usaha Pertambangan” or “IUP”), while GR No. 23/2010 provides the clarifi cations surrounding the procedures to obtain new IUPs.
• In September 2010, the Minister of Energy and Mineral Resources issued Ministerial Regulation No. 17 of 2010 regarding Mineral and Coal Benchmark Price. This regulation provides the details and mechanism for setting the minimum benchmark prices for the sales of mineral and coal, further this regulation regulates that coal sales shall be conducted with reference to the benchmark price issued by the Government.
• In December 2010, the Government of Indonesia released an implementing regulation for Law No. 4/2009, i.e. Government Regulation No. 78 of 2010 regarding Reclamation and Mine Closure. This regulation complements Ministerial Regulation No. 18 of 2008, and both Regulations are to be obeyed by mining companies.
Management Report | Corporate Overview4
Members of the Adaro Energy Legal Department Members of the Adaro Energy Legal Department

Adaro Energy Annual Report 2011www.adaro.com 83
Indonesia’s Regulatory Environment I Risk Management
Risk Management
Mining is a risky, highly regulated, capital intensive and slow yielding industry. The objective of our risk management initiative is to help the Board to manage risks that may have an adverse impact on our business as we continue to create maximum sustainable value from Indonesian coal.
In 2011, we commenced development of an integrated and Company-wide risk management policy and framework for Adaro Energy. The initial implementation of our risk management framework has been at PT Adaro Indonesia, and we will gradually implement this policy in subsidiaries besides PT Adaro Indonesia from 2013 and beyond.
One of the primary ways to mitigate risk and uncertainties is through insurance. We have a wide range of insurance coverage placed with internationally recognized insurers comprising of Property All Risks and Business Interruption, Heavy Equipment, Marine Cargo and Marine Hull, Director and Officer Liability, Comprehensive General Liability, Terminal and Port Operator Liability, Charterers Liability and other general insurances.
The following describes Adaro Energy’s risk management, which consists of commercial, social and regulatory risks that may have an effect on our business:
Commercial Risk
Our mining operations are subject to unexpected weather patterns that can adversely impact business. Such unexpected weather patterns may include heavy rainfall and flooding. The impact of these events can lead to operational disruptions along our coal supply chain, from mining and road transportation to barging and ship-loading operations. To mitigate the weather risk we have undertaken a number of initiatives that include; prioritizing pit dewatering by supplying additional dredging systems to clean up mud from pits and increasing pit dewatering pumping performance, as well as weather proofing of pit haul roads to reduce stoppage time due to rain.
The prices for Envirocoal are based on global coal prices. The cyclicality and fluctuation of global coal prices may have a material impact on our financial performance. As a commodity, coal is subject to global prices that may fluctuate due to supply and demand dynamics, geopolitical factors and changes in the world economy. We continue to focus on building long-term, low cost assets by improving the efficiency and integration of our coal supply chain to manage the risk of global coal price fluctuations.
Fuel is one of the major cost components, which accounts for approximately 25% of our mining costs. We bear the full risk of fuel price fluctuations as the fuel costs for all mining contractors are managed and procured by us and not incorporated in the contract rates. As a result, any significant increase in fuel price would cause a corresponding increase in our costs. In return, all contractors are committed to gradually reduce fuel consumption.
Unusual and Unseasonable weather Patterns
Cyclicality and Fluctuation in Global Commodity Price
Fluctuation in Fuel Price

Adaro Energy Annual Report 2011 www.adaro.com84
Management Report | Corporate Overview4
Our earnings are naturally hedged as the majority of our revenues and costs are in U.S. dollar. All of our export sales and a significant portion of our domestic sales are priced, invoiced and paid in U.S. dollar with the remainder primarily paid in Rupiah. Our cost of sales and operating expenses are denominated and paid substantially in U.S. dollars with the remainder primarily paid in Rupiah.
We continue to improve the efficiency of our coal supply chain and reduce dependency on oil as part of our overall strategy. This includes the construction of a 2x30 MW mine-mouth power plant, designed to use our E4000 coal, to provide power for our mining operations and the signing of three new barging contracts, which incorporates a term to reduce fuel consumption. We also enter into fuel hedging contracts to meet fuel requirements on a selective basis. In June 2011, we entered into a fuel swap contract that covered 80% of our second half 2011 fuel requirements, while in August 2011 we entered into a similar fuel swap contract covering 80 % of the fuel requirements for the first quarter of 2012.
Our operations at the mine and other parts of our coal supply chain depend on our ability to acquire necessary heavy equipment, machinery and other engineering supplies. These may include excavators, dump trucks, bulldozers, graders, hauling trucks, coal crushing plants, materials handling systems, and other engineering supplies to maintain roads and rivers. In 2011, we secured long-term supply agreements with a number of key suppliers for heavy equipment delivery until 2014.
We recognize that the quantity of coal reserves is finite and non-renewable. In addition to organic growth, acquisitions will assist in our overall strategy to create maximum sustainable value from Indonesian coal and diversification. In 2011, we acquired majority stakes in two Sumatra based companies and we continue to selectively look into other potential acquisition targets in Kalimantan and South Sumatra. We prefer to acquire and develop greenfield deposits rather than operational mines, as the purchase price is less and we can utilize our specialized knowledge of turning coal deposits into profitable long-term assets, thus creating maximum value for our shareholder. Below are some risks associated with growing inorganically through coal deposits acquisitions:
• Operational risk: The main operational challenge of developing greenfield deposit is developing low cost, efficient transportation, as available coal deposits are generally located further inland. We aim to replicate our proven vertically integrated business model in our existing South Kalimantan operation to other coal deposits we acquire in order to build long-term and low cost assets.
• Commercial risk: One main commercial risk is the marketability of low rank coal, as greenfield development opportunities in Indonesia are mainly low rank coal deposits. We believe that the era of cheap coal is over and that sub-bituminous coals will be in greater demand in the future, especially in emerging markets in Asia. We have proven techniques in developing markets for high moisture coals, firstly with our E5000 Envirocoal in the 1990’s and with
We aim to reduce the risk of interest rate fluctuation by entering into interest rate swaps from variable to fixed rates. When appropriate, Adaro Indonesia and SIS have entered into interest rate swap contracts to hedge floating interest rate into fixed rate payments with its relationship banks.
Fluctuation in Currency Exchange Rate
Ability to Obtain Heavy Equipment, Machineries and Other Engineering Supplies
Growing Inorganically through Coal Deposits Acquisitions
Fluctuation in Interest Rate

Adaro Energy Annual Report 2011www.adaro.com 85
We view domestic Independent Power Producer (IPP) developments as an important part of our long-term strategy to provide stable returns and minimize the volatility inherent in producing and selling coal on the global market. In addition, these projects will create demand for low-rank coal. In June 2011, the J-Power-Adaro-Itochu Consortium won the bid to construct a 2,000 megawatt (MW) coal-fired power plant in Central Java. We will selectively look into other IPP projects, which fit with our strategic plan and make economic sense. There are political, economic, environmental and operational risks associated with our IPP development as discussed below:
• Commercial risk: The fluctuation of coal prices may have a material impact on our IPP project’s profit margin. To mitigate this risk, the fuel cost is passed through to the Indonesian State Electricity Corporation (PLN) above a predetermined fuel price as specified in the Power Purchase Agreement (PPA). Adaro’s role in the IPP business will be coal procurement and to sell the coal on a CIF basis at market price based on the Indonesian reference price.
• Political risk: Any changes in political situation may affect the relationship between Adaro and PLN as the buyer. To mitigate political risk, we aim to ensure that the PPA contains a clause that the Indonesian government will honor the contractual agreement should a change in political situation occur.
• Environmental risk: Coal-fired power plants are generally perceived as major contributors of CO2 emissions, impacting climate change. Our 2,000 MW coal-fired power plant will be the first power plant in Indonesia to use advanced Ultra-Super Critical (USC) technology and will serve as a model of high-efficiency power generation. An important feature is the project will utilize Indonesian sub-bituminous coal as fuel, which has low ash and ultra-low sulphur. We are committed to the environment and aim to use advanced and efficient technologies on our future IPP projects, which are likely to have more expensive construction costs but higher efficiency and produce fewer emissions.
our E4000 (Wara) over the last three years. Both these coals were considered unmarketable in the past due to their respective low heat values and high moisture content. We will utilize this knowledge to develop markets for even lower heat value and higher moisture coals. In addition, we continue to study the feasibility of coal enhancement technology to permanently reduce moisture and enhance heat value. Another commercial risk arising from coal deposit acquisitions is determining the fair value of the assets based on the size and quality of the resources. To mitigate this risk, we always conduct complete due diligence with the assistance of internationally recognized mining consultants to identify total minable reserves and resources and establish fair value for assets.
• Legal risk: The introduction of regional autonomy in Indonesia in 2001, which delegated the issuance of mining licenses to regional authorities, has caused uncertainties in the mining industry due to overlapping issues. To mitigate this risk, we always conduct complete legal due diligence prior to making acquisitions to ensure that the targeted asset has obtained the necessary licenses through a legitimate and lawful process.
Moving Further Downstream to IPP Business

Adaro Energy Annual Report 2011 www.adaro.com86
Management Report | Corporate Overview4
Social Risk
Regulatory Risk
Retaining and Attracting Qualified and Skilled Human Resources to Support Growth
Regulatory Changes
Relationship with Local Communities
Exposure to Health, Safety and Environment
Coal mining and power are industries that require specialized knowledge, expertise, and experience. The skills shortages in engineering, mining operators, heavy equipment operators and other technical services may impact our operations. Our future growth plan depends on our continued ability to attract and retain skilled and qualified personnel and is a major focus of our human resources policy. We continue to attract and recruit highly qualified employees and we also established the Adaro Institute in 2011 as a learning center to meet our manpower needs.
Mining is highly regulated industry and the introduction of new regulations may adversely affect our operational activities. We aim to comply with all regulations and review the new regulations that may have material adverse effect on our operations.
Our track record of annual production growth for twenty years would not have been achievable without the support from local communities. The lack of support and failure to settle any local community issues may adversely affect our operations and delay our infrastructure projects. By partnering and growing with the community, we have identified the needs and concerns of the people affected by our operations through several community development programs and we will continue with this spirit of cooperation in all of our future projects.
We are subject to health, safety and environmental regulations in Indonesia. Any incident related to occupational health and safety may disrupt operations and damage our reputation. Any non-compliance with environmental regulations may result in penalties, which may adversely impact our financials. To mitigate this risk, we have developed the Adaro Safety, Environmental, and Production (ASEP) Management System, with the goal of continuously meeting domestic and international standards of safety performance and minimizing environmental impact from operations.
Rel
ated
Info
rmat
ionAdaro Institute
201154
Community Skill Training for Mine Jobs
66

Adaro Energy Annual Report 2011www.adaro.com 87
Risk Management
A DiscussionMr. M. Syah Indra Aman,Director &Chief Legal Offi cer
with
You are on the Board of the IndoMet Coal project. What progress was made in the IMC and your other coal investments?
In terms of our joint ventures, we had very meaningful progress with two of them. The IMC, or IndoMet Coal, is a metallurgical coal project in Central Kalimantan, of which we own 25%, and the remaining interest is owned by BHP Billiton. During 2011, we improved the trust and confi dence building and were very encouraged. BHP Billiton is doing a great job and we are happy to play our role. They announced that construction would begin in early 2012.
The other joint venture I want to highlight is MIP, or PT Mustika Indah Permai, which is a South Sumatra thermal coal deposit, which we acquired in August of 2011 and own a 75% controlling interest. I am proud of the achievements and progress made at MIP and we expect production to begin in 2012. We will rely heavily on the business model we developed over 20 years of operating in South Kalimantan and I expect good long term value creation from this investment.
Is there any lingering legal issues related to MIP?
Prior to acquiring MIP, we conducted a legal due diligence of MIP’s tenure and found MIP’s license, known as an IUP, was obtained through a lawful
process. Since the time of the MIP acquisition, the Supreme Court of the Republic of Indonesia has completed Judicial Reviews of the claim fi led by the plaintiff, who contested, among others, the legality of the MIP IUP through state administrative and civil court proceedings. The Judicial Reviews are fi nal and binding, thereby confi rming, amongst other things, that MIP’s IUP was obtained through a lawful process.
Do you believe it is Adaro’s job to help eradicate poverty in the local communities?
I believe our fi rst duty is to our shareholders to create maximum sustainable value from Indonesian coal by building winning teams that deliver a bigger and better Adaro Energy. I believe creating shareholder value is not inconsistent with also doing the right thing by our communities and other stakeholders. Adaro Energy must focus on building long term low cost assets and long term value creation. I believe Adaro Energy’s long term and sustainable success will not be achieved overnight and without the support of multiple stakeholders. Given we are not a type of organization that merely thinks of itself, we must also consider others, and also those that are less fortunate. We view adhering to our responsibilities as a corporation, being fair and equitable, is not just the right thing to do, it is an investment in our future success.

Adaro Energy Annual Report 2011 www.adaro.com88
Review of Coal Operations
In 2011, we saw a major improvement in mining operations as weather conditions, which adversely affected production in 2010, returned to a normal distinct wet and dry season. In addition, several measures that we introduced from 2009 onwards to minimize the impact of rain to our operations, as well as the introduction of new and larger equipment started to take effect as seen from the significant rise in coal production and overburden removal. The improvement in weather conditions and operations upgrading enabled us to maintain our track record of continuous production growth since the commencement of our operations in 1991 with 13% rise in coal production to 47.7 million tonnes for the year.
We use excavators and 70 to 100 tonnes class haul trucks for coal extraction, hydraulic face shovels and 150 to 200 tonnes class haul trucks for overburden stripping and hauling at our Tutupan, Wara and newly re-opened Paringin mines. Overburden stripping, hauling and dumping are carried out until coal is exposed and then coal production can
Management Report | Review of Coal Operations4
Adaro’s Kalimantan head office near the Tutupan mine
PriyadiOperations GM
Priyadi has more than 22 years experience in mining engineering. Prior to joining Adaro in 1991 he worked with Tanito Harum. He holds a degree in Mining Engineering from UPN Yogyakarta.
Mining Operations and Contract Mining
In this Chapter

Adaro Energy Annual Report 2011www.adaro.com 89
We maintain our track record of continuous production growth since the commencement of our operations in 1991 with 13% rise in coal production to 47.7 million tonnes for the year.
A Snapshot of Adaro Energy
From Us to You
Running Adaro
Management Report
Owning Adaro
Governing Adaro
Financial Report
Additional Information
1
2
3
4
5
6
7
8
04
26
35
68
144
152
164
269

Adaro Energy Annual Report 2011 www.adaro.com90
begin. Stripped topsoil is stockpiled for use in post mining rehabilitation activities.
We continue to focus on doing exploration work, mine planning, production supervision, environmental rehabilitation, waste water management and coal marketing while all other aspects of our mining operations are undertaken by subcontractors.
We employ four major contractors, including our subsidiary PT Saptaindra Sejati (SIS), to do mining operations activities. These contractors have been
working with us for many years, in one case even since the beginning of our operations in 1991. They undertake overburden stripping and removal, coal extraction and transportation, and some aspects of environmental reclamation under multi-year contracts. They are also responsible for the provision of sufficient equipment, materials and labor to meet production targets that we set. The use of contractors allows us to significantly reduce our funding of capital expenditures and working capital and allows us to focus on certain activities such as exploration and mine planning, quality control and marketing to ensure that we continue
Management Report | Review of Coal Operations4
PT Adaro Indonesia 2007 2008 2009 2010 2011
Key Financial Highlight (in US$)
Total Assets 1,106,690,589 1,278,899,044 2,303,408,132 1,884,993,302 2,699,587,574
Total Liabilities 999,941,392 1,023,049,240 1,844,077,979 1,648,576,462 2,312,088,594
Interest Bearing Debt 543,239,583 514,131,373 1,204,276,566 1,141,253,560 1,629,685,812
Total Equity 106,749,197 255,849,805 459,330,153 236,416,840 387,498,980
Revenue 1,146,339,836 1,617,765,114 2,406,903,867 2,411,971,193 3,386,176,347
Operating Statistics
Coal Sales (Million tonnes) 36.6 39.8 41.1 42.5 47.2
Coal Production (Million
tonnes) 36.1 38.5 40.6 42.2 47.7
Overburden Stripping (Mbcm) 119.9 159.31 208.5 225.9 299.27
Average blended stripping
ratio (planned) 4.25 4.25 5.0 5.5 5.9
35%
32%
18%
13%2%
PAMA 35%
SIS 32%
BUMA 18%
RAJ 13%
AI 2%
Coal mining contractorsPT Adaro Indonesia Sales and Production Volume (Mt)
36.6
36.1 39
.8
42.5 47
.2
42.2 47
.7
40.6
41.1
38.5
2007 2008 2009 2010 2011
ProductionSales

Adaro Energy Annual Report 2011www.adaro.com 91
to maintain a high quality and reliable output to our customers.
In 2011, PT Pamapersada Nusantara (PAMA) was responsible for 35% of Adaro’s coal production followed by our subsidiary, SIS with 32%, PT Bukit Makmur Mandiri Utama (BUMA) with 18% and PT Rahman Abdijaya (RA) with 13%. PT Adaro Indonesia took responsibility for coal production from the newly re-opened Paringin mine with coal output representing 2% of total production.
Coal Mining
Our Tutupan mine, which produced 41.3 million tonnes in 2011, will be consolidated at between 40 to 45 million tonnes per annum for the foreseeable future. In order to allow Tutupan to receive long term remedial works such as weatherproofi ng of mine haul ramps, construction of high capacity pit drainage systems and extensive pre-stripping works to expose coal and increase pit inventory so that the mine will be better positioned to handle unforeseen operational issues such as abnormal weather in the future thus minimizing production volatility.
Wara, our newly operating mine, which lies 5 kilometers to the west of Tutupan produced 5.4 million tonnes of coal, more than double 2010’s output. This high rate of expansion was due to the increased pit area allowing access to more and bigger mining equipment, and low overburden stripping ratio.
Paringin, our reopened mine, located to the south of Tutupan produced slightly in excess of 1 million tonnes for the year. However, exploration in the past has delineated a substantial resource and it is planned that production for this mine will expand to 5 to 7 million tonnes per annum in future years. Coal from Paringin is similar in quality with Tutupan coal and can be blended as a homogenous product.
Overburden Removal
The rate of overburden removal increased dramatically in 2011, reaching 299 million bank cubic meters (mbcm) for the year due to the increase in size and number of the overburden removal fl eet as well as the return to normal weather conditions.
Coal Mining I Overburden Removal
AI and SIS personnel at Tutupan mine.
Production from PT Adaro Indonesia was 47.7 million tonnes, in-line with our target of 46 to 48 million tonnes for the year and a 13% increase over 2010. During the year, we broke our own record for daily coal extraction of coal from the pits to the run of mine stockpiles of 204,495 tonnes achieved on December 2nd 2011. This is a 19.7% rise over the previous record. The coal extraction record was especially signifi cant as it was established during a wet season month. Monthly and quarterly records also continued to be broken with coal output averaging in excess of 4 million tonnes per month for the 9 months from April to December.
SuhernomoCoal Processing and Barge Loading Deputy GM
Suhernomo has over 21 years experience in coal mining operations and has been with Adaro since 1997. He previously worked with several coal mining and contractors in Indonesia. He has a degree in Mining Engineering from UPN Veteran Yogyakarta and is now pursuing a Magister Science Degree at Lambung Mangkurat University, Banjarmasin, South Kalimantan.
42%
33%
17%
7% 2%
PAMA 42%
SIS 33%
BUMA 17%
RAJ 7%
AI 2%
Overburden removal contractors

Adaro Energy Annual Report 2011 www.adaro.com92
This was a 32% increase over the previous year and the volume removed was more than double the volume removed as recently as 2007 where we removed 120 Mbcm.
We introduced new equipment in 2011, including 35 units of 200 tonnes class and 57 units of 150
These measures and other upgrades to water drainage systems that we implemented in other areas of the mine, together with expansion of external sedimentation settling, ponds will enable the water management system to handle signifi cantly more runoff than has been experienced in the past therefore reduce the impact of future abnormal weather events.
Hauling and Kelanis
Hauling
2011 was also a record year for coal hauling from the mines to Kelanis. We achieved a new daily record of 163,491 tonnes on the 22nd September, beating the old mark set in 2009. It is worth noting that we exceeded the old record six times during the year.
Coal haulage operations on the 80 kilometer haul road from the mines to Kelanis continued at a high level of effi ciency throughout the year with no major stoppages being recorded. At the end of the year, there were more than 320 units of the 130 tonnes capacity truck trailers in operation.
KelanisThe operations at Kelanis Terminal, which handles all coal crushing, stockpiling and barge loading of incoming coal from our Tutupan, Wara and Paringin mines, maintained an extremely high level of availability throughout the year without any major breakdowns. We completed the upgrade of one of the crushing stations, which had begun in 2010. This increased Kelanis Terminal’s crushing capacity to 55 million tonnes per annum and allowed Kelanis Terminal to handle increased production output from our mines with little diffi culty. We set new records for daily crushing and barge loading with 163,754 tonnes being crushed on the 23rd October and 173,571 tonnes being outloaded to barges on the 15th December.
tonnes class Caterpillar, Komatsu and Hitachi haul trucks, and 9 units of 350 to 400 tonnes class Komatsu and Hitachi face shovels with a bucket capacity of 24 cubic meters. At the end of 2011, the heavy equipment fl eet for both overburden removal and coal extraction numbered 1,131 units, a 24% increase in fl eet numbers from 2010.
During the year, we removed mud and water that had accumulated in one of the contractor’s mining area at South Tutupan, which had prevented coal extraction from the pit bottom in 2010. This action allowed us to mine the coal in that area and a new water drainage sump was developed. We carried out this work in conjunction with the development of a new mud removal system in South Tutupan that allows us to pump up dredged mud to a holding pond for water injection, which reduces the mud density thus allowing the mixture to be pumped out of the pond by conventional water pumps.
Dumping coal to one of the crushers at Kelanis River Terminal
Management Report | Review of Coal Operations4
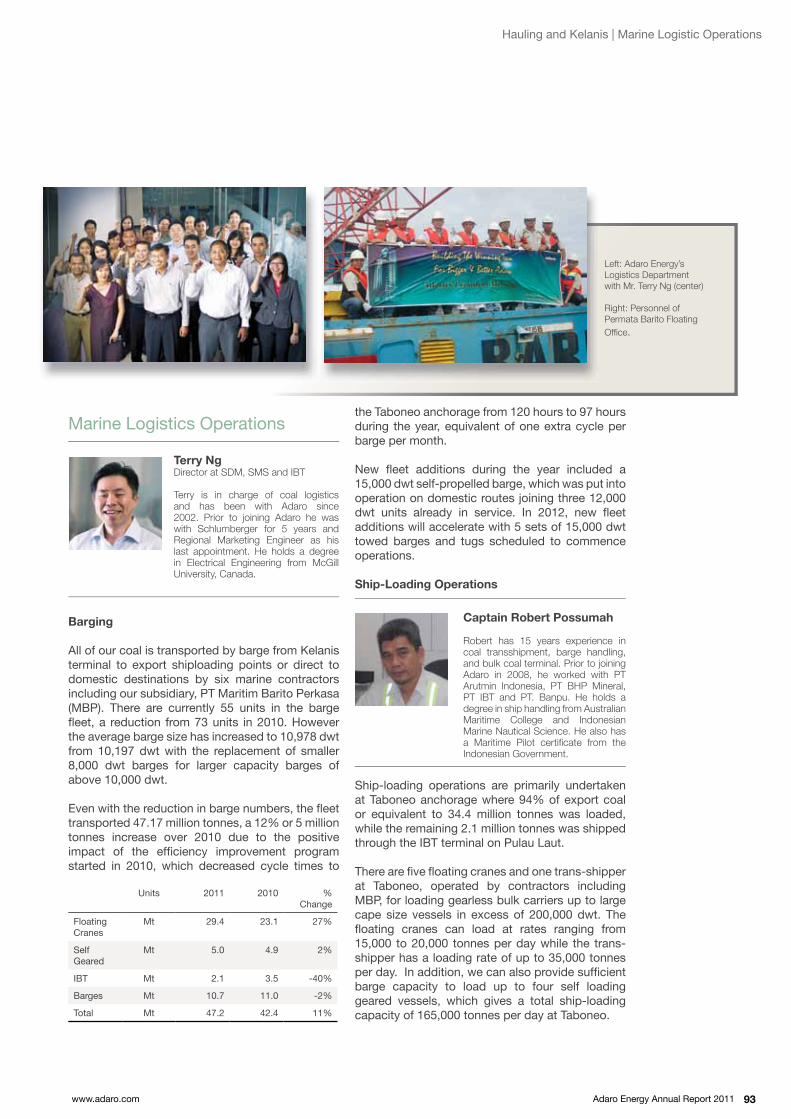
Adaro Energy Annual Report 2011www.adaro.com 93
Marine Logistics Operations
Barging
All of our coal is transported by barge from Kelanis terminal to export shiploading points or direct to domestic destinations by six marine contractors including our subsidiary, PT Maritim Barito Perkasa (MBP). There are currently 55 units in the barge fl eet, a reduction from 73 units in 2010. However the average barge size has increased to 10,978 dwt from 10,197 dwt with the replacement of smaller 8,000 dwt barges for larger capacity barges of above 10,000 dwt.
Even with the reduction in barge numbers, the fl eet transported 47.17 million tonnes, a 12% or 5 million tonnes increase over 2010 due to the positive impact of the effi ciency improvement program started in 2010, which decreased cycle times to
Left: Adaro Energy’s Logistics Department with Mr. Terry Ng (center)
Right: Personnel of Permata Barito Floating Offi ce.
the Taboneo anchorage from 120 hours to 97 hours during the year, equivalent of one extra cycle per barge per month.
New fl eet additions during the year included a 15,000 dwt self-propelled barge, which was put into operation on domestic routes joining three 12,000 dwt units already in service. In 2012, new fl eet additions will accelerate with 5 sets of 15,000 dwt towed barges and tugs scheduled to commence operations.
Ship-Loading Operations
Ship-loading operations are primarily undertaken at Taboneo anchorage where 94% of export coal or equivalent to 34.4 million tonnes was loaded, while the remaining 2.1 million tonnes was shipped through the IBT terminal on Pulau Laut.
There are fi ve fl oating cranes and one trans-shipper at Taboneo, operated by contractors including MBP, for loading gearless bulk carriers up to large cape size vessels in excess of 200,000 dwt. The fl oating cranes can load at rates ranging from 15,000 to 20,000 tonnes per day while the trans-shipper has a loading rate of up to 35,000 tonnes per day. In addition, we can also provide suffi cient barge capacity to load up to four self loading geared vessels, which gives a total ship-loading capacity of 165,000 tonnes per day at Taboneo.
Hauling and Kelanis | Marine Logistic Operations
Units 2011 2010 % Change
Floating Cranes
Mt 29.4 23.1 27%
Self Geared
Mt 5.0 4.9 2%
IBT Mt 2.1 3.5 -40%
Barges Mt 10.7 11.0 -2%
Total Mt 47.2 42.4 11%
Terry NgDirector at SDM, SMS and IBT
Terry is in charge of coal logistics and has been with Adaro since 2002. Prior to joining Adaro he was with Schlumberger for 5 years and Regional Marketing Engineer as his last appointment. He holds a degree in Electrical Engineering from McGill University, Canada.
Captain Robert Possumah
Robert has 15 years experience in coal transshipment, barge handling, and bulk coal terminal. Prior to joining Adaro in 2008, he worked with PT Arutmin Indonesia, PT BHP Mineral, PT IBT and PT. Banpu. He holds a degree in ship handling from Australian Maritime College and Indonesian Marine Nautical Science. He also has a Maritime Pilot certifi cate from the Indonesian Government.

Adaro Energy Annual Report 2011 www.adaro.com94
With the IBT terminal remaining as a strategic back-up, total ship-loading capacity is currently in excess of 50 million tonnes per annum. Meanwhile, total transport capacity, which includes direct domestic barging, is in excess of 60 million tonnes per year.
Marketing and Sales
Our coal sales efforts continue to focus on the key thermal markets of Asia which together accounted for 87% of our market in 2011. The remaining 13% was supplied to the Atlantic market and the Americas. Power generation companies constituted 75% of our customers by volume in 2011.
E5000 is our long term established brand mined from Tutupan. Even though the export market saw reduced demand in the second half of the year, we still experienced solid demand for our coal. E5000 remains highly regarded for its favorable environmental characteristics of ultra-low sulphur, low ash and low nitrogen. Sales of E5000 in 2011 were 41.7 million tonnes, which is slightly higher than 2010 sales of 40.4 million tonnes.
Sales strategy for E5000 is focused on achieving and extending long term contracts in the higher value markets where it receives pricing that recognizes and values its favorable quality characteristics. As part of this strategy, we shipped trial/spot cargoes of E5000 to two power utilities in Japan and an industrial company in South Korea and concluded a new five year contract to another Japanese power utility. In the future, E5000 tonnage may be reduced in markets in which quality and reliability are not sufficiently recognized in pricing.
Asia remains the largest export market for E5000, with 22.3 million tonnes shipped in 2011, or 71% of all export sales. Demand in E5000’s traditional European markets increased substantially, with 2011 sales of 5.8 million tonnes, representing an increase of 51% over 2010 sales of 3.9 million tonnes. At the same time, sales to the Americas were lower in 2011, primarily due to low dispatch from the power plants. The reduced demand from the Americas, specifically the eastern US and Chile, will allow us to redirect E5000 sales to fulfill the strong demand in the Asian and European markets for E5000.
One of the highlights of 2011 was our invitation by CLP Power Hong Kong to officiate at a ceremony celebrating the completion of their emission control projects. We are a long-term supplier of E5000 to CLP and were cited as CLP’s main supplier of ultra-low sulphur coal.
E4000 is the base component coal in a power station in China, and has specific value as a blend coal with higher ash and high sulphur coals. The largest growth in E4000 sales were in China and India, where collective sales tripled from 1.2 million tonnes in 2010 to 3.8 million tonnes in 2011, equivalent to 69% of total E4000 sales. Market acceptance has also been achieved in other parts of Asia, where 1.2 million tonnes or 22% was sold to a premium customer in Korea under a long term contract, as well as sales to long-term customers in Thailand and Indonesia. A new three year contract for E4000 was negotiated with of one of China’s five major utility companies, with deliveries to begin in 2012.
Sales growth continued in 2011, reaching a total of 47.2 million tonnes, an increase of 4.80 million tonnes or 11.3% of the 42.4 million tonnes sold in 2010. Of the 2011 total sales, 36.5 million tonnes was delivered to export customers while 10.7 million tonnes went to the Indonesian domestic market.
Management Report | Review of Coal Operations4
Peter ArendtPlanning, Strategy and Market Development GM
Peter Arendt joined Adaro in February 2011 and has over 25 years experience in coal marketing, business development and mine operations. Prior to joining Adaro, he held positions in Canada with Luscar Ltd. and in Australia with BHP, Oaky Creek Coal and New Hope Corporation. Peter holds a Bachelor of Engineering (Mining) from the University of Queensland and a Graduate Diploma in Business from the Curtin University of Technology, and is registered as a Professional Engineer in British Columbia and Alberta, Canada.
(Continued to page 110)
Trevor ShiptonPort Manager IBT
Trevor has 40 years of experience in the mining industry. He joined IBT in December 2004 initially as Maintenance Manager, being promoted to Port Manager in 2010. Prior to joining IBT he was with BHPB and Rio Tinto mining operations in Papua New Guinea specialising in Maintenance Management.
Rel
ated
Info
rmat
ionMarketing
Envirocoal80

Adaro Energy Annual Report 2011www.adaro.com 95
Creating Maximum Sustainable Value.Building Winning Teams.Bigger and Better Adaro Energy.
At Adaro Energy (IDX:ADRO), our overriding goal is to create maximum shareholder value. We do this by creating sustainable value from Indonesian coal. Since 2009, we have delivered some of the best shareholder returns in Indonesia.
With 20 years of uninterrupted growth, Adaro’s Tutupan mine in South Kalimantan is one of the largest single-site coal mines in the southern hemisphere. We have delivered over 416 million tonnes of thermal coal to our satisfi ed customers in 17 countries around the world. We have proven that we can build operations on a huge scale and operate them successfully, at low cost, without disruption. In 2011, we delivered an industry topping EBITDA margin of 37%.
We have embarked on a program of growth through acquistions. In 2010, we closed a joint venture deal for a large metallurgical coal project,
encouraging us look for other Indonesian coal acquisitions to boost reserves and diversify. In August and October 2011, we established a foothold in South Sumatra by acquiring two coal deposits and equity in a logistics company.
It is our fi rm belief that continual growth cannot be achieved without building trusting and mutually benefi cial relationships with local communities surrounding our projects. Building exemplary community development and environmental programs and behaving as a responsible corporate citizen are all part of our core business, and important reasons for our continued growth every year since we began operations in 1992. Sustainable
growth and value creation make us the partner of choice for coal mining and energy in Indonesia.
We encourage you to please contact us to fi nd out more about how we are continually striving to create a bigger and better Adaro Energy.
Wara (Mt)
Paringin (Mt)
Tutupan (Mt)
Overburden Removal (Mcbm)
20092008 2010 20112007200620052004200320022001 200019991998199719961995199419931992
1.0
17.7
1.4
20.8
2.4
22.5
5.5
24.3
8.6
26.7
10.9
36.1
13.6
38.5299.3
15.5
40.6 42.2
47.7
9.4
34.4
40.448.2 56.1
5.4
66.0
12.9
85.6
26.8
119.9
22.7
159.3
208.5
225.9
24.6
122.8
30.1
1.0 1.0 2.1
Historical Production Volume (Mt)
Please Contact: Cameron Tough | [email protected] | www.Adaro.com
PT Adaro Energy Tbk, Menara Karya 23rd fl oor, Jl. H.R. Rasuna Said Blok X-5, Kav 1-2 Jakarta 12950, Indonesia

Adaro Energy Annual Report 2011 www.adaro.com96
Going forward, India and China are the major target exports markets for E4000 coal. Existing and new power stations in India and China practice a high degree of blending and have a lot of fl exibility with respect to the quality of their coal feedstock. With its low sulphur, low ash and low nitrogen, E4000 is an excellent coal to blend with higher sulphur and higher ash coals, and continued future growth is expected in these markets.
Over the next fi ve years, there will be signifi cant additional demand in India and Southeast Asia from new independent power projects, or IPPs, that will come on-line. We already have a number of IPP customers and are engaged in a number of commercial dialogues and MOUs with international electrical utility companies and multi-national consortiums, which are bidding for IPP projects. These IPPs typically have their electricity output contracted to government-owned utility companies, and seek large reliable coal producers to provide their primary coal requirements. Our marketing
Adaro Indonesia’s Marketing Department with Mr. Edwin Tsang
We had anticipated to deliver signifi cant volumes of E4000 to meet PLN’s increased demand under the 10,000 MW “crash program.”. However, the expected PLN demand for E4000 was unfortunately not realized due to various factors, including the delay in commissioning of new units. This did not negatively impact upon E4000 sales, as the tonnage that would have been sold to PLN was placed in the higher demand international markets. Moving forward, we will continue to work with PLN and other Indonesian coal utilities, cement plants and industrial consumers of coal to achieve increased sales of E4000 to the domestic market. In this regard, increased sales of E4000 to domestic cement plants are expected in 2012.
A major commercial focus is to align contracts sales strategy with prevailing government regulations, which include Ministerial Regulation No.17/2010 with respect to coal price, and Ministerial Regulation No. 34/2009 with respect to Domestic Market Obligation (DMO). We are committed to meeting these requirements and are working with our customers in this regard. With respect to the
Domestic Market Obligation, our actual delivery to the domestic market exceeded our 2011 DMO requirement by 1.45 million tonnes.
With year-over-year production increases from 2010 to 2011 and further medium-term increases planned, market development will continue to be our major focus in 2012. These efforts will focus on the natural high growth markets in Asia, notably Indonesia, China and India while maintaining our position in the premium traditional markets in Northeast Asia.
With the continued increase in coal production and sales in 2012 and beyond, we added new marketing management personnel in 2011 in the areas of market research, strategy and market development. Further additions to the marketing team are planned for 2012 to ensure that the size and qualifi cations of the marketing team will correspond and support the increased sales volumes, the growing number of customers, and a more diversifi ed customer base.
Management Report | Review of Coal Operations4
effort is specifi cally focused on these IPPs as future markets for E4000 coal, and the marketing team is actively working to conclude supply agreements.
In the domestic market, we continue to be a strong supporter of the Indonesian Government’s promotion of the use of coal for power generation, cement and other industries. In 2011, we maintained our position as one of the largest suppliers to the domestic market. Supply was 10.7 million tonnes of mainly E5000 coal, equivalent to approximately 18% of Indonesia’s domestic coal consumption.

Adaro Energy Annual Report 2011www.adaro.com 97
Technical Marketing Report
Technical Marketing Report
From the beginning, Adaro Energy has added value to coal products by establishing a technical link with its customers. Traditionally coal companies build relationships with the Purchasing group of customers, but Adaro Energy has worked hard to build relationships by offering technical expertise and services to the Engineering and Operations groups of customers.
When Envirocoal first arrives at the plant and is introduced into the furnace, Adaro is there to provide assistance and suggestions how to use the coal. The Company is there to assist the customer to get the most value from our coals by adjustments to the operation to get lowest environmental emissions, higher efficiency, or implement strategies for blending to get lowest electricity production costs.
Whether the customer is large or small, Adaro Energy strives to function as a team with the customer. Recent example include, in India, a new customer who will use only a few hundred thousand tonnes per year and a large steel company with the potential to use millions of tonnes of Adaro’s Wara coal each year. Each was having problems and equipment suppliers were blaming the coals. During the Adaro visit, it was established that any particular fuel was the least likely cause of the problems, and that slight changes in operation and re-design of some equipment was the best solution. At the end of the visit the plant manager of the steel plant, a person recently hired from an older customer of Adaro, instructed his operating staff to ‘. . . stay in touch with Adaro!’ This is an example of new teams adding value to Adaro coals and ensuring customer satisfaction.
The Asian Subbituminous Coal Users’ Group held their first meeting in Hong Kong in late 2011, and Adaro Energy was a major catalyst in the formation of the group. The purpose of the group is for users of lower rank coals to meet and discuss best practices to get the most value from using these coals, modeling a similar group in the USA. The Asian Subbituminous Coal Users’ Group is an important element in assuring the long term use of Adaro’s coals. This is a winning team in action to promote the use of Indonesian coals far into the future, and Adaro Energy is proud to have been instrumental in the formation of this group, and a charter member.
No one has more experience in handling Indonesian environmental coals than Adaro Energy. The company is not only committed to use best practices in its own operation, but it works to bring those practices to customers’ operations to help them get the maximum benefit from using Adaro coals. Over the years, Adaro has invited customers to come to Indonesia to see first hand how to properly
handle and store coal, and has sponsored seminars where Adaro employees teach and instruct in coal handling, laboratory analyses, dust control, etc. This is another way the company builds relationships with customers’ staff, and thereby adds value to its products. This helps to ensure strong sales in the future.
The Adaro team includes sales people and agents in various countries who maintain the first line of contact with the customers and provide service for various aspects of the contracts. The company realizes that these team members also need training and experience in how to provide the best service to customers. Including these people as members of the Adaro Energy team is a key component of adding value to Adaro products.
Adaro Energy recognizes that to supply energy far into the future, Indonesia’s large amount of high-moisture, low-rank coal must be used. The key to unlock such a vast resource is to upgrade this coal so it can be used in current markets to generate steam and electricity, and in advanced technologies of gasification or liquefaction. The first step for use in any of these technologies is to reduce the moisture to increase the specific energy content.
The company is evaluating a number of technologies to ‘dry’ the coal from 45-55% moisture to 10%, thereby increasing the available energy in a tonne of coal by 80%. The problem in doing this is that the coal becomes much more dusty and prone to spontaneous combustion during transport and storage. The solution for this is to dry the coal then form it into briquettes that can be handled safely and easily. When this upgrading is done at the mine site the savings in transportation and efficiency when burned are significant, both to Adaro Energy and the customers.
Adaro Energy is considering building a medium-sized pilot plant to demonstrate the technology of coal drying and briquette making. Additionally Adaro will determine if the briquettes are suitable in its supply chain and verify that the economics are satisfactory. The pilot plant would pave the way to build commercial plants much larger in capacity.
Adaro Energy can only build sustainability far into the future by having the coal resources, using the best available technology and practices for production, having an effective team to supply the coal, and in building a team between the Company and the customers. This philosophy and practice has propelled Adaro to profitability in the present and will build a sustainable future.
Dee Rees
Dee Rees has worked in the coal industry for 40 years. He has a Ph. D. in chemical engineering from Brigham Young University, USA. He has been working with Adaro since 1992 as a technical consultant. He has recently been pioneering new technology on drying and upgrading Indonesian low-rank coals.

Adaro Energy Annual Report 2011 www.adaro.com98
A DiscussionMr. Chia Ah Hoo,Director &Chief Operation Offi cer
with
What are your thoughts about the company’s performance in 2011?
We had a record year of operational and fi nancial performance. We delivered on our targets set for 2011, while also executing on our strategic objectives of making acquisitions and moving downstream into power generation.
Our goal is to create a bigger and better Adaro Energy and I believe we did achieve that. Of course, we still have so much more to do, but I am happy and proud of what we’ve accomplished so far.
With our investment of PT Mustika Indah Permai (MIP) in August 2011 and the March 2012 release of MIP’s JORC reserves estimates of 273 million tonnes, we moved one step closer to beginning commercial operations and creating shareholder value from our investments in South Sumatra. We aim to have coal production within the second half of 2012. Together with our other South Sumatra investments, SMS and BEE, we are building long term, low cost assets to achieve our vision to become a leading Indonesian mining and energy group. The investments in South Sumatra are a strategic step to address improvements we wanted to make with our mining assets and to reduce revenue concentration risks.
Congratulations on achieving twenty years of uninterrupted production growth at Adaro Indonesia.
I am very proud of the team in South Kalimantan: such amazing dedication and hard work. Our mining contractor, SIS, has done very well in continuing to increase its production, now conducting about one third of Adaro’s mining. Our barging and logistics fi rm, MBP, is conducting up to 50% of Adaro’s barging and already delivers 50% of the fl oating crane volumes. It continues to get better each year.
You have said before that Adaro operates “beyond compliance”, what do you mean?
I am happy that we continue to go “beyond compliance” in terms of our responsibilities to manage the environmental, contribute to local communities and to help build the nation. For the fourth year in a row, we received the green level for the PROPER ranking from the Ministry of the Environment.
I am happy we remain the largest supplier to the domestic market. We are the largest in terms of tonnage. In 2011, we sold 12 million tonnes to the domestic market, which amounts to just under 25% of our total volume. While we have always had to prioritize the domestic market as part of the terms of our Contract of Work, just recently Indonesia introduced a regulation called the Domestic Market Obligation, which requires coal miners provide a certain percentage of their production to the local market. They fi rst enforced the DMO in 2011 and I am delighted that we not only met our obligation, we exceeded it.
What are you most excited about?
On a personal level, I am excited about my role here at Adaro Energy. I feel it goes beyond just a job. This is the opportunity of a lifetime for me. I am helping to take a non-renewable resource and turn it into a renewable resource by way of the benefi ts in terms of higher education, employment, etc. for those that work and live around our mines. This might sound a bit philosophical, but I believe Adaro is and will continue to be a channel of blessing for the tens of thousands of people that live in the communities that surround our operations. We provide, amongst other things, job security, which allows them to dream and grow and prosper. From coal to people: we are helping to develop the next generation and provide future prosperity for all.
Adaro Energy Annual Report 2011www.adaro.com 99
Menara Karya 22nd FloorJl. H R Rasuna Said Blok X-5, Kav 1-2, Jakarta 12950, Indonesia
Phone: 6221-5211265 Fax: 6221-5211266Email: [email protected] Website: www.adaro.com

Adaro Energy Annual Report 2011 www.adaro.com100
2005 2007 2008
LBO of Adaro
Jasapower Indonesia
Indonesia Bulk Terminal
Sarana Daya Mandiri
100%
100%
100%
100%
100%
100%
51.2%
100%
Our Subsidiaries
Management Report | Our Subsidiaries4
Alam Tri Abadi
Saptaindra Sejati
Makmur Sejahtera Wisesa

Adaro Energy Annual Report 2011www.adaro.com 101
2008 2009 2010 2011
Maritim Barito Perkasa
Jasapower Indonesia
Adaro Eksplorasi Indonesia
Bukit Enim Energi
Indonesia Multi-Purpose
Terminal
Mustika Indah Permai
Servo Meda Sejahtera
IndoMet Coal Project
100%51%
61.04%
85%
75%
35%
34%
25%
100%
While we expect their share of Adaro Indonesia’s volumes to grow, each subsidiary is kept in a competitive environment and will be rewarded with additional volumes only if their performance beats or exceeds competition.
When the time is right and if it will create value and further improve performance, we will publicly list the subsidiaries.
Chia Ah Hoo, Director & Chief Operations Offi cer
“ A Snapshot of Adaro Energy
From Us to You
Running Adaro
Management Report
Owning Adaro
Governing Adaro
Financial Report
Additional Information
1
2
3
4
5
6
7
8
04
26
35
68
144
152
164
269

Adaro Energy Annual Report 2011 www.adaro.com102
PT Saptaindra Sejati (SIS) is the third largest mining contractor in Indonesia and has been delivering industry leading contract mining services for almost ten years. We provide a broad range of services of contract mining, civil and infrastructure, as well as logistical supports to seven valued customers including PT Adaro Indonesia. All these contracts require the provision of all labor, equipment and materials for overburden removal, coal extraction, and coal hauling.
In 2011, we received two new projects from Balangan Coal. These two projects are located side by side at Balangan, South Kalimantan. The total production target for both contracts for the next fi ve years will be 20 million tonnes of coal and 88.6 Mbcm overburden removal. As part of the scope of works, we will also be
responsible to construct an 11 kilometers coal haul road to support Balangan’s mining activities.
The combination of expected weather conditions and the arrival of new and larger sized heavy equipment allowed us to deliver a 30% increase year over year in overburden removal to 167.2 Mbcm in 2011, of which 57% is Adaro’s portion or 95.9 Mbcm. Coal hauling also delivered a 33% increase year over year to 22.6 million tonnes, of which 35% is Adaro’s portion or 14.9 million tonnes.
SIS’s Board of Directors
Management Report | Our Subsidiaries 4
We own and operate advanced, large and well maintained heavy equipment. For instance, we operate 400 tonnes class hydraulic excavators and 200 tonnes capacity off-highway dump trucks for overburden hauling at Adaro’s operations. We decided to use larger equipment to maximize productivity, increase utilization and improve effi ciency.
The safety and health of our employees are our main priority and it is our goal to achieve an incident and injury free workplace. We are committed to meet this goal through internationally standard management systems OHSAS 18001 and ISO 14001. Our high standard in occupational health and safety has been recognized as we received “Utama Award” from the Ministry of Energy and Mineral Resources for our best safety practices at Berau operations in 2011. We are always committed to deliver projects on time, within budget, incident free and in an environmentally sustainable manner that is in harmony with the local community.
PT Saptaindra Sejati 2007 2008 2009 2010 2011
Key Financial Highlight (in US$)
Total Assets 315,411,170 438,550,024 460,949,438 482,816,959 564,288,407
Total Liabilities 263,110,532 357,922,570 362,759,068 381,851,787 449,370,635
Interest Bearing Debt 233,161,277 328,122,495 311,530,925 309,277,419 362,055,123
Total Equity 52,300,426 80,627,228 98,190,106 100,964,909 114,917,772
Revenue 149,368,298 189,407,537 264,334,683 304,457,243 424,743,115
Operating Statistics
Overburden Removal (Mbcm) 60.7 85.8 115.0 128.1 167.5
Coal Getting (million tonnes) 11.9 11.9 16.4 16.6 22.7
PT Saptaindra SejatiOperating Statistic
128.
1
11.9
60.7
11.9
85.8
16.4
115
16.6
2007 2008 2009 2010
167.
522
.7
2011
Overburden Removal (Mbcm)
Coal Getting (Mt)
PT Saptaindra Sejati
Anis SulistiadiPresident Director SIS
Anis Sulistiadi joined SIS in January 2008 and has been the CEO since October 2008. Prior to this he held various Senior Executive positions with United Tractors for 26 years. He was also a member of the Astra Quality Committee and Astra Bina Ilmu. He holds a degree in Agricultural Mechanization and Technology from the Bogor Agriculture Institute.

Adaro Energy Annual Report 2011www.adaro.com 103
SIS is the third largest coal mining contractor in Indonesia and provides a broad range of services such as exploration, drilling, contract mining and logistical support to Indonesia’s coal mining industry.
Graha Saptaindra Sejati JL. Letjen TB Simatupang Kav. 18, Jakarta 12430Phone: +6221-769-3378
“Partner in Your Mining Needs
PT Saptaindra Sejati
Map of SIS’s Operational Locations

Adaro Energy Annual Report 2011 www.adaro.com104
PT Maritim Barito Perkasa is a key barging contractor to Adaro Indonesia, providing a modern fl eet of tugs, barges and self-propelled barges carrying coal from Kelanis to Taboneo anchorage and IBT terminal for ship-loading and direct to domestic customers on Java Island. In addition, the company is the largest ship-loading contractor through a fl eet of four large, modern fl oating cranes.
Singapore based Orchard Maritime Logistics Pte Ltd. (OML) now provides a logistical support role and holds the porfolio on fl eet expansion planning, purchase and new construction on vessels for its sister companies Maritim Barito Perkasa (MBP) and Harapan Bahtera Internusa (HBI), after selling off all its marine assets to MBP and HBI in 2009 to comply with Indonesia’s cabotage laws.
During 2011, the combined MBP and HBI Fleet, together with chartered in third party vessels, transported 15.8 million tonnes, which was a 36% rise over 2010’s tonnage of 11.6 million tonnes. Adaro Indonesia remained as the largest customer with Indonesia’s third largest coal producer, Kideco Jaya Agung, utilizing our vessels to transport coal to
PT Newmont Nusa Tenggara, PT Semen Gresik (Persero) Tbk, and PT Cirebon Electric Power.
Transshipment tonnage through the fl oating cranes rose to 13.6 million tonnes, which was a 7% increase over 2010. This increase was achieved even though two out of the four fl oating cranes underwent mandatory repairs and surveys during the year, signifi cantly reducing their operational availability.
Management Report | Our Subsidiaries4
Personnel of Maritim Barito Perkasa (MBP) at Family
Gathering Event
Barging (OML, MBP, HBI) 2007* 2008* 2009* 2010** 2011**
Key Financial Highlights (in US$)
Total Assets 171,192,842 176,916,038 189,241,920 130,558,898 157,782,970
Total Liabilities 155,907,304 157,684,794 162,732,466 140,796,300 140,174,863
Interest Bearing Debt 130, 485,170 147,738,400 111,541 95,064 131,002,944
Total Equity 15,285,538 19,231,244 26,509,453 (10,237,404) 17,608,107
Revenue 47,163,789 69,955,163 71,299,980 60,249,459 92,186,117
Operating Statistics
Coal Transported (million tonnes) 6.8 9.5 10.4 11.6 15.8
Coal Transhipped (million tonnes) 9.4 10.6 11.4 12.7 13.6
* Combined fi gures of OML, MBP and HBI, translated using rate Rp. 9,400/US$ for convenience purposes only.** Figures of PT Adaro Logistics and subsidiaries, a holding company to PT Maritim Barito Perkasa and PT Harapan Bahtera Internusa. In October 2009 , the assets of OML were
restructured to PT Maritim Barito Perkasa and PT Harapan Bahtera Internusa in order to comply with Indonesia’s cabotage law and by the beginning of 2010 the entire fl eet was under Indonesia fl ag.
PT Maritim Barito Perkasa
MBP’s modern fl eet of marine transportation equipment continued to grow in 2011 with the barge fl eet growing to 16 units and tugs increasing to 19 units. In addition, the self-propelled barge fl eet increased from three to four units with the latest vessel being 25% larger at 15,000 deadweight tonnage (dwt).
In 2011, MBP also signed a Sale and Purchase Agreement to acquire another two tugs of 3,200 bhp and two barges of 13,200 dwt scheduled to be delivered in the fi rst quarter of 2012, and a shipbuilding contract for a fl oating transfer unit for offshore loading scheduled to be delivered in the second quarter of 2013. This will give a ship-loading capacity of at least 21 million tonnes per year.
MBP will continue its new building program in 2012 and will be committing to construct another fi ve units of 3,200 bhp tugs, fi ve units of 15,000 dwt barges and another accomodation barge for use at the Taboneo anchorage which will be able to accommodate up to 100 personnel. All are scheduled to be delivered in 2011.These new fl eet additions will ensure that MBP will be able to meet Adaro Indonesia’s expanding transport requirements as its coal production continues to increase in coming years.
Alan YimPresident Director MBP
Alan joined MBP in 2009 after being with the Chuan Hup Group of companies for 27 years in a variety senior positions ending as CEO of CH Logistics from 2002-2008. He holds a Chief Engineer’s certifi cate.
Coal Transhipped (Mt)
Adaro
Others
11.6
15.8
1.73
10.4
0.72
1.5
9.5
1.9
6.1
2007 2008 2009 2010 2011
7.6
8.63
10.8
7
14.3
Coal Transported(Mt)
0.3 0.1
12.4
12.7
13.6
0.12
11.3
11.4
10.6
9.4
2007 2008 2009 2010 2011Adaro
Others13.6

Adaro Energy Annual Report 2011www.adaro.com 105
PT Maritim Barito Perkasa
PT Maritim Barito Perkasa provides a modern fl eet of tugs, barges and self-propelled barges carrying coal from Kelanis to Taboneo anchorage and IBT terminal for ship-loading and direct to domestic customers on Java Island.
Jl. Kinibalu 45 Banjarmasin IndonesiaPhone : (051) 144 15124Fax : (051) 144 15179
PT Maritim Barito Perkasa
Map of MBP’s operations

Adaro Energy Annual Report 2011 www.adaro.com106
All internationally traded commodities are commercially impacted by one form of freight or another over a period of time. As in the case of Indonesian steam coal, it is primarily marine freight and its components that have a direct impact on the delivered cost of the commodity.
Before reviewing the marine freight market for 2011, it is important to take a step back to mid year 2010 and look at the then perceived sentiment that was in the wings for the year ahead. In fact it was a time of perceived optimism for many shipowners. It was correctly believed that there would be dry bulk world trade growth from 3,490 billion metric tons in 2010 and this we now know grew some 4.5 percent during the year. The supply of bulk carriers was also known to be growing, although it was not completely understood at the time how much of the forward order book on new building deliveries would actually materialise. With the benefit of hindsight, we note that the good growth figures in dry bulk world trade were spoiled, from a freight earning perspective, by the supply of new building bulk carriers, which increased some 14 percent during 2011 despite the scrapping of older bulk carriers increasing some 246 percent during the same period.
The impact following the expansion in supply of dry bulk tonnage resulted in daily average earnings severely droping during the period of 2010 and 2011, as Cape sizes experienced some 53% drop year over year (y-o-y) to end 2011 at an annual average of US$14,433 per day. Panamaxs’ lost some 44%, averaging an annual daily return for 2011 at US$11,340 per day and Supramaxs’ lost some 37%, averaging US$12,005 over the same period.
The graph opposite, provided by the Baltic Exchange in London, reflects four primary indices for the year 2011 on the industry work horse (the Panamax). The Red line represents the daily average earnings in US$ per day for the front haul route Atlantic to Far East, while the pale Blue line reflects an inter-pacific round voyage. The dark Blue line reflects back haul or Pacific / Atlantic trading and the Green line reflects a Time Charter average. What becomes clearly evident when looking at this graph is the dependency that time charter daily rates have on trade routes eminating from the West and heading to the East. This analogy being further supported when one considers
Australian coal exports, which diminished some 9.5% from 2010 figures to close at around 272 million tonnes of exports while the USA ramped up exports during the same period some 42% to end 2011 with about 90 million tonnes of coal exports.
Perceptions on the Shipping Market in 2011
4000
6000
8000
10000
12000
14000
16000
18000
20000
22000
24000
26000
28000
04/0
1/20
11
22/0
2/20
11
18/0
4/20
11
13/0
8/20
11
08/0
8/20
11
03/1
0/20
11
28/1
1/20
11
Alex HarkessShipping Consultant attached to Adaro Logistic (Director of Clarkson Asia)
As we have seen through this short take on 2011, dry bulk growth in demand was spoiled primarily by too much supply of dry bulk tonnages. At the end of 2011, the dry bulk fleet in the three main segments is reflected by about 1,352 Capes available with a further 36% of this figure on the forward order book – Panamaxs’ stand at around 2,026 units with a further 758 units on order representing about 40% additions to come and Supramaxs’ ended the year with a fleet of 2,463 vessels and 649 further units to come or a 28% fleet growth forecast – all fleet growth forecasts are primarily due for delivery during 2012 and 2013.
Current dry bulk “Spot” average daily earings at early January 2012 in all three main dry bulk segments return, between US$9,000 and US$9,500 per day irrespective of the size of the vessel. These reduced earnings may be reflective in part by concerns of the fleet size and anticipated further deliveries as well as rising oil prices, the culmination of numerous year end / start holidays, numerous financial economic forecasts from around the world and the political challenges that face us all in 2012.

Adaro Energy Annual Report 2011www.adaro.com 107
PT Sarana Daya Mandiri (SDM) is a South Kalimantan based company responsible for management and maintenance of the new Barito River channel. SDM manages marine traffi c in the new channel and conducts routine maintenance of the 15 kilometers channel through regular dredging. In 2008, SDM undertook the initial capital dredging of the new channel as a contractor to PT Ambang Barito Nusapersada, a company owned by the South Kalimantan Government. SDM was appointed to dredge the new channel as well as manage traffi c operations and works in cooperation with the Government to collect channel usage fees. This partnership allows SDM to recoup the cost of the initial capital dredging and fund its ongoing expenditures in maintaining the guaranteed channel depth to allow 24-hour movement of loaded coal barges, upkeep of navigational aids, and continuously upgrading of traffi c management systems to ensure navigational safety in the channel.
Dredging of the new channel effectively tripled the Barito River channel transport capacity to an estimated 200 million tonnes per year as it removed the tidal constraint that had been limiting vessel movements and also allowed transits of large vessels due to the increased depth and width of the new channel.
In 2011, the marine traffi c through the channel continued to increase both in terms of numbers and tonnage with the coal industry being the main user. Coal tonnage transported through the channel increased to 79.2 million tonnes as compared to 68.35 million tonnes in 2010, while the total number of vessels transiting through the channel rose from 8,807 in 2009 to 9,837 in 2011. The increase in the number of vessel transits was noteworthy as the actual number of general cargo and container vessels has been reducing since larger vessels are now replacing the smaller vessels, which used to operate in the channel before the new Barito River channel with its greater depth was constructed.
PT Sarana Daya Mandiri
Personnel of Sarana Daya Mandiri (SDM)
While shipping safety remains the responsibility of the port authorities, we take a leading role in providing advice to upgrade the standard operating procedures for navigational safety. It is particularly notable that despite the increased usage in 2011, there were no recorded or reported accidents in the channel.
To further upgrade the monitoring and control of traffi c and to assist with navigational safety, in 2011, we improved and upgraded our radar equipment. This improvement enabled us to extend our monitoring area from Taboneo anchorage through Trisakti port in Banjarmasin.
PT Sarana Daya Mandiri 2008 2009 2010 2011
Key Financial Highlights (in US$)
Total Assets 44,976,666 55,514,024 47,738,369 44,454,950
Total Liabilities 43,304,745 49,415,792 41,930,766 35,278,426
Interest Bearing Debt 42,823,966 46,141,572 40,248,892 33,998,897
Total Equity 1,671,921 6,098,232 5,807,603 9,176,524
Operating Statistics
Volume tonnage (million tonnes) - 58.3 68.4 79.2
PT Sarana Daya Mandiri
In order to build a winning team for a bigger and better Adaro, SDM continued its staff upgrading program and sent a number of employees to attend various special training programs throughout the year to ensure that they have the skills relevant to their jobs. SDM now has seven employees with the Hidropo Survey Certifi cate, fi ve employees with Terra Model Certifi cate, and fi ve employees with Radar Operators Certifi cate.
In March 2011, the shareholders approved a change in the senior management with Mr. Terry Ng becoming Director of Operations to replace Mr. Sonny Sidjaja.
In 2012, besides conducting maintenance of the channel to ensure the acceptable depth, the company will also put more focus on the traffi c safety and control, not only at the Barito River channel, but also along the main navigational lane from Banjarmasin port to Taboneo port.
The company will also collaborate with the Port Authorities in ensuring the development of a combined and comprehensive traffi c safety and traffi c control standard operating procedure will be put in place as soon as possible.
Fakhrol Azmi Bin HarunPresident Director SDM; Director MSW
Fakhrol Azmi holds a BA (Hons) in Accountancy from Northern University Malaysia. Prior to joining Adaro he worked with Tenaga Nasional Berhad for 12 years, and was President Director of TNB’s coal operations in Indonesia.

Adaro Energy Annual Report 2011 www.adaro.com108
Management Report | Our Subsidiaries4
PT Indonesia Bulk Terminal (IBT) operates the South Pulau Laut coal terminal which has been operating since 1998 and is one of only two terminals in Indonesia authorized to provide common user coal handling and shiploading services to the coal industry. We can load up to large Panamax bulk carriers and have a nominal annual capacity of 12 million tonnes. Since commencement of operations, we have shipped more than 90 million tonnes of coal around the world.
In 2011, our coal tonnage throughput was 4.39 million tonnes, a 29% drop in tonnage compared with 2010. Of this total, 2.10 million tonnes was related tonnage from Adaro Indonesia while 2.29 million tonnes was from third party users of the terminal. A total of 65 vessels were loaded, a 31% drop from 2010.
The reduction in tonnage throughput for the year was primarily due to new regulatory requirements from the Government, which affected coal trader operations in the fi rst half of the year, followed by slowing market demand in Japan, due to the outage of many of the country’s coal
To extend the operating life of our cranes and to ensure a high level of availability as well as reliability, in 2011 we undertook major overhauls on our four cranes discharging cranes and will replace these barges with new units scheduled to be installed by the end of 2013.
The Shell managed fuel terminal continued in its prime role as a fuel storage and distribution center in support of PT Adaro Indonesia’s operations. This terminal has an 80,000 kiloliter tank capacity and an annual throughput capacity of 720,000 kiloliters. During the year a total of 293,796 kiloliters was transshipped to Adaro’s receival facilities at Kelanis on the Barito River.
Future development for the fuel terminal will see a new fuel jetty to load fuel barges constructed through 2012 and scheduled for operation by 2013. The availability of this new fuel barge loading wharf will further reduce possible weather disruptions to barge loading operations. From January 2012, we will introduce our new logo which will defi ne our team spirit in striving for operations excellence in building a bigger and better Adaro.
Personnel of Indonesia Bulk Terminal (IBT).
PT Indonesia Bulk Terminal
PT Indonesia Bulk Terminal 2007 2008 2009 2010 2011Key Financial Highlights (in US$)Total Assets 176,110,220 176,673,960 179,031,335 94,313,307 94,421,834Total Liabilities 38,135,673 29,563,933 29,065,251 28,809,445 28,709,552Interest Bearing Debt 30,165,353 1,871,045 1,934,905 - -Total Equity 137,974,547 147,110,029 149,966,084 65,503,862 65,712,282Revenue 50,366,881 34,266,097 19,256,206 26,983,282 22,041,246Operating Statistics Related Parties (million tonnes) 10.7 6.3 3.3 3.5 2.1Third Parties (million tonnes) 1.3 1.8 1.4 2.8 2.3Coal Tonnage Handled (million tonnes) 12.0 8.1 4.6 6.2 4.4Vessels Loaded 185 125 72 95 65
fi red power stations after the tsunami in March, and in India and the increased use of the more economical Taboneo anchorage by Adaro.
In order to reduce the tonnage volatility of spot trader contracts, we focus our marketing efforts on developing longer term relationships directly with Central and South Kalimantan coal producers from the Barito River area who can benefi t from the use of IBT’s stockpiles as a buffer against transportation constraints due to low water levels in the river. A term contract is already in place with a Central Kalimantan producer and we will develop more in the future.
Sonny SidjajaIBT GM, Director IMPT
Sonny joined Adaro Group in 2008. Prior to this, he was Head of Logistics Business for Surabaya Area with AKR Corporindo Group, and then General Manager of HRD and Production at PT Aiwa Indonesia. He holds a Mechanical Engineering Degree from Trisakti University.
PT Indonesia Bulk TerminalCoal Tonage Handled
(‘000 tonnes)
Related Parties
Third Parties
1.38
1.80
1.25
2.75
11.9
7
8.07
4.64
6.23
2007 2008 2009 2010 2011
3.25
3.486.
2710.7
2
2.34.
42.
1

Adaro Energy Annual Report 2011www.adaro.com 109
PT Indonesia Bulk Terminal
Head Offi ce:Menara Karya, 22nd FloorJl. H.R. Rasuna Said, Blok X-5, Kav 1-2Jakarta 12950, IndonesiaTel : (6221) 5229250Fax : (6221) 5224341Email : [email protected] : www.ptIBT.com
Terminal:Desa Mekar PutihKec. Pulau Laut Barat, Kab. KotabaruKotak Pos 118Kalimantan Selatan, IndonesiaTel : (62518) 38800Fax. : (62518) 38822
A premium international bulk port and handling center

Adaro Energy Annual Report 2011 www.adaro.com110
Coaltrade is based in Singapore and acts as a commissioned head agent to Adaro Indonesia for export sales in specifi c countries and geographic areas. We are also engaged in the services of sub-agents to market the coal supply to power companies and industrial end-users in Italy, India, Malaysia, Japan, Korea, Taiwan, Hong Kong, Philippines, and the Americas. In addition to this, we also trade in the third party coal business when opportunity arises and price it for onward sales or direct sales to end users. We are established with a solid team of legal and fi nance personnel to help support and strengthen our continued growth.
Overall, we have enjoyed a good year in 2011. While we refl ect on what have been achieved, we need to be mindful of the continuing effects of the European debt crisis and slowing demands in China and India. In the face of these challenges, we constantly monitor the market situation and identify market niches and opportunities to capitalize on.
The 2011, results showed a signifi cant rise over 2010 with total coal sales of 5.96 million tonnes for the year compared to 4.43 million tonnes in 2010 – a rise of 35%. These achievements were made possible due to the rise in third party sales from 1.39 million tonnes in 2010 to 3.61 million tonnes in 2011. The increase highlighted the efforts that Coaltrade has put in to develop third party trading to ensure continuous growth in existing relationships and strives to forge new ones in the region and around the world.
Coaltrade Services International 2007 2008 2009 2010 2011Key Financial Highlights (in US$)Total Assets 244,427,695 231,541,248 228,265,709 168,237,203 207,393,810Total Liabilities 226,178,428 185,814,397 175,172,110 146,255,041 142,135,462Interest Bearing Debt 200,000,000 157,654,590 144,690,590 127,964,351 101,327,642Total Equity 18,249,267 45,726,851 53,093,599 21,982,162 65,258,348Revenue 315,647,939 383,664,769 211,691,085 292,161,076 542,348,866Operating StatisticsTotal Coal Sales (million tonnes) 9.3 8.0 3.4 4.4 6.0Adaro (million tonnes) 7.5 7.0 3.0 3.0 2.4Third Parties (million tonnes) 1.9 1.0 0.4 1.4 3.6
Management Report | Our Subsidiaries4
Personnel of Coaltrade Services International.
Edwin TsangMarketing Director AIPresident Director Coaltrade
Edwin joined Adaro in 2006. He has over 30 years of experience within the coal industry the latest being with Total Energy Hong Kong. He holds a Bachelor Degree in mechanical engineering and an MBA from the Chinese University of Hong Kong.
Coaltrade Service International Pte. Ltd.Coal Sales (‘000 tonnes)
Adaro
Third Parties
3.35
0.35
0.96
1.85
9.32
7.96
7.00
7.48
4.43
1.39
3.04
3.0
2007 2008 2009 2010 2011
5.96
3.61
2.35

Adaro Energy Annual Report 2011www.adaro.com 111
Coaltrade International Pte. Ltd. | PT Adaro Power
PT Adaro Power’s (AP) vision is to become a major contributor to the electric power generation sector in Indonesia. Our mission is to support the community and national development efforts of the Indonesian government, to complement the Adaro Group’s coal mining activities and to maximize shareholder value. Our business focus is the development of coal fi red steam power projects and selective development of renewable energy projects such as geothermal power.
Our subsidiary, PT Makmur Sejahtera Wisesa (MSW) is developing our fi rst power generation project, a 2x30 MW coal fi red mine-mouth power plant in Tanjung, South Kalimantan. This mine mouth power station will be fuelled by Wara coal from Adaro Indonesia’s nearby mine and is estimated to cost US$160 million. We will use the electricity generated from this power station for our mining operations, including our in-construction overburden crusher and conveyor, to reduce diesel fuel consumption. Construction of the plant has been underway since mid-2009 with commercial operation currently scheduled for the third quarter of 2012.
We are also involved in the development of a major base load coal-fi red steam power plant, which will be located in Batang Regency, Central Java. With a capacity of 2x1,000 MW, the project is one of the fi rst and largest power plant projects in South East Asia that will
Adaro Power’s Board of Directors, from left to right: Mr. Ernest Kee, Mr. Joseph Chong, Mr. Andre Mamuaya, Mr. Adrian Lembong and Mr. Mohammad Effendi.
PT Adaro Power
utilize the Ultra Super Critical Boiler technology. For this project, we established PT Bhimasena Power Indonesia (BPI), a special purpose company owned by a consortium comprising of JPower (34% ownership) and Itochu (32%) of Japan together with Adaro Power (34%).
Adaro Power formed a partnership with Korea East West Power, a subsidiary of South Korea based Kepco to build a 2x100 MW power plant project in Souh Kalimantan. Adaro Power holds 65% share of the consortium with the remaining 35% is held by Korea East West Power.
Andre J MamuayaDirector, Corporate Affairs AEPresident Director Adaro Power
Andre is the Director of Corporate Affairs of PT Adaro Energy, President Director of PT Jasapower Indonesia, PT Adaro Logistics, PT Adaro Power, PT Adaro Mining Technologies, and Orchard Maritime Logistics. He also serves as a Director at PT Alam Tri Abadi, PT Adaro Indonesia, PT Mustika Indah Permai, PT Adaro Strategic Investments, PT Dianlia Setyamukti, and PT Persada Capital Investama.
He is also the President Commissioner of PT Bhimasena Power Indonesia – a consortium of JPower-Adaro-Itochu, PT Indonesia Multi-Purpose Terminal, and Commissioner of PT Saptaindra Sejati, PT Makmur Sejahtera Wisesa, PT Harapan Bahtera Internusa, PT Pandu Alam Persada, PT Adaro Persada Mandiri and PT Tri Nur Cakrawala. He served as a Director of PT Anugrahtimur Sejatiperdana from 1997 to 2000.
He completed his engineering education at the department of Industrial Mechanical Engineering of Tokyo Denki University (Japan) in 1994 and graduated from the American College, Los Angeles (USA) in Business Administration in 1996.
Richard TampiBusiness Development GM Adaro Power
Richard has over 14 years of experience working in mining industry with various exposures. Prior joining Adaro in 2007, he worked for PT Freeport Indonesia and Sinarmas Mining and Energy with the last position being responsible for the Marketing and Trading. He holds a degree in Financial Economics from University of Minnesota.
Additionally, we are in the fi rst phase of acquiring an equity stake in Sejahtera Alam Energy (SAE) that holds the right to develop a geothermal project in Baturaden, Central Java. The acquisition will be done in three phases. This project is now undergoing a feasibility study. The geothermal resource is estimated to support a power output of around 80MW to 300MW.
Our involvement in these projects, totaling up to 2,560 MW, will make us the largest private power producer in Indonesia and help achieve our vision of becoming a bigger and better Adaro through sustainable growth and diversifi cation.

Adaro Energy Annual Report 2011 www.adaro.com112
Safety
Adaro Energy is committed to maximizing workplace safety in all its operations to achieve its vision of being a leading Indonesian mining and energy group. We strive to create a safe working environment so that our employees can go home safe and healthy at the end of each day. We require our employees and contractors to have the knowledge, skills and desire to comply with national and international standards of occupational health and safety to minimize risk of accidents and injuries occurring from operations. We also have a number of initiatives to help achieve our goals of eliminating work place accidents.
We continue to implement our integrated safety, environmental and production management system, known as Adaro Safety, Environment and Production (A-SEP) which is aligned to the ISO 14001 and OHSAS 18000 international standards. This integrated system is an important element in ensuring high levels of worker productivity and overall production. In addition, it incorporates
Management Report | Occupational Health and Safety4
Occupational Health and Safety
In this ChapterIn this Chapter

Adaro Energy Annual Report 2011www.adaro.com 113
environmental management and follows Government regulations for occupational health and safety and environmental regulations.
All new employees are required to attend intensive safety induction activities to understand the basic concept of occupational safety and equipment, as well as applicable rules and regulations. As part of the evaluation program, we require our employees to attend regular safety training sessions to assess their safety performance. We also monitor the
safety performance of the contractor workforce on a daily basis, with their performance and work hours included in reported safety related statistics. On a quarterly basis, we conduct Safety Awareness meetings with the senior management of each contractor as part of our commitment to improve our safety performance by providing a forum for open communication to learn and share. In addition, safety induction sessions are also conducted for all guests entering our operations site and mining areas.
To improve employee awareness on safety, health and environmental issues, as well as to create a safe working environment culture, we employed a Group General Manager of SHE in 2011 to create policies, which will be implemented by all level within the Company’s business units and operating subsidiaries.
We use the Lost Time Injury Frequency Rate (LTIFR) as one measure of safety performance. This is an internationally recognized standard and measures
Fuga. Ulles aliam facea de dus autenim agnimin
Wisnu SusetyoCorporate Health, Safety & Environment GM
Wisnu Susetyo joined Adaro in 2011, and has 35 years of experience. Prior to joining Adaro he worked with Freeport Indonesia, and the National Nuclear Energy Agency. He obtained a PhD in Chemistry from the University of Georgia and MSc and Drs Degree from Gadjah Mada University.
Central Kalimantan
South Kalimantan
East Kalimantan
Our Lost Time Injury Frequency Rate (LTIFR) in 2011 is 0.42.
Our integrated safety, environmental and production management system – Adaro Safety, Environment and Production (A-SEP) is align to the ISO 14001 and OHSAS 18000 international standards.
Map of Adaro’s Operational Site
A Snapshot of Adaro Energy
From Us to You
Running Adaro
Management Report
Owning Adaro
Governing Adaro
Financial Report
Additional Information
1
2
3
4
5
6
7
8
04
26
35
68
144
152
164
269
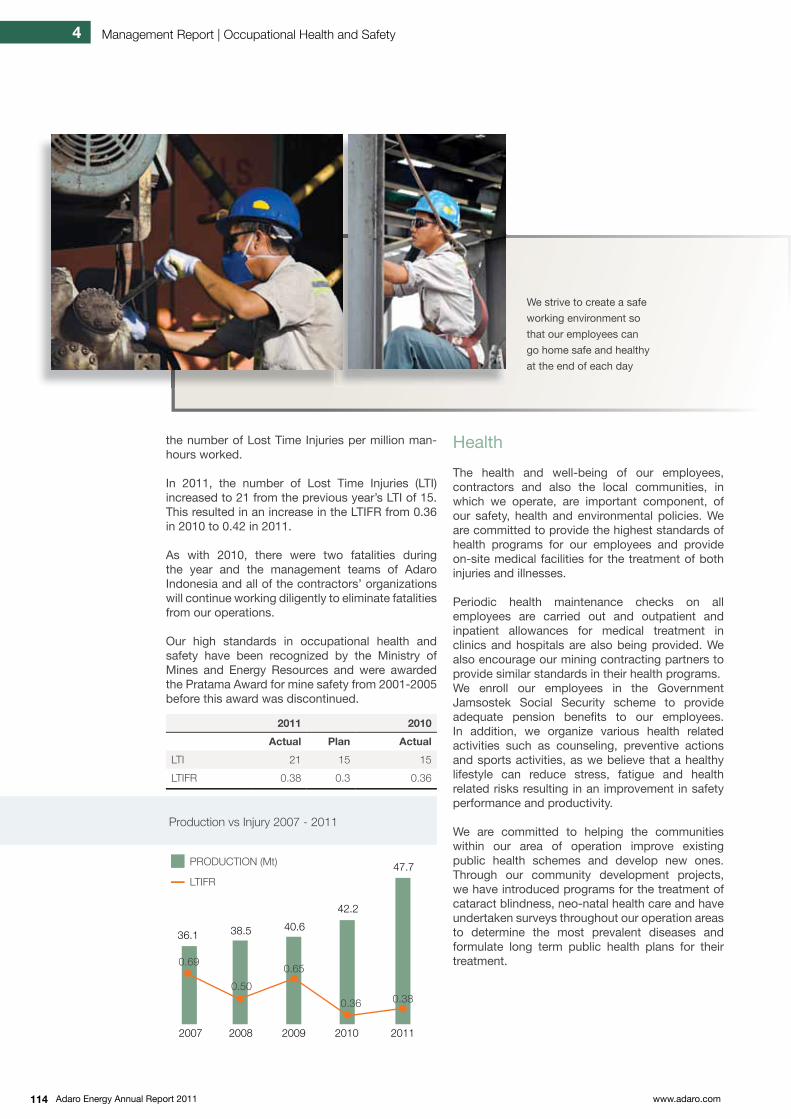
Adaro Energy Annual Report 2011 www.adaro.com114
Health
The health and well-being of our employees, contractors and also the local communities, in which we operate, are important component, of our safety, health and environmental policies. We are committed to provide the highest standards of health programs for our employees and provide on-site medical facilities for the treatment of both injuries and illnesses.
Periodic health maintenance checks on all employees are carried out and outpatient and inpatient allowances for medical treatment in clinics and hospitals are also being provided. We also encourage our mining contracting partners to provide similar standards in their health programs.We enroll our employees in the Government Jamsostek Social Security scheme to provide adequate pension benefi ts to our employees. In addition, we organize various health related activities such as counseling, preventive actions and sports activities, as we believe that a healthy lifestyle can reduce stress, fatigue and health related risks resulting in an improvement in safety performance and productivity.
We are committed to helping the communities within our area of operation improve existing public health schemes and develop new ones. Through our community development projects, we have introduced programs for the treatment of cataract blindness, neo-natal health care and have undertaken surveys throughout our operation areas to determine the most prevalent diseases and formulate long term public health plans for their treatment.
Management Report | Occupational Health and Safety4
the number of Lost Time Injuries per million man-hours worked.
In 2011, the number of Lost Time Injuries (LTI) increased to 21 from the previous year’s LTI of 15. This resulted in an increase in the LTIFR from 0.36 in 2010 to 0.42 in 2011.
As with 2010, there were two fatalities during the year and the management teams of Adaro Indonesia and all of the contractors’ organizations will continue working diligently to eliminate fatalities from our operations.
Our high standards in occupational health and safety have been recognized by the Ministry of Mines and Energy Resources and were awarded the Pratama Award for mine safety from 2001-2005 before this award was discontinued.
We strive to create a safe
working environment so
that our employees can
go home safe and healthy
at the end of each day
Production vs Injury 2007 - 2011
2011 2010
Actual Plan Actual
LTI 21 15 15
LTIFR 0.38 0.3 0.36
PRODUCTION (Mt)
LTIFR
2007 2008 2009 2010 2011
36.1 38.5 40.6
42.2
47.7
0.69
0.50
0.65
0.36 0.38

Adaro Energy Annual Report 2011www.adaro.com 115
In 2007, Adaro established an Emergency Response Team as an extension of its Safety, Health and Environmental program. It was recognised that a specially trained group within the mining area was needed to provide an immediate response to any type of emergency.
To date, the Emergency Response Team has grown to 85 members drawn from Adaro and its contractors. All members of the Emergency Response Team have undergone specialized training in open cut mine rescue, structural collapses, firefighting, and rescue from height and water. Much of the training has been provided by the Indonesian National Search and Rescue Body.
Besides undertaking emergency response activities throughout the Company’s mining area, the Team is involved in a program of disaster emergency management under the Ministry of Energy and Mineral Resources that is in charge of providing aid and assistance in the case of national disasters. Adaro’s ERT has been assigned to be directly in charge of providing emergency relief in a number of locations where national disasters that occurred, including the flood emergency in Jakarta in 2009, a major earthquake in Padang, West Sumatra in 2010 and the volcanic eruption of Mount Merapi in Central Java in 2011.
The team has also been involved in providing emergency response aid in the area surrounding the mining location, including the search for victims of a boat capsize accident in Rantau and the search for drowned victims in Tabalong, Balangan and Hulu Sungai Selatan. The Team also provides various forms of emergency response training activities to local government authorities and NGOs including District Military Commands, the Disaster and Fire Management Units in Tabalong, Balangan and Hulu Sungai Selatan
Responding to Emergencies
Health | Responding to Emergencies
regencies and the joint emergency disaster drill in Balangan and Tabalong.
Every year since its formation in 2007, the Team has participated in the Indonesian Fire and Rescue Challenge, which is an annual event organized by the Ministry of Energy and Mineral Resources where participants from the mining, oil and gas, power and cement industries share particular emergency response techniques and take part in various competitions. Adaro’s team has also been particularly successful in the competitions receiving a total of seven awards in such areas as water rescue, warehouse fire and rescue and motor vehicle rescue.
Fadjar Widijanta, External Relations Manager
Fadjar joined Adaro in 2003. Prior to this this he was the Scientific Assistant to the Executive Director of the Indonesian Coal Mining Association and from 1995 to 2001 held geological posts with Ivanhoe Mines Ltd and the South East Java Project. He has a degree in Geological Engineering from UPN Veteran, Yogyakarta.
Adaro Energy Annual Report 2011 www.adaro.com116
As a company that manages natural resources, we understand that our operations have an impact on our surrounding environment. Hence, since the beginning of our operations, we have strongly committed to implement our mining principles to internationally recognized standards.
Our environmental performance is strictly regulated and controlled by the use of an Environmental Management System aligned with ISO 14001 standards. In addition, various other programs for environmental management, monitoring, and
EnvironmentalManagement
A close shot of leaf from reclamation activity at Paringin
Management Report | Environmental Management4
Iswan SujarwoHealth, Safety & Environment and Corporate Social Responsibility Deputy GM
Iswan holds a Degree in Mining from from UPN Yogyakarta and has 25 years experience in coal mining and safety, health, and environment. Prior to joining Adaro in 1991, he worked with Kaltim Prima Coal.
In this ChapterIn this ChapterDuring 2011, our reclamation of mined land continued to accelerate with 197 hectares being seeded through hydro seeding and 2.7 million trees being planted.
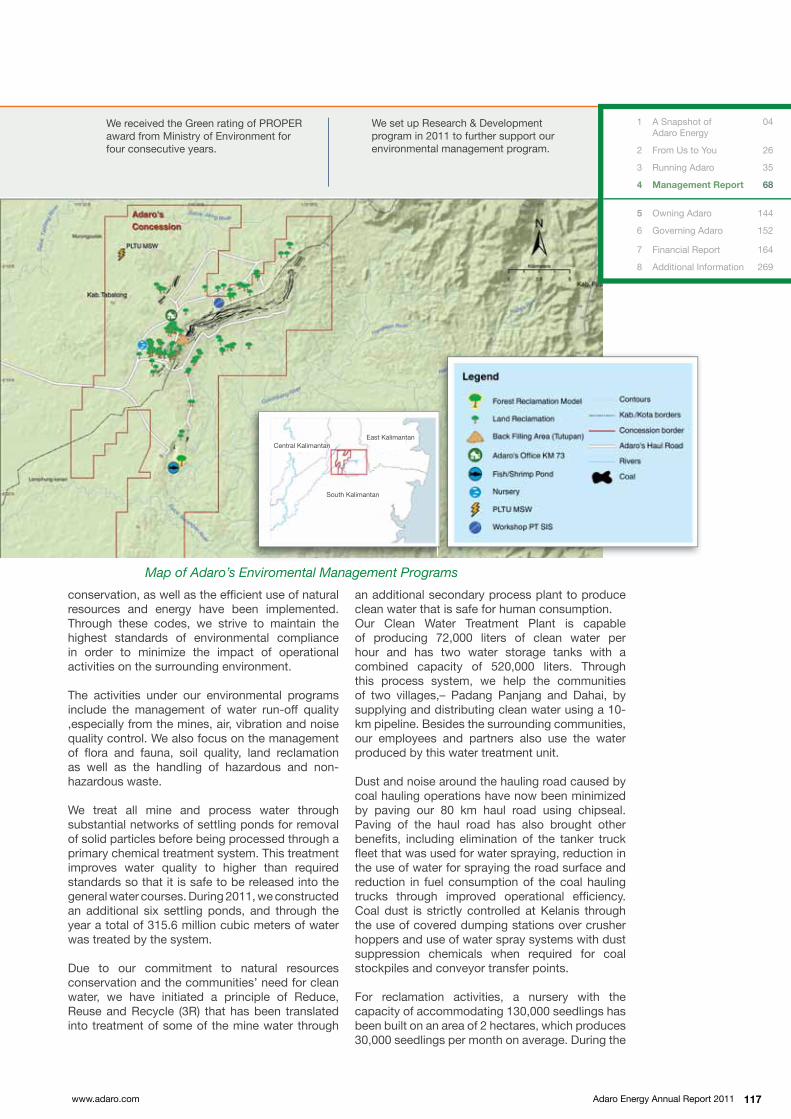
Adaro Energy Annual Report 2011www.adaro.com 117
an additional secondary process plant to produce clean water that is safe for human consumption.Our Clean Water Treatment Plant is capable of producing 72,000 liters of clean water per hour and has two water storage tanks with a combined capacity of 520,000 liters. Through this process system, we help the communities of two villages,– Padang Panjang and Dahai, by supplying and distributing clean water using a 10-km pipeline. Besides the surrounding communities, our employees and partners also use the water produced by this water treatment unit.
Dust and noise around the hauling road caused by coal hauling operations have now been minimized by paving our 80 km haul road using chipseal. Paving of the haul road has also brought other benefi ts, including elimination of the tanker truck fl eet that was used for water spraying, reduction in the use of water for spraying the road surface and reduction in fuel consumption of the coal hauling trucks through improved operational effi ciency. Coal dust is strictly controlled at Kelanis through the use of covered dumping stations over crusher hoppers and use of water spray systems with dust suppression chemicals when required for coal stockpiles and conveyor transfer points.
For reclamation activities, a nursery with the capacity of accommodating 130,000 seedlings has been built on an area of 2 hectares, which produces 30,000 seedlings per month on average. During the
conservation, as well as the effi cient use of natural resources and energy have been implemented. Through these codes, we strive to maintain the highest standards of environmental compliance in order to minimize the impact of operational activities on the surrounding environment.
The activities under our environmental programs include the management of water run-off quality ,especially from the mines, air, vibration and noise quality control. We also focus on the management of fl ora and fauna, soil quality, land reclamation as well as the handling of hazardous and non-hazardous waste.
We treat all mine and process water through substantial networks of settling ponds for removal of solid particles before being processed through a primary chemical treatment system. This treatment improves water quality to higher than required standards so that it is safe to be released into the general water courses. During 2011, we constructed an additional six settling ponds, and through the year a total of 315.6 million cubic meters of water was treated by the system.
Due to our commitment to natural resources conservation and the communities’ need for clean water, we have initiated a principle of Reduce, Reuse and Recycle (3R) that has been translated into treatment of some of the mine water through
Map of our environmental management programs
We set up Research & Development program in 2011 to further support our environmental management program.
We received the Green rating of PROPER award from Ministry of Environment for four consecutive years.
South Kalimantan
Central KalimantanEast Kalimantan
Map of Adaro’s Enviromental Management Programs
A Snapshot of Adaro Energy
From Us to You
Running Adaro
Management Report
Owning Adaro
Governing Adaro
Financial Report
Additional Information
1
2
3
4
5
6
7
8
04
26
35
68
144
152
164
269

Adaro Energy Annual Report 2011 www.adaro.com118
year, our reclamation of mined land continued to accelerate with 197 hectares being seeded through hydro seeding and 2.7 million trees being planted.
We are proud of our achievement in improving environmental performance. In 2011, our environmental management and supervision initiatives were recognized by various governmental institutions with a number of prestigious awards. We received the Gold rank of Aditama Award from the Ministry of Energy and Mineral Resources, as a coal company with the highest grade for all evaluation criteria of environmental activities. We have received this award for two consecutive years. We also received the Green rating of PROPER award from the Ministry of Environment for four consecutive years. Furthermore, we received an award presented by the Ministry of Forestry to appreciate our participation in the government program of planting 1 billion trees.
Paringin: Our Responsibillity to Environment and Communities
Paringin, located in Balangan regency of South Kalimantan and approximately fi ve kilometers south of the current Tutupan operations, is where our ultra clean “Envirocoal” was fi rst produced from 1992 until 1997 through two pits known as North and South Paringin.
Our reclamation activities at Paringin commenced from 1996 in the disposal area and in 1997-1998 we expanded the activities to the inpit backfi ll area. The objective was to utilize the land and create ecological and economic benefi ts with reclamation phases, including land layout, erosion and sedimentation control, re-vegetation, and plant maintenance. After mining activities moved to Tutupan, reclamation focused on the South Paringin area as there were known to be additional coal resources in North Paringin.
South Paringin has now been returned to an original state through reclamation, and this successful project now benefi ts not only the local communities, but also the ecosystem, and South Paringin has become a model location for successful reclamation.
Wildlife has slowly been returning to the area and a group of wild pigs, bekantan, a long-nosed ape native to Kalimantan, as well as eagles are seen here, a sign that the ecosystem is recovering
Aquaculture has been successful in the South Paringin Lake where mine water has been proved safe for the cultivation of shrimps and tilapia fi sh under collaboration with LIPI Limnologi since 2009. This program has also become the basis for commercial community projects under our Community Development Programs.
Management Report | Environmental Management4
Christopher PitchMarketing Consultant
Chris has been working with Adaro and its previous shareholders in Indonesia since 1984. He was involved in the development of Adaro and IBT and other Group operations in marine logistics and ship chartering.
A dragonfl y at our South Paringin reclamation site

Adaro Energy Annual Report 2011www.adaro.com 119
Research & Development Program
In 2011, we set up a special unit in charge of Research & Development under the umbrella of the Health, Safety & Environment (HSE) Department. The research and development activities being conducted are not only for our internal purposes, but also for the benefits of the environment and the communities.
We have carried out a number of R&D programs as follow:
a. Model Forest on Ex-Mined Land In collaboration with the Forestry Research Center of Banjar Baru – South Kalimantan, we created a model reclamation forest on the ex-mined land of Paringin. The activities under this program include research, collection, and enrichment of native Kalimantan plants, which will be developed for the model reclamation forest. To date, this program has collected 16,000 seedlings of various types of forest plants.
b. Utilization of Cattle Waste for FertlizerBioculture and biourine are made using cows’ waste and urine produced by an animal husbandry unit built by Adaro, which has raised and bred 600 cows. Other than fulfilling the need for fertilizer for re-vegetation, the husbandry is integrated with the CSR program for developing nucleus / plasma system. Bioculture and biourine are liquid organic fertilizers containing macro nutrients and micro essentials and are used for re-vegetation of ex-mined land with cultivated plants, pioneer forest plants, primary plants, vegetables, and cover crops.
c. Development of Online Monitoring and Control System for Settling Ponds To enhance the effectiveness and efficiency of environmental monitoring, we have collaborated with the Indonesian Institute of Sciences’ Limnology Science Development since 2010 in developing an online monitoring and control system for water quality and volume in mine settling ponds, which is expected to make water management more effective and efficient.
d. Management of organic compost Our canteens provide daily meals for more than 16,000 employees and produce a large amount of organic waste. Since 2007, we have collaborated with Hokkaido University of Japan and Lambung Mangkurat University (UNLAM) of South Kalimantan to develop a process to turn this waste into compost. The compost produced assists in improving the fertility of disposal soil, ex-mined land, and the growth of the plants on with minimal or no top soil cover.
We have also developed a recreational area and a camping ground by the lake in Paringin, which is used for recreational activities by schools and communities from the surrounding area.
We are collaborating with the Forestry Research Center of Banjar Baru, South Kalimantan in developing a 1.5 hectare model reclamation forest within the South Paringin area. In this location, we carry out plant research and enrichment to collect native Kalimantan plants. To date, this program has collected 16,000 seedlings of various types of native Kalimantan forest plants which are being grown as part of the Paringin model forest.
In the future, Paringin will become a bio laboratory for the development of native Kalimantan plants for future generations with a number of native species such as Ulin, Keruing, Tengkawang, Biwan, Bayur, Kapur and Keminting Rantau having been planted there already.
Our Responsibility to Environment and Communities | Research & Development Program
An aerial shot of South Paringin - a model location for successful reclamation

Adaro Energy Annual Report 2011 www.adaro.com120
e. Utilization of mine water for the cultivation of fresh water shrimps and tilapia fi shIn collaboration with the Indonesian Institute of Sciences’ Limnology Science Department, we have conducted research since 2009 to investigate the potential use of mine water in the reclaimed Paringin mine for fi shery activities, specifi cally for tilapia fi sh and fresh water shrimp cultivation. The research showed that the mine water was safe for aquaculture and that the fresh water shrimp and tilapia fi sh bred during the research, meeting Indonesian National Standards.
Going forward, this area will be made a center for fresh water shrimp and tilapia fi sh cultivation and will be integrated with the CSR programs. Adaro will also provide technical training on the cultivation and build a fi sh feed factory using local raw materials. The business created will benefi t the communities by becoming a community empowerment program and part of the post mining plan.
f. River Current Monitoring Station Due to the need for accurate, continuous and reliable data for monitoring of water resources, we built a River Current Monitoring Station in 2010 located in an area of the Tutupan and Jaing rivers in Tabalong regency. This station is equipped with an Automatic Rain Recorder River current meter and a tool for sedimentation sampling to provide relevant hydrologic, hydrometric, rain, and sedimentation data continuously or periodically as required to support operational activities and the formulation of a post mining program.
Update on Biodiesel Fuel Pilot Project
Our support to the government program of using environmentally friendly alternative energy sources has been packaged in an initiative to make a breakthrough in energy conservation. In 2009, we started collaboration with Komatsu and United Tractors to build a pilot biodiesel processing factory with the capacity of 1.1 tonne per day launched on May 31st, 2011.
The Opening Ceremony was attended by the Minister of Energy and Mineral Resources, Darwin Zahedy Saleh and witnessed by the Director General of Mineral and Coal, Thamrin Sihite, Deputy of Environmental Pollution Control of the Ministry of Environment, Karliansyah, the Governor of South Kalimantan, Rudy Arifi n, a number of regional offi cials and the directors of PT Adaro Energy Tbk, Komatsu and United Tractors.
This pilot project positions us as the fi rst coal company to engage in the production of biodiesel, refl ecting our commitment to support the use of alternative energy.
of a post mining program. offi cials and the directors of PT Adaro Energy Tbk, Komatsu and United Tractors.
This pilot project positions us as the fi rst coal company to engage in the production of biodiesel, refl ecting our commitment to support the use of alternative energy.
Management Report | Environmental Management4
Dwi Yuli HastutiStatutory Planning and Statistic
Dwi Yuli Hastuti joined Adaro in 1996 and has over 16 years experience in coal operations. She is Dayak native and began her career in Adaro after getting her Mining Engineering Degree from the National Academy of Development Engineering.
Land clearing activity Coal mining activity Overburden removal

Adaro Energy Annual Report 2011www.adaro.com 121
Jatropha is considered as one of the ideal feedstock plants that produces oil from its inedible seeds and grows even on dry and less fertile soil.
Biodiesel is an eco-friendly fuel produced from the Jatropha Curcas plant and other types of feedstock such as palm oil and will be used in dump trucks operating in the mine.
A feasibility study will be made in 2012 to develop the project further. This study will investigate loading performance, engine performance, the cost of producing biodiesel in comparison with the price of conventional diesel, factory productivity, labor skills, the supply of raw material especially Jatropha and the cultivation of Jatropha
1
In March 2010, Adaro, Komatsu, and UT started the Project to produce Bio Diesel Fuel (BDF) from Jatropha and other feedstock plants to operate Komatsu mining dump trucks (payload: 90-tonnes).
2
4
Update on Biodiesel Fuel Pilot Project
3
The ultimate aim of the program is to replace 20% of the diesel fuel consumed in 100 Komatsu dump trucks with bio-diesel which will not only reduce diesel fuel consumption but will also reduce CO2 emissions by up to 20,000 tons per year.
Komatsu mining dump truck operated by Bio Diesel Fuel (BDF)
on the communities’ land under CSR program and on our reclaimed land. Going forward, this will support the production of locally supplied raw material for our local consumption.
The ultimate aim of the program is to replace 20% of the diesel fuel consumed in 100 Komatsu dump trucks with bio-diesel which will not only reduce diesel fuel consumption but will also reduce CO2 emissions by up to 20,000 tons per year.
A snapshot of mining activity from land clearing to revegetation activity
Management disposal area Revegetation activity

Adaro Energy Annual Report 2011 www.adaro.com122
In this ChapterIn this Chapter
Exploration and Reserves
The Tutupan coal deposit is found over a strike length of 20 km with the thickest coal of 50 meter of width
Management Report | Exploration and Reserves4
Rommel CruzProduction Deputy GM
Rommel joined Adaro in June 1991. He oversees long and short term mine planning, pit civil works, waste water management, land reclamation and mining operations of Tutupan, Wara and Paringin mines. He holds a degree in Geodetic Engineering from the University of The Phillippines
As a resource based company, Adaro Energy recognises that continued growth in exploration and expansion of our coal reserve and resources base are critical components of our strategy to achieve long term growth from Indonesian coal. While we will continue to undertake programs
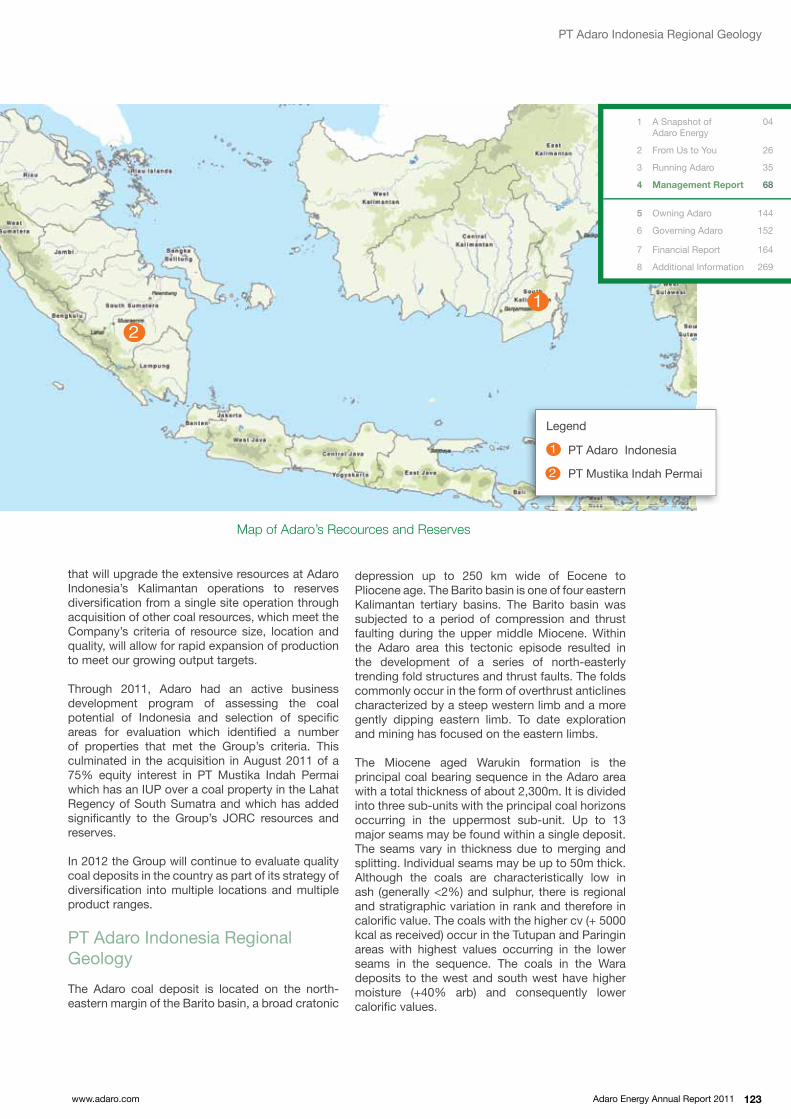
Adaro Energy Annual Report 2011www.adaro.com 123
that will upgrade the extensive resources at Adaro Indonesia’s Kalimantan operations to reserves diversifi cation from a single site operation through acquisition of other coal resources, which meet the Company’s criteria of resource size, location and quality, will allow for rapid expansion of production to meet our growing output targets.
Through 2011, Adaro had an active business development program of assessing the coal potential of Indonesia and selection of specifi c areas for evaluation which identifi ed a number of properties that met the Group’s criteria. This culminated in the acquisition in August 2011 of a 75% equity interest in PT Mustika Indah Permai which has an IUP over a coal property in the Lahat Regency of South Sumatra and which has added signifi cantly to the Group’s JORC resources and reserves.
In 2012 the Group will continue to evaluate quality coal deposits in the country as part of its strategy of diversifi cation into multiple locations and multiple product ranges.
PT Adaro Indonesia Regional Geology
The Adaro coal deposit is located on the north-eastern margin of the Barito basin, a broad cratonic
depression up to 250 km wide of Eocene to Pliocene age. The Barito basin is one of four eastern Kalimantan tertiary basins. The Barito basin was subjected to a period of compression and thrust faulting during the upper middle Miocene. Within the Adaro area this tectonic episode resulted in the development of a series of north-easterly trending fold structures and thrust faults. The folds commonly occur in the form of overthrust anticlines characterized by a steep western limb and a more gently dipping eastern limb. To date exploration and mining has focused on the eastern limbs.
The Miocene aged Warukin formation is the principal coal bearing sequence in the Adaro area with a total thickness of about 2,300m. It is divided into three sub-units with the principal coal horizons occurring in the uppermost sub-unit. Up to 13 major seams may be found within a single deposit. The seams vary in thickness due to merging and splitting. Individual seams may be up to 50m thick. Although the coals are characteristically low in ash (generally <2%) and sulphur, there is regional and stratigraphic variation in rank and therefore in calorifi c value. The coals with the higher cv (+ 5000 kcal as received) occur in the Tutupan and Paringin areas with highest values occurring in the lower seams in the sequence. The coals in the Wara deposits to the west and south west have higher moisture (+40% arb) and consequently lower calorifi c values.
1
2
Legend
1
2
PT Adaro Indonesia
PT Mustika Indah Permai
Map of Adaro’s Recources and Reserves
PT Adaro Indonesia Regional Geology
A Snapshot of Adaro Energy
From Us to You
Running Adaro
Management Report
Owning Adaro
Governing Adaro
Financial Report
Additional Information
1
2
3
4
5
6
7
8
04
26
35
68
144
152
164
269

Adaro Energy Annual Report 2011 www.adaro.com124
Geotechnical core drilling was conducted in Wara 1, North Paringin and Tutupan pits.
Coal Deposits
TutupanThe Tutupan coal deposit is found over a strike length of 20 km along a prominent topographic ridge in the north-eastern part of the Adaro area and is comprised of thirteen individual seams with the majority of the coal occurring in the T100, T200 and T300 seam groups. The thickest coal (50m) occurs in the T100 seam in the south, while the T200 seam is the principal seam in the north where it is also up to 50m thick.
WaraThe Wara 1 coal deposit is located 5 km west of the Tutupan mine with the seams lying in a northeasterly direction extending over a distance of 12 km. There are 3 major seams divided into 13 individual seams
and 6 compound seams ranging in thickness from 3 m to 35 m. The Wara seams are characteristically low in ash (<3%) but with Total Moisture contents of around 40% and CV of 4,000 kcal arb.
The Wara 2 coal deposit is located 1 km to the west of Wara 1. Coal seams in this deposit have been traced in a north-easterly direction for 10 km and maintain a south-easterly dip of about 100. There are six individual seams and 2 compound seams, which range in thickness from 3m to 25m. Coal in the Wara 2 deposit is classifi ed as lignite with the average calorifi c value at 3,600 kcal/kg arb and the average Total Moisture at 44.0 %. ParinginNorth Paringin is the southern extension of the Tutupan deposit offset to the east by a transverse fault and is a multi seam deposit with thicknesses ranging from 1m to over 20m. The average calorifi c value is 4,800 kcal/kg arb and the average Total Moisture is 28%. The South Paringin deposit lies approximately 5 km south of the old Paringin Mine located near the village of Gampa in Balangan Regency. The coal seams are generally trending northeast and dipping from 15° to 40° southeast. The seams have been traced over 4 km along strike. Over 20 individual seams are found ranging in thickness from 1m to 15m. The average calorifi c value is 4,500 kcal/kg arb and the average Total Moisture is 32%.
Management Report | Exploration and Reserves
Joseph A. CrisostomoGeology Department Head
Joseph joined Adaro in 1994 and has over 26 years in coal geology and exploration. Prior to joining Adaro, he worked with Semirara Coal Corporation. He has a Bachelor Degree in Geology from the University of the Philippines, National Institute of Geological Sciences. He is also a member of AUSIMM since 2002.
44

Adaro Energy Annual Report 2011www.adaro.com 125
4
Exploration Activities In 2011
Exploration drilling activities were conducted in 5 areas in 2011: Wara 1, Tutupan Pit, South Tutupan, North Paringin and South Paringin.
Exploration drilling was conducted in Wara 1. The main Wara seams were traced north of the Pertamina road where the dips are low. Cored holes were drilled to augment the quality database especially down dip.
At Tutupan Mine, in-fill drilling was conducted to refine the coal model and update the quality database. In South Tutupan, drilling was conducted to trace the coal seams’ southern extension and to collect samples for coal quality analysis.
At North Paringin, the exploration program focused on the low dipping eastern limb defining the structure and stratigraphy. Core samples were collected for coal quality. Inclined holes were also drilled into the steeply dipping western limb. The western limb will be the focus of drilling in 2012.
At South Paringin, reconnaissance drilling was continued at 1 kilometer sections and 200 meter spacing to define the structure and stratigraphy. Core samples were also collected for coal quality analysis.
During the year, geotechnical core drilling was conducted in Wara 1, North Paringin and Tutupan pits. The results will be used for slope stability analyses in these areas. Piezometers, inclinometers and water wells were also drilled as part of the slope monitoring and groundwater depressurization programs. Core samples were also taken for mine drainage properties. The results
will be used to build a lithological model that will enable identification and handling of certain waste intervals.
Exploration and geotechnical drilling activities are outsourced to PT Asia Drill Bara Utama and PT Trikarya Intidrill Persada under close supervision and monitoring by Adaro Indonesia’s Geology Department.
During 2011, the total cost of exploration activities was US$2.3 million. In 2012, exploration drilling will focus on North Tutupan and Northwest Paringin. The northern extension of the syncline/anticline structure in North Tutupan will be drilled. The fold structures in this area are interpreted to be tight, with steeper dips due to the convergence of 2 major thrust faults. This creates the potential for thick seams close to the surface resulting in low strip ratio coal.
At Northwest Paringin, the program for inclined drilling into the steeply dipping western limb will continue to model the seams’ extension in this area. In-fill core drilling will be conducted at Tutupan, Wara and North Paringin mines to update the coal quality database and collect samples for drainage properties of the waste rocks.
Coal Deposits | Exploration Activities in 2011
SetiawanCoal Exploration DGM, Director Adaro Eksplorasi Indonesia
Setiawan is a geologist graduated from the Bandung Institute of Technology. He had 18 years experience in coal exploration in Indonesia. Prior to joining Adaro in 2011, he held a position as an exploration manager and Director of the companies within BHP Billiton - IndoMet Coal project performing coal exploration program in Central Kalimantan.

Adaro Energy Annual Report 2011 www.adaro.com126
PT Mustika Indah PermaiGeology
Regional GeologyMIP is located in the southern part of the South Sumatra basin. This sedimentary basin is Tertiary in age and is bounded by ranges of volcanic rocks to the west and south which separate it from the Bengkulu basin. The strata within the South Sumatra basin comprise the Telisa and Palembang groups. The Telisa Group is older and consists of mostly marine sediments. The Palembang Group sediments have eroded into and unconformably overly the Telisa group. The coal measures within the South Sumatra basin are within the Palembang Group and are known as the Muara Enim Formation. The Airbenekat formation underlies the Muara Enim formation while the Kasai formation overlies it.
Local GeologyThe Muara Enim formation outcrops over the majority of the IUP. The strata are folded into an east- west trending open syncline which plunges to the east. The north limb of the syncline is steeply dipping 40 degrees while the eastern closure and southern limb dip at 10 to 15 degrees. No faults are observed.
Coal Seam StratigraphyEight coal seams have been intersected through drilling at MIP. These are in descending stratigraphic seams A1, A2, B,C1, C2, D, E and E2. A minor seam occurs above the A1 in a limited number of holes, The economic seams that form the MIP JORC Coal Resources and Reserves are A1,A2, B, C1 and C2. The remaining seams do not outcrop sufficiently for open cut mining. The seams A1,A2,B and C1 range in thickness from 7.4 – 17.5 m with seam B being the thickest. Seam C1 is thinner averaging 1.1 m and is a minor component of the total coal Resources and Reserves.
The structure, thickness and continuity of the seams appear consistent throughout the coal deposit and no faulting is evident.
There is a possibility that other seams higher in the stratigraphic sequence above A1 may be found in the north west of the IUP.
Agus SubandrioOperations Deputy GM MIP
Agus has over 20 years experience in coal mining and health, safety, and environment. He has a degree in Mining from UPN Veteran Yogyakarta. Prior to joining Adaro in 1997, he worked in several mining companies in operation and production.
Reserves And Resources
Below is an excerpt from the Independent Statement on the Coal Reserves and Resources by Terence Willsteed & Associates:
Terence Willsteed & Associates (TWA) has been requested by PT Adaro Indonesia to provide an Independent Statement of Coal Reserves and Resource as at 31 December 2010, located at the Adaro Coal Operations in Kalimantan to be submitted to the Jakarta Stock Exchange (JSX).
TWA has previously reported on the Adaro operations and coal assets in the Independent Technical Report on the Coal Assets of PT Adaro Indonesia dated 29 February 2008, in the Independent Technical Review of the Coal Assets of New Hope Corporation, 31 July 2003 and in the Independent Statement on the Coal Reserves and Resources of PT Adaro Indonesia, December 2008 dated 13 March 2009.
The Statement has been prepared independently and in accordance with the Code for reporting Mineral Resources and Ore Reserves (JORC Code 2004) of the Australasian Institute of Mining and Metallurgy (AusIMM). This Code sets out the principles and guidelines, which should be followed in the preparation of an expert report concerning mineral resources and reserves. We believe all material facts are presented and that our analysis is sufficient to meet the transparency requirements of the Code.
The Statement is required to assess that sufficient Reserves exist to meet the long-term production plans and to confirm the overall resource estimates by Adaro and determine that the mines have geological and structural condition and can be operated successfully.
Management Report | Exploration and ReservesR
elat
ed In
form
atio
n 138 Establishing Our Foothold in South Sumatra
4

Adaro Energy Annual Report 2011www.adaro.com 127
PT Adaro Indonesia Reserves and Resources | PT Mustika Indah Permai Geology
Exploration
During 2007 and 2008, MIP undertook three drilling programs with the initial phase totaling 60 holes to broadly explore the prospective mining area. These were drilled along section lines perpendicular to dip with drill lines being spaced at about 800m along strike and the drill holes spaced about 400m apart, down dip. In 2008, two supplementary in-fill drilling programs were carried out with 6 holes drilled in the north-east section of the property and 12 holes in the eastern area. All drill holes in these three programs were geophysically logged with the 18 in-fill holes being surveyed with total stations.
In addition, during the first drilling program, fully cored holes were also drilled for a geotechnical investigation program as part of the project environmental analysis.
In 2010, the IUP was explored by Adaro as part of the acquisition due diligence. A total of nine open holes and six partially cored quality holes were completed, and the data incorporated into the geological model. Drill holes were twinned and redrilled as needed to fully sample the lithology.
This was followed in 2011 with an infill JORC drilling program to bring all coal within the previously developed pit shell into Indicated or Measured Resource status. This drilling program began in September 2011, and as of December 15, 2011, 42 drill holes, comprising 7 open holes and 35 cored holes, had been completed with 35 being used in the geological model. Of the 35 drill holes used in the model, 28 contained quality data for at least one seam intercept.
To date, 161 holes totaling 15,517.92 meters have been drilled within the property.
Quality
The coal within the MIP IUP is similar to coal currently mined from the Wara deposit in South Kalimantan but with a higher calorific value.
Reserves And Resources
In late 2011, Marston an international mining con-sultant based in St Louis, USA and a subsidiary of Golder Associates was engaged by Adaro to produce an Australasian Joint Ore Reserves Com-mittee (JORC) compliant Coal Resources and Re-serves report for its subsidiary, PT Mustika Indah Permai’s property in Lahat, South Sumatra as at 15th December 2011.
The information in the report relating to Explora-tion Results, Coal Resources and Coal Reserves is based on information compiled by Mr John W. Devon, who is a Marston employee and a regis-tered founding member of the Society for mining, Metallurgy and Exploration which is a Recognised Overseas Professional Organization (ROPO) as de-fined by the Australian Stock Exchange (ASX)
Mr Devon has sufficient experience that is relevant to the style of mineralization and type of deposit under consideration and to the activity, which he is undertaking to qualify as a Competent Person as defined in the 2004 Edition of the “Australasian Code for Reporting Exploration Results, Mineral Resources and Ore Reserves”. Mr Devon consents to the inclusion in this statement of the matters based on his information in the form and context in which it appears.
Arli Rahman Production Planning Manager
Arli is the Production Planning Manager for Adaro Indonesia. He started his career in mining with Adaro Indonesia in 2001. He has a Bachelor in Mining Engineering from Trisakti University, Jakarta

Adaro Energy Annual Report 2011 www.adaro.com128
Resources
Ad
aro
Ene
rgy
JOR
C C
om
plia
nt C
oal
Res
our
ces
2011
Cal
cula
ted
as a
t Dec
embe
r 31
201
1 U
sing
Adj
uste
d 20
11 M
ine
Pro
duct
ion
& th
e D
ecem
ber
2010
PT
Ada
ro In
done
sia
JOR
C S
tate
men
tA
s at
Dec
embe
r 31
201
04C
alcu
late
d C
hang
es to
Ada
ro E
nerg
y's
Coa
l Res
ourc
es
2011
vs
2010
Ope
ratin
g C
ompa
nyLo
calit
yTo
tal M
easu
red,
In
dica
ted
&
Infe
rred
Coa
l R
esou
rces
(Mt)
Mea
sure
d C
oal
Res
ourc
es
(Mt)
Indi
cate
d C
oal
Res
ourc
es
(Mt)
Infe
rred
Coa
l R
esou
rces
(M
t)
Ada
ro E
nerg
y O
wne
rshi
p E
quity
(%)
Ada
ro E
nerg
y
Att
ribut
able
Tot
al
Mea
sure
d In
dica
ted
&
Infe
rred
Coa
l R
esou
rces
(M
t)
Tota
l M
easu
red,
In
dica
ted
& In
ferr
ed
Coa
l R
esou
rces
(M
t)
Mea
sure
d C
oal
Res
ourc
es
(Mt)
Indi
cate
d C
oal
Res
ourc
es
(Mt)
Infe
rred
C
oal
Res
ourc
es
(Mt)
Ada
ro
Ene
rgy
Ow
ners
hip
Equ
ity (%
)
Ada
ro E
nerg
y
Att
ribut
able
Tot
al
Mea
sure
d In
dica
ted
&
Infe
rred
Coa
l R
esou
rces
(Mt)
Cha
nges
to
Ope
ratin
g C
ompa
ny T
otal
M
easu
red,
In
dica
ted
&
Infe
rred
Coa
l R
esou
rces
201
1 vs
201
0 (M
t)
Cha
nges
to
Ope
ratin
g C
ompa
ny T
otal
Mea
sure
d In
dica
ted
& In
ferr
ed
Coa
l Res
ourc
es
2011
vs
2010
(%)
Cha
nges
to A
daro
E
nerg
y A
ttrib
utab
le
Tota
l Mea
sure
d ,In
dica
ted
&
Infe
rred
Coa
l R
esou
rces
201
1 vs
201
0 (M
t)
Cha
nges
to A
daro
E
nerg
y A
ttrib
utab
le
Tota
l Mea
sure
d ,In
dica
ted
& In
ferr
ed
Coa
l Res
ourc
es
2011
vs
2010
(%)
PT.
Ada
ro In
done
sia1
Tutu
pan
2,4
08
729
8
14
865
100
2,40
8 2
,454
7
75
814
8
65
100
2,4
54
(46)
-1.9
% (4
6)-1
.9%
Nor
th P
arin
gin3
297
1
16
96
85
297
298
1
17
96
85
298
(1
)-0
.4%
(1)
-0.4
%
War
a I
1,3
01
486
3
66
449
1,
301
1,3
07
492
3
66
449
1
,307
(6
)-0
.4%
(6)
-0.4
%
War
a II
367
1
33
134
1
00
367
367
1
33
134
1
00
367
-
-
-
-
Tota
l Sou
th K
alim
anta
n 4
,373
1
,464
1
,410
1
,499
4,
373
4,4
26
1,5
17
1,4
10
1,4
99
4,4
26
(53)
-1.2
% (5
3)-1
.2%
PT.
Mus
tika
Inda
h P
erm
ai2
Sou
th S
umat
ra 2
86
250
3
6 0.
4 7
521
5 -
-
-
-
-
-
2
86
100%
215
10
0%
Tota
l Ada
ro E
nerg
y C
oal
Res
ourc
esIn
clud
ing
Kal
iman
tan
&
Sum
atra
4,6
59
1,7
14
1,4
46
1,4
99 9
8.4
4,58
8 4
,426
1
,517
1
,410
1
,499
10
0 4
,426
2
33.3
5.
3% 1
62
3.7%
1 B
ased
on
Ada
ro In
done
sia’
s 20
10 J
OR
C C
oal R
esou
rce
and
Res
erve
Sta
tem
ent a
djus
ted
by s
ubtr
actin
g 53
Mt o
f in-
situ
coa
l pro
duce
d du
ring
2011
2
Bas
ed o
n th
e JO
RC
Rep
ort o
f PT.
Mus
tika
Inda
h P
erm
ai (M
IP) d
ated
Jan
uary
201
2
3 N
o JO
RC
Coa
l Res
ourc
es w
ere
decl
ared
for
Nor
th P
arin
gin
in 2
010
how
ever
1 M
t of c
oal w
as m
ined
in 2
011
4 S
mal
l diff
eren
ces
betw
een
2010
Res
ourc
e to
nnag
es in
this
tabl
e an
d th
e 20
10 A
daro
Ene
rgy
Ann
ual R
epor
t bas
ed o
n cu
mul
ativ
e ro
undi
ng e
rror
s
Ad
aro
Ene
rgy
(Eq
uity
Ad
just
ed) J
OR
C C
om
plia
nt C
oal
Res
our
ce Q
ualit
y (G
ross
As
Rec
eive
d B
asis
) 201
1
Cal
cula
ted
as a
t Dec
embe
r 31
201
1
As
at D
ecem
ber
31 2
010
Cal
cula
ted
Coa
l Qua
lity
Cha
nges
to A
daro
Ene
rgy'
s C
oal R
esou
rces
20
11 v
s 20
10
Ope
ratin
g C
ompa
nyLo
calit
yTo
tal
M
oist
ure
%
Ash
%
(g
ar)
Vola
tile
Mat
ter
%
(gar
)
Tota
l Sul
phur
%
(g
ar)
Cal
orifi
c Va
lue
Kca
l/kg
(gar
)
Tota
l
Moi
stur
e
%
Ash
%
(gar
)Vo
latil
e M
atte
r %
(g
ar)
Tota
l S
ulph
ur %
(g
ar)
Cal
orifi
c Va
lue
Kca
l/kg (gar
)
Tota
l Moi
stur
e
%
Ash
%
(g
ar)
Vola
tile
Mat
ter
%
(gar
)
Tota
l Sul
phur
%
(g
ar)
Cal
orifi
c Va
lue
Kca
l/kg (gar
)
PT.
Ada
ro In
done
sia1,
2Tu
tupa
n27
.1 1
.9
36.
5 0
.10
4,9
22
27.1
1.9
3
6.5
0.1
0 4
,922
Qua
lity
was
not
est
imat
ed d
urin
g 20
11 a
nd d
oes
not a
ccou
nt fo
r th
e 5
3 M
t of i
n-si
tu c
oal m
ined
in 2
011.
Its
is re
ason
able
to a
ssum
e th
e re
mai
ning
qu
aliti
es a
re a
lmos
t ide
ntic
al to
thos
e es
timat
ed in
201
0
Nor
th P
arin
gin
29.1
2.8
3
5.0
0.2
0 4
,948
29
.1 2
.8
35.
0 0
.20
4,9
48
War
a I
38.9
2.9
3
0.4
0.2
1 3
,986
38
.9 2
.9
30.
4 0
.21
3,9
86
War
a II
43.4
2.8
2
9.0
0.2
0 3
,658
43
.4 2
.8
29.
0 0
.20
3,6
58
Tota
l Sou
th K
alim
anta
n32
.2 2
.3
33.
9 0
.15
4,5
25
32.2
2.3
3
3.9
0.1
5 4
,525
PT.
Mus
tika
Inda
h P
erm
ai3,
4S
outh
Sum
atra
33.9
5.5
3
1.1
0.42
4,3
45
PT.
Mus
tika
Inda
h P
erm
ai n
ot a
cqui
red
until
201
1P
T. M
ustik
a In
dah
Per
mai
not
acq
uire
d un
til 2
011
Tota
l Ada
ro E
nerg
y C
oal
Res
ourc
es5
Incl
udin
g K
alim
anta
n &
Sum
atra
32.
3 2
.5
33.
8 0
.16
4,5
17
32.2
2.3
3
3.9
0.1
5 4
,525
0
.1
0.1
(0
.1)
0.0
1 (8
)
1 P
T. A
daro
Indo
nesi
a C
oal q
ualit
y es
timat
es a
re re
stat
emen
ts o
f th
e 20
10 J
OR
C C
oal R
esou
rce
and
Res
erve
stu
dy a
nd d
o no
t con
side
r th
e q
ualit
y ef
fect
of 5
3 M
t of
in-s
itu c
oal m
ined
in 2
011
2 P
T. A
daro
Indo
nesi
a’s
coal
qua
lity
sam
ples
hav
e be
en a
naly
sed
to A
STM
sta
ndar
ds
3 P
T. M
ustik
a In
dah
Per
mai
’s c
oal q
ualit
y sa
mpl
es h
ave
been
ana
lyse
d to
IS
O s
tand
ards
4 E
leva
ted
sodi
um in
ash
leve
ls a
vera
ging
3.0
% a
nd v
aryi
ng o
n an
nual
pro
duct
ion
sche
dule
ave
rage
from
2%
to 4
% w
ere
estim
ated
in th
e P
T M
IP 2
012
JOR
C
stat
emen
t5
The
Ada
ro E
nerg
y c
oal q
ualit
y w
as d
eriv
ed b
y co
mbi
ning
the
coal
qua
lity
para
met
ers
of th
e co
al re
sour
ces
of th
e c
ompo
nent
ope
ratin
g co
mpa
nies
usi
ng
wei
ght a
vera
ging
.
Ad
aro
Ene
rgy
(Eq
uity
Ad
just
ed) J
OR
C C
om
plia
nt C
oal
Res
our
ce Q
ualit
y (A
ir D
ried
Bas
is) 2
011
Cal
cula
ted
as a
t Dec
embe
r 31
201
11
As
at D
ecem
ber
31 2
010
Cal
cula
ted
Coa
l Qua
lity
Cha
nges
to A
daro
Ene
rgy'
s C
oal R
esou
rces
20
11 v
s 20
10
Ope
ratin
g C
ompa
nyLo
calit
yM
oist
ure
in
the
Ana
lysi
s S
ampl
e %
(a
db)
Ash
% (a
db)
Vola
tile
Mat
ter
%
(adb
)
Tota
l Sul
phur
%
(a
db)
Cal
orifi
c Va
lue
Kca
l/kg
(adb
)
Moi
stur
e in
the
Ana
lysi
s S
ampl
e
%
(adb
)
Ash
%
(a
db)
Vola
tile
Mat
ter
%
(a
db)
Tota
l S
ulph
ur
%
(adb
)
Cal
orifi
c Va
lue
Kca
l/kg (adb
)
Moi
stur
e in
the
Ana
lysi
s S
ampl
e
%
(adb
)
Ash
%
(a
db)
Vola
tile
Mat
ter
%
(adb
)
Tota
l Sul
phur
%
(a
db)
Cal
orifi
c Va
lue
Kca
l/kg (adb
)
PT.
Ada
ro In
done
sia
Tutu
pan
17.6
2.1
41.2
0.11
5,5
63
17.6
2.1
41.2
0.11
5,5
63
Qua
lity
was
not
est
imat
ed d
urin
g 20
11 a
nd d
oes
not a
ccou
nt fo
r th
e 5
3 M
t of i
n-si
tu c
oal m
ined
in 2
011.
Its
is re
ason
able
to a
ssum
e th
e re
mai
ning
qu
aliti
es a
re a
lmos
t ide
ntic
al to
thos
e es
timat
ed in
201
0
Nor
th P
arin
gin
16.9
3.3
41.0
0.23
5,7
99
16.9
3.3
41.0
0.23
5,7
99
War
a I
19.1
3.8
40.3
0.28
5,2
78
19.1
3.8
40.3
0.28
5,2
78
War
a II
19.3
4.0
41.4
0.28
5,2
15
19.3
4.0
41.4
0.28
5,2
15
Tota
l Sou
th K
alim
anta
n18
.12.
841
.00.
18 5
,466
18
.12.
841
.00.
18 5
,466
PT.
Mus
tika
Inda
h P
erm
aiS
outh
Sum
atra
22.2
6.5
3
6.6
0.49
5,1
14
PT.
Mus
tika
Inda
h P
erm
ai n
ot a
cqui
red
until
201
1
PT.
Mus
tika
Inda
h P
erm
ai n
ot a
cqui
red
until
201
1
Tota
l Ada
ro E
nerg
y C
oal
Res
ourc
esIn
clud
ing
Kal
iman
tan
& S
umat
ra 1
8.3
3.0
4
0.8
0.19
5,4
50
18.1
2.8
41.0
0.18
5,4
66 0
.2
0.2
(0
.2)
0.0
1 (1
7)
Ad
aro
Ene
rgy
Co
al R
eso
urce
s an
d R
eser
ves

Adaro Energy Annual Report 2011www.adaro.com 129
Reserves
1 P
T. A
daro
Indo
nesi
a C
oal q
ualit
y es
timat
es a
re re
stat
emen
ts o
f th
e 20
10 J
OR
C C
oal R
esou
rce
and
Res
erve
stu
dy a
nd d
o no
t con
side
r th
e q
ualit
y ef
fect
of 4
7 M
t of
coa
l pro
duce
d in
201
12
PT.
Ada
ro In
done
sia’
s co
al q
ualit
y sa
mpl
es h
ave
been
ana
lyse
d to
AS
TM s
tand
ards
3
PT.
Mus
tika
Inda
h P
erm
ai’s
coa
l qua
lity
sam
ples
hav
e be
en a
naly
sed
to I
SO
sta
ndar
ds
Ada
ro E
nerg
y (E
quity
Adj
uste
d) J
OR
C C
ompl
iant
Coa
l Res
erve
Qua
lity
(Gro
ss A
s R
ecei
ved
Bas
is) 2
011
Cal
cula
ted
as a
t Dec
embe
r 31
2011
As
at D
ecem
ber 3
1 20
10C
alcu
late
d C
oal Q
ualit
y C
hang
es to
PT
Adar
o En
ergy
’s C
oal R
eser
ves
Ope
ratin
g C
ompa
nyLo
calit
yTo
tal M
oist
ure
%
Ash
%
(gar
)
Vola
tile
Mat
ter
%
(gar
)
Tota
l Sul
phur
%
(gar
)
Cal
orific
Val
ue
Kca
l/kg
(gar
)
Tota
l Moi
stur
e
%As
h %
(g
ar)
Vola
tile
Mat
ter %
(g
ar)
Tota
l Sul
phur
%
(g
ar)
Cal
orific
Val
ue
Kca
l/kg
(gar
)
Tota
l Moi
stur
e %
Ash
% (gar
)
Vola
tile
Mat
ter %
(g
ar)
Tota
l Sul
phur
%
(g
ar)
Cal
orific
Val
ue
Kca
l/kg
(gar
)
PT. A
daro
Indo
nesi
a1,2
Tutu
pan
26.
3 2
.0
36.
5 0
.10
5,0
13
26.3
2.0
3
6.5
0.1
0 5
,013
Coa
l qua
lity
was
not
est
imat
ed d
urin
g 20
11 to
acc
ount
for t
he 4
7 M
t of c
oal
min
ed in
201
1. It
is re
ason
able
to a
ssum
e th
e re
mai
ning
qua
litie
s ar
e al
mos
t id
entic
al to
thos
e es
timat
ed in
201
0
Nor
th P
arin
gin
War
a I
39.
2 3
.0
30.
3 0
.20
3,9
83
39.2
3.0
3
0.3
0.2
0 3
,983
War
a II
Tota
l Sou
th
Kal
iman
tan
31.
6 2
.5
33.
9 0
.14
4,5
88
31.6
2.5
3
3.9
0.1
4 4
,588
PT. M
ustik
a In
dah
Perm
ai3,
4So
uth
Sum
atra
34.
1 5
.9
31.
1 0.
40 4
,281
PT
. Mus
tika
Inda
h Pe
rmai
not
acq
uire
d un
til 2
011
PT. M
ustik
a In
dah
Perm
ai n
ot a
cqui
red
until
201
1
Tota
l Ada
ro E
nerg
y C
oal R
eser
ves5
Inc.
Kal
iman
tan
& Su
mat
ra 3
2.1
3.1
3
3.4
0.1
9 4
,531
31
.6 2
.5
33.
9 0
.14
4,5
88
0.5
0.6
(0
.5)
0.0
5 (5
7)
4 E
leva
ted
sodi
um in
ash
leve
ls a
vera
ging
3.0
% a
nd v
aryi
ng o
n an
nual
pro
duct
ion
sche
dule
ave
rage
from
2%
to 4
% w
ere
estim
ated
in th
e P
T M
IP 2
012
JOR
C
stat
emen
t5
The
Ada
ro E
nerg
y co
al q
ualit
y w
as d
eriv
ed b
y co
mbi
ning
the
coal
qua
lity
para
met
ers
of th
e co
al re
serv
es o
f the
com
pone
nt o
pera
ting
com
pani
es u
sing
wei
ght
aver
agin
g.
Ada
ro E
nerg
y (E
quity
Adj
uste
d) J
OR
C C
ompl
iant
Coa
l Res
erve
Qua
lity
(Air
Dri
ed B
asis
) 201
1
Cal
cula
ted
as a
t Dec
embe
r 31
2011
A
s at
Dec
embe
r 31
2010
Cal
cula
ted
Coa
l Qua
lity
Cha
nges
to P
T Ad
aro
Ener
gy’s
Coa
l Res
erve
s
Ope
ratin
g C
ompa
nyLo
calit
yM
oist
ure
in
the
Ana
lysi
s S
ampl
e %
(a
db)
Ash %
(a
db)
Vola
tile
Mat
ter
%
(adb
)
Tota
l Sul
phur
%
(adb
)
Cal
orifi
c Va
lue
Kca
l/kg
(adb
)
Moi
stur
e in
th
e A
naly
sis
Sam
ple
%
(adb
)
Ash
%
(a
db)
Vola
tile
Mat
ter
%
(adb
)
Tota
l Sul
phur
%
(a
db)
Cal
orifi
c Va
lue
Kca
l/kg
(adb
)
Moi
stur
e in
th
e A
naly
sis
Sam
ple
%
(adb
)
Ash
%
(adb
)
Vola
tile
Mat
ter
%
(adb
)
Tota
l Sul
phur
%
(a
db)
Cal
orifi
c Va
lue
Kca
l/kg
(a
db)
PT.
Ada
ro In
done
sia
Tutu
pan
17.0
2.3
41.1
0.11
5,6
38
17.0
2.3
41
.10.
11 5
,638
Coa
l qua
lity
was
not
est
imat
ed d
urin
g 20
11 to
acc
ount
for t
he 4
7 M
t of c
oal
min
ed in
201
1. It
is re
ason
able
to a
ssum
e th
e re
mai
ning
qua
litie
s ar
e al
mos
t id
entic
al to
thos
e es
timat
ed in
201
0
Nor
th P
arin
gin
War
a I
19.4
4.0
40.2
0.25
5,2
61
19.4
4.0
40
.20.
25 5
,261
War
a II
Tota
l Sou
th
Kal
iman
tan
18.0
3.0
40.7
0.17
5,4
83
18.0
3.0
40.7
0.17
5,4
83
PT.
Mus
tika
Inda
h P
erm
aiS
outh
Sum
atra
22.2
7.0
3
6.7
0.4
7 5
,054
P
T. M
ustik
a In
dah
Per
mai
not
acq
uire
d un
til 2
011
PT.
Mus
tika
Inda
h P
erm
ai n
ot a
cqui
red
until
201
1
Tota
l Ada
ro E
nerg
y C
oal R
eser
ves
Inc.
Kal
iman
tan
& S
umat
ra 1
8.8
3.7
4
0.0
0.2
3 5
,403
18
.0 3
.0
40.7
0.17
5,4
83
0.8
0
.7
(0.7
) 0
.06
(80)
Ad
aro
Ene
rgy
JOR
C C
om
plia
nt C
oal
Res
erve
s 20
11
Cal
cula
ted
as a
t Dec
embe
r 31
201
1 U
sing
Adj
uste
d 20
11 M
ine
Pro
duct
ion
&
the
Dec
embe
r 20
10 P
T A
daro
Indo
nesi
a JO
RC
Sta
tem
ent
As
at D
ecem
ber
31 2
010 4
Cal
cula
ted
Cha
nges
to A
daro
Ene
rgy'
s C
oal R
eser
ves
2011
vs
2010
Ope
ratin
g C
ompa
nyLo
calit
yTo
tal P
rove
d &
P
roba
ble
Coa
l R
eser
ves
(Mt)
Pro
ved
Coa
l R
eser
ves
(Mt)
Pro
babl
e C
oal
Res
erve
s (M
t)A
daro
Ene
rgy
Ow
ners
hip
E
quity
(%)
Ada
ro E
nerg
y A
ttrib
utab
le
Tota
l Pro
ved
&
Pro
babl
e C
oal
Res
erve
s (M
t)
Tota
l Pro
ved
& P
roba
ble
Coa
l R
eser
ves
(Mt)
Pro
ved
Coa
l R
eser
ves
(M
t)
Pro
babl
e C
oal
Res
erve
s (M
t)A
daro
Ene
rgy
Equ
ity (%
)A
daro
Ene
gy
Att
ribut
able
To
tal
Pro
ved
&
Pro
babl
e C
oal
Res
erve
s (M
t)
Cha
nges
to
Ope
ratin
g C
ompa
ny T
otal
P
rove
d &
Pro
babl
e C
oal R
eser
ves
2011
vs
2010
(Mt)
Cha
nges
to
Ope
ratin
g C
ompa
ny
Tota
l P
rove
d &
P
roba
ble
Coa
l R
eser
ves
2011
vs
2010
(%)
Cha
nges
to A
daro
E
nerg
y A
ttrib
utab
le
Tota
l Pro
ved
&
Pro
babl
e C
oal
Res
erve
s 20
11 v
s 20
10 (M
t)
Cha
nges
to A
daro
E
nerg
y A
ttrib
utab
le
Tota
l Pro
ved
&
Pro
babl
e C
oal
Res
erve
s 20
11 v
s 20
10 (%
)
PT.
Ada
ro In
done
sia1
Tutu
pan
510
3
69
141
100
510
5
52
410
1
41
100
552
(4
2)-7
.6%
(42)
-7.6
%
Nor
th P
arin
gin3
War
a I
381
2
83
98
381
3
86
289
9
8 3
86
(5)
-1.4
% (5
)-1
.4%
War
a II
-
-
-
-
-
Tota
l Sou
th K
alim
anta
n 8
91
652
2
39
891
9
38
699
2
39
938
(4
7)-5
.0%
(47)
-5.0
%
PT.
Mus
tika
Inda
h P
erm
ai2
Sou
th S
umat
ra 2
73
238
3
5 75
204
-
-
-
-
-
2
7310
0% 2
04
100%
Tota
l Ada
ro E
nerg
y C
oal R
eser
ves
Incl
udin
g K
alim
anta
n &
Sum
atra
1,1
63
890
2
74
98.4
1,0
95
938
6
99
239
10
0 9
38
226
24.0
% 1
57
16.8
%
1 B
ased
on
Ada
ro In
done
sia’
s 20
10 J
OR
C C
oal R
esou
rce
and
Res
erve
Sta
tem
ent a
djus
ted
by s
ubtr
actin
g 47
Mt o
f coa
l pro
duce
d du
ring
2011
2
Bas
ed o
n th
e JO
RC
Rep
ort o
f PT.
Mus
tika
Inda
h P
erm
ai (M
IP) d
ated
Jan
uary
201
2
3 N
o JO
RC
Coa
l Res
erve
s w
ere
decl
ared
for
Nor
th P
arin
gin
in 2
010
how
ever
1 M
t of c
oal w
as m
ined
in 2
011
4 S
mal
l diff
eren
ces
betw
een
2010
Res
ourc
e to
nnag
es in
this
tabl
e an
d th
e 20
10 A
daro
Ene
rgy
Ann
ual R
epor
t bas
ed o
n cu
mul
ativ
e ro
undi
ng e
rror
s

Adaro Energy Annual Report 2011 www.adaro.com130
seasoned industry professionals as well as innovative graduates. We are transforming AEI’s exploration capacity to help AE drills new coal plays at a faster rate. While the existing mine is still the focus of PT Adaro Indonesia (AI), AE is looking outward across Indonesia for sustainable growth and diversifi cation. AEI’s main task is to evaluate new coal deposits either through merger and acquisition or grass roots exploration.
In the Indonesian coal industry, things are changing fast and exploration is not immune to this. Investors want results and assurance faster than ever before, AEI will have to use its own and external resources to achieve the results AE is looking for. AE’s vision for the utilization of coal is not restricted purely to the physical mining. Accordingly AEI will work closely with Adaro Coal Technology while they search for higher and better uses for coal. Adaro Coal Technology will identify new ways to utilize coal while AEI will match coal deposits to the new technology.
Coal exploration is about connecting the dots, coal outcrops, drill holes, geophysical logs, and coal analysis. Without an interdependent team of people, data collected from fi eld work remains just an assemblage of unrelated pieces. At AEI, we are working to build a fi rst class team of people to transform that data into interpretative information that can be used to guide AE’s investment decisions.
Setiawan is a Director of AEI and is in charge of building our data acquisition capability. Setiawan’s 18 years of Indonesia coal exploration experience since graduating as a geologist from the prestigious Institute of Teknologi Bandung (ITB) are a great benefi t to AEI as he is a true coal exploration geologist. He has managed some of the biggest and most daring coal exploration projects in Indonesia. With his strong coking coal background Setiawan has management focus on coal exploration in Kalimantan as well as maintaining an overall view of AEI activities as a Director.
Joseph Crisostomo has functioned at the core of AE’s key asset PT Adaro Indonesia since 1993. As a Chief Geologist, Joseph has built up AI’s coal reserves and has been key to AI’s ability to deliver a consistent product through a systematic implementation of mine geology, exploration and coal quality assessment. Joseph will head up AEI’s technical evaluation team where the geological models and databases used as the foundation of new prospect evaluation will be created and maintained. Joseph will maintain groupwide coal resources and reserves while shepherding the mine geology at AE’s new mines such as Mustika Indah Permai in South Sumatra as well as orchestrating AE’s group wide coal quality standards.
Sigid Eko Suprijanto, another ITB graduate is both an experienced exploration geologist and a qualifi ed and experienced Head of Mining Engineering. Sigid has spanned the industry from exploration to mine management. Sigid has been assigned a management focus on Sumatra coal exploration and to assess any existing coal mine operations Indonesia as part of our merger and acquisition strategy.
Building a winning team is a foundation to build a bigger and better Adaro. Our growing team at AEI turns data into geological models; models into estimates of coal resources, and with the help of our valued external mining consultants turn coal resources into impartial estimates of coal reserves within mine plans. The Business Development Group of Adaro Energy takes mine plans and creates fi nancial models, and with AE’s internal mining experience, the skill of our marketing people plus AE’s power to raise funds, fi nancial models lead to deals and deals become coal mines. Collaboratively AEI’s exploration activities and AE’s investments lead to new infrastructure, growth, jobs creation, incomes, distributed prosperity and hope.
My name is Peter Mucalo and I am a coal exploration geologist. Coal exploration in Indonesia is amazing! As a young man I could not believe that companies paid me to have adventures in the wilds of Kalimantan, trek through the jungle, explore rivers by canoe or fl y to distant islands by helicopter. Indonesia, its geology and its people, intrigue me. Coal exploration has been a major part of my life as has Indonesia for the past 29 years. I have never been to a place where there is so much accessible coal. I would liken Kalimantan to a kind of coal El Dorado where coal outcrops abound in the rivers and streams, and discoveries were available to committed companies prepared to send geologists to spend time in the jungle looking.
That’s how it’s been for the last 30 years; coal exploration in Indonesia was easy! and now GPS technology and the proliferation of free earth data sets and the increasing price of coal has democratized coal exploration. Finding coal is no longer the domain of the geologist as many entrepreneurial prospectors took to the fi eld in their hundreds and together they have located many of Indonesia’s visible accessible coal deposits leading to a boom in small to medium sized coal discoveries. Although the obvious deposits may have been found, Adaro Energy (AE) feels that much coal remains undiscovered. Coal masked by sediment, not outcropping, hidden in plain sight, coal in more remote areas, and lower rank coal.
The focus of Adaro has been on creating maximum sustainable value and building winning teams for a bigger and better Adaro. As it is getting more challenging to fi nd new deposits of coal in Indonesia, AE formed a coal exploration division, PT Adaro Eksplorasi Indonesia (AEI) in 2011. The challenge of fi nding new deposits of coal means taking another look at the geology of Indonesia. Now, we must think about our exploration targets much more carefully because the quantity of our new discoveries will refl ect the quality of our thinking and our fi nancial power to test that thinking.
AEI is a new coal exploration company built on the framework of an existing drilling company. We are busy populating the ranks with
Developing an Exploration Division
Management Team of Adaro Eksplorasi Indonesia discuss new exploration project.
Peter MucaloExploration GM
Peter joined Adaro in 2011, and has over 25 years of experience in coal exploration geology. Prior to joining Adaro Peter was with Marston Inc an American mining consulting fi rm and worked on worldwide exploration programs. Peter graduated from the University of Auckland, New Zealand with a science degree majoring in geology.

Adaro Energy Annual Report 2011www.adaro.com 131
Reserves and Resources | Developing An Exploration Division
A DiscussionMr. Sandiaga S. UnoDirector,General Affairs
with
It is the 10th anniversary from when you fi rst started investing in the group of companies that became Adaro Energy. How do you feel?
It gives me goose bumps to think about it. I remember when I fi rst visited the site and I never imagined at that time just how big Adaro would become. The seam was only about half of today’s length of 17 kilometers. Reserves were around 250 million tonnes and today we have more than four times that amount.
What is the number one issue facing Adaro Energy?
I believe there are two issues. One is building the team, that we fi nd and retain the right talent. The second issue is that we have grown so much and are so much larger that we have a responsibility to contribute more. Part of the goal of creating maximum sustainable value from Indonesian coal, means that we have to make sure that we create maximum benefi ts for the provinces where we operate.
What gives you encouragement?
I am happy to be part of the winning team here at Adaro and, as a shareholder, I am encouraged with our prospects for long term value creation. I am encouraged and proud to be part of a leading Indonesian company, which will one day be amongst Indonesia’s fi rst members of Fortune magazine’s Global 500. Indonesia is a great place to be right now, and I believe we are just getting started. Indonesia’s GDP growth will one day rival and then surpass that of our larger, faster growing regional neighbors such as India and China.
What are you most proud about in terms of 2011?
Overall, I am really excited as I see we are on the right track to building not only a bigger, but better Adaro Energy. I am delighted with our move into South Sumatra and also happy to represent Adaro in that region. I believe the implementation of our business model there will bring tremendous value to Adaro, the province and the country.

Adaro Energy Annual Report 2011 www.adaro.com132
Investments for Future Performance
Management Report | Investments for Future Performance4
Organic growth from current reserve base
Focus on improving effi ciency of coal supply
chain and cost contol
Increase reserves, diversify product,
locations and licenses
Continue to deepen integration
1
2
3
4
Growth StrategyIn this Chapter
On October 2011, PT Bhimasena Power Indonesia (BPI) signed a 25-year Power Purchase Agreement (PPA) with PLN for a 2,000 MW Central Java Power Plant (CJPP) project.
The 2x30MW mine-mouth power plant will power the overburden crushing and conveying system as part of our goal to reduce dependency on oil.
We view South Sumatra as a strategic growth area due to its large coal resources and proximity to large power market of Java and we plan to replicate our successful business model we have used in South Kalimantan.
Overburden crushing and conveying system is aimed to improve operational effi ciency as well as improve safety standards in handling the overburden.

Adaro Energy Annual Report 2011www.adaro.com 133
Production ramp up and mine planning
Majority of organic growth will come from Wara mine
Implementation of OPCC, mine mouth power plant and control
of barge cycle time
Chip sealing of hauling road, dredging of channel etc have been initiatives in past that
brought down costs substantially
Acquisition of large coal deposits at different locations
in Kalimantan and Sumatra islands
Acquired concessions in South Sumatra, more in due diligence. Partnering with BHP Billiton on
coking coal
Investment into IPPs
First Indonesian company to participate in IPPs in a signifi cant
way. Partnering with reputable global players in IPP sector
Action Plan Growth Strategy
A Snapshot of Adaro Energy
From Us to You
Running Adaro
Management Report
Owning Adaro
Governing Adaro
Financial Report
Additional Information
1
2
3
4
5
6
7
8
04
26
35
68
144
152
164
269

Adaro Energy Annual Report 2011 www.adaro.com134
Adaro Energy continued to focus on creating maximum value from Indonesia coal through four key main strategies; organic growth from the current reserve base, improving the effi ciency of our coal supply chain, increasing and diversifying reserves, products and locations and lastly deepening integration. As we progress towards our medium term production goal of 80 million tonnes per year, our E4000 coal, which has become well accepted in the market, will play the major role in organic growth. Our investments in a number of infrastructure development projects are on track and progressing well, further improving effi ciency and lowering costs. We acquired interests in two coal deposits and one logistic company in South Sumatra to diversify our operations and increase reserves. We continued our move further downstream into power by establishing a consortium with J-Power and Itochu and were selected to build a 2,000 MW coal-fi red, ultra-supercritical power station in Central Java, which will be one of the largest in Asia.
market, will play the major role in organic growth. Our investments in a number of infrastructure development projects are on track and progressing well, further improving effi ciency and lowering costs. We acquired interests in two coal deposits and one logistic company in South Sumatra to diversify our operations and increase reserves. We continued our move further downstream into power by establishing a consortium with J-Power and Itochu and were selected to build a 2,000 MW coal-fi red, ultra-supercritical power station in Central Java, which will be one of the largest in Asia.
market, will play the major role in organic growth. Our investments in a number of infrastructure development projects are on track and progressing well, further improving effi ciency and lowering costs. We acquired interests in two coal deposits and one logistic company in South Sumatra to diversify our operations and increase reserves. We continued our move further downstream into power by establishing a consortium with J-Power and Itochu and were selected to build a 2,000 MW coal-fi red, ultra-supercritical power station in Central Java, which will be one of the largest in Asia.
We recorded our twentieth straight year of organic production growth and delivered on our guidance of 46-48 million tonnes in 2011, as coal production increased 13% to 47.67 million tonnes. In the future, the majority of our organic growth will come from our low cost Wara mine, which we started producing from in 2010 and possesses attractive geology with thick, near surface seams and low stripping ratios. The E4000 coal from the Wara pit continues to be well accepted in the Asian market with an increase in sales volume of 167% in 2011 as we sold E4000 coal to India, China, South Korea, Thailand, Hong Kong and Indonesia. We plan to ramp up Wara production to 8 to 10 million tonnes in 2012 with medium term target of up to 25 million tonnes. We also made strategic investments in infrastructure development projects at our Tutupan mine to further improve effi ciency and reliability, lower cost, improve safety and create long-term sustainable value from this mine.
Organic Growth from Current Reserve Base
Ari Hariadi Project Development GM
Prior to joining Adaro in 2008, Ari was involved in performance improvement projects within the automotive industry and other senior management positions for over 10 years. He holds a degree in Mechanical Engineering from Institut Teknologi Sepuluh November, Surabaya
Members of Project Development Department
1
Management Report | Investments for Future Performance4
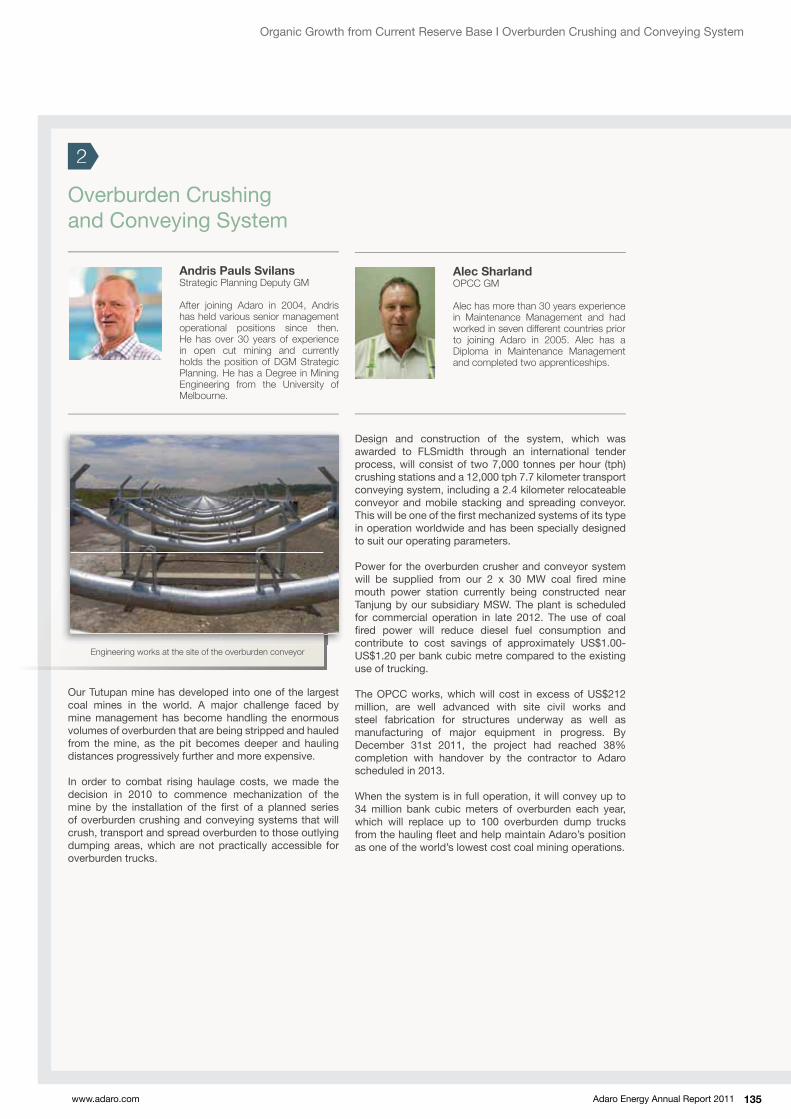
Adaro Energy Annual Report 2011www.adaro.com 135
Our Tutupan mine has developed into one of the largest coal mines in the world. A major challenge faced by mine management has become handling the enormous volumes of overburden that are being stripped and hauled from the mine, as the pit becomes deeper and hauling distances progressively further and more expensive.
In order to combat rising haulage costs, we made the decision in 2010 to commence mechanization of the mine by the installation of the fi rst of a planned series of overburden crushing and conveying systems that will crush, transport and spread overburden to those outlying dumping areas, which are not practically accessible for overburden trucks.
Overburden Crushing and Conveying System
Andris Pauls SvilansStrategic Planning Deputy GM
After joining Adaro in 2004, Andris has held various senior management operational positions since then. He has over 30 years of experience in open cut mining and currently holds the position of DGM Strategic Planning. He has a Degree in Mining Engineering from the University of Melbourne.
Engineering works at the site of the overburden conveyor
Alec SharlandOPCC GM
Alec has more than 30 years experience in Maintenance Management and had worked in seven different countries prior to joining Adaro in 2005. Alec has a Diploma in Maintenance Management and completed two apprenticeships.
Design and construction of the system, which was awarded to FLSmidth through an international tender process, will consist of two 7,000 tonnes per hour (tph) crushing stations and a 12,000 tph 7.7 kilometer transport conveying system, including a 2.4 kilometer relocateable conveyor and mobile stacking and spreading conveyor. This will be one of the fi rst mechanized systems of its type in operation worldwide and has been specially designed to suit our operating parameters.
Power for the overburden crusher and conveyor system will be supplied from our 2 x 30 MW coal fi red mine mouth power station currently being constructed near Tanjung by our subsidiary MSW. The plant is scheduled for commercial operation in late 2012. The use of coal fi red power will reduce diesel fuel consumption and contribute to cost savings of approximately US$1.00-US$1.20 per bank cubic metre compared to the existing use of trucking.
The OPCC works, which will cost in excess of US$212 million, are well advanced with site civil works and steel fabrication for structures underway as well as manufacturing of major equipment in progress. By December 31st 2011, the project had reached 38% completion with handover by the contractor to Adaro scheduled in 2013.
When the system is in full operation, it will convey up to 34 million bank cubic meters of overburden each year, which will replace up to 100 overburden dump trucks from the hauling fl eet and help maintain Adaro’s position as one of the world’s lowest cost coal mining operations.
2
Organic Growth from Current Reserve Base I Overburden Crushing and Conveying System

Adaro Energy Annual Report 2011 www.adaro.com136
Makmur Sejahtera Wisesa (MSW) 2x30 MW Power Plant, located in Tanjung, South Kalimantan.
The US$160 million, 2 x 30 MW coal fi red mine-mouth power plant is owned and will be operated by our subsidiary PT Makmur Sejahtera Wisesa (MSW). The plant will reduce our dependency on oil by powering the overburden crushing and conveying system and also support Adaro Indonesia’s mining operations by providing reliable electrical power as a captive power plant. The net power output is guaranteed at 52.5 MW and up to 5 MW of the power plant’s output will be set aside to supply the local communities.
Equipment manufacturing and construction has been underway since 2009 and is on track for completion in 2012. The project progress had reached 82% with an expenditure of US$112 million by the end of 2011. The plant will be fuelled by approximately 300,000 tonnes of E4000 coal per year.
2 x 30 Mine-mouthPower Plant
Joseph ChongCEO MSW,Director Adaro Power
Joseph had over thirty years working experience with Tenaga Nasional Berhad prior to joining Adaro in 2008. Joseph holds a Bachelor’s degree in Mechanical Engineering from Liverpool University, UK and an MBA from Oregon State University, USA.
per year.
Personnel at MSW’s site.
The main equipment used in this project is supplied by reputable manufacturers. Siemens is the source of the steam turbine generators and BHEL of India for the boilers, which will use circulating fl uidized bed (CFB) technology that was selected due to its suitability for use with high moisture low rank coals like Adaro’s Wara coal.
Environmental considerations were other key factors in the design of the plant. With CFB technology, emissions of sulphurous gases can
2
Management Report | Investments for Future Performance4

Adaro Energy Annual Report 2011www.adaro.com 137
Expanding Capacity at Kelanis River Terminal
Members of the Engineering DepartmentMembers of the Engineering Department
L. Y. Chan Engineering Manager
L. Y joined the previous shareholders of Adaro in the late 1980’s. He was responsible for the construction of the fi rst Adaro crushing line at Kelanis in 1991. He has worked on several coal handling and processing facilities in East and South Kalimantan since then. He now heads the Engineering Division which provides in-house engineering and project management services to the Adaro Energy Group companies.
infrastructural developments as part of the terminal upgrade include installation of a modern three story operations and control building, replacement of coal sampling equipment to enhance quality control, and replacement and additions to the coal reclaim bulldozer fl eet.
When the terminal’s upgrading and modernization program is completed by the end of 2012, throughput capacity will increase to around 70 million tonnes per annum, further enhancing Kelanis terminal’s status as one of the world’s largest bulk handling river ports. The expected project cost is around US$55 million with total spending of US$20.6 million as at the end of 2011.
Kelanis upgrading project in underway to increase it’s capacity to over 70 million tonnes by the end of 2012
2
Our Kelanis crushing, stockpiling and barge loading facility is located on the Barito River and has a throughput capacity of approximately 55 million tonnes per year; however, to meet future targets, this throughput has to be increased. We had already begun this next key expansion step with the installation of an additional three-stage crushing facility to six of the existing seven systems, which when completed, will increase the Kelanis in-loading capacity to 10,500 tonnes per hour.
We will also expand our barge loading capacity by upgrading each barge-loading system to increase total barge-loading capacity to 14,000 tonnes per hour. In addition, a major overhaul and upgrade of the Kelanis terminal’s power plant and electrical systems is also underway, which will increase the total installed power to 25 MW. Other
2 x 30 Mine-mouth Power Plant I Expanding Capacity at Kelanis River Terminal

Adaro Energy Annual Report 2011 www.adaro.com138
Establishing Our Foothold in South Sumatra
Alastair GrantSenior Advisor Business Development
Alastair joined Adaro in 1990 as General Manager and became a Director after the Group’s IPO in 2008. He is currently in charge of business development. He has over 45 years of experience working in the energy and minerals industries. He has a B.E. (Mining) and M.E. (Mineral Engineering) from Otago University, New Zealand and a B.A. (Economics) from the University of New England, Australia.
Personnel at Mustika Indah Permai (MIP).
Adaro Energy views South Sumatra as a highly strategic growth area owing to the province’s proximity to the large power market of Java and its large coal resources and reserves. Adaro Energy’s plan in South Sumatra is to replicate the successful business model it has used in South Kalimantan, by owning high quality coal assets and developing a vertically integrated coal supply chain.
In August 19th 2011, Adaro Energy announced it had acquired a 75% equity interest in PT Mustika Indah Permai (MIP), which has a coal concession under an IUP near Lahat in South Sumatra for US$222.5 million. This concession has total JORC Compliant Coal Resources and Reserves estimated at 286 million tonnes and 273 million tonnes, respectively. This reserve base is suffi cient to sustain a production level of up to 10 million tonnes per annum for 26 years. The JORC Coal Reserve Report was prepared by Marston, an internationally recognized American mining consultant. The MIP concession area contains three main coal seams and two minor seams, which range up to 17 meters in thickness and is suitable for open cut mining with a very low strip ratio of 2.8 bank cubic meters per tonne (bcm/t).
Prior to acquiring MIP, Adaro Energy conducted legal due diligence of MIP’s tenure and found MIP’s IUP was obtained through a lawful process. Since the time of the
IndoMet Coal
On March 31st, 2010, BHP Billiton announced it had entered into binding agreements to create a new joint venture for its IndoMet Coal project with PT Alam Tri Abadi, a wholly owned subsidiary of PT Adaro Energy. Adaro agreed to acquire a 25% interest in this joint venture for US$350 million inclusive of tax, while BHP Billiton holds the remaining 75%. The IndoMet Coal project covers seven Coal Contracts of Work (CCoWs) located in East and Central Kalimantan in Indonesia. The undeveloped metallurgical and thermal coal resources are estimated at 774 million tonnes (JORC Compliant 2008). The formation of this new joint venture was approved by the Indonesian Government in May 2010.
Further studies to identify development options across the seven CCoWs continued during 2011. A phased approach to development is planned, commencing in early 2012, with construction of a road and associated infrastructure in support of future mine development.
33
Management Report | Investments for Future Performance4
Map of IndoMet Coal

Adaro Energy Annual Report 2011www.adaro.com 139
Pre-marketing of the coal has commenced and the coal is branded as “Ultima” to aid in these campaigns. E4000 from Adaro’s Kalimantan operations, which is similar in energy value and moisture, has already been well received by end-users and we expect that Ultima will be accepted by these utilities due to Adaro’s reputation for high standards of reliability and quality. MIP is continuing to build orders for Ultima for 2012 and beyond and is in discussions with end users in Indonesia, China, India, Taiwan, Thailand, The Philippines and Vietnam.
MIP was the first of three investments Adaro Energy successfully completed during the second half of 2011, which together form the backbone of Adaro’s strategy to create long term value in South Sumatra. This is part of the broader strategy to diversify location, license maturities, and products. In addition to the 35% acquisition in PT Servo Meda Sejahtera (SMS) for Rp200 billion in October 2011, we also acquired a 61.04% interest in PT Bukit Enim Energi (BEE) for US$67 million. BEE is a coal mining company developing a greenfield project in the Muara Enim regency, South Sumatra. BEE holds an IUP granted in March 2011 for a period of twenty years that covers an area of approximately 11,130 hectares. These South Sumatran coal and infrastructure projects are investments that, together with organic growth, will help Adaro Energy achieve 80 million tonnes of coal production per year in the medium term.
Reynard HanoppoCoal Marketing and Business Development GM
Reynard recently re-joined Adaro after leaving OML in 2008. He has 15 years experience in coal marketing with previous work experience in Peabody Coaltrade Indonesia, Peabody Energy, and Kideco. He graduated from London School of Economics and Political Science, UK.
MIP acquisition, the Supreme Court of the Republic of Indonesia has completed Judicial Reviews of the claim filed by the plaintiff, who contested the legality of the MIP IUP through state administrative and civil court proceedings. The Judicial Reviews of the Supreme Court were granted on October 10, 2011 and November 10, 2011 respectively and found against the plaintiff. The Judicial Reviews are final and binding, thereby confirming that MIP’s IUP was obtained through a lawful process.
MIP has completed a detailed mine plan and set up offices in Lahat in 2011 and plans to produce coal by the end of 2012. Coal production is expected to ramp up to ten million tonnes per annum five years from the time operations commence and will be undertaken by Adaro Energy’s mining and hauling contractor, PT Saptaindra Sejati (SIS) to mine and transport the coal. The coal will be trucked along a dedicated 141 kilometer private coal haul road to a barge loader on the Musi River. Both pieces of infrastructure are operated by PT Servo Meda Sejahtera’s (SMS), in which we hold a 35% interest. The coal will be barged 185 kilometers down the Musi River to the Palembang anchorage for transshipment on to offshore vessels or barged direct to customers in the region. Development work, including pre-stripping and mine development, continues at the site and along the transportation corridor in conjunction with environmental and social studies. Capital expenditures at MIP, excluding heavy equipment, are estimated at approximately US$50 million, split almost evenly over 2012 and 2013, and will be funded by Adaro Energy.
Map of Adaro’s Assets in South Sumatra
Establishing Our Foothold in South Sumatra

Adaro Energy Annual Report 2011 www.adaro.com140
Continue in the Lookout for Potential Coal Deposits in Indonesia to Support Growth
Worldwide energy demand is at unprecedented high levels and demand is expected to continue to grow for the foreseeable future. In order to fuel this appetite, all potential energy sources will be needed, including some that may not have been considered practical in the past. Development of coal resources, the most abundant fossil fuel in the world, underscores these events taking place.
High quality coal sources are becoming more expensive and many of the reserves are being rapidly depleted. However, there are a large number of low rank coal resources that are available to contribute to the burgeoning worldwide coal markets. These low rank coals can present challenges in terms of marketing and acceptance by the end-users; however, the abundance, relatively low cost, and certain favorable environmental characteristics ensure that they will play an important role in coal’s future. Many of the low rank coals exhibit quality characteristics of low ash, low sulfur, and low nitrogen content.
We encourage new power plants to be designed for a range of coal qualities, including low rank coals, as this provides utilities with fl exibility in coal sources and lowers the risk of future high fuel costs. Existing power plants that were designed for higher quality coals may require some plant modifi cations, operational changes or blending with other coals to successfully utilize low rank coals. In many cases, power plant operators are recognizing the value of lower rank coals as part of their fuel portfolio diversity. Initial reluctance can turn into enthusiasm with familiarity
and recognition of benefi ts. While economics drive most business decisions, in many cases technical solutions are required to ultimately allow an effective result.
Adaro has been a leader in working with power plant operators to assist them in the utilization of low rank coals. When the fi rst Indonesian subbituminous coals were introduced to the world markets, Adaro led the way with lending technical guidance and expertise to gain acceptance with our customers. Numerous seminars, customer visits, combustion tests and test burns were conducted. The initial concerns with Envirocoal have been all but erased, resulting in a continually increasing demand for this product. The success of Envirocoal has paved the way for increasing interest in the recently introduced E4000 product.
As we move forward, we expect to see some customer concerns with the lower rank coals. Adaro is showing leadership by providing personalized service to our customers by using our extensive experience with a diverse worldwide customer base. Coal is a heterogeneous product and is not manufactured to specifi c quality standards. Areas of concern include handling, storage, combustion, boiler performance, emissions, and safety.
Along with the increased use of low rank coals, new technologies are being developed to allow a wider range of applications for these coals. The greatest challenge for the low rank coals is to reduce the inherently high moisture. Producing a stable product after drying the coal has proved to be elusive. The use of briquetting for upgrading appears to be very promising and Adaro has been pursuing this technology on several fronts.
Adaro’s reputation as a reliable supplier has been in no small part due to its emphasis on customer service. Mining is only one link in the coal supply chain. The coal also has to be transported and successfully burned at the customer facility. As the industry faces challenges utilizing lower rank coals, Adaro will continue to form strong relationships with our customers to help them produce low cost reliable power.
Craig Vogel Combustion and Fuels Consultant
Craig Vogel has been a consultant for Adaro for the past eight years. He has over 40 years of experience in the fi eld of electrical power generation and industrial boilers. He has worked for engineering fi rms and for coal suppliers where he provided technical assistance for fuel switching and test burns.
3
Management Report | Investments for Future Performance4

Adaro Energy Annual Report 2011www.adaro.com 141
Boosting Energy through Coal Technology
In 2011, Adaro Coal Technology put more attention to re-search and development of coal upgrading techniques. We continued our partnership with various domestic as well as foreign parties and conducted important test and trial activi-ties.
Our process development team managed to complete a number of tryouts in coal upgrading process development and verifi cation, as well as handling test and stock piling test to observe spontaneous combustion and weathering phe-nomena from the upgraded coal. Our process development initiatives have been going on intensively since three years ago in the United States and entering the fi nal stage. We are now in the preparation phase to build a Demonstration Plant in Indonesia, planned to start construction at the end of 2012. In addition, our collaboration with another technol-ogy developer in the United States has completed a “bulk sample test” with satisfactory results from both processing and the quality of upgraded coal.
In 2011, we also started to research advanced processing of coal such as coal gasifi cation and coal liquefaction. Part-nerships with various domestic and foreign institutions are currently underway to research on the utilization of Clean Coal Technology and utilization of low-rank coal for coking coal.In order to build a winning team for a bigger and bet-ter Adaro, in 2011, we sent a number of staff members to attend relevant training programs in the United States and Japan.
In 2012, the Coal Technology Group plans to continue the preparation of construction and operation of the Demon-stration Plant, complete engineering study for the Commer-cial Plant, and continue with study programs, research, and development of other coal processing technologies. We also plan to improve our cooperation with leading domestic and foreign institutions in the development of Coal Technol-ogy. Hence, the Coal Technology Group will need to recruit a number of talented engineers to support the implementa-tion of abovementioned programs.
Leonard LembongChief of Coal Technology
Leonard had a distinguished business career with the Astra Group, including being Executive Vice President of PT. Astra Otoparts Tbk. He joined Adaro’s coal mining contractor company in May 2010, and has accepted the appointment to head up Adaro’s coal technology business program since January 2011.
Members of Business Development and Coal Technology Department.
3
Continue in the Lookout for Potential Coal Deposits in Indonesia to Support Growth I Boosting Energy through Coal Technology

Adaro Energy Annual Report 2011 www.adaro.com142
Evaluating Other Independent Power Producer Projects to Create Signifi cant Base Demand for Our Coals
2,000 MW Central Java Power Plant (CJPP) Project
In June 2011, PT Bhimasena Power Indonesia (BPI), which is a joint venture company established by a consortium of Adaro, Itochu and J-Power received a Letter of Intent from PLN to build, own and operate a 2,000 MW coal-fi red power station known as the Central Java Power Plant (CJPP) project which will generate electricity to supply the Java-Bali grid spanning across the islands of Java and Bali and will be one of the largest of its type in Asia. The plant, which will be fuelled by domestic sub-bituminous coal, will be the fi rst in Indonesia to use advanced environmentally friendly, ultra-supercritical (USC) technology and will serve as a model of high-effi ciency power generation.
In October 2011, BPI signed a 25-year Power Purchase Agreement (PPA) with PLN as well as a Guarantee Agreement with the Government of the Republic of Indonesia and Indonesia Infrastructure Guarantee Fund to guarantee PLN’s payment obligation for the CJPP project under the PPA. This is the fi rst formalized public-private partnership (PPP) in Indonesia under a guarantee provided by the IIGF and part of the Master Plan for Acceleration and Expansion of Indonesian Economic Development (MP3EI).
The CJPP project is estimated to cost approximately US$4 billion and will be utilising advanced Japanese technology. The project is now at the development stage and commercial operations is scheduled for 2016 to 2017.
We continue to carefully evaluate other Independent Power Producer (IPP) projects in Indonesia that offer commercially reasonable value as well as strategic benefi ts for our long-term business plan. Our investment in power generation does not divert our focus in coal but rather will complement our core business by providing good returns, more stability than coal and creating demand for our low rank coals. Additionally, our power business will also diversify our cash fl ows, boost our Domestic Market Obligation and improve our bargaining power with boiler manufacturers. Our intention is to form partnerships with reputable blue chip power utilities to build effi cient and environmentally friendly power plants to burn our subbituminous low rank coals. Our main role in these partnerships will be to underpin long term fuel supply through coal procurement as we aim to be the base tonnage supplier in conjunction with other coal producers.
Chong Swee ChoonOperations GM
Chong graduated in electrical engineering from University of Malaya and obtained his MBA from Ohio University. He served more than 30 years with Tenaga Nasional Berhad, Malaysia’s leading utility company in various positions including general manager of the 2100 MW coal fi red power plant at Manjung before joining PT. MSW in 2010.
Tongchai IemkanitchatTechnical GM
Tongchai holds a Master Degree in Engineering Business Management from University of Warwick, UK. Prior to joining Adaro in 2010, he worked with Electricity Generating Authority of Thailand for 16 years and with GDF Suez Energy International for 2 years.
4 4
Management Report | Investments for Future Performance4
Map of Central Java Power Plant Project

Adaro Energy Annual Report 2011www.adaro.com 143
A DiscussionMr. Andre J. Mamuaya, Director,Corporate Affairs
with
You are also the President Director of Adaro Power. Why should Adaro Energy move into the power generation business?
We will continue to focus on our core business in South Kalimantan, while also developing our new projects in order to create maximum value. While we are looking to create long term value, boost reserves and help achieve our medium term volume target through the organic and acquisitive investments in Indonesian coal, our move into the power sector is also very strategic.
Have you had much success in implementing this business strategy?
In October 2011, our international consortium, which includes J-Power and Itochu, signed a power purchase agreement with PLN, the state power utility, to construct and operate a US$4 billion 2,000 MW IPP project to be built in Batang Regency, Central Java.
While there is still much work to be done, I believe our business model to develop coal assets and to deepen our downstream integration into domestic power generation from “pit-to-port” to become “pit-to-power” is one of the best ways to create long term sustainable value from Indonesian coal. This
will be enjoyed, not only by our shareholders, but also by multiple stakeholders. While we grow and become more profi table, we have to also help ensure that everyone in society is benefi ting and that the income gap is not widening.
How will the IPP business contribute?
In the long term, we see power as an important minority part of our revenues, providing good returns and more stability than coal as well as creating demand for low rank coals. We will consider the power projects, which are commercially and politically make sense for us. We are being selective and will likely only choose the projects that allow us to use our own low rank coal as a fuel.

Adaro Energy Annual Report 2011 www.adaro.com144
Management Report | Shareholders Informations4
IPO Proceeds Realization
The net IPO proceeds (after deducting total IPO cost) of Rp11,846,595,741,289 were entirely spent as of May 29th, 2009. This was reported to the Shareholders by the Management in the Annual General Meeting of Shareholders (AGMS) conducted on June 3rd, 2009.
Shareholders as of 30 December 2011
Investors Number of Investors Number of Shares
Domestic
• Retail 15,628 6,134,208,446
• Corporation 337 17,094,755,616
• Pension Fund 145 214,596,000
• Others 14 11,639,000
Sub-Total 16,124 23,465,199,062
Foreign
• Retail 120 19,352,900
• Corporation 737 8,501,410,038
• Pension Fund 0 0
• Others 0 0
Sub-Total 857 8,520,762,938
TOTAL 16,981 31,985,962,000
Shareholders Information
Shareholders Holding > 5% as of 30 December 2011
Shareholder Number of SharesPT Adaro Strategic Investments 14,045,425,500
Garibaldi Thohir 1,967,600,654
Sub-Total 16,013,026,154
Public 15,972,935,846
Total 31,985,962,000
Note:* includes the remaining ownership held by key shareholders
IPO Highlights
Effective date 4 July 2008
IPO Date 16 July 2008
IPO Price Rp1,100
End of First Day Price Rp1,730
% Increase of First Day 57.27%
Number of Listed Shares 31,985,962,000
New Shares Issued 11,139,331,000
% of IPO Shares 34.83%
Proceeds from Public Offering Rp12,253,264,100,000
Public Offering Fees Rp406,668,358,711
Net Proceeds Rp11,846,595,741,289
Projected Use of IPO Proceeds
Additional Investments in ATA 10,852,298,400,000 91.61%
Share Purchase of ATA 356,000,124,700 3.01%
Share Purchase of SIS 158,775,676,000 1.34%
Additional Investments in SIS 365,940,000,000 3.09%
Working Capital 113,581,540,589 0.96%
Total 11,846,595,741,289 100.00%
IPO Proceeds Realization
Additional Investments in ATA 10,852,298,400,000 91.61%
Share Purchase of ATA 356,000,124,700 3.01%
Share Purchase of SIS 158,775,676,000 1.34%
Additional Investments in SIS 365,940,000,000 3.09%
Working Capital 113,581,540,589 0.96%
Total 11,846,595,741,289 100.00%
Remaining Proceeds from Public Offering
- -

Adaro Energy Annual Report 2011www.adaro.com 145
INDONESIA STOCK EXCHANGE, ADRO SHARE PERFORMANCE, AND SENIOR NOTES
Indonesia Stock Exchange
Despite the global economic uncertainty in 2011, the Jakarta Composite Index (JCI) of the Indonesia Stock Exchange (IDX) still re-corded a slight increase of 3.20% year over year (y-o-y). This return was the second best in Asia after the Philippines’, which increased 4.07%. The JCI closed at 3,822 in its last trad-ing day in 2011.
In 2011, the JCI peaked at 4,193 on August 1st with the lowest level at 3,269 on October 4th. The Dow Jones Industrial Average (DJIA) of the New York Stock Exchange (NYSE) re-corded the highest global growth at 9.82% to 12,218.
As of December 30th, 2011, the JCI market capitalization had risen to Rp3,537 trillion from Rp3,247 trillion a year earlier an increase of 8.93%, while the average daily transaction value, which was Rp4.80 trillion in 2010, grew 3.36% to Rp4.96 trillion. The average daily shares transaction frequency in 2011 reached 113,614 times, up 7.40% from 105,790 times in 2010. In addition, the average daily shares transaction volume in 2011 decreased 10.32%
to 4.87 billion shares from 5.43 billion shares in 2010 due to the increase in share prices.
In 2011, Rp62.3 trillion was raised through the IDX, consisting of:
- Rp19.59 trillion from IPOs (25 companies);- Rp42.14 trillion from Rights Issues; and- Rp0.57 trillion from Warrants.
ADRO Share Performance
In 2011, ADRO shares closed at Rp1,770, down 30.59% year over year. Our shares reached the highest level at Rp2,875 on July 4th and the lowest level at Rp1,520 on Sep-tember 26th. As a result, Adaro’s market capi-talization was down 30.59% y-o-y to Rp56.62 trillion as of December 30th 2011. However, the average market capitalization of ADRO shares remained the best in the mining indus-try and ranked 12th overall in the IDX. The av-erage market capitalization of ADRO shares weighted 1.68% and 13.98% to the Jakarta Composite Index and the Mining Sector In-dex, respectively.
In addition, ADRO shares are also included in several IDX indices, namely Main Board Index, Mining, Jakarta Islamic Index, LQ45, Kompas100, Bisnis-27, and SRI-Kehati.
Adaro Energy BBG World Coal IndexHSBC Global Mining Index Bloomberg Coal Index
Jakarta Mining Index
Q2 Q3 Q4Q1Jan Feb Mar Apr May Jun Jul Aug Sep Oct Nov Dec
Sha
re p
rice
(Rp)
0 0
1000
50,000
100,000
150,000
200,000
250,000
300,000
-50
-40
-30
-20
-10
0
10
500
1,000
1,500
2,000
2,500
3,000
2,675
1,770
Volu
me
(000
)
Ret
urn
(%)
A Snapshot of Adaro Energy
From Us to You
Running Adaro
Management Report
Owning Adaro
Governing Adaro
Financial Report
Additional Information
1
2
3
4
5
6
7
8
04
26
35
68
144
152
164
269

Adaro Energy Annual Report 2011 www.adaro.com146
Description
2008 2009 2010 2011
1st
Quarter
2nd
Quarter
3rd
Quarter
4th
Quarter
1st
Quarter
2nd
Quarter
3rd
Quarter
4th
Quarter
1st
Quarter
2nd
Quarter
3rd
Quarter
4th
Quarter
1st
Quarter
2nd
Quarter
3rd
Quarter
4th
Quarter
Open - - 1,100 1,400 490 900 1,190 1,430 1,730 1,960 1,990 2,025 2,550 2,200 2,450 1,720
Highest - - 1,730 1,210 1,000 1,450 1,520 1,780 2,075 2,250 2,150 2,650 2,900 2,500 2,700 2,150
Lowest - - 1,320 470 485 880 1,070 1,370 1,730 1,700 1,760 2,000 2,175 2,200 1,430 1,500
Close - - 1,400 485 880 1,200 1,430 1,730 1,960 1,990 2,025 2,550 2,200 2,450 1,720 1,770
Share Price Per Quarter For the Last 4 Years
Description ADRO IDX Composite DJIA S&P 500 FTSE 100 NIKEI
Open - July 16 2008 1,100 2,215 10,963 1,245 5,172 12,755
Close - Dec 31 2009 1,730 2,534 10,428 1,115 5,413 10,546
Close - Dec 31 2010 2,550 3,703 11,125 1,258 5,900 10,229
Close - Dec 31 2011 1,770 3,822 12,218 1,258 5,572 8,455
% Change -30.59% 3.21% 9.82% 0.00% -5.55% -17.34%
Description ADRO IDX Mining Bloomberg Mining Bloomberg Coal HSBC Mining HSBC Coal
Open - July 16 2008 1,100 2,215 405 903 5,172 12,755
Close - Dec 31 2009 1,730 2,203 338 485 1,267 1,329
Close - Dec 31 2010 2,550 3,274 429 498 1,620 1,688
Close - Dec 31 2011 1,770 2,532 297 393 1,154 1,162
% Change -30.59% -22.65% -30.62% -21.04% -28.79% -31.17%
International Indices
Senior Notes
In 2009, Adaro Indonesia, a wholly-owned subsidiary of Adaro Energy, issued US dollar denominated 10-year senior notes guaranteed by Adaro Energy in the amount of US$800 million, with fixed interest rate of 7.625% per annum paid semi annually (April and October) and non-callable for 5-years. Credit Suisse, DBS Bank Ltd, and UBS AG were appointed as joint bookrunners. The senior notes were offered under Rule 144A/Reg S and are listed on the Singapore Exchange Securities Trading Limited (SGX-ST).
Table Senior Notes ListingRating Moody’s Investors Service Ba1 (stable) and Fitch Ratings BB+ (stable)
Description Listing Date Amount (USD) Interest / Period
USD Secured Senior Notes 22 October 2009 800,000,000 7.625 p.a. / 10 years
Table Interest Payment for Bonds
No. Description Payment Period
Amount (USD)
1. 1st Interest Payment April 2010 30,500,000
2. 2nd Interest Payment October 2010 30,500,000
3. 3rd Interest Payment April 2011 30,500,000
4. 4th Interest Payment October 2011 30,500,000
Total Bonds Interest Payment from 2010 to 31 December 2011
122,000,000
Management Report | Shareholders Informations4
Devindra RatzarwinCorporate Secretary
Devindra has more than 10 years experience in the financial industry prior to joining Adaro in 2008. He previously worked in Darma Henwa as Corporate Secretary, Perusahaan Pengelola Aset (Persero) as Deputy General Manager, Indonesian Bank Restructuring Agency as Assistant Vice President and Bank Bali as Manager. He holds a Bachelor of Science in Business Administration degree from the University of Louisiana at Lafayette and MBA from McNeese State University.

Adaro Energy Annual Report 2011www.adaro.com 147
Dividend Payment and Policy
No.Type Of
Dividend
Fiscal Year Net Income
Dates
Announcement Media Placement
Cum
Reguler & Negotiated
Market
Cash Market
1 Final Dividend 2008 IDR 887,198,605,378 5-Aug-09 BI & Republika 25-Aug-09 28-Aug-09
2Interim Dividend 2009 IDR 3,514,636,491,535 23-Nov-09 BI & Republika 11-Dec-09 16-Dec-09Final Dividend IDR 4,367,251,806,020 12-May-10 IDI & Republika 2-Jun-10 7-Jun-10
3Interim Dividend 2010 IDR 1,696,265,109,013 8-Nov-10 BI & Republika 26-Nov-10 1-Dec-10Final Dividend IDR 2,207,312,362,331 27-Apr-11 IDI & Republika 27-May-11 1-Jun-11
4 Interim Dividend 2011 USD 376,046,242 9-Nov-11 IDI & Republika 28-Nov-11 1-Dec-11
Dates
Recording Date (Dps) Distribution Dividend
Per ShareNumber Of
SharesTotal
Dividend
Dividend Payout Ratio
Ex
No. Fiscal Year
Reguler & Negotiated
Market
Cash Market
1 2008 26-Aug-09 31-Aug-09 28-Aug-09 11-Sep-09 IDR 11.80 31,985,962,000 IDR 377,434,351,600 42.54%
2 2009 14-Dec-09 17-Dec-09 16-Dec-09 30-Dec-09 IDR 12.00 31,985,962,000 IDR 383,831,544,000 21.24%3-Jun-10 8-Jun-10 7-Jun-10 18-Jun-10 IDR 17.00 31,985,962,000 IDR 543,761,354,000
3 2010 29-Nov-10 2-Dec-10 1-Dec-10 10-Dec-10 IDR 9.85 31,985,962,000 IDR 315,061,725,700 43.98%30-May-11 3-Jun-11 1-Jun-11 9-Jun-11 IDR 20.50 31,985,962,000 IDR 655,712,221,000
4 2011 29-Nov-11 2-Dec-11 1-Dec-11 9-Dec-11 USD 0.00235
31,985,962,000 USD 75,167,010.70
IDR 21.35 IDR 682,892,292,210
Dividend Payment
The 2011 Annual General Meeting of Shareholders approved the use of 43.98% net profit for the fiscal year 2010 final dividend payment of Rp970,773,946,700 or Rp30.35 per share. This amount includes an interim dividend of Rp315,061,725,700, which was paid on December 10th 2010. On November 8th, 2011, the BOC and BOD approved a fiscal year 2011 interim dividend distribution in the amount of USD75,167,010.70 or USD0.00235 per share based on the un-audited financial statements as of September 2011. The dividend was paid in Rupiah using the Indonesia Central Bank middle rate as of recording date (December 1st, 2011) as a conversion rate from USD to Rupiah of Rp9,085/USD. Therefore, the amount of interim dividend paid in Rupiah was Rp682,892,292,209.50 or Rp21.35 per share. The following table exhibits the detail of the dividend distributions:
Dividend Payment and Policy
Dividend Policy
Based on the provisions of Adaro Energy’s Articles of Association, if the company books a net profit then Adaro Energy may distribute dividends to its shareholders based on the Board of Directors’ recommendation after obtaining approval from the General Meeting of Shareholders.Adaro Energy will declare dividends with respect to:
(i) operating income, cash flow, capital adequacy and the financial condition of Adaro Energy and its subsidiaries as regards reaching optimum growth in the future;
(ii) the required fulfillment of reserve funds;(iii) Adaro Energy and its subsidiaries’ obligations based on agreements with third parties (including
creditors); and(iv) Compliance to the prevailing laws and regulations and GMS approval. The terms of the lending agreements allow Adaro Energy’s operating companies to distribute
dividends of up to 50% of the aggregate net profit of the borrowers. The interim dividend can be paid based on the BOD decision after having obtained the approval of the BOC.

Adaro Energy Annual Report 2011 www.adaro.com148
Adaro Energy has an active global Investor Relations (IR) program, whose goal is to help lower the cost of capital through timely, symmetrical and balanced disclosures as well as building understanding and trust with shareholders, analysts and fi nancial
Management Report | Investor Relations4
InvestorRelations
Cameron ToughHead of Investor Relations
Cameron has 13 years experience working in fi nance and investor relations in the Indonesian mining sector. He joined Adaro in 2008 at the time of the IPO. Cameron has a bachelor degree in Pacifi c and Asian Studies and Economics from the University of Victoria and a Post-Graduate Diploma in International Management (Asian Studies, Finance, Business, Marketing, Law, Mandarin) from the APMCP at McRae Institute at Capilano University. The APMCP is Canada’s award winning two year MBA level cooperative education program focusing on Asia.

Adaro Energy Annual Report 2011www.adaro.com 149
Director and Chief Finance Offi cer, David Tendian gives a podium presentation at a CLSA Forum in Hong Kong, September 2011
IncreasedTransparancy
IncreasedUnderstanding
BetterAcountability
BetterPerformance
Increased Coverage
Increased ShareholdersValue
A Snapshot of Adaro Energy
From Us to You
Running Adaro
Management Report
Owning Adaro
Governing Adaro
Financial Report
Additional Information
1
2
3
4
5
6
7
8
04
26
35
68
144
152
164
269

Adaro Energy Annual Report 2011 www.adaro.com150
community development programs. In addition, we started to engage in a media campaign by placing fi ve advertisements in fi nancial media such as Institutional Investor, Finance Asia and Bloomberg to increase market recognition of the Company.
We issued detailed Quarterly Activities Reports, which are not required by the compliance rules, and made regular press releases. All information once lodged to the Stock Exchange, is put onto Adaro Energy’s website at www.Adaro.com and then distributed to a recipient list by email. We continue to institutionalize the IR task in order to keep the market informed in a timely and balanced manner.
As of year-end 2011, there were thirty four analysts covering Adaro Energy with 20 buy, 6 outperform, 6 hold and 2 sell recommendations and a Bloomberg consensus rating of 4.394 (5.0 is the highest). A total of seven new domestic and international brokers picked up coverage of Adaro in 2011, increasing our transparency in the capital market.
Disclosure Policy
The disclosure policy was developed in 2008 and subsequently a disclosure team was formed, comprising of senior level managers from Investor Relations, Corporate Secretary, Legal, Operations, External Relations and Marketing. The execution of the disclosure policy is imperative to ensure compliance with prevailing rules and regulatory requirements as well as to help reduce volatility, improve market valuations, increase liquidity, improve Adaro’s credibility and enhance shareholder value. The disclosure policy had been put to use since Adaro’s listing in mid-2008, which was then formalized in 2009 to provide clear guidance on the disclosure of material information and regular disclosure activities. The launching of the disclosure policy reaffi rmed our commitment to provide timely, orderly, consistent and credible information in making all required disclosures on a broadly disseminated basis.
We believe that our disclosure activities in support of corporate governance went beyond what is required by market regulations in 2011. Examples of progress made include a regular Adaro Energy Quarterly Activities Report, presentations and meetings during non-deal roadshows and investor forums, and the disclosure of fair and balanced information to the capital market.
4
media. We seek to engage in ongoing dialogues with long-term focused institutional investors about the Company’s latest developments, strategic vision, and our plan to deliver sustainable value to shareholders. Our team is growing and consists of six IR practitioners at the end of 2011.
The IR division is part of corporate fi nance and reports directly to the CFO. The team is in regular contact with all members of the Board of Directors as well as other parts of the company to be fully informed on the latest developments. IR has active support of the Corporate Secretary, Finance, Legal, Marketing, Operations, Project Development and Business Development to ensure that the non-confi dential information is being communicated timely, accurately and consistently.
Adaro’s IR broadens awareness and interest through international roadshows, meetings, mine site visits, conference calls and media. In 2011, we had an average of 52 investor and analyst meetings per month, conducted twenty one conferences and six non-deal roadshows. We initiated for the fi rst time non-deal roadshows to Mumbai, India and Seoul, South Korea to broaden our investor base. We also hosted fi ve mine site visits for our investors and analysts. On July 13-14th 2011, we invited all our sell-side equity analysts to our newly inaugurated Adaro Institute for a series of presentations and dialogue with management and other senior personnel. There were 24 domestic and international analysts who attended the presentation, which was then continued with a mine site tour of Adaro’s operations and
Institutional Investor, Finance Asia and Bloomberg to increase market recognition of the Company.
We issued detailed Quarterly Activities Reports, which are not required by the compliance rules, and made regular press releases. All information once lodged to the Stock Exchange, is put onto Adaro Energy’s website at www.Adaro.com and then distributed to a recipient list by email. We continue to institutionalize the IR task in order to keep the market informed in a timely and balanced manner.
As of year-end 2011, there were thirty four analysts
Management Report | Investor Relations
Members of the IR Team (Investor Relations and Corporate Finance), from left to right: Heri Gunawan, Andrew Kandolha, Jessie Wahab, Cameron Tough, Danuta Komar and Rama Suparta

Adaro Energy Annual Report 2011www.adaro.com 151
Disclosure Policy I Annual Perception Survey 2011
Want to learn more about Adaro?
Please contact [email protected] or scan the barcode to order our past editions of Annual Reports
201020092008
Annual Perception Survey 2011
39.6%
26.4%
15.1%
18.9%
Words that best described Adaro Select One to Describe Adaro
Very Good
Good Needs Improvement
PoorAverage
Coal Miner
integrated energy company
International mining corporation
Indonesia
Man
agem
ent t
eam
Strate
gic p
lans
Busine
ss o
utloo
k
Corpor
ate g
over
nanc
e
Disclos
ure/
trans
paren
cy
Inves
tor R
elatio
ns
Quality
of e
arnin
gs
Size o
f fre
e fl oa
t
Finan
cial s
truct
ure
Stock
trad
ing liq
uidity
Recen
t mov
e int
o th
e IPP
Recen
t coa
l acq
uisitio
ns
Corpor
ate s
ocial
resp
onsib
ility
Health
, safe
ty an
d envir
onm
ent
• 49% consider Fundamentals as the most important factor in making investment decision.
• 33.3% state that Adaro’s solid fundamentals are their top consideration in investing in Adaro.
• 69% feel that the demand for low-CV coal below 4,000 kcal / kg (GAR) will continue to increase.
• 55.6% believe that the era of cheap coal is over.
• Almost 84% think that Adaro is better than its peers in the industry.
• On buying greenfi eld asset: o Reserve-based companies should always explore new
reserves potential o Prefer Adaro to buy greenfi eld asset and develop it, as it
offers better value.
• On Adaro’s competitive advantage: o Long term management strategic through integrating
the whole supply chain shows that Adaro’s management always plans for the long run.
o Integrated business model from pit to port, and soon to power generation.
o Strong fundamentals.

Adaro Energy Annual Report 2011 www.adaro.com152
Status of Corporate Governance Practices
Our Office in Jakarta
Management Report | Status of Corporate Governance Practices4
In this Chapter

Adaro Energy Annual Report 2011www.adaro.com 153
Our Corporate Governance Structure is In-line with International Best Practices
• 1/3 of Board of Commissioners are independent commissioners
• Audit Committee consists of three independent members
• Conduct regular internal audit of operations
• Disclosure meets or exceeds with international standards
A Snapshot of Adaro Energy
From Us to You
Running Adaro
Management Report
Owning Adaro
Governing Adaro
Financial Report
Additional Information
1
2
3
4
5
6
7
8
04
26
35
68
144
152
164
269

Adaro Energy Annual Report 2011 www.adaro.com154
Good Corporate Governance Principles
Organs of the Organization
Business Ethics and Rules of Leadership
We have implemented the GCG principles of transparency, accountability, independence and justice since our IPO in 2008 to comply with the Capital Market and Financial Institutions Supervisory Agency (Bapepam-LK) regulations for public company. Our majority shareholders and management have put tremendous efforts to instill a strong company culture emphasizing the importance of sustainable good governance application.The followings show concrete initiatives we took in implementation of GCG principles in 2011:• Development of BOC and BOD Charters.• Development of Audit Committee Charters.• Fulfilled the disclosure requirements vis-à-vis disclosure on operational
activities and corporate actions to Bapepam and the Indonesia Stock Exchange (“IDX”) through the Disclosure Committee.
• Improved the procurement system.
The General Meeting of Shareholders (GMS), Board of Commissioners (BOC) and Board of Directors (BOD) serve important roles in effective implementation of GCG by executing their respective functions under the principle of independence in carrying out duties, functions and responsibilities within the company.
As determined by the company’s articles of association, the General Meeting of Shareholders consists of an Annual General Meeting of Shareholders (AGMS) and an Extraordinary General Meeting of Shareholders (EGMS). AGMS shall be held within a period of no later than 6 (six) months after the end of a fiscal year. In 2011 we conducted the AGMS for the 2010 fiscal year together with the EGMS on April 20, 2011. The decisions made in the AGMS and EGMS were published in 2 (two) national media, the company’s website and IDX’s website.
In organizing the GMS, we invited our shareholders through announcement in two national media. Collective decisions were made in the Meeting through consensus for deliberation and voting, with the quorum of more than half of the attendees.
We have 6 (six) commissioners consisting of 4 (four) members representing the shareholders and 2 (two) Independent Commissioners, one of whom also serves as the Chairman of Audit Committee.
To achieve our vision of becoming a leading Indonesian Mining and Energy group, the principles of GCG act as the cornerstone of our corporate values and are applied in the rules of leadership. The following are some of our corporate values portraying the expected behaviour from both management and employees:- Customer focus. Attentive to the aspects of “Quality, Cost, Delivery and Safety (“ QCDS “) –
through establishing a strong supply chain system with integrated production process which accommodates our operations as well as our subsidiaries, from mining, logistics, transportation, infrastructures to port operations.
- Mutual respect and synergistic collaboration between all individuals within Adaro Group, abbreviated Adaro IBT, as follow:
• Attitude • Determined • Adaptive • Responsive • Open minded• Integrity • Balanced• Team Spirit
- Plan, Do, Check, Action (“PDCA”).- Simplicity in working and problem-solving termed as KISS (Keep it Simple Spirit).
Management Report | Status of Corporate Governance Practices4

Adaro Energy Annual Report 2011www.adaro.com 155
We are currently led by 7 (seven) directors who are professionals with diverse experience and backgrounds. The BOD oversees Adaro and its subsidiaries, and carries out their duties and functions referring to the assignment of responsibilities stipulated in the Articles of Association. The directors will also refer to Board of Directors’ Charter, which was still being finalized as of the end of 2011.Diverse backgrounds of our BOC and BOD contributes positively on the decision making process which is based on reasonable and prudential principles without being rigid.
The management has set out the company’s Vision, Mission and Values promulgated to the entire Adaro Group through the company’s book titled “The Family” and through training sessions at Adaro Institute.
As capital owners, the shareholders possess certain rights and responsibilities with regards to the company, which must be executed in accordance with the prevailing laws, regulations and articles of association.
Adaro’s Articles of Association, adjusted from Law No. 40 of 2007 on Limited Corporation and in accordance with Bapepam-LK’s regulation, states that the core shareholders must comply with the provisions of the Articles of Association, all decisions made in the GMS, and the applicable regulatory requirements.
The core shareholders are entitled to place their representatives in the company’s management, to receive the company’s annual dividend, to attend the GMS, to exercise voting rights in the GMS, and to obtain information and periodical reports from the management.
Our core shareholders highly support us and our growth plans to achieve our vision to be a leading Indonesian mining and energy group. Composed of 4 (four) groups of family, with combined ownership of 63% and in which no single group dominates the others with larger holding, our core shareholders regard themselves not as owners, but instead as partners in the implementation of our strategies to create maximum sustainable value from Indonesian coal.
Another key aspect regulated by the Articles of Association is regarding material transactions which may incur conflicts of interest. Such transactions must obtain the approval of GMS wherein the core shareholders who may be involved in the conflicts of interest must collect the supporting votes from other shareholders. The agreed quorum for this matter is half of the total other shareholders and the voting is only valid if the quorum of more than half of the other shareholders in attendance is achieved.
Our stakeholders consist of employees, personnel, and community groups within the company, with interests in the company as well as those directly affected by the company’s strategic decisions and operations. Therefore, we manage a fair and equitable relationship with all stakeholders in compliance with the applicable laws and regulations, and based on two-way rules applicable to all parties.
In addition to the core shareholders, Adaro Energy is 35% owned by public shareholders, who also hold various roles in both AGMS and EGMS. We maintain the list of shareholders through a Securities Administration Agency (PT Ficomindo Buana Registar), according to the provisions of applicable laws and regulations as well as the Articles of Association. We regularly conduct information disclosure to update our stakeholders with reports and press releases published on the company’s website, the websites of IDX and Bapepam, and in national media.
The Rights and Obligations of the Core Shareholders
The Rights and Obligations of Stakeholders and Other Shareholders
Adaro Energy Annual Report 2011 www.adaro.com156
To build a winning team for a bigger and better Adaro, we continue to enhance the quality of our human resources in a sustainable manner. Our focus lies on creating competent human resources through relevant training programs and develop proper career paths for each employee along with the company’s rapid growth.
To enable us in creating a maximum sustainable value from Indonesian coal, in 2009, we established a unit to manage the group’s corporate social responsibility (CSR) programs and community development named “Adaro Bangun Negeri”. This unit makes significant contribution to the key aspects of economic development, enhancement on the quality of education, health enhancement and socio-cultural development. With regards to our community development programs, in 2011 we successfully achieved several prestigious awards from domestic as well as international institution.
Written statements regarding GCG implementation
Internalization of GCG Practices
Written statements with regards to GCG implementation and relevant reports are included as part of the company’s annual report. On areas without full implementation of GCG principles, the company must disclose the discrepancies and the reasons of such discrepancies. The written statements shall consist of the structure and work mechanism of the BOC and BOD, as well as other information relevant to GCG implementation.
Being a public company, we have implemented the principles of GCG in our business operations compliant with Bapepam-LK’s regulations and involves all elements of the company, led directly by the management and applied by each department and employee according to the existing corporate values.
In performing their roles under the determined mechanism, the BOC and BOD are assisted by Audit Committee and Disclosure Committee. In addition, the company also carries out risk management function as well as remuneration and nomination function to support the Boards. The committees and functions hold strong commitment to continuously develop and enhance the principles of GCG to support the company in ensuring sustainable growth.
To enable systematic and sustainable implementation of GCG, practical guidelines to serve as reference need to be put in place. Adaro implements GCG principles by referring to general regulations of Bapepam-LK, IDX and Law No. 40 of 2007 on Limited Corporation.
In addition, the management, together with an independent team formulated Adaro’s corporate values as outlined in the company’s book, “The Family,” which supports the effective implementation of GCG principles.
Our success in implementation of GCG principles in our business operations have gained various recognitions from a number of independent institutions and received several awards and recognitions from domestic as well as international institutions in 2011.
Management Report | Status of Corporate Governance Practices4

Adaro Energy Annual Report 2011www.adaro.com 157
Corporate Governance Structure
1. General Meeting of Shareholders (GMS)According to the Articles of Association, GMS is a company organ which facilitates the shareholders in decision making and facilitates the Management in obtaining strategic approvals from the Shareholders. GMS also provides Shareholders with the opportunity to obtain information on company’s performance from the management.
In 2011, Adaro conducted both AGMS and EGMS on 20th April 2011 with the following details:
Annual General Meeting of Shareholders:Agenda 1:The AGMS approved the company’s annual report for the fiscal year ending December 31st, 2010 and ratified the company’s Balance Sheet and Profit & Loss for the fiscal year ending December 31st, 2010 which was audited by Public Accountant, Tanudiredja, Wibisana dan Rekan (a member firm of PricewaterhouseCoopers), as stipulated in the Independent Auditor Report dated March 15th, 2011, No.A110315009/DC2/YAN/I/2011 with unqualified opinion and explanation paragraphs.
Upon approval of the Management Report, as well as the ratification of the company’s Balance Sheet and Profit and Loss for the fiscal year ending December 31st, 2010, acquit et de charge was granted to the Board of Directors and the Board of Commissioners over their management and supervision of the company during 2010.
Agenda 2:The use of company’s Net Profit for the fiscal year 2010 of Rp2,207,312,362,331 with the following appropriations was agreed:A total of Rp110,365,618,117 to be set aside for general reserve fund stipulated in article 70 of Company Law No. 40 Year 2007.a) A total of Rp970,773,946,700 or 43.98% of
the company’s Net Profit in 2010 to be paid as cash dividend, in which the company would incorporate the interim dividend of Rp315.061.725.700 distributed on December 10th 2010, while the remaining of Rp655.712.221.000 would be appropriated as final dividend payment. The Board of Director is authorized with substitution rights:• to determine the list of shareholders for
dividend payment eligibility;• to determine the dividend payment
method;• to carry out all necessary actions related
to such issue including setting the dividend payment schedule. The dividend payment schedule will be published in 2
(two) nationally circulated publications taking into account prevailing laws and regulations.
b A total of Rp1,126,172,797,514 will be appropriated for Retained Earnings.
Agenda 3:The AGMS authorized the company’s Board of Commissioners to appoint a Public Accountant registered with Bapepam-LK to audit the company’s financial statements for the current on-going fiscal year and the fiscal year ending December 31st, 2011 and also authorized the Board of Commissioners to determine the honorarium of such Public Accountant Firm as well as other requirements.
Agenda 4:The AGMS has authorized the Board of Commissioners to determine the composition of salaries and other allowances for the members of the Boards of Directors and Commissioners excluding incentives in the form of MSOP (Management Stock Option Plan).
Extraordinary General Meeting of ShareholdersSole AgendaThe EGMS respectfully terminated all members of the Board of Directors from the closure of the Meeting and given Acquit et de Charge over the management during their term of appointment.
The EGMS approved the appointment of the company’s Board of Directors, with the effective term of office commencing from the closure of the General Meeting of Shareholders until the end of the company’s General Meeting of Shareholders for 2016 fiscal year to be held at the latest on April 19th, 2016.
Therefore, the company’s Board of Directors consists of:President Director : GARIBALDI THOHIRVice President Director : CHRISTIAN ARIANO
RACHMATDirector : ANDRE J. MAMUAYADirector : SANDIAGA S. UNODirector : DAVID TENDIANDirector : CHIA AH HOODirector : M. SYAH INDRA AMAN
2. Board of Commissioners and Board of DirectorsMembers of the BOC and the BOD are appointed during the GMS. The BOC and BOD each has clear authority and responsibilities based on their respective functions, as mandated by the Articles of Association. Both of the Boards are responsible to operate the company to be sustainable in the
Corporate Governance Structure

Adaro Energy Annual Report 2011 www.adaro.com158
long term. Accordingly, the Boards must have the same perception regarding the company’s vision, mission and values.
Board of CommissionersThe BOC is a company organ that is responsible for overseeing the company’s business in accordance with GCG principles, regulatory provisions, and the Articles of Association. BOC members are appointed and terminated by the GMS.
Duties and Responsibilities of the BOCThe BOC is responsible for overseeing the company’s management, i.e. the BOD, and for carrying out other duties as mandated by the GMS or applicable laws and regulations. In performing its duties, BOC oversees and advises BOD and examines certain actions as requested by BOD in accordance with the applicable regulatory provisions as well as the GMS in the manner approved by the shareholders.
All BOC members must undertake their duties by acting in good faith, prudently and responsibly, and in compliance with the Article of Association, laws and regulatory provisions, and by prioritizing the company’s best interest over other interests. Members of BOC must also monitor the effectiveness of GCG practices implemented by the company and make necessary adjustments accordingly.
BOC Membership 1. Qualifications of competency
a. Each BOC member shall demonstrate good behavior, relevant experience and expertise in undertaking their duties and fulfilling other criteria in accordance with the prevailing regulatory provisions and the Article of Association;
b. Selection criteria for BOC members are determined by the Meeting of BOC.
2. Requirement of Independencea. BOC members must not hold double
positions that may create conflicts of interests within the company either directly or indirectly, except with the approval of GMS.
b. BOC members must disclose all existing and potential conflicts of interest or any matter that may prevent them from acting in an independent manner;
c. Disclosure on the abovementioned conflicts of interests must be conducted periodically in the company’s annual report and in the declaration of conflicts of interest in a predetermined format;
d. Any party shall not prevent the members of BOC from performing their duties in an independent manner.
Each BOC member holds their position for a term of office according to the decision of GMS and may be re-elected.
Meetings of the Board of CommissionersThroughout 2011, the BOC of Adaro Energy Tbk held four meetings to review quarterly performance as presented by the BOD.
Name Attendance(4 Meetings)
Edwin Soeryadjaya 4
Theodore Permadi Rachmat 4
Ir Subianto 4
Lim Soon Huat 4
Raden Pardede 4
Ir Palgunadi Tatit Setyawan 3
Board Of Directors
The BOD is an executive body of the company responsible for managing daily operations for the best interest of the company according to the goals, objectives, and business activities. In carrying out its duties, BOD is overseen and receives inputs and suggestions from BOC, and for certain policies, BOD needs to obtain the approval of BOC and/or GMS.
All members of BOD must undertake their duties by acting in good faith, prudently and responsibly, and in compliance with the Article of Association, laws and regulatory provisions, and by prioritizing the company’s best interest over other interests.
BOD Membership1. Legal requirement Within five years prior to the appointment, BOD
members must never:a. Be declared bankrupt;b. Be a member of BOD or BOC declared as
being re sponsible for the bankruptcy of any company;
c. Be punished for criminal act that incurs losses for the state and/or company and/or any financial losses.
2. Competency requirementa. Each member of BOD shall demonstrate
good behavior, relevant experience and expertise in undertaking their duties and fulfill other criteria in accordance with the prevailing regulatory provisions and the Article of As sociation;
b. Each member of BOD shall be appointed based on the consideration of expertise, integrity, leadership, experience, honesty,
Management Report | Status of Corporate Governance Practices4

Adaro Energy Annual Report 2011www.adaro.com 159
Joint Meetings of BOC and BOD
BOC and BOD hold joint meetings to facilitate the submission of BOD’s reports to BOC concerning the operational and financial matters as well as other particular matters and to accommodate strategic decision making that requires BOC’s approvals.
Throughout 2011, the joint meetings of the BOC and BOD of Adaro Energy Tbk were held every three months or combined with BOC Meetings, as follow:
Name Attendance (4 Meetings)
BOC
Edwin Soeryadjaya 4
Theodore Permadi Rachmat 4
Ir Subianto 4
Lim Soon Huat 4
Raden Pardede 4
Ir Palgunadi Tatit Setyawan 3
BOD
Garibaldi Thohir 4
Christian Ariano Rachmat 4
Sandiaga S. Uno 4
Andre J. Mamuaya 2
A.H. Chia 3
M. S. Indra Aman 4
David Tendian 4
Alastair B. Grant 1
Nomination of Members of the BoardsCandidacy for membership on either of the Boards (BOC and BOD) is based on proposals and nominations from shareholders who own at least 10% of the total shares outstanding with valid voting rights. Proposals and nominations must be received by the existing BOD at least seven days before the date of any GMS.
3. Remuneration of the BoardsOur company’s policy requires that remuneration is based on merits, which ensures objective performance assessment based on achievement. The remuneration / compensation for BOD and BOC must be approved by the GMS.
The BOC and BOD of Adaro Energy received remuneration with a total amount of US$4,701,000 for the year ended December 31st, 2011 and a total amount of US$2,314,000 for the year ended December 31st, 2010.
good behavior, and high dedication to enhancing and developing the company.
3. Requirement of Independencea. BOD members must not hold double
positions that may inflict conflicts of interests within the company either directly or indirectly, or violate the applicable regulatory provisions.
b. BOD members must disclose all existing and potential conflicts of interest or any matter that may prevent them from acting in an independent manner;
c. Disclosure on the abovementioned conflicts of interests must be conducted periodically in the company’s annual report and in the declaration of conflicts of interest in a predetermined format;
Any party shall not prevent the members of BOD from performing their duties in an independent manner.
Meetings of the Board of DirectorsBOD Meetings are conducted periodically as well as when required. Based on the Article of Association, a director may request for BOD Meetings to discuss particular matters. BOD Meetings discuss operational and financial performance, project progress, as well as other matters that need special attention or decision making by BOD.
Throughout 2011, the BOD of Adaro Energy Tbk held seven meetings to review quarterly performance as presented by the BOD, as follow:
Name Attendance(7 Meetings)
Garibaldi Thohir 7
Christian Ariano Rachmat 7
Sandiaga S. Uno 5
Andre J. Mamuaya 7
A.H. Chia 7
M. S. Indra Aman 7
David Tendian 6
Alastair B. Grant* 1
* Prior to the change of management as decided by the EGMS held on April 20th, 2011
BOD’s term of office is held for a period of five years. BOD’s membership can also be terminated in the case of:1) Resignation;2) Non-compliance with the applicable regulatory
provisions;3) Death;4) Being terminated by the decision of GMS.
Board of Directors
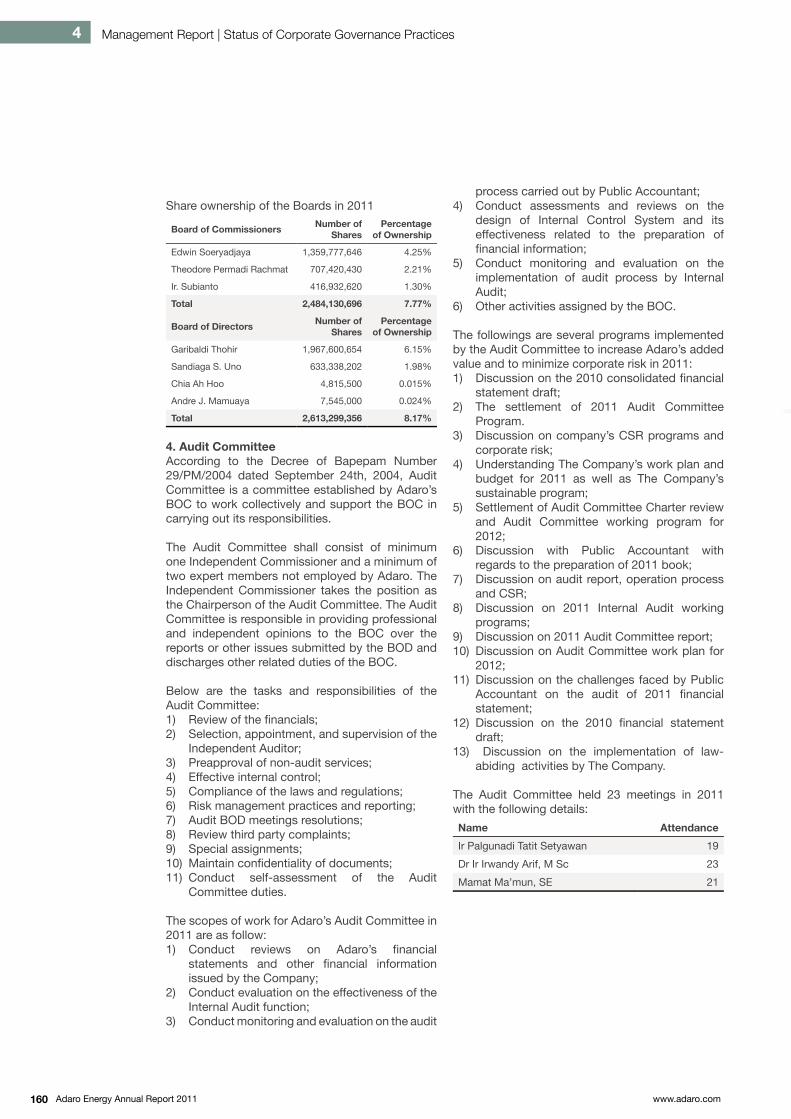
Adaro Energy Annual Report 2011 www.adaro.com160
Share ownership of the Boards in 2011
Board of Commissioners Number of Shares
Percentage of Ownership
Edwin Soeryadjaya 1,359,777,646 4.25%
Theodore Permadi Rachmat 707,420,430 2.21%
Ir. Subianto 416,932,620 1.30%
Total 2,484,130,696 7.77%
Board of Directors Number of Shares
Percentage of Ownership
Garibaldi Thohir 1,967,600,654 6.15%
Sandiaga S. Uno 633,338,202 1.98%
Chia Ah Hoo 4,815,500 0.015%
Andre J. Mamuaya 7,545,000 0.024%
Total 2,613,299,356 8.17%
4. Audit CommitteeAccording to the Decree of Bapepam Number 29/PM/2004 dated September 24th, 2004, Audit Committee is a committee established by Adaro’s BOC to work collectively and support the BOC in carrying out its responsibilities.
The Audit Committee shall consist of minimum one Independent Commissioner and a minimum of two expert members not employed by Adaro. The Independent Commissioner takes the position as the Chairperson of the Audit Committee. The Audit Committee is responsible in providing professional and independent opinions to the BOC over the reports or other issues submitted by the BOD and discharges other related duties of the BOC.
Below are the tasks and responsibilities of the Audit Committee:1) Review of the fi nancials;2) Selection, appointment, and supervision of the
Independent Auditor;3) Preapproval of non-audit services;4) Effective internal control;5) Compliance of the laws and regulations;6) Risk management practices and reporting;7) Audit BOD meetings resolutions;8) Review third party complaints;9) Special assignments;10) Maintain confi dentiality of documents;11) Conduct self-assessment of the Audit
Committee duties.
The scopes of work for Adaro’s Audit Committee in 2011 are as follow:1) Conduct reviews on Adaro’s fi nancial
statements and other fi nancial information issued by the Company;
2) Conduct evaluation on the effectiveness of the Internal Audit function;
3) Conduct monitoring and evaluation on the audit
process carried out by Public Accountant;4) Conduct assessments and reviews on the
design of Internal Control System and its effectiveness related to the preparation of fi nancial information;
5) Conduct monitoring and evaluation on the implementation of audit process by Internal Audit;
6) Other activities assigned by the BOC.
The followings are several programs implemented by the Audit Committee to increase Adaro’s added value and to minimize corporate risk in 2011:1) Discussion on the 2010 consolidated fi nancial
statement draft;2) The settlement of 2011 Audit Committee
Program.3) Discussion on company’s CSR programs and
corporate risk;4) Understanding The Company’s work plan and
budget for 2011 as well as The Company’s sustainable program;
5) Settlement of Audit Committee Charter review and Audit Committee working program for 2012;
6) Discussion with Public Accountant with regards to the preparation of 2011 book;
7) Discussion on audit report, operation process and CSR;
8) Discussion on 2011 Internal Audit working programs;
9) Discussion on 2011 Audit Committee report;10) Discussion on Audit Committee work plan for
2012;11) Discussion on the challenges faced by Public
Accountant on the audit of 2011 fi nancial statement;
12) Discussion on the 2010 fi nancial statement draft;
13) Discussion on the implementation of law-abiding activities by The Company.
The Audit Committee held 23 meetings in 2011 with the following details:
Name Attendance
Ir Palgunadi Tatit Setyawan 19
Dr Ir Irwandy Arif, M Sc 23
Mamat Ma’mun, SE 21
Management Report | Status of Corporate Governance Practices4

Adaro Energy Annual Report 2011www.adaro.com 161
Profi le of the Audit Committee – Excluding Member of the Board of Commissioner
Dr. Ir. Irwandy Arif, MSc – MemberGraduated from Ecole des Mines de Nancy, France with his doctoral degree and from Institut Teknologi Bandung with his mining and industrial degree. A well-known expert in the Indonesian mining industry with experience in providing advisory services to highly regarded Indonesian mining companies such as PT Berau Coal, PT Freeport Indonesia, and PT Tambang Batubara Bukit Asam. He was also the Head of Audit Committee for state mining company PT Aneka Tambang Tbk. He has published scientifi c journals and students handbooks on mining, geology, and geotechnical.
Mamat Ma’mun, SE – MemberGraduated from Universitas Padjadjaran Bandung with a degree in Economics. He has over thirty years working experience in the Astra group and was a trustee to the Astra Group Pension Fund. His experience as an audit committee member began in 2001. Currently, he is Commissioner in PT Duta Oto Prima, PT Daya Anugrah Mandiri, and PT Dharma Group.
5. Disclosure CommitteeThe Disclosure Committee is responsible in conducting information disclosure to the regulator and the public by referring to the provisions of Bapepam-LK applicable to all public companies. Such information disclosure relates to signifi cant and strategic corporate actions deemed infl uential on shareholder’s decision making.
Adaro’s Disclosure Committee consists of the President Director, Vice President Director, Corporate Affairs Director, Finance Director, Legal Director, GM - Corporate Secretary, GM - Investor Relation, GM - Corporate Finance, and legal and marketing units.
The Disclosure Committee holds a monthly meeting to discuss upcoming corporate actions and examine the impact of such actions on shareholder’s decisions in case of insignifi cant amount.
The information disclosure conducted by Adaro in 2011 includes:a. Monthly report on exploration activities to be
submitted by the 12th of the month following the reporting period.
b. Reports on Quarterly Operations activities to be submitted within one month following the reporting period.
c. Reports on Foreign Currency Denominated Bonds submitted as of 31 December 2010, 31 May 2011 and 30 September 2011.
d. Annual Report of 2010.e. Consolidated Financial Statement for the
period ended on 31 December 2011 (audited), 31 March 2011 (unaudited), 30 June 2011 (limited review) and 30 September 2011 (unaudited).
f. AGMS for the fi scal year of 2011 and EGMS held on 20 April 2011.
g. Final Dividend for the fi scal year of 2010 granted in April 2011 and interim Dividend for the fi scal year of 2011 granted in December 2011
h. Information disclosure submitted to Bapepam and public shareholders:- Change in BOD and share ownership.- Change of Corporate Secretary.- Loan Agreement with SIS totaling US$400
million.- Signing of the Agreement on overburden
crushing and conveyor facility.- Estimated coal deposits and reserves.- Press Release: Launching of BDF Pilot
Project in Indonesia between Adaro, Komatsu and United Tractor
- Adaro Energy as a member of JPower-Adaro-Itochu consortium received Letter of Intent for coal-fi red Independent Power Producer (“IPP”) with the capacity of 2 x 1,000 MW.
- The acquisition of 85% ownership on PT Indonesia Multi Purpose Terminal (IMPT).
- Facility Agreement for Adaro Indonesia totaling USD 750 million.
- The acquisition of 75% ownership on PT Mustika Indah Permai (MIP).
- Signing of long-term Power Purchase Agreement for the 2 x 1,000 MW IPP in Indonesia.
- The acquisition of 35% ownership on PT Servo Meda Sejahtera (SMS).
- The acquisition of 46% ownership on PT Bukit Enim Energi (BEE).
- Announcement of Currency Conversion Rate for Interim Dividend of 2011.
From left to right: Dr. Irwandy Arif, MSc., Ir. Palgunadi Setyawan, Mamat Ma’mun, SE.

Adaro Energy Annual Report 2011 www.adaro.com162
i. Responses to regulator (Bapepam) queries:- Information disclosure regarding SIS
US$400 million facility.- Explanation regarding media coverage
on the Rp 6.1 billion refi nancing and acquisition plan.
- Explanation regarding media coverage on MIP acquisition.
- Annual report revision.j. Response to IDX’s queries regarding media
coverage on MIP.k. Public expose in Investor Summit and Capital
Market Expo
6. Remuneration and Nomination CommitteeUp to the end of 2011, we had not completed the constitution of Remuneration and Nomination Committee. However, the function of this Committee had been fulfi lled by Adaro, particularly on managerial level.
The function of Remuneration and Nomination Committee is to carry out the company strategies on human resources development which include: 1. Learning and career path.2. Recruitment.3. Performance appraisal.4. Remuneration / Reward.5. Motivation.6. Succession plans.7. Talent management.Adaro has put in place a performance review system called Performance Development System (“PDS”). PDS is a form of performance review based on the concept of Management by Love which focuses on employee development
7. Internal ControlInternal AuditAdaro Energy’s Internal Audit Unit is responsible to provide professional and independent opinions to BOD on the company’s activities or operations. In performing its functions, Internal Audit carries the objective to identify the effectiveness of the
mechanism formulated and implemented by the management, so that:a. Risk is identifi ed and properly managed;b. The governance system with regards to the
relationship with related parties is in place and managed properly;
c. Ensuring accuracy, reliability and timeliness of Adaro Energy’s signifi cant operational, managerial, and fi nancial information;
d. Employees demonstrate the behavior that complies with the applicable policies, standards, procedures, laws, and regulations;
e. Resources are obtained economically, utilized effi ciently, and protected suffi ciently;
f. Programs, plans and objectives are achieved; g. Quality control programs are implemented and
sustainable improvement is endeavored under company’s supervision;
h. The laws and regulations signifi cant to the company are identifi ed and acted upon properly.
Risk ManagementMining is a risky, highly regulated, capital intensive and slow yielding industry. The objective of our risk management initiative is to assist the BOD in managing risks that may have an adverse impact on our business as we continue to create maximum sustainable value from Indonesian coal.
Risk management is carried out through mapping out the potential risks inherent in operational and non-operational activities and formulation of the most effective risk mitigation model.
The functions of risk management within Adaro Energy and its subsidiaries are carried out by all departments and subsidiaries in both operational and non-operational activities.
The operational activities herein include strict work safety programs to signifi cantly prevent the risk of accidents, employing a number of contractors to prevent work disturbances caused by having a single operator, and strict sales procedure that prevents sales contracts from incurring signifi cant risk against Adaro.
Meanwhile, the non-operational activities include procurement activities that prevent risk of delays and fraudulent acts. Provisions regarding gratifi cation have also been formulated to set out the matters related to gifts and gratuity acceptance.
8. Corporate SecretaryPursuant to Law No. 8 Year 1995 concerning Capital Market, the Chairman of Bapepam has issued Decree No. Kep-63/PM/1996 on the Appointment of Corporate Secretary. According to The Decree, Corporate Secretary has the following responsibilities:
Management Report | Status of Corporate Governance Practices4
Hendry Chandra Internal Audit GM
Hendry has over 15 years experience working in fi nance and accounting. He joined Adaro in 1999 from a major public accounting fi rm and left in 2002 as Manager of Finance & Accounting before re-joining Adaro in 2009. He has a Bachelor Degree in Accounting from Trisakti University.

Adaro Energy Annual Report 2011www.adaro.com 163
- Keep up with the development in Capital Market, particularly the development of Capital Market regulations.
- Provide information for the public and investors regarding the condition of issuers.
- Provide inputs to BOD regarding the compliance with Law No. 8/1995.
- Act as a mediator between the issuer and Bapepam as well as the public.
As a publicly listed entity, Adaro Energy has appointed a Corporate Secretary directly responsible to the Board of Directors. The roles and responsibilities of the Corporate Secretary are to ensure smooth and regular communications between the company and the capital market authority, stock exchange authority and the public.
In addition, the Corporate Secretary is also responsible for ensuring the company’s compliance to prevailing rules and regulations, conducting General Meetings of Shareholders (GMS), and conducting Public Exposes.In 2011, our Corporate Secretary undertook several major activities as follow:
Year Public Accountant Remarks
2009Tanudiredja, Wibisana & Rekan
Unqualifi ed opinion with explanatory paragraph
2010Tanudiredja, Wibisana & Rekan
Unqualifi ed opinion with explanatory paragraph
2011Tanudiredja, Wibisana & Rekan
Unqualifi ed opinion with explanatory paragraph
Members of Corporate Secretary Department. From left to right: Armand Alex Siwu, Aditya Sudjono, Karina Novianti, and Devindra Ratzarwin
• Carried out the AGMS on April 20, 2011 with shareholder ratifi cation of 2010 fi nancial report as one of the agenda.
• Carried out the EGMS on April 20, 2011 with a single agenda to release and discharge the Board of Directors and appoint new Board of Directors.
• Media Workshop on May 2011, with journalists from several media partners.
• Other routine activities with regards to the company’s responsibility of submitting reports and information disclosure to regulators and IDX.
9.Public Accounting Firm (External Auditor)
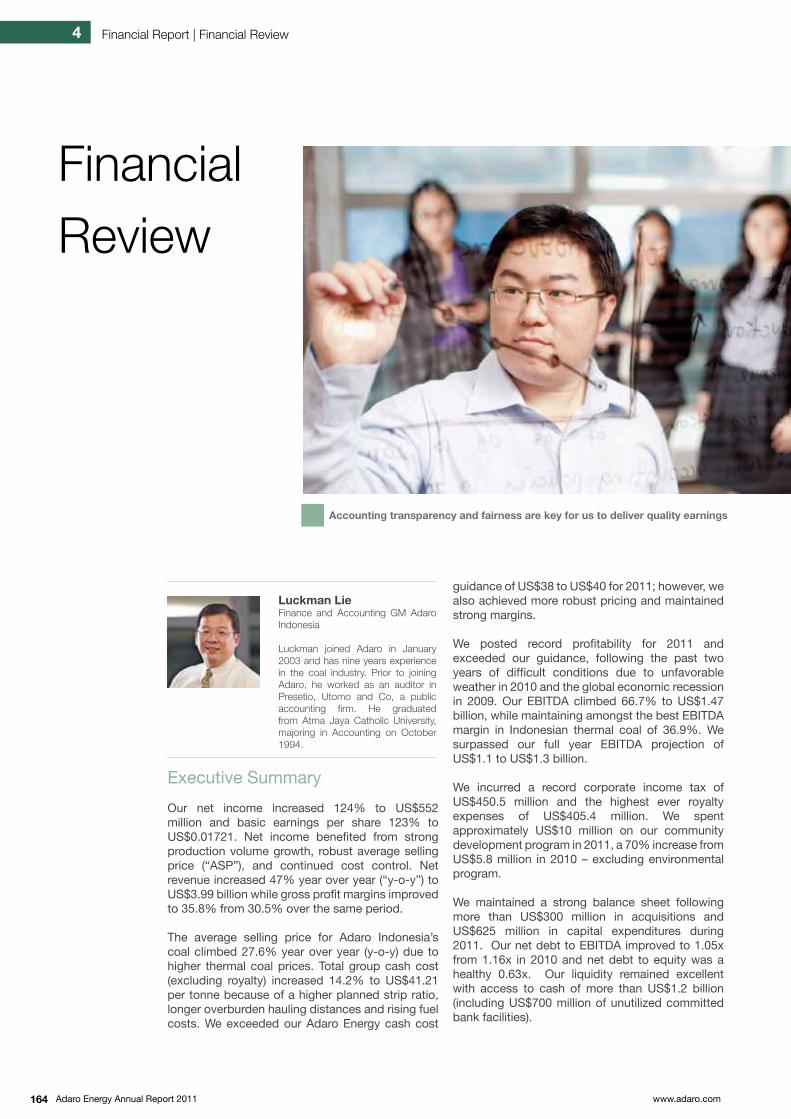
Adaro Energy Annual Report 2011 www.adaro.com164
Financial Report | Financial Review4
FinancialReview
Executive Summary
Our net income increased 124% to US$552 million and basic earnings per share 123% to US$0.01721. Net income benefited from strong production volume growth, robust average selling price (“ASP”), and continued cost control. Net revenue increased 47% year over year (“y-o-y”) to US$3.99 billion while gross profit margins improved to 35.8% from 30.5% over the same period.
The average selling price for Adaro Indonesia’s coal climbed 27.6% year over year (y-o-y) due to higher thermal coal prices. Total group cash cost (excluding royalty) increased 14.2% to US$41.21 per tonne because of a higher planned strip ratio, longer overburden hauling distances and rising fuel costs. We exceeded our Adaro Energy cash cost
Accounting transparency and fairness are key for us to deliver quality earnings
guidance of US$38 to US$40 for 2011; however, we also achieved more robust pricing and maintained strong margins.
We posted record profitability for 2011 and exceeded our guidance, following the past two years of difficult conditions due to unfavorable weather in 2010 and the global economic recession in 2009. Our EBITDA climbed 66.7% to US$1.47 billion, while maintaining amongst the best EBITDA margin in Indonesian thermal coal of 36.9%. We surpassed our full year EBITDA projection of US$1.1 to US$1.3 billion.
We incurred a record corporate income tax of US$450.5 million and the highest ever royalty expenses of US$405.4 million. We spent approximately US$10 million on our community development program in 2011, a 70% increase from US$5.8 million in 2010 – excluding environmental program.
We maintained a strong balance sheet following more than US$300 million in acquisitions and US$625 million in capital expenditures during 2011. Our net debt to EBITDA improved to 1.05x from 1.16x in 2010 and net debt to equity was a healthy 0.63x. Our liquidity remained excellent with access to cash of more than US$1.2 billion (including US$700 million of unutilized committed bank facilities).
Luckman LieFinance and Accounting GM Adaro Indonesia
Luckman joined Adaro in January 2003 and has nine years experience in the coal industry. Prior to joining Adaro, he worked as an auditor in Presetio, Utomo and Co, a public accounting firm. He graduated from Atma Jaya Catholic University, majoring in Accounting on October 1994.
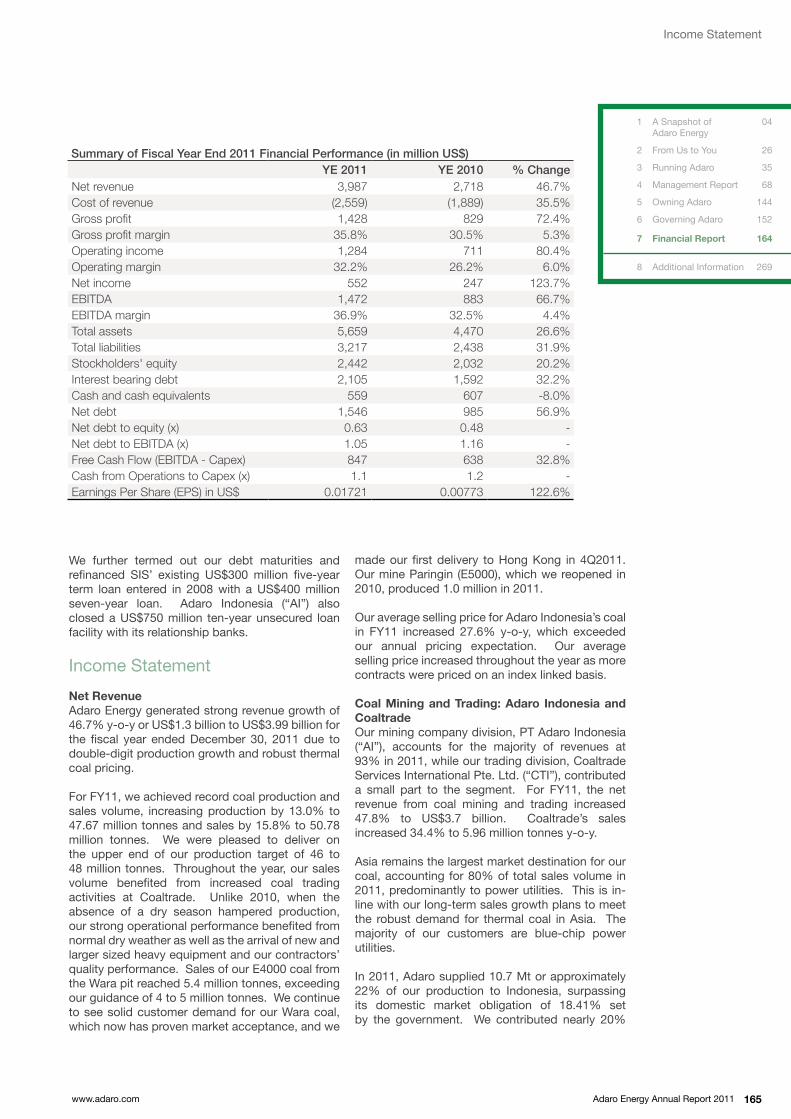
Adaro Energy Annual Report 2011www.adaro.com 165
We further termed out our debt maturities and refinanced SIS’ existing US$300 million five-year term loan entered in 2008 with a US$400 million seven-year loan. Adaro Indonesia (“AI”) also closed a US$750 million ten-year unsecured loan facility with its relationship banks.
Income Statement
Net RevenueAdaro Energy generated strong revenue growth of 46.7% y-o-y or US$1.3 billion to US$3.99 billion for the fiscal year ended December 30, 2011 due to double-digit production growth and robust thermal coal pricing.
For FY11, we achieved record coal production and sales volume, increasing production by 13.0% to 47.67 million tonnes and sales by 15.8% to 50.78 million tonnes. We were pleased to deliver on the upper end of our production target of 46 to 48 million tonnes. Throughout the year, our sales volume benefited from increased coal trading activities at Coaltrade. Unlike 2010, when the absence of a dry season hampered production, our strong operational performance benefited from normal dry weather as well as the arrival of new and larger sized heavy equipment and our contractors’ quality performance. Sales of our E4000 coal from the Wara pit reached 5.4 million tonnes, exceeding our guidance of 4 to 5 million tonnes. We continue to see solid customer demand for our Wara coal, which now has proven market acceptance, and we
Summary of Fiscal Year End 2011 Financial Performance (in million US$)YE 2011 YE 2010 % Change
Net revenue 3,987 2,718 46.7%Cost of revenue (2,559) (1,889) 35.5%Gross profit 1,428 829 72.4%Gross profit margin 35.8% 30.5% 5.3%Operating income 1,284 711 80.4%Operating margin 32.2% 26.2% 6.0%Net income 552 247 123.7%EBITDA 1,472 883 66.7%EBITDA margin 36.9% 32.5% 4.4%Total assets 5,659 4,470 26.6%Total liabilities 3,217 2,438 31.9%Stockholders' equity 2,442 2,032 20.2%Interest bearing debt 2,105 1,592 32.2%Cash and cash equivalents 559 607 -8.0%Net debt 1,546 985 56.9%Net debt to equity (x) 0.63 0.48 -Net debt to EBITDA (x) 1.05 1.16 -Free Cash Flow (EBITDA - Capex) 847 638 32.8%Cash from Operations to Capex (x) 1.1 1.2 -Earnings Per Share (EPS) in US$ 0.01721 0.00773 122.6%
made our first delivery to Hong Kong in 4Q2011. Our mine Paringin (E5000), which we reopened in 2010, produced 1.0 million in 2011.
Our average selling price for Adaro Indonesia’s coal in FY11 increased 27.6% y-o-y, which exceeded our annual pricing expectation. Our average selling price increased throughout the year as more contracts were priced on an index linked basis.
Coal Mining and Trading: Adaro Indonesia and CoaltradeOur mining company division, PT Adaro Indonesia (“AI”), accounts for the majority of revenues at 93% in 2011, while our trading division, Coaltrade Services International Pte. Ltd. (“CTI”), contributed a small part to the segment. For FY11, the net revenue from coal mining and trading increased 47.8% to US$3.7 billion. Coaltrade’s sales increased 34.4% to 5.96 million tonnes y-o-y.
Asia remains the largest market destination for our coal, accounting for 80% of total sales volume in 2011, predominantly to power utilities. This is in-line with our long-term sales growth plans to meet the robust demand for thermal coal in Asia. The majority of our customers are blue-chip power utilities.
In 2011, Adaro supplied 10.7 Mt or approximately 22% of our production to Indonesia, surpassing its domestic market obligation of 18.41% set by the government. We contributed nearly 20%
A Snapshot of Adaro Energy
From Us to You
Running Adaro
Management Report
Owning Adaro
Governing Adaro
Financial Report
Additional Information
1
2
3
4
5
6
7
8
04
26
35
68
144
152
164
269
Income Statement

Adaro Energy Annual Report 2011 www.adaro.com166
of a new third party service provider in early 2011 and reduced vessel loading times at Taboneo anchorage. Total coal loaded for FY11 increased 8% y-o-y to 13.6 million tonnes, but quarter over quarter coal loaded was boosted 65% as two floating cranes returned from maintenance.
Our coal port operator, IBT, loaded 65 vessels and 4.39 million tonnes of coal for FY11, a decrease of 32% and 30% y-o-y. However, third party coal loaded increased 26% to 2.29 million tonnes. The reason vessels loaded and total tonnage decreased, while third party coal handled increased, is because Adaro Indonesia shifted more of its transshipment activities to the closer Taboneo anchorage. As well increased handling of third party coal, IBT continued its strategic support for Adaro Indonesia as the second largest export loading port.
Cost of Revenue and Cash CostCost of revenue for FY11 grew 35.5% y-o-y, or US$670.1 million, to US$2.6 billion, a moderate increase compared to our revenue growth of 46.7%. Total group cash cost (excluding royalty) per tonne increased 14.2% y-o-y to US$41.21. We guided our 2011 cash cost at US$38 to US$40 per tonne; however, we exceeded our expectations
4
of Indonesia’s and 16% of the domestic power industry’s total coal needs. For the last ten years, Adaro has been the largest supplier to the domestic market.
Mining Services: SISPT Saptaindra Sejati (“SIS”), our mining services division, posted a FY11 net revenue increase of 36.1% y-o-y to US$192.2 million because of greater overburden removal and coal getting volumes. The arrival of new and larger heavy equipment helped achieve the robust growth. In FY11, overburden removal increased 31% to 167.52 million bank cubic meters and coal getting increased 37% to 22.65 million tonnes. SIS continued to prioritize AI, accounting for 57% of SIS’ total overburden removal or 95.94 Mbcm and 66% of total coal getting or 14.97 Mt. SIS is the second largest contributor to our overall revenue, accounting for 5% of net revenue after eliminating sales to AI.
In 2011, SIS successfully introduced new and larger excavators and trucks at its Adaro Indonesia operations to deal with a shortage of skilled operators and mechanics. Larger equipment means less manpower for the same level of production.
Other (Adaro Logistics): Coal terminal, Barging, Ship Loading and Dredging Our other business segments include AE’s subsidiaries PT Alam Tri Abadi (“ATA”), water toll contractor PT Sarana Daya Mandiri (“SDM”), coal port operator PT Indonesia Bulk Terminal (“IBT”), and the barging and ship loading division PT Maritim Barito Perkasa (“MBP”). Total revenue from other business segments, net eliminations, translates to net revenue of US$89.4 million, an increase of 29.2% over the same period last year.
MBP increased total coal barged 36% y-o-y to 15.82 million tonnes due to the commencement
31.7
42.4
31.3 31.1 29.027.6
21.1
8.5
Adaro Energy
PeabodyBHP thermal
coal only
Anglothermal
coal only
Bumi XStratathermal
coal only
ITM PTBA Peabody
3735 35
33 3228 27
26
Adaro Energy
BHP thermal
coal only
Anglothermal
coal only
Bumi XStratathermal
coal only
ITM PTBA
2011 EBITDA* Margin (%)2011 EBITDA per tonne* (US$)
Ernest Kee Corporate Finance Senior VP,Director Adaro Power
Ernest joined Adaro in 2011 after spending more than 16 years working at major international banks in the financing of various energy and infrastructure projects in South East Asia. He holds a MBA and an Engineering Degree from the National University of Singapore.
Rel
ated
Info
rmat
ion
Review of Coal Operations
88
Our Subsidiaries 100
Source: Company Filings, Research ReportsFY2011e, Except for Anglo, BHP and Xstrata as of 30 June 2011* Calculated as EBITDA/sales tonnage, for BHP, EBITDA / production volume
Source: Company Filings, Research ReportsFY2011e, Except for Anglo, BHP and Xstrata as of 30 June 2011* Calculated as EBITDA calculated on Op. profit + Depreciation + Amorization
Financial Report | Financial Review

Adaro Energy Annual Report 2011www.adaro.com 167
mainly due to longer overburden hauling distances and higher fuel costs.
Update on Our Cash Cost CalculationIn our 9M11 financial press release, we announced a change in our cash cost calculation. Our previous cash cost per tonne represented Adaro Energy’s total group cash cost; however, starting in 2012 we plan to only use Adaro Energy’s coal cash cost. As we continue to execute on creating a vertically integrated business model, a larger percentage of our costs are attributed to business units other than coal mining. Our aim is to build a better understanding of and reflect the cost associated with our coal mining division, our largest source of revenue. The FY11 Adaro Energy coal cash cost (ex-royalty) per tonne was US$35.76, an increase of 12.1% y-o-y.
Coal Mining and Trading Costs: Adaro Indonesia and CoaltradeTotal cost of revenue for Coal Mining and Trading increased 35% y-o-y or US$594 million to US$2.3 billion.
Coal mining costs increased 27.0% y-o-y, or US$222.8 million, to US$1.0 billion due to higher planned stripping ratios, larger volumes, longer overburden hauling distances and rising fuel prices. The robust pricing conditions allowed us to economically mine at higher strip ratios, which measures the volume of overburden per tonne of coal. Including the lower strip ratio of Wara, the weighted average planned strip ratio was 5.9x compared to 5.5x in 2010.
The average fuel price per liter in FY11 was US$0.86 per liter compared to US$0.64 per liter in 2010, increasing 34.4% y-o-y. We manage and procure the fuel for all of our mining contractors. To mitigate risks associated with oil price fluctuations,
Coal cash cost and strip ratio (US$/tonne, bcm/tonne) Cash cost (US$/tonne) - FOB vessel
Peabody Adaro Energy
BHP Billiton
AngloBumiXStrata ITM PTBA
80
60
40
20
02008A 2009A 2010A 2011A 2012F
4.5
27 2731
3640 - 45
5.0 5.95.5 6.4
Coal cash costStrip ratio
Source: Wood MackenzieNote: Cash cost includes mining cost, coal processing cost, freight and handling cost and marketing and G&A expenses
we enter a portion of our fuel needs into hedging agreements. We locked in 80% of our second-half 2011 fuel requirements at US$0.86 per liter and 80% of first quarter 2012 fuel requirements at US$0.84 per liter. We will seek to hedge a portion of our fuel needs for the remainder of 2012; however, we forecast our fuel costs to rise in 2012. Coal mining accounted for 41.0% of our total cost of revenue.
Coal processing costs in FY11 increased 29.5% to US$146.5 million over the same period last year. Coal processing costs consist of the cost to crush the coal at the Kelanis river terminal and other costs not borne by mining contractors, including the cost for repair and maintenance of the hauling road. Coal processing accounted for 5.7% of our total cost of revenue. Coal purchases in 2011 increased to US$275.3 million from US$85.6 million in 2010.
Royalties to GovernmentOur royalties paid to the Government of Indonesia increased 53.5% y-o-y to US$405.4 million, in-line with higher revenue. In accordance with the agreements specified in the Coal Cooperation Agreement (CCA), royalties are calculated using a rate of 13.5% levied against the net sales price at Adaro’s Kelanis River Terminal. Royalties accounted for 15.8% of our total cost of revenue.
Freight and HandlingOur freight and handling cost declined 8.3% y-o-y to US$283.9 million as vessel waiting times reduced and demurrage occurred to a lesser extent than last year due to more favorable weather conditions. Additionally, we signed three long-term coal barging contracts, as announced in November 2010, which lowered freight rates for those volumes by 15%. Despatch (the opposite of demurrage) occurred in March, April, May, June, September, October, November and December 2011. Freight

Adaro Energy Annual Report 2011 www.adaro.com168
and handling accounted for 11.1% of our total cost of revenue compared to 16.4% in 2010.
Mining Services: SISOur mining services’ cost is associated with our mining contractor, SIS. The cost of revenue from this segment increased 39.4% y-o-y to US$168.9 million due to the increase in SIS’ third party coal getting and overburden removal activities and the associated higher consumables, employee costs, and repair and maintenance. SIS’ consumables increased 44.7% to US$41.6 million and repair and maintenance increased 71% to US$42.1 million. Mining services accounted for 6.6% of our total cost of revenue.
Others (Adaro Logistics): Coal terminal, Barging, Ship Loading and Dredging The costs associated with our other subsidiaries, which are substantially all attributed to logistics, increased 49.0% to US$85.3 million. The cost related to our other subsidiaries accounted for 3.3% of our total cost of revenue.
Operating Expenses and Operating IncomeOperating expenses increased 23.5% y-o-y to US$144.8 million primarily due to higher sales commissions and employee costs. Sales commissions grew 21.3% to US$63.2 million because of the direct relationship with higher revenues. Employee costs increased 43.0% to US$40.1 million due to more employee benefi ts and as we enlarged our permanent workforce 19.8% to 7,476 employees to support growth. Operating income increased 80.4% to US$1.28 billion. Operating margins strengthened to 32.2% from 26.2% FY2010, as we were able to grow revenues while controlling costs.
Other ExpenseOther expenses increased to US$151.5 million from US$14.9 million in 2010 as Adaro made payment on a customer claim. As we disclosed in our 1H11 fi nancial press release, in 2008 Adaro declared force majeure and suspended deliveries to three customers in response to the Ministry of Energy and Mineral Resources (“MoEMR”) request that Indonesian coal producers renegotiate existing term coal supply contracts to match then current market prices. Those Indonesian coal producers were instructed by MoEMR to suspend shipments if they failed to comply with the request. All disputes have been resolved with the US$152.8 million net payment (after tax US$85 million). It was paid in August and recorded as Other Expense on the Income Statement.
EBITDAOur EBITDA climbed 66.7% to a record US$1.47 billion from US$883.4 million in 2010, while maintaining amongst the best EBITDA margin in Indonesian thermal coal of 36.9%. We were able to maintain our robust EBITDA margin despite an increase in production to 5.4 Mt from 2.5 Mt of our lower rank E4000 coal. We surpassed our full year EBITDA projection of US$1.1 to US$1.3 billion.
Income Tax Expense Due to higher profi ts, Indonesia’s 2011 income tax expense increased US$172 million, or 61%, to $451 million. Adaro Energy’s management expects that Indonesia will collect a record level of tax and non-tax revenue from Adaro Energy in 2011, and this does not include those payments from our contractors.
Net IncomeOur fi scal year 2011 net income increased 123.7% to US$552.1 million. The rise in net income was driven by higher production volumes combined with a robust average selling price, in addition
4
Ariya Somanatta President Offi ce, Director IBTDirector MIP
Ariya holds a Master Degree in Accounting majoring in Taxation from the University of Indonesia. He joined Adaro in 2009, and has over 23 years experience as Tax Consultant and Accountant. He is a member of Institute of Public Accountants Australia and Associate of Taxation Institute of Australia.
Members of Finance, Accounting and Tax Department
Financial Report | Financial Review

Adaro Energy Annual Report 2011www.adaro.com 169
to no goodwill amortization, as compared to the US$53.5 million charge for amortization incurred during the same period of last year. We adopted the Statement of Financial Accounting Standards (PSAK) No 22 (Revised 2010), in line with the changes in the accounting of goodwill amortization, which uses the impairment method of calculating any necessary charges.
Balance Sheet
Total AssetsFY11 total assets increased US$1.19 billion or 26.6% y-o-y to US$5.7 billion. The growth is mainly due to additional investments made in fixed assets, larger value attributed to our mining properties, and increased trade receivables.
Cash and Cash EquivalentsAt the end of FY11, cash and cash equivalents, which represented 9.9% of our total assets, decreased 8.0% to US$558.9 million compared to FY10, as we used cash to fund working capital, capital expenditures, and acquisitions. Of our year end cash balance, US$495 million was held in US dollar in high quality banking institutions such as OCBC, Sumitomo Mitsui, DBS, and Mandiri. The majority of our remaining cash balance was held in Rupiah. We did not hold any marketable securities in our cash reserve.
Trade ReceivablesTrade Receivables for FY11 increased 71.1% y-o-y to US$471.3 million. The nearly US$200 million rise was due to increase in coal sold, in-line with higher production and sales for 2011. However, substantially all customers are within 30 days due and management believes all will be collected in full.
Fixed AssetsFY11 Fixed Assets increased 48.0% y-o-y to US$1.4 billion in 2011 from US$967.8 million in 2010 and included US$276.2 million for heavy equipment purchases, US$92.8 million for crushing and handling facilities, US$204.9 million for construction in progress, largely our 2x30 MW power plant and OPCC, and US$31.0 million for leased assets.
Advances and PrepaymentsAdvances and Prepayments for FY11 were US$162.8 million, an increase of 36.9% year over year. The growth was primarily due to advances to suppliers for heavy equipment purchases and steam turbine generators for our 2x30 MW mine-mouth power plant.
Investments in AssociatesInvestments in associates increased 10.8% to US$395.8 million. October 10th 2011, we purchased a 35% interest in an integrated coal logistics services provider in South Sumatra, PT Servo Meda Sejahtera (“SMS”), for Rp 200 billion or approximately US$22 million.
Investment in Equity SecuritiesInvestment in equity securities for FY11 was US$65.7 million. This reflects an investment of 10.22% in the Indonesian company PT Bhakti Energi Persada (“BEP”), which is developing a sub-bituminous coal deposit in Indonesia.
Deferred Stripping CostsAdaro Indonesia’s planned stripping ratio was 5.9x in 2011, blended between the Tutupan, Wara, and Paringin pits.
The current price environment supports the increase of overburden removal. As we focus on the next phase of growth, we are preparing our operations to continue to run efficiently, reliably and safely as we further increase production to meet our customers’ needs and achieve our medium term target of 80 million tonnes. This includes moving significant volumes of overburden.
In 2011, Adaro Indonesia increased overburden removal by 32% to 299.3 million bank cubic meter (“Mbcm”). Adaro aims to have our planned stripping ratio meet our actual stripping ratio; however, we accumulated a deferred stripping cost of US$47.9 million in 2011, as our actual strip ratio was higher than our planned. Adaro may retain a deferred stripping cost as we focus on above average overburden removal at the Tutupan pit and coal prices remain favorable. We will seek to eliminate our deferred stripping cost once our investment in overburden removal is complete.
Total LiabilitiesOur total liabilities increased 31.9% or US$778.8 million to US$3.2 billion y-o-y, primarily because of greater loan amounts. Current liabilities increased 20.9% to US$779.2 million, while the non-current liabilities increased 35.9% to US$2.4 billion.
Taxes PayableTaxes payable increased to US$69.6 million in FY11 from US$15.1 million in FY10, attributed to higher income for 2011.
Current Maturities of Long-Term BorrowingsCurrent maturities of long-term borrowings for FY11 reduced 27.6% to US$138.2 million. The decrease is due to refinancing and a longer maturity of our debt profile.
Balance Sheet

Adaro Energy Annual Report 2011 www.adaro.com170
4
Long-Term BorrowingsLong-term borrowings increased 40.3% y-o-y to US$1.97 billion for FY2011. We drew down US$420 million from our $500 million amortizing revolving credit facility, US$300 million from SIS’ syndicated bank loan and $150 million from AI’s unsecured loan facility in order to help fund acquisitions and for general corporate purposes.
On February 18th, 2011, SIS refinanced its existing US$300 million five-years term loan entered in 2008 with a US$400 million seven-year loan. The loan consists of US$300 million term loan and US$100 million step down revolving facility and is secured by Adaro’s mining contract with SIS. This long-term source of funding is guaranteed by Adaro Energy and will be used for capital expenditure needs and refinancing all SIS’s existing loans. The transaction was supported by 12 banks.
On July 4, 2011, AI closed a US$750 million ten-year unsecured loan facility with its relationship banks. The loan consists of US$350 million term loan and US$400 million step down revolving facility. This long-term source of funding is guaranteed by Adaro Energy and will be used for capital expenditure needs, working capital and other general corporate purposes. The transaction was supported by 5 banks.
At year-end 2011, we had access to US$700 million of undrawn facilities, which consisted of US$100 million of SIS’s 7-year US$400 million facility and US$600 million of AI’s US$750 million 10-year unsecured loan facility.
Cash Flows
Cash Flows from Operating ActivitiesOur operating cash flow for FY11 increased 142.9%, or US$419.0, y-o-y to US$712.4 million, due to higher receipts from customers. During the period, receipts from customers increased to US$3.8 billion compared with US$2.8 billion in 2010 due to higher sales volume and higher average selling price. Payments for corporate income taxes decreased to US$329.9 million compared with US$553.7 million in FY10 due to the 42% decrease of the FY10 net income, which resulted in a lower corporate income tax payment, which was paid at the beginning of 2011.
Cash Flows from Investing ActivitiesOur cash flows used in investing activities during 2011 increased 62.2% to US$1.1 billion. During the
Thomas FasengaFinance and Accounting Manager
Thomas is a member of the Dayak community and has been working in Adaro since 1991. Prior to this, he worked with PT Kelian Equatorial Mining and PT Jaya Sumpiles Indonesia. He has a degree in Management from Mulawarman University and has over 24 years experience in Finance & Accounting.
year, we spent US$625.0 million on fixed assets. Capital expenditures for 2011 included spending on machinery, operational equipment and vehicles, crushing and handling facilities and construction in progress.
We made more than US$300 million in acquisitions in 2011 as part of strategy to increase reserves and diversify our location, license maturities, and product offerings. These acquisitions include a 75% stake in MIP for US$222.5 (post-tax US$234.2) million, a 35% interest in SMS for Rp 200 billion (approximately US$22 million), and a 61.04% ownership in BEE for about US$67 million. Also included in cash from investing is a 10.22% interest in BEP for US$65.7 million as a purchase of equity securities. The realization of our 2011 acquisitions further strengthens our efforts to create long term and maximum value from Indonesian coal.
Cash Flows from Financing ActivitiesNet cash flow from financing activities for 2011 increased to US$304.3 million from negative US$225.7 million in 2010. We withdrew US$420 million from AI’s US$500 million amortizing revolving credit facility, US$300 million from SIS’ US$400 million syndicated bank loan and $150 million from AI’s US$750 million unsecured loan facility in order to help fund acquisitions and for general corporate purposes.
We made bank loan repayments of US$326.4 million associated with the refinancing of SIS’ loan as well as AI and Coaltrade’s loan installments. We also paid out US$44.7 million in finance charges, relating to new financing arranged by the group, which included AI’s US$750 million 10-year unsecured loan facility and SIS’ US$400 million 7-year syndicated bank loan. We pay annual cash dividends that amounted to US$150.9 million in 2011.
Financial Report | Financial Review

Adaro Energy Annual Report 2011www.adaro.com 171
A DiscussionMr. David Tendian,Director &Chief Financial Offi cer
with
What were the greatest accomplishments in 2011?
From the perspective of the fi nance department, it was probably the US$750 million 10-year bank loan that we closed on July 4th, on the back of the challenges caused by the Euro crisis.
I was also very pleased with our investments in South Sumatra. They are part of the drive to diversify and increase our reserves so as to create sustainable value from Indonesian coal. By diversifying locations, coal products and license maturities, we reduce risk, improve reliability and improve sustainability. We shall grow our business organically but also through acquisitions. Our aim is to create long term value from Indonesian coal, by building a bigger and better Adaro Energy.
What are your greatest challenges?
For me, the challenge is how to manage strong growth while also maintaining a strong balance sheet. Last year we grew and made acquisitions to spur future growth, yet we also improved the balance sheet with net debt to EBITDA improving to 1.05 times.
What is one of your key success factors for Adaro Energy?
It is important to me that we all share a common objective. I think this is what makes Adaro special, that despite having multiple owners and personalities, we all share the drive to build a solid
company. It is important and satisfying to me that we continue to build a winning team with shared values and goals.
With a strong team, we will build a strong company, meaning a company with a strong capital structure and a transparent company. And with a strong team we also build strong value for shareholders.
In building teams, it is important to have people focused on doing what they do best. There can be no offi ce politics and team members must have a common goal. No offi ce politics means no blame game, we learn from our mistakes and we help each other.
How do you maintain good decisions and how to avoid politics?
The Board members openly disagree, without taking anything personally. We trust each other, respect each other’s opinions and always maintain open communication. At the end, if necessary, our CEO/Deputy CEO can override and make the fi nal call. But in general, it is about open respectful, well-informed debate and about everyone having a passion for Adaro. We as the Board must be the example for all the other winning teams in the organization. We must set the right tone and create the right culture so that our insistence on no politics is visible and therefor better adhered to. The most valuable thing is a conducive culture. With a good culture, you cultivate productive happy teams and from that comes increased shareholder value.
We do not believe in superman or superwoman. We believe in super teams.

Adaro Energy Annual Report 2011 www.adaro.com172 Adaro Energy Annual Report 2011 www.Adaro.com172
Awards Two Platinum Category in Indonesian Corporate Social Responsibility Awards 2011
For free cataract eradication and clean water programs. Presented by Minister of Social Affairs of Republic of Indonesia.
Indonesian Corporate Social Responsibility Award 2008
First rank for Social and second rank for Environment and third rank for Economic. Presented by Minister of Social Affairs of Republic of Indonesia.
PROPER Green Award for the year 2006, 2008,2010 and 2011
Adaro Indonesia received the green level PROPER award for environmental rehabilitation excellence. The only Indonesian mining company to receive this award for fourth consecutive year. Presented by Minster of Environment of Republic of Indonesia.
GKPM Awards in 2011
For Ensure Environmental Sustainability (Gold), Reduce Child Mortality (Gold) and Improve Maternal Health (Silver). Presented by Coordinating Minister for People’s Welfare of Republic of Indonesia.
Platts Top 250 Global Energy Awards in 2011
No 9 in Coal and Consumables Energy in Asia and No 12 in Coal and Consumable Energy Globally.
Primaniyarta Award in 2010 and 2011
Best performing exporters from the Ministry of Trade. Presented by Indonesia’s Vice President Boediono. Adaro received similar award in 2007.
Aditama Gold Award in 2010 and 2011
For environmental excellence in the coal sector. Presented by Director General of Mineral Coal and Geothermal (ESDM).
Social Empowerment Award in 2007
Presented by Coordinating Minister for People’s Welfare of the Republic of Indonesia.
One of the largest Taxpayers in 2008 and 2009
Presented by the Tax Offi ce.
Annual Report Awards 2010
No 1 worldwide for Overall Annual Report in Mining: Ferrous & Nonferrous from MerComm Annual Report Competition (ARC Awards).No 3 worldwide for Overall Annual Report and the most engaging from League of American
Communications Professionals LLC (LACP).

Adaro Energy Annual Report 2011www.adaro.com 173
Contact Information
Stock ExchangeThe common stock of PT Adaro Energy Tbk (trading symbol ADRO) is listed on the Indonesia Stock Exchange (IDX)
Public AccountantTanudiredja, Wibisana & Rekan(a member of PricewaterhouseCoopers global network)Jl. H.R. Rasuna Said Kav. X-7 No.6Jakarta 12940IndonesiaTel: (021) 521 2901Fax: (021) 529 0555
Share RegistrarPT Ficomindo Buana RegistrarMayapada Tower 10th Floor, Suite 2bJl. Jenderal Sudirman Kav. 28Jakarta 12920IndonesiaTel: (021) 521 2316/17Fax: ( 021) 521 2320
Annual General Meeting of ShareholdersAGMS to be held on Friday, 27 April 2012 at The Ritz-Carlton Jakarta, Mega Kuningan. Jl. Lingkar Mega Kuningan Kav. E.1.1 No. 1, Mega Kuningan, Jakarta 12950, Indonesia
For further information please contact:Devindra Ratzarwin, Corporate SecretaryCameron Tough, Head of Investor RelationsTel.: (021) 521 1265Fax: (021) 5794 4685Email: [email protected]@ptadaro.com
We want to begin an ongoing dialogue with you. For more information or to join our email distribution list, please contact us or visit our website at www.adaro.com
Investor Calendar 201231 January 2012 - 4Q11 Quarterly Activities Report27 March 2011 - FY11 Financial Press Release27 March 2011 - FY11 Audited Financial Statements30 April 2012 - 1Q12 Quarterly Activities Report30 April 2012 - 1Q12 Financial Press Release30 April 2012 - 1Q12 Unaudited Financial Statements and Notes31 July 2012 - 2Q12 Quarterly Acticites Report31 August 2012 - 1H12 Limited Review Financial Statements and Notes31 August 2012 - 1H12 Financial Press Release31 October 2012 - 3Q12 Quarterly Activities Report31 October 2012 - 9M12 Financial Press Release31 October 2012 - 9M12 Unaudited Financial Statements & Notes
Quarterly conference calls will be held after the release of fi nancial statements and notes, normally within a week.
The company will regularly participate in international investments conferences and conducts at least two international roadshows per year to the major global fi nancial centers.
Disclaimer: This report contains certain statements that may be considered “forward looking statements”, the Company’s actual results, performance or achievements could differ materially from those projected in the forward looking statements as a results, among other factors, of changes in general, national or regional economic and political conditions, changes in foreign exchange rates, changes in the prices and supply and demand on the commodity markets, changes in the size and nature of the Company’s competition, changes in legislation or regulations and accounting principles, policies and guidelines and changes in the assumptions used in making such forward looking statements.

CONSOLIDATED STATEMENTS OF FINANCIAL POSITIONDECEMBER 31, 2011 AND 2010
PT ADARO ENERGY TbkAND SUBSIDIARIES
Financial Report7
Adaro Energy Annual Report 2011 www.adaro.com174

Adaro Energy Annual Report 2011www.adaro.com 175

Adaro Energy Annual Report 2011 www.adaro.com176

Adaro Energy Annual Report 2011www.adaro.com 177

Adaro Energy Annual Report 2011 www.adaro.com178
(Expressed in thousand US Dollars, except for par value and share data)
The accompanying notes form an integral part of these consolidated financial statements
Cash and cash equivalents 2e, 6 558,872 607,271 1,199,427 Restricted cash and time deposits current portion 2e, 7 140 282 Trade receivables, net of provision for impairment of US$nil (2010: US$nil)
Third parties 2f, 8 471,116 275,426 306,645 Related party 2f, 8, 35 226
Advances and prepayments current portion 9 40,301 41,612 20,910 Inventories, net of provision for obsolete stock of US$nil (2010: US$nil) 2g, 10 52,420 32,045 26,593 Prepaid taxes 2u, 34a 25,574 71,463 32,423 Recoverable taxes current portion 2u, 34b 80,410 78,412 69,503 Other receivables third parties 13,528 3,110 2,251 Loans to third parties 23 36,542 Loan to a related party 35 15,508 Derivative assets 2w 666 Other current assets 2,222 155 2,422 Total current assets 1,297,525 1,109,776 1,660,174 Restricted cash and time deposits noncurrent portion 2e, 7 801 1,012 1,009 Deferred exploration and development expenditure, net of accumulated amortisation of US$29,435 (2010: US$28,759) 2o, 11 10,322 7,942 8,618 Recoverable taxes noncurrent portion 2u, 34b 16,540 Advances and prepayments noncurrent portion 9 122,491 77,330 28,600 Fixed assets, net of accumulated depreciation of US$487,430 (2010: US$355,124) 2k, 2m,12 1,432,299 967,797 786,312 Investments in associates 2h, 13 395,783 357,347 508 Investment in equity securities 2i,14 65,708 Mining properties, net of accumulated amortisation of US$191,404 (2010: US$131,730) 2c, 15 1,244,650 1,005,270 1,059,158 Goodwill 2l, 16 1,005,506 930,743 975,852 Deferred stripping costs 2r, 24 47,911 Deferred tax assets 2u, 34e 5,544 4,789 3,997 Other noncurrent assets 13,881 8,113 5,944 Total noncurrent assets 4,361,436 3,360,343 2,869,998 5,658,961 4,470,119 4,530,172 * As restated (refer to Note 3)
(Expressed in thousand US Dollars, except for par value and share data)
The accompanying notes form an integral part of these consolidated financial statements
Trade payables
Third parties 2n, 17 370,941 256,255 215,460 Related parties 2n, 17, 35 17,401 12,139 15,190
Accrued expenses 2v, 18 39,192 82,080 32,145 Shortterm bank loan 20,000 Taxes payable 2u, 34c 69,591 15,110 239,581 Royalties payable 19 132,429 75,906 78,515 Current maturities of longterm borrowings: Finance lease payables 2p, 20 35,695 41,001 35,724 Bank loans 2i, 21 102,549 149,814 193,950 Derivative liabilities current portion 2w 4,097 10,100 13,528 Other liabilities 7,306 2,092 3,248 Total current liabilities 779,201 644,497 847,341 Longterm borrowings, net of current maturities:
Finance lease payables 2p, 20 39,551 47,760 50,612 Bank loans 2i, 21 1,139,480 567,522 590,233
Senior Notes 2i, 22 787,292 786,148 785,090 Derivative liabilities noncurrent portion 2w 1,385 6,131 4,309 Accrued stripping costs 2r, 24 34,304 38,934 Deferred tax liabilities 2u, 34f 435,694 325,780 316,431 Amounts due to a related party 35 500 500 500 Provision for employee benefits 2t 20,915 15,814 9,619 Provision for mine reclamation 2q 5,706 5,155 2,956 Provision for mine closure 2q 7,014 4,297 1,991 Total noncurrent liabilities 2,437,537 1,793,411 1,800,675 * As restated (refer to Note 3)
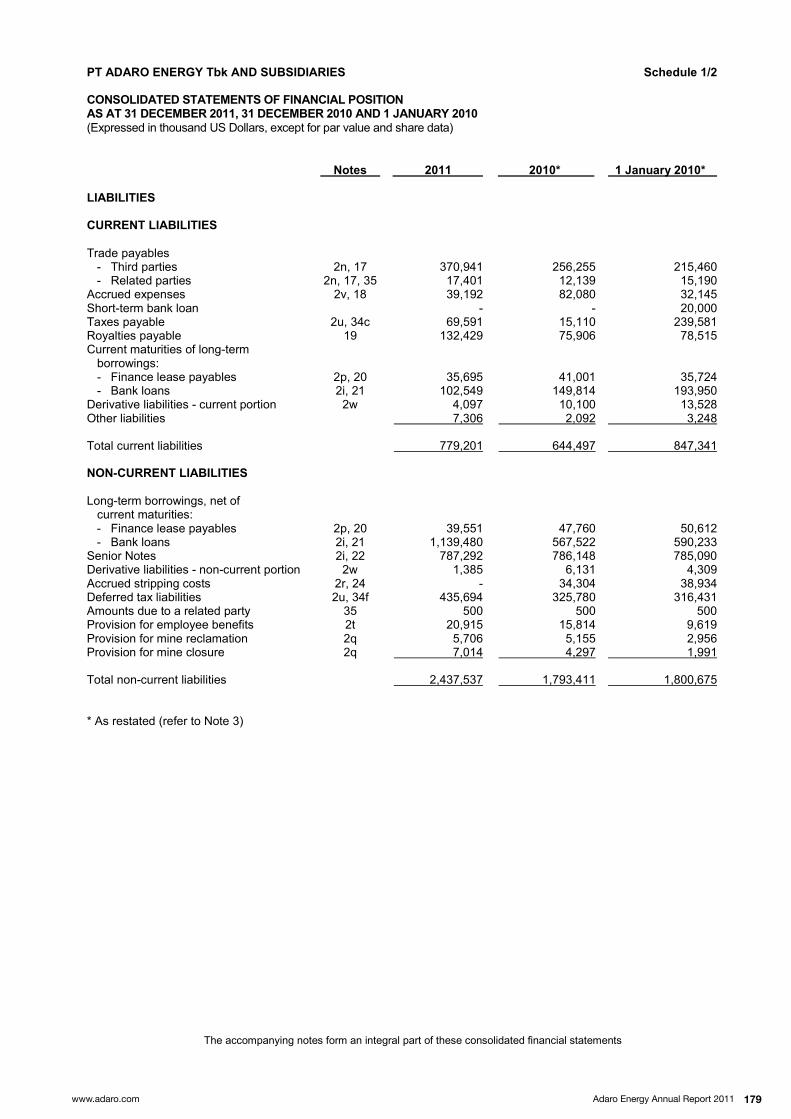
Adaro Energy Annual Report 2011www.adaro.com 179
(Expressed in thousand US Dollars, except for par value and share data)
The accompanying notes form an integral part of these consolidated financial statements
Cash and cash equivalents 2e, 6 558,872 607,271 1,199,427 Restricted cash and time deposits current portion 2e, 7 140 282 Trade receivables, net of provision for impairment of US$nil (2010: US$nil)
Third parties 2f, 8 471,116 275,426 306,645 Related party 2f, 8, 35 226
Advances and prepayments current portion 9 40,301 41,612 20,910 Inventories, net of provision for obsolete stock of US$nil (2010: US$nil) 2g, 10 52,420 32,045 26,593 Prepaid taxes 2u, 34a 25,574 71,463 32,423 Recoverable taxes current portion 2u, 34b 80,410 78,412 69,503 Other receivables third parties 13,528 3,110 2,251 Loans to third parties 23 36,542 Loan to a related party 35 15,508 Derivative assets 2w 666 Other current assets 2,222 155 2,422 Total current assets 1,297,525 1,109,776 1,660,174 Restricted cash and time deposits noncurrent portion 2e, 7 801 1,012 1,009 Deferred exploration and development expenditure, net of accumulated amortisation of US$29,435 (2010: US$28,759) 2o, 11 10,322 7,942 8,618 Recoverable taxes noncurrent portion 2u, 34b 16,540 Advances and prepayments noncurrent portion 9 122,491 77,330 28,600 Fixed assets, net of accumulated depreciation of US$487,430 (2010: US$355,124) 2k, 2m,12 1,432,299 967,797 786,312 Investments in associates 2h, 13 395,783 357,347 508 Investment in equity securities 2i,14 65,708 Mining properties, net of accumulated amortisation of US$191,404 (2010: US$131,730) 2c, 15 1,244,650 1,005,270 1,059,158 Goodwill 2l, 16 1,005,506 930,743 975,852 Deferred stripping costs 2r, 24 47,911 Deferred tax assets 2u, 34e 5,544 4,789 3,997 Other noncurrent assets 13,881 8,113 5,944 Total noncurrent assets 4,361,436 3,360,343 2,869,998 5,658,961 4,470,119 4,530,172 * As restated (refer to Note 3)
(Expressed in thousand US Dollars, except for par value and share data)
The accompanying notes form an integral part of these consolidated financial statements
Trade payables
Third parties 2n, 17 370,941 256,255 215,460 Related parties 2n, 17, 35 17,401 12,139 15,190
Accrued expenses 2v, 18 39,192 82,080 32,145 Shortterm bank loan 20,000 Taxes payable 2u, 34c 69,591 15,110 239,581 Royalties payable 19 132,429 75,906 78,515 Current maturities of longterm borrowings: Finance lease payables 2p, 20 35,695 41,001 35,724 Bank loans 2i, 21 102,549 149,814 193,950 Derivative liabilities current portion 2w 4,097 10,100 13,528 Other liabilities 7,306 2,092 3,248 Total current liabilities 779,201 644,497 847,341 Longterm borrowings, net of current maturities:
Finance lease payables 2p, 20 39,551 47,760 50,612 Bank loans 2i, 21 1,139,480 567,522 590,233
Senior Notes 2i, 22 787,292 786,148 785,090 Derivative liabilities noncurrent portion 2w 1,385 6,131 4,309 Accrued stripping costs 2r, 24 34,304 38,934 Deferred tax liabilities 2u, 34f 435,694 325,780 316,431 Amounts due to a related party 35 500 500 500 Provision for employee benefits 2t 20,915 15,814 9,619 Provision for mine reclamation 2q 5,706 5,155 2,956 Provision for mine closure 2q 7,014 4,297 1,991 Total noncurrent liabilities 2,437,537 1,793,411 1,800,675 * As restated (refer to Note 3)

Adaro Energy Annual Report 2011 www.adaro.com180
(Expressed in thousand US Dollars, except for par value and share data)
The accompanying notes form an integral part of these consolidated financial statements
Share capital authorised 80,000,000,000 shares; issued and fully paidup 31,985,962,000 shares with par value of Rp 100 per share 2z, 26 342,940 342,940 342,940 Additional paidincapital 2z, 27 1,175,281 1,175,281 1,175,281 Difference in value from restructuring transactions of entities under common control 2aa, 28 (20,787) (20,787) (20,787) Other reserves:
Exchange difference due to financial statement translation 2d (966) (46) (25)
Difference from equity changes in subsidiaries and associates 444 444
Fair value reserve (2,597) (11,386) (11,877) Retained earnings
Appropriated 30 37,731 25,583 4,582 Unappropriated 904,269 516,974 386,488
2,435,871 2,029,003 1,877,046 Noncontrolling interests 2c, 25a 6,352 3,208 5,110 Total equity 2,442,223 2,032,211 1,882,156 5,658,961 4,470,119 4,530,172 * As restated (refer to Note 3)
(Expressed in thousand US Dollars, except for basic earnings per share)
The accompanying notes form an integral part of these consolidated financial statements
2v, 31 3,987,405 2,717,643 2v, 32 (2,559,012) (1,888,920) 1,428,393 828,723 Selling and marketing 2v, 33a (66,081) (54,777) General and administrative 2v, 33b (78,741) (62,451) Total operating expenses (144,822) (117,228) 1,283,571 711,495 Finance costs (119,758) (115,424) Finance income 6,718 4,665 Loss on disposal of fixed assets 2k, 12 (2,824) (5,600) Foreign exchange gain, net 2d 1,992 87 Share in net loss of associates 2h, 13 (15,555) (1,494) Amortisation of goodwill 2l, 16 (53,510) Other expenses, net 36 (151,533) (14,922) (280,960) (186,198) 1,002,611 525,297 Income tax expense 2u, 34d (450,508) (278,460) 552,103 246,837Preacquisition loss 19 552,103 246,856 Exchange difference due to financial statement translation (981) (12) Difference from equity changes in subsidiaries and associates (444) 34 Fair value reserve 8,822 491 7,397 513 559,500 247,369 Owners of the parent 550,354 247,162 Noncontrolling interests 25b 1,749 (306) 552,103 246,856 Owners of the parent 557,779 247,632 Noncontrolling interests 25a 1,721 (263) 559,500 247,369 2x, 37 0.01721 0.00773 * As restated (refer to Notes 2b and 3)

Adaro Energy Annual Report 2011www.adaro.com 181
(Expressed in thousand US Dollars, except for par value and share data)
The accompanying notes form an integral part of these consolidated financial statements
Share capital authorised 80,000,000,000 shares; issued and fully paidup 31,985,962,000 shares with par value of Rp 100 per share 2z, 26 342,940 342,940 342,940 Additional paidincapital 2z, 27 1,175,281 1,175,281 1,175,281 Difference in value from restructuring transactions of entities under common control 2aa, 28 (20,787) (20,787) (20,787) Other reserves:
Exchange difference due to financial statement translation 2d (966) (46) (25)
Difference from equity changes in subsidiaries and associates 444 444
Fair value reserve (2,597) (11,386) (11,877) Retained earnings
Appropriated 30 37,731 25,583 4,582 Unappropriated 904,269 516,974 386,488
2,435,871 2,029,003 1,877,046 Noncontrolling interests 2c, 25a 6,352 3,208 5,110 Total equity 2,442,223 2,032,211 1,882,156 5,658,961 4,470,119 4,530,172 * As restated (refer to Note 3)
(Expressed in thousand US Dollars, except for basic earnings per share)
The accompanying notes form an integral part of these consolidated financial statements
2v, 31 3,987,405 2,717,643 2v, 32 (2,559,012) (1,888,920) 1,428,393 828,723 Selling and marketing 2v, 33a (66,081) (54,777) General and administrative 2v, 33b (78,741) (62,451) Total operating expenses (144,822) (117,228) 1,283,571 711,495 Finance costs (119,758) (115,424) Finance income 6,718 4,665 Loss on disposal of fixed assets 2k, 12 (2,824) (5,600) Foreign exchange gain, net 2d 1,992 87 Share in net loss of associates 2h, 13 (15,555) (1,494) Amortisation of goodwill 2l, 16 (53,510) Other expenses, net 36 (151,533) (14,922) (280,960) (186,198) 1,002,611 525,297 Income tax expense 2u, 34d (450,508) (278,460) 552,103 246,837Preacquisition loss 19 552,103 246,856 Exchange difference due to financial statement translation (981) (12) Difference from equity changes in subsidiaries and associates (444) 34 Fair value reserve 8,822 491 7,397 513 559,500 247,369 Owners of the parent 550,354 247,162 Noncontrolling interests 25b 1,749 (306) 552,103 246,856 Owners of the parent 557,779 247,632 Noncontrolling interests 25a 1,721 (263) 559,500 247,369 2x, 37 0.01721 0.00773 * As restated (refer to Notes 2b and 3)
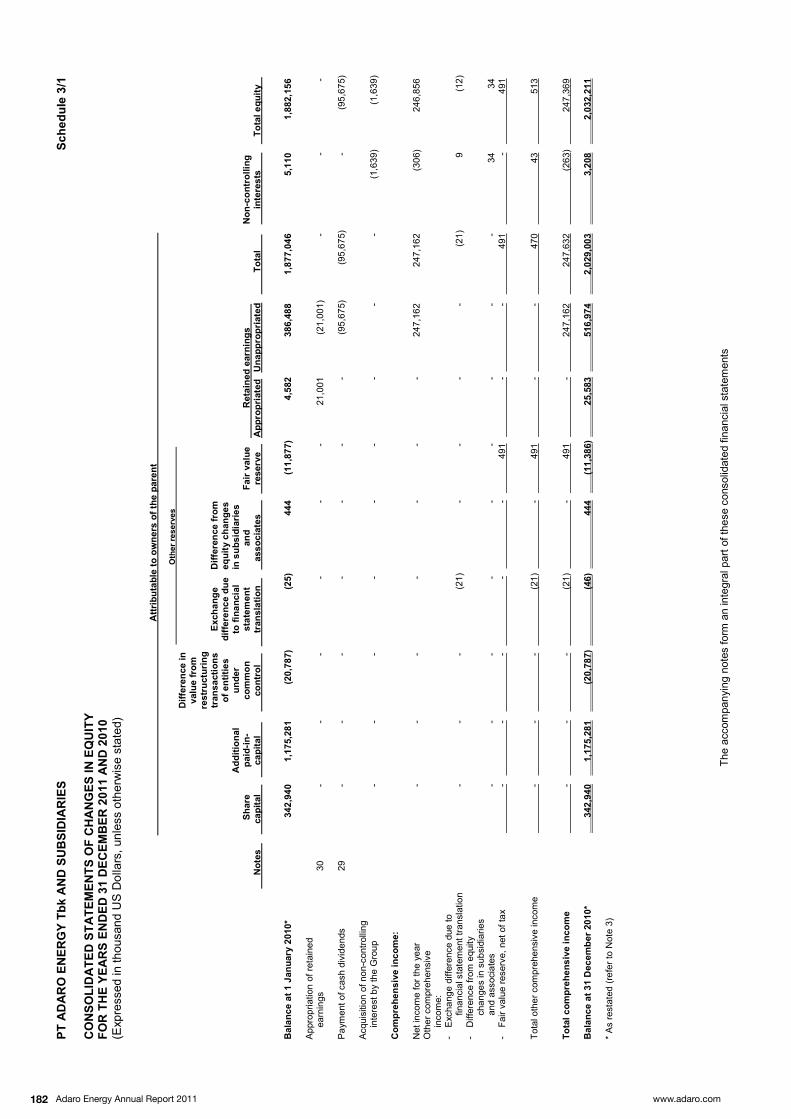
Adaro Energy Annual Report 2011 www.adaro.com182
(Exp
ress
ed in
thou
sand
US
Dol
lars
, unl
ess
othe
rwis
e st
ated
)
The
acco
mpa
nyin
g no
tes
form
an
inte
gral
par
t of t
hese
con
solid
ated
fina
ncia
l sta
tem
ents
App
ropr
iatio
n of
reta
ined
ea
rnin
gs
30
21
,001
(2
1,00
1)
P
aym
ent o
f cas
h di
vide
nds
29
(9
5,67
5)
(95,
675)
(9
5,67
5)
A
cqui
sitio
n of
non
con
trolli
ng
in
tere
st b
y th
e G
roup
(1
,639
)
(1,6
39)
Net
inco
me
for t
he y
ear
247,
162
24
7,16
2
(306
)
246,
856
Oth
er c
ompr
ehen
sive
in
com
e:
Exc
hang
e di
ffere
nce
due
to
finan
cial
sta
tem
ent t
rans
latio
n
(2
1)
(21)
9
(1
2)
D
iffer
ence
from
equ
ity
chan
ges
in s
ubsi
diar
ies
and
asso
ciat
es
34
34
Fair
valu
e re
serv
e, n
et o
f tax
49
1
491
49
1
To
tal o
ther
com
preh
ensi
ve in
com
e
(2
1)
491
47
0
43
51
3
(2
1)
491
24
7,16
2
247,
632
(2
63)
24
7,36
9
*
As
rest
ated
(ref
er to
Not
e 3)
(Exp
ress
ed in
thou
sand
US
Dol
lars
, unl
ess
othe
rwis
e st
ated
)
The
acco
mpa
nyin
g no
tes
form
an
inte
gral
par
t of t
hese
con
solid
ated
fina
ncia
l sta
tem
ents
App
ropr
iatio
n of
reta
ined
ear
ning
s
30
12,1
48
(12,
148)
Pay
men
t of c
ash
divi
dend
s
29
(150
,911
)
(150
,911
)
(150
,911
) N
onc
ontro
lling
inte
rest
s at
ac
quis
ition
82
3
823
A
dditi
on d
urin
g th
e ye
ar
600
60
0
Net
inco
me
for t
he y
ear
550,
354
55
0,35
4
1,74
9
552,
103
Oth
er c
ompr
ehen
sive
in
com
e:
E
xcha
nge
diffe
renc
e du
e to
finan
cial
sta
tem
ent t
rans
latio
n
(9
20)
(9
20)
(6
1)
(981
)
Diff
eren
ce fr
om e
quity
ch
ange
s in
sub
sidi
arie
s
and
asso
ciat
es
(444
)
(4
44)
(4
44)
Fa
ir va
lue
rese
rve,
net
of t
ax
8,78
9
8,78
9
33
8,
822
Tota
l oth
er c
ompr
ehen
sive
inco
me
(920
)
(444
) 8,
789
7,
425
(2
8)
7,39
7
(920
)
(444
) 8,
789
55
0,35
4
557,
779
1,
721
55
9,50
0

Adaro Energy Annual Report 2011www.adaro.com 183
(Exp
ress
ed in
thou
sand
US
Dol
lars
, unl
ess
othe
rwis
e st
ated
)
The
acco
mpa
nyin
g no
tes
form
an
inte
gral
par
t of t
hese
con
solid
ated
fina
ncia
l sta
tem
ents
App
ropr
iatio
n of
reta
ined
ea
rnin
gs
30
21
,001
(2
1,00
1)
P
aym
ent o
f cas
h di
vide
nds
29
(9
5,67
5)
(95,
675)
(9
5,67
5)
A
cqui
sitio
n of
non
con
trolli
ng
in
tere
st b
y th
e G
roup
(1
,639
)
(1,6
39)
Net
inco
me
for t
he y
ear
247,
162
24
7,16
2
(306
)
246,
856
Oth
er c
ompr
ehen
sive
in
com
e:
Exc
hang
e di
ffere
nce
due
to
finan
cial
sta
tem
ent t
rans
latio
n
(2
1)
(21)
9
(1
2)
D
iffer
ence
from
equ
ity
chan
ges
in s
ubsi
diar
ies
and
asso
ciat
es
34
34
Fair
valu
e re
serv
e, n
et o
f tax
49
1
491
49
1
To
tal o
ther
com
preh
ensi
ve in
com
e
(2
1)
491
47
0
43
51
3
(2
1)
491
24
7,16
2
247,
632
(2
63)
24
7,36
9
*
As
rest
ated
(ref
er to
Not
e 3)
(Exp
ress
ed in
thou
sand
US
Dol
lars
, unl
ess
othe
rwis
e st
ated
)
The
acco
mpa
nyin
g no
tes
form
an
inte
gral
par
t of t
hese
con
solid
ated
fina
ncia
l sta
tem
ents
App
ropr
iatio
n of
reta
ined
ear
ning
s
30
12,1
48
(12,
148)
Pay
men
t of c
ash
divi
dend
s
29
(150
,911
)
(150
,911
)
(150
,911
) N
onc
ontro
lling
inte
rest
s at
ac
quis
ition
82
3
823
A
dditi
on d
urin
g th
e ye
ar
600
60
0
Net
inco
me
for t
he y
ear
550,
354
55
0,35
4
1,74
9
552,
103
Oth
er c
ompr
ehen
sive
in
com
e:
E
xcha
nge
diffe
renc
e du
e to
finan
cial
sta
tem
ent t
rans
latio
n
(9
20)
(9
20)
(6
1)
(981
)
Diff
eren
ce fr
om e
quity
ch
ange
s in
sub
sidi
arie
s
and
asso
ciat
es
(444
)
(4
44)
(4
44)
Fa
ir va
lue
rese
rve,
net
of t
ax
8,78
9
8,78
9
33
8,
822
Tota
l oth
er c
ompr
ehen
sive
inco
me
(920
)
(444
) 8,
789
7,
425
(2
8)
7,39
7
(920
)
(444
) 8,
789
55
0,35
4
557,
779
1,
721
55
9,50
0

Adaro Energy Annual Report 2011 www.adaro.com184
(Expressed in thousand US Dollars, unless otherwise stated)
The accompanying notes form an integral part of these consolidated financial statements
Receipts from customers 3,791,489 2,750,177 Payments to suppliers (2,195,407) (1,539,242) Payments to employees (110,410) (81,710) Receipts of finance income 6,210 4,665 Payments of royalties (198,333) (164,674) Payments of income taxes (329,933) (553,669) Payments of interest and finance costs (106,013) (119,724) Receipt from settlement of restricted cash and time deposits 211 Other payments, net (145,447) (2,487) 712,367 293,336 Purchase of fixed assets (625,022) (244,659) Payment for addition of deferred exploration and development expenditure (540) Proceeds from disposal of fixed assets 5,699 3,800 Payment of advance for investments in equity securities (47,100) Purchase of interest in associates (25,887) (358,337) Purchase of equity securities (65,708) Loans to third parties (36,542) Loan to a related party (15,000) Net cash outflow from acquisition of subsidiaries (301,458) (35) Proceeds from sales of investments in associates 9 Purchase of additional interest in a subsidiary (10,000) (1,064,458) (656,322) Proceed of bank loans 870,000 40,000 Repayments of bank loans (326,410) (129,951) Payments of loan related costs (44,659) Receipts from issue of new shares in subsidiary from minority party 600 Transfer from/(to) restricted cash and time deposits 142 (279) Payments of dividends (150,911) (95,675) Payments of obligations under finance leases (44,498) (39,820) 304,264 (225,725) (47,827) (588,711) 607,271 1,199,427 (572) (3,445) 558,872 607,271 Acquisition of assets under finance leases 30,982 42,356 Addition of investments in associates through conversion of advance for investments 28,225 2,900 * As restated (refer to Note 3)
(Expressed in thousand US Dollars, unless otherwise stated)
PT Adaro Energy Tbk (the “Company”) was established by Notarial Deed No. 25 dated 28 July 2004 of Sukawaty Sumadi, S.H., Notary in Jakarta. The Deed was published in State Gazette of the Republic of Indonesia No. 59, dated 25 July 2006, State Gazette Supplementary No. 8036 and was approved by the Minister of Justice of the Republic of Indonesia in Decree No. C21493 HT.01.01.TH.2004 dated 26 August 2004. The latest amendment was made to the Articles of Association of the Company based on Notarial Deed No. 65 dated 31 October 2008 of Humberg Lie, S.H., S.E., M.Kn., to conform with the requirements of the Regulations of the Capital Market and Financial Institution Supervisory Board (“BapepamLK”) No. IX.J.1 dated 14 May 2008 for Principles of Articles of Association of Companies which Conduct Public Offering of Equity Securities and Public Companies. The amendment of the Articles of Association was accepted by the Minister of Law and Human Rights of the Republic of Indonesia in Decree No. AHUAH.01.1024501, dated 1 December 2008 and No. AHUAH.01.1024502, dated 1 December 2008. In July 2008, the Company conducted an Initial Public Offering (“IPO”) of 11,139,331,000 shares (34.8% of 31,985,962,000 shares issued and fully paidup). The shares offered to the public in the IPO were listed on the Indonesian Stock Exchange on 16 July 2008. In accordance with Article 3 of the Articles of Association, the Company is engaged in trading, services, industry, coal hauling, workshop activities, mining and construction. The Company’s subsidiaries are engaged in coal mining, coal trading, mining contractor services, infrastructure, coal logistics and power plant services.
The Company commenced its commercial operations in July 2005. The Company’s head office is domiciled in Jakarta and located at Menara Karya Building, 23rd floor, Jl. H.R. Rasuna Said Block X5, Kav. 12, South Jakarta. The Company’s Boards of Commissioners and Directors were as follows:
President Commissioner : Edwin Soeryadjaya Vice President Commissioner : Theodore Permadi Rachmat Commissioners : Ir. Subianto
Lim Soon Huat Independent Commissioners : Ir. Palgunadi Tatit Setyawan
Dr. Ir. Raden Pardede
President Director : Garibaldi Thohir Vice President Director : Christian Ariano Rachmat Directors : Sandiaga Salahuddin Uno Andre Johannes Mamuaya David Tendian Chia Ah Hoo M. Syah Indra Aman
President Commissioner : Edwin Soeryadjaya Vice President Commissioner : Theodore Permadi Rachmat Commissioners : Ir. Subianto Lim Soon Huat Independent Commissioners : Ir. Palgunadi Tatit Setyawan Dr. Ir. Raden Pardede

Adaro Energy Annual Report 2011www.adaro.com 185
(Expressed in thousand US Dollars, unless otherwise stated)
The accompanying notes form an integral part of these consolidated financial statements
Receipts from customers 3,791,489 2,750,177 Payments to suppliers (2,195,407) (1,539,242) Payments to employees (110,410) (81,710) Receipts of finance income 6,210 4,665 Payments of royalties (198,333) (164,674) Payments of income taxes (329,933) (553,669) Payments of interest and finance costs (106,013) (119,724) Receipt from settlement of restricted cash and time deposits 211 Other payments, net (145,447) (2,487) 712,367 293,336 Purchase of fixed assets (625,022) (244,659) Payment for addition of deferred exploration and development expenditure (540) Proceeds from disposal of fixed assets 5,699 3,800 Payment of advance for investments in equity securities (47,100) Purchase of interest in associates (25,887) (358,337) Purchase of equity securities (65,708) Loans to third parties (36,542) Loan to a related party (15,000) Net cash outflow from acquisition of subsidiaries (301,458) (35) Proceeds from sales of investments in associates 9 Purchase of additional interest in a subsidiary (10,000) (1,064,458) (656,322) Proceed of bank loans 870,000 40,000 Repayments of bank loans (326,410) (129,951) Payments of loan related costs (44,659) Receipts from issue of new shares in subsidiary from minority party 600 Transfer from/(to) restricted cash and time deposits 142 (279) Payments of dividends (150,911) (95,675) Payments of obligations under finance leases (44,498) (39,820) 304,264 (225,725) (47,827) (588,711) 607,271 1,199,427 (572) (3,445) 558,872 607,271 Acquisition of assets under finance leases 30,982 42,356 Addition of investments in associates through conversion of advance for investments 28,225 2,900 * As restated (refer to Note 3)
(Expressed in thousand US Dollars, unless otherwise stated)
PT Adaro Energy Tbk (the “Company”) was established by Notarial Deed No. 25 dated 28 July 2004 of Sukawaty Sumadi, S.H., Notary in Jakarta. The Deed was published in State Gazette of the Republic of Indonesia No. 59, dated 25 July 2006, State Gazette Supplementary No. 8036 and was approved by the Minister of Justice of the Republic of Indonesia in Decree No. C21493 HT.01.01.TH.2004 dated 26 August 2004. The latest amendment was made to the Articles of Association of the Company based on Notarial Deed No. 65 dated 31 October 2008 of Humberg Lie, S.H., S.E., M.Kn., to conform with the requirements of the Regulations of the Capital Market and Financial Institution Supervisory Board (“BapepamLK”) No. IX.J.1 dated 14 May 2008 for Principles of Articles of Association of Companies which Conduct Public Offering of Equity Securities and Public Companies. The amendment of the Articles of Association was accepted by the Minister of Law and Human Rights of the Republic of Indonesia in Decree No. AHUAH.01.1024501, dated 1 December 2008 and No. AHUAH.01.1024502, dated 1 December 2008. In July 2008, the Company conducted an Initial Public Offering (“IPO”) of 11,139,331,000 shares (34.8% of 31,985,962,000 shares issued and fully paidup). The shares offered to the public in the IPO were listed on the Indonesian Stock Exchange on 16 July 2008. In accordance with Article 3 of the Articles of Association, the Company is engaged in trading, services, industry, coal hauling, workshop activities, mining and construction. The Company’s subsidiaries are engaged in coal mining, coal trading, mining contractor services, infrastructure, coal logistics and power plant services.
The Company commenced its commercial operations in July 2005. The Company’s head office is domiciled in Jakarta and located at Menara Karya Building, 23rd floor, Jl. H.R. Rasuna Said Block X5, Kav. 12, South Jakarta. The Company’s Boards of Commissioners and Directors were as follows:
President Commissioner : Edwin Soeryadjaya Vice President Commissioner : Theodore Permadi Rachmat Commissioners : Ir. Subianto
Lim Soon Huat Independent Commissioners : Ir. Palgunadi Tatit Setyawan
Dr. Ir. Raden Pardede
President Director : Garibaldi Thohir Vice President Director : Christian Ariano Rachmat Directors : Sandiaga Salahuddin Uno Andre Johannes Mamuaya David Tendian Chia Ah Hoo M. Syah Indra Aman
President Commissioner : Edwin Soeryadjaya Vice President Commissioner : Theodore Permadi Rachmat Commissioners : Ir. Subianto Lim Soon Huat Independent Commissioners : Ir. Palgunadi Tatit Setyawan Dr. Ir. Raden Pardede

Adaro Energy Annual Report 2011 www.adaro.com186
(Expressed in thousand US Dollars, unless otherwise stated)
(continued)
(continued)
President Director : Garibaldi Thohir Vice President Director : Christian Ariano Rachmat Directors : Sandiaga Salahuddin Uno Andre Johannes Mamuaya David Tendian Chia Ah Hoo Alastair Bruce Grant The composition of the Company’s Audit Committee as at the date of these consolidated financial statements was as follows:
Chairman : Ir. Palgunadi Tatit Setyawan Members : Prof. Dr. Ir. Irwandy Arif, MSc
Mamat Ma’mun, SE.
As at 31 December 2011, the Group had 7,476 employees (31 December 2010: 6,242 employees) (unaudited).
The Company has direct and indirect ownership in the following subsidiaries:
Direct PT Alam Tri Abadi Trading and service Indonesia 2007 2005 100% 100% 5,659,564 4,138,873 (“ATA”) a) PT Saptaindra Mining services Indonesia 2002 2005 100% 100% 566,742 481,613 Sejati (“SIS”) a) PT Makmur Trading and power Indonesia 2005 100% 100% 125,341 82,150 Sejahtera plant service Wisesa (“MSW”) Indirect PT Adaro Mining Indonesia 1992 2005 100% 100% 2,699,588 1,884,993 Indonesia (“Adaro”) PT Dianlia Investment Indonesia 1995 2005 100% 100% 16,941 17,252 Setyamukti (“Dianlia”) PT Jasapower Mining services Indonesia 2007 100% 100% 129,308 51,228 Indonesia (“JPI”) a) PT Biscayne Investment Indonesia 2007 100% 100% 97,967 97,868 Investments (“Biscayne”) a) PT Indonesia Bulk Terminal handling Indonesia 1997 2007 100% 100% 94,422 94,313 Terminal (“IBT”) services PT Adaro Persada Service Indonesia 2006 2006 100% 100% 24,313 5,890 Mandiri (“APM”) d) Rach (Mauritius) Ltd Investment Mauritius 2007 100% (“Rach (M)”) e) Rachpore Investment Singapore 2007 100% 100% 23,325 24,129 Investments Pte Ltd (“Rachpore”) a) Arindo Holdings Investment Mauritius 2008 100% 100% 443,917 407,666 (Mauritius) Ltd (“Arindo Holdings”) a)
(Expressed in thousand US Dollars, unless otherwise stated)
(continued)
(continued)
Indirect (continued) Vindoor Investment Mauritius 2008 100% 100% 207,408 168,886 Investments (Mauritius) Ltd (“Vindoor") a) Coaltrade Services Coal trading Singapore 2001 2008 100% 100% 207,394 168,871 International Pte Ltd (“Coaltrade”) PT Viscaya Investment Indonesia 2008 100% 100% 219,048 173,765 Investments (“Viscaya”) Rachmalta Investment Malta 2008 100% 100% 6,709 6,709 Investment Ltd (“Rachmalta”) PT Sarana Daya Service Indonesia 2009 2008 51% 51% 44,455 47,738 Mandiri (“SDM”) Coronado Holdings Investment Singapore 2009 86% 86% 3,781 4,080 Pte Ltd (“Coronado”) Orchard Maritime Coal handling Singapore 2006 2009 95% 95% 8,124 29,903 Logistics Pte and barging Ltd (“OML”) a) Orchard Maritime Investment Netherlands 2009 95% 95% 320 320 Netherlands B.V. (“OMN”) PT Adaro Logistics Investment Indonesia 2009 100% 100% 157,783 130,602 (“AL”) a) c) PT Maritim Barito Coal handling Indonesia 2004 2009 100% 100% 152,840 129,597 Perkasa and barging (“MBP”) PT Harapan Coal handling Indonesia 2004 2009 100% 100% 2,265 1,005 Bahtera and barging Internusa (“HBI”) PT Maritim Service Indonesia 2009 72% 72% 660 661 Indonesia (“Marindo”) Joyce Corner Investment Seychelles 2009 100% 100% 50,000 International Ltd (“JCI”) b) PT Adaro Power Service Indonesia 2010 100% 100% 12,244 7 (“Adaro Power”) PT Puradika Service Indonesia 2010 100% 100% 4 Bongkar Muat Makmur Jasa (“PBMM”) PT Rehabilitasi Service Indonesia 2011 100% 1,395 Lingkungan Indonesia (“RLI”) PT Indonesia Multi Terminal handling Indonesia 2011 85% 2,529 Purpose services Terminal (“IMPT”) PT Mustika Indah Mining Indonesia 2011 75% 17,853 Permai (“MIP”) PT Bukit Enim Mining Indonesia 2011 61% 108 Energi (“BEE”)
PT Adaro Mining Service Indonesia 2011 100% 440 Technologies (“AMT”) PT Adaro Service Indonesia 2007 2011 51% 1,067 Eksplorasi Indonesia (“AEI”)
a) and subsidiaries b) liquidated on 8 August 2011 c) previously was PT Sarana Multi Persada, refer to Note 5h d) previously was PT Satya Mandiri Persada, refer to Note 5l e) liquidated on 26 April 2011

Adaro Energy Annual Report 2011www.adaro.com 187
(Expressed in thousand US Dollars, unless otherwise stated)
(continued)
(continued)
President Director : Garibaldi Thohir Vice President Director : Christian Ariano Rachmat Directors : Sandiaga Salahuddin Uno Andre Johannes Mamuaya David Tendian Chia Ah Hoo Alastair Bruce Grant The composition of the Company’s Audit Committee as at the date of these consolidated financial statements was as follows:
Chairman : Ir. Palgunadi Tatit Setyawan Members : Prof. Dr. Ir. Irwandy Arif, MSc
Mamat Ma’mun, SE.
As at 31 December 2011, the Group had 7,476 employees (31 December 2010: 6,242 employees) (unaudited).
The Company has direct and indirect ownership in the following subsidiaries:
Direct PT Alam Tri Abadi Trading and service Indonesia 2007 2005 100% 100% 5,659,564 4,138,873 (“ATA”) a) PT Saptaindra Mining services Indonesia 2002 2005 100% 100% 566,742 481,613 Sejati (“SIS”) a) PT Makmur Trading and power Indonesia 2005 100% 100% 125,341 82,150 Sejahtera plant service Wisesa (“MSW”) Indirect PT Adaro Mining Indonesia 1992 2005 100% 100% 2,699,588 1,884,993 Indonesia (“Adaro”) PT Dianlia Investment Indonesia 1995 2005 100% 100% 16,941 17,252 Setyamukti (“Dianlia”) PT Jasapower Mining services Indonesia 2007 100% 100% 129,308 51,228 Indonesia (“JPI”) a) PT Biscayne Investment Indonesia 2007 100% 100% 97,967 97,868 Investments (“Biscayne”) a) PT Indonesia Bulk Terminal handling Indonesia 1997 2007 100% 100% 94,422 94,313 Terminal (“IBT”) services PT Adaro Persada Service Indonesia 2006 2006 100% 100% 24,313 5,890 Mandiri (“APM”) d) Rach (Mauritius) Ltd Investment Mauritius 2007 100% (“Rach (M)”) e) Rachpore Investment Singapore 2007 100% 100% 23,325 24,129 Investments Pte Ltd (“Rachpore”) a) Arindo Holdings Investment Mauritius 2008 100% 100% 443,917 407,666 (Mauritius) Ltd (“Arindo Holdings”) a)
(Expressed in thousand US Dollars, unless otherwise stated)
(continued)
(continued)
Indirect (continued) Vindoor Investment Mauritius 2008 100% 100% 207,408 168,886 Investments (Mauritius) Ltd (“Vindoor") a) Coaltrade Services Coal trading Singapore 2001 2008 100% 100% 207,394 168,871 International Pte Ltd (“Coaltrade”) PT Viscaya Investment Indonesia 2008 100% 100% 219,048 173,765 Investments (“Viscaya”) Rachmalta Investment Malta 2008 100% 100% 6,709 6,709 Investment Ltd (“Rachmalta”) PT Sarana Daya Service Indonesia 2009 2008 51% 51% 44,455 47,738 Mandiri (“SDM”) Coronado Holdings Investment Singapore 2009 86% 86% 3,781 4,080 Pte Ltd (“Coronado”) Orchard Maritime Coal handling Singapore 2006 2009 95% 95% 8,124 29,903 Logistics Pte and barging Ltd (“OML”) a) Orchard Maritime Investment Netherlands 2009 95% 95% 320 320 Netherlands B.V. (“OMN”) PT Adaro Logistics Investment Indonesia 2009 100% 100% 157,783 130,602 (“AL”) a) c) PT Maritim Barito Coal handling Indonesia 2004 2009 100% 100% 152,840 129,597 Perkasa and barging (“MBP”) PT Harapan Coal handling Indonesia 2004 2009 100% 100% 2,265 1,005 Bahtera and barging Internusa (“HBI”) PT Maritim Service Indonesia 2009 72% 72% 660 661 Indonesia (“Marindo”) Joyce Corner Investment Seychelles 2009 100% 100% 50,000 International Ltd (“JCI”) b) PT Adaro Power Service Indonesia 2010 100% 100% 12,244 7 (“Adaro Power”) PT Puradika Service Indonesia 2010 100% 100% 4 Bongkar Muat Makmur Jasa (“PBMM”) PT Rehabilitasi Service Indonesia 2011 100% 1,395 Lingkungan Indonesia (“RLI”) PT Indonesia Multi Terminal handling Indonesia 2011 85% 2,529 Purpose services Terminal (“IMPT”) PT Mustika Indah Mining Indonesia 2011 75% 17,853 Permai (“MIP”) PT Bukit Enim Mining Indonesia 2011 61% 108 Energi (“BEE”)
PT Adaro Mining Service Indonesia 2011 100% 440 Technologies (“AMT”) PT Adaro Service Indonesia 2007 2011 51% 1,067 Eksplorasi Indonesia (“AEI”)
a) and subsidiaries b) liquidated on 8 August 2011 c) previously was PT Sarana Multi Persada, refer to Note 5h d) previously was PT Satya Mandiri Persada, refer to Note 5l e) liquidated on 26 April 2011
Adaro Energy Annual Report 2011 www.adaro.com188
(Expressed in thousand US Dollars, unless otherwise stated)
(continued)
Adaro’s activities are governed by the provisions of a Coal Cooperation Agreement (the “CCA”) which was entered into by Adaro and PT Tambang Batubara Bukit Asam (Persero) Tbk (“PTBA”), formerly Perusahaan Negara Tambang Batubara, on 16 November 1982. Based on Presidential Decree No. 75/1996 dated 25 September 1996 and the amendment to the CCA No. J2/Ji.DU/52/82 between PTBA and Adaro on 27 June 1997, all rights and obligations of PTBA under the CCA were transferred to the Government of the Republic of Indonesia (the “Government”) represented by the Minister of Mines and Energy, effective from 1 July 1997. Under the terms of the CCA, Adaro acts as a contractor to the Government, and is responsible for coal mining operations in an area located in South Kalimantan. Adaro commenced its 30year operating period on 1 October 1992 with coal produced from the Paringin area of interest. Adaro is entitled to 86.5% of the coal produced with the remaining 13.5% being the Government’s share of production. Commencing on 1 July 1999, Adaro adopted the salesbased cash royalty method in accordance with the Government regulations to satisfy the Government’s production entitlement. Adaro’s sales reflect 100% of the revenue generated from coal sales and the Government royalty expense is recorded as a part of cost of revenue.
On 25 August 1990, IBT entered into a Basic Agreement with PT (Persero) Pelabuhan Indonesia III (formerly Perum Pelabuhan III) (“Pelindo III”) for the construction, development and operation of a Public Coal Port in Pulau Laut, South Kalimantan. On 10 November 1994, IBT and Pelindo III amended the Basic Agreement to become a Cooperation Agreement. Under the terms of the Cooperation Agreement, IBT commenced a 30year operating period on 21 August 1997.
On 18 August 2009, IBT and Pelindo III amended the Cooperation Agreement in relation to the expansion of IBT’s business to include management of the liquid bulk terminal. Under the agreement, IBT has an obligation to pay Pelindo III a share of the handling fee for the management of the liquid bulk terminal services for a certain amount per tonne for unloading and loading activities.
According to the Cooperation Agreement, IBT has an obligation to pay royalties to Pelindo III based on a certain percentage of revenue from coal bulk terminal management services. On 9 February 2011, IBT and Pelindo III agreed to change the royalty fee for the management of the coal bulk terminal services from a percentage of revenue to a fixed rate per tonne. The new rate is effective from 1 January 2010 to 31 August 2012.
On 28 August 2007, PT Ambang Barito Nusapersada (“Ambapers”) appointed SDM as the partner to execute Barito Channel dredging, which includes the activities of river mouth dredging, maintenance dredging and financing the channel dredging project. On 25 March 2008, SDM entered into a Cooperation Agreement with Ambapers to execute this appointment. The term of the agreement is 15 years commencing on the date on which the channel utilisation service fee is charged by Ambapers. Afterwards, SDM will be given the first right to consider extension or refusal to extend for the next five years, with a guarantee from Ambapers that the terms and conditions of the agreement will be mutual for SDM. Ambapers charges a channel fee for every ship that passes through the Barito Channel in accordance with the regulations set by the local government. Revenue from channel fees is distributed to the local government, Ambapers and SDM in the determined proportions on the fifth day of the following month.
Based on the Decree of the Regent of Lahat No. 503/188/KEP/PERTAMBEN/2010 dated 29 April 2010, PT Mustika Indah Permai was granted a Production Operation Mining Business Permit for 20 years for 2,000 hectares, located in the Lahat Regency, South Sumatera Province.
(Expressed in thousand US Dollars, unless otherwise stated)
(continued)
Based on the Decree of the Regent of Muara Enim No. 256/KPTS/TAMBEN/2011 dated 9 March 2011, PT Bukit Enim Energi was granted a Production Operation Mining Business Permit for 20 years for 11,130 hectares, located in the Muara Enim Regency, South Sumatera Province.
Based on the report from Terence Willsteed & Associates dated 5 April 2011, the coal reserves of Adaro as at 31 December 2010, were as follows (in million metric tonnes, unaudited):
Tutupan 410 141 551 Wara 289 98 387 699 239 938
Based on the report from Marston & Marston Inc in February 2012, the coal reserves of MIP as at 15 December 2011, were as follows (in million metric tonnes, unaudited):
MIPLahat 238 35 273
Wara PKP2B
16 November 1982
1 October 2022
289,000,000 5,369,677 7,917,803 283,630,323 Tutupan
410,000,000 42,297,789 412,067,294 367,702,211 Lahat IUP 29 April
2010 29 April 2030 238,000,000 238,000,000 Total 699,000,000 238,000,000 47,667,466 419,985,097 889,332,534
The Group has a new exploration area in BEE Muara Enim.
The Group’s consolidated financial statements were prepared and finalised by the Board of Directors on 26 March 2012. Presented below are the significant accounting policies adopted in preparing the consolidated financial statements of the Group, which are in conformity with Indonesian Financial Accounting Standards. The consolidated financial statements are also prepared in conformity with BapepamLK No. VIII.G.7 for Guidance on Financial Statements Presentation and Circular Letter of BapepamLK No. SE02/BL/2008 dated 31 January 2008 for Guidance on the Preparation and Disclosure of Financial Statements of an Issuer or Public Company in the General Mining Industry.
The consolidated financial statements have been prepared on the basis of historical cost, except for availableforsale financial assets, financial assets and financial liabilities (including derivative instruments) which are measured at fair value through profit or loss.

Adaro Energy Annual Report 2011www.adaro.com 189
(Expressed in thousand US Dollars, unless otherwise stated)
(continued)
Adaro’s activities are governed by the provisions of a Coal Cooperation Agreement (the “CCA”) which was entered into by Adaro and PT Tambang Batubara Bukit Asam (Persero) Tbk (“PTBA”), formerly Perusahaan Negara Tambang Batubara, on 16 November 1982. Based on Presidential Decree No. 75/1996 dated 25 September 1996 and the amendment to the CCA No. J2/Ji.DU/52/82 between PTBA and Adaro on 27 June 1997, all rights and obligations of PTBA under the CCA were transferred to the Government of the Republic of Indonesia (the “Government”) represented by the Minister of Mines and Energy, effective from 1 July 1997. Under the terms of the CCA, Adaro acts as a contractor to the Government, and is responsible for coal mining operations in an area located in South Kalimantan. Adaro commenced its 30year operating period on 1 October 1992 with coal produced from the Paringin area of interest. Adaro is entitled to 86.5% of the coal produced with the remaining 13.5% being the Government’s share of production. Commencing on 1 July 1999, Adaro adopted the salesbased cash royalty method in accordance with the Government regulations to satisfy the Government’s production entitlement. Adaro’s sales reflect 100% of the revenue generated from coal sales and the Government royalty expense is recorded as a part of cost of revenue.
On 25 August 1990, IBT entered into a Basic Agreement with PT (Persero) Pelabuhan Indonesia III (formerly Perum Pelabuhan III) (“Pelindo III”) for the construction, development and operation of a Public Coal Port in Pulau Laut, South Kalimantan. On 10 November 1994, IBT and Pelindo III amended the Basic Agreement to become a Cooperation Agreement. Under the terms of the Cooperation Agreement, IBT commenced a 30year operating period on 21 August 1997.
On 18 August 2009, IBT and Pelindo III amended the Cooperation Agreement in relation to the expansion of IBT’s business to include management of the liquid bulk terminal. Under the agreement, IBT has an obligation to pay Pelindo III a share of the handling fee for the management of the liquid bulk terminal services for a certain amount per tonne for unloading and loading activities.
According to the Cooperation Agreement, IBT has an obligation to pay royalties to Pelindo III based on a certain percentage of revenue from coal bulk terminal management services. On 9 February 2011, IBT and Pelindo III agreed to change the royalty fee for the management of the coal bulk terminal services from a percentage of revenue to a fixed rate per tonne. The new rate is effective from 1 January 2010 to 31 August 2012.
On 28 August 2007, PT Ambang Barito Nusapersada (“Ambapers”) appointed SDM as the partner to execute Barito Channel dredging, which includes the activities of river mouth dredging, maintenance dredging and financing the channel dredging project. On 25 March 2008, SDM entered into a Cooperation Agreement with Ambapers to execute this appointment. The term of the agreement is 15 years commencing on the date on which the channel utilisation service fee is charged by Ambapers. Afterwards, SDM will be given the first right to consider extension or refusal to extend for the next five years, with a guarantee from Ambapers that the terms and conditions of the agreement will be mutual for SDM. Ambapers charges a channel fee for every ship that passes through the Barito Channel in accordance with the regulations set by the local government. Revenue from channel fees is distributed to the local government, Ambapers and SDM in the determined proportions on the fifth day of the following month.
Based on the Decree of the Regent of Lahat No. 503/188/KEP/PERTAMBEN/2010 dated 29 April 2010, PT Mustika Indah Permai was granted a Production Operation Mining Business Permit for 20 years for 2,000 hectares, located in the Lahat Regency, South Sumatera Province.
(Expressed in thousand US Dollars, unless otherwise stated)
(continued)
Based on the Decree of the Regent of Muara Enim No. 256/KPTS/TAMBEN/2011 dated 9 March 2011, PT Bukit Enim Energi was granted a Production Operation Mining Business Permit for 20 years for 11,130 hectares, located in the Muara Enim Regency, South Sumatera Province.
Based on the report from Terence Willsteed & Associates dated 5 April 2011, the coal reserves of Adaro as at 31 December 2010, were as follows (in million metric tonnes, unaudited):
Tutupan 410 141 551 Wara 289 98 387 699 239 938
Based on the report from Marston & Marston Inc in February 2012, the coal reserves of MIP as at 15 December 2011, were as follows (in million metric tonnes, unaudited):
MIPLahat 238 35 273
Wara PKP2B
16 November 1982
1 October 2022
289,000,000 5,369,677 7,917,803 283,630,323 Tutupan
410,000,000 42,297,789 412,067,294 367,702,211 Lahat IUP 29 April
2010 29 April 2030 238,000,000 238,000,000 Total 699,000,000 238,000,000 47,667,466 419,985,097 889,332,534
The Group has a new exploration area in BEE Muara Enim.
The Group’s consolidated financial statements were prepared and finalised by the Board of Directors on 26 March 2012. Presented below are the significant accounting policies adopted in preparing the consolidated financial statements of the Group, which are in conformity with Indonesian Financial Accounting Standards. The consolidated financial statements are also prepared in conformity with BapepamLK No. VIII.G.7 for Guidance on Financial Statements Presentation and Circular Letter of BapepamLK No. SE02/BL/2008 dated 31 January 2008 for Guidance on the Preparation and Disclosure of Financial Statements of an Issuer or Public Company in the General Mining Industry.
The consolidated financial statements have been prepared on the basis of historical cost, except for availableforsale financial assets, financial assets and financial liabilities (including derivative instruments) which are measured at fair value through profit or loss.

Adaro Energy Annual Report 2011 www.adaro.com190
(Expressed in thousand US Dollars, unless otherwise stated)
(continued)
(continued) The preparation of financial statements in conformity with Indonesian Financial Accounting Standards requires the use of certain critical accounting estimates. It also requires management to exercise its judgement in the process of applying the Group’s accounting policies. The areas involving a higher degree of judgement or complexity, or areas where assumptions and estimates are significant to the consolidated financial statements are disclosed in Note 4. Figures in the consolidated financial statements are expressed in thousand US Dollars, unless otherwise stated. From 1 January 2011, the Group changed its reporting currency from Rupiah to US Dollars (refer to Note 3).
On 1 January 2011, the Group adopted new and revised Statements of Financial Accounting Standards (“SFAS”) and Interpretations of Statement of Financial Accounting Standards (“IFAS”) that are mandatory for application from that date. Changes to the Group’s accounting policies have been made as required, in accordance with the transitional provisions in the respective standards and interpretations.
SFAS No. 1 (Revised 2009), “Presentation of Financial Statements”
The revised standard prohibits the presentation of items of income and expenses (that is, 'nonowner changes in equity') in the statements of changes in equity, requiring 'nonowner changes in equity' to be presented separately from owner changes in equity. All nonowner changes in equity will be required to be shown in a performance statement, but entities can choose whether to present one performance statement (the statements of comprehensive income) or two statements (the statements of comprehensive income and statements of income). The Group has selected to present one performance statement. Where entities restate or reclassify comparative information, they will be required to present a restated statement of financial position as at the beginning of the comparative period in addition to the current requirement to present statement of financial position at the end of the current period and comparative period. In addition, no items of income or expense are to be presented as arising from outside the entity’s ordinary activities.
As a result, the demurrage expense amounting to US$34,331 incurred beyond the normal activity of Adaro due to the bad weather in July to September 2010 which affected production and delayed coal barging and shipment, which was previously recorded as an extraordinary item will be classified as expenses from ordinary business.
The Group has made reclassification in the consolidated statement of comprehensive income for the year ended 31 December 2010, as follows:
Cost of revenue 1,854,589 34,331 1,888,920 Income tax expense 293,909 (15,449) 278,460 Extraordinary item, net of tax 18,882 (18,882)
(Expressed in thousand US Dollars, unless otherwise stated)
(continued)
(continued)
SFAS No. 4 (Revised 2009), “Consolidated and Separate Financial Statements”
The revised standard prohibits a parent company from failing to consolidate its controlled subsidiaries. Control is presumed to exist when the parent owns, directly or indirectly through subsidiaries, more than half of the voting power of an entity, unless, in exceptional circumstances, it can be clearly demonstrated that such ownership does not constitute control. The standard also acknowledges that control can still exist when the parent owns half or less of the voting power of the entity. When assessing the control, a company should consider the existence and effect of potential voting rights that are currently exercisable or convertible, including potential voting rights held by another entity.
The revised standard requires the effects of all transactions with noncontrolling interests to be recorded in equity if there is no change in control and these transactions will no longer result in goodwill or gains and losses. The standard also specifies the accounting when control is lost. Any remaining interest in the entity is remeasured to fair value and a gain or loss is recognised in the consolidated statements of income. The Group applied SFAS No. 4 (Revised 2009) prospectively to transactions with noncontrolling interests from 1 January 2011.
SFAS No. 4 requires noncontrolling interests to be presented in the consolidated statements of financial position within equity, separately from the equity of the owners of the parent. As such, for the current period, the Group has reclassified the 2010 noncontrolling interests which has been previously recorded as a mezzanine between liabilities and equity to equity of US$3,208. As result, the statement of financial position as at 1 January 2010 has been presented.
Total comprehensive income is attributed to the owners of the parent and to the noncontrolling interests even if this may result in the noncontrolling interests having a deficit balance. The Group has changed the presentation of the total comprehensive income to the owners of the parent and the noncontrolling interests. As such, for the current period, total comprehensive income attributable to the owners of the parent and the noncontrolling interests is US$557,779 and US$1,721, respectively.
SFAS No. 5 (Revised 2009), “Operating Segments”
The revised standard requires a 'management approach', under which segment information is presented on the same basis as that used for internal reporting purposes. As such, the segments are reported in a manner that is more consistent with the internal reporting provided to the chief operating decisionmaker. This has not resulted in additional reportable segments being presented.
SFAS No. 10 (Revised 2010), “The Effects of Changes in Foreign Exchange Rates”
The revised standard requires an entity to determine its functional currency and translate all foreign currency items into its functional currency. Functional currency is determined by using a hierarchy of primary and secondary factors. An entity may present its financial statements in any currency. The standard also provides guidance on the presentation of the financial statements of a group whose subsidiaries, associates and joint ventures have different functional currencies.
This statement is required to be applied for financial years beginning on or after 1 January 2012, but has been adopted early by the Group. Refer to Note 3 for details.
SFAS No. 22 (Revised 2010), “Business Combination”
The revised standard requires the acquisition method to be applied in business combinations which eliminates the option of using a poolingofinterest method. There is a choice, on an acquisitionbyacquisition basis, of measuring the noncontrolling interests in the acquiree either at fair value or at the noncontrolling interest’s proportionate share of the acquiree’s identifiable net assets. All acquisitionrelated costs should be expensed.

Adaro Energy Annual Report 2011www.adaro.com 191
(Expressed in thousand US Dollars, unless otherwise stated)
(continued)
(continued) The preparation of financial statements in conformity with Indonesian Financial Accounting Standards requires the use of certain critical accounting estimates. It also requires management to exercise its judgement in the process of applying the Group’s accounting policies. The areas involving a higher degree of judgement or complexity, or areas where assumptions and estimates are significant to the consolidated financial statements are disclosed in Note 4. Figures in the consolidated financial statements are expressed in thousand US Dollars, unless otherwise stated. From 1 January 2011, the Group changed its reporting currency from Rupiah to US Dollars (refer to Note 3).
On 1 January 2011, the Group adopted new and revised Statements of Financial Accounting Standards (“SFAS”) and Interpretations of Statement of Financial Accounting Standards (“IFAS”) that are mandatory for application from that date. Changes to the Group’s accounting policies have been made as required, in accordance with the transitional provisions in the respective standards and interpretations.
SFAS No. 1 (Revised 2009), “Presentation of Financial Statements”
The revised standard prohibits the presentation of items of income and expenses (that is, 'nonowner changes in equity') in the statements of changes in equity, requiring 'nonowner changes in equity' to be presented separately from owner changes in equity. All nonowner changes in equity will be required to be shown in a performance statement, but entities can choose whether to present one performance statement (the statements of comprehensive income) or two statements (the statements of comprehensive income and statements of income). The Group has selected to present one performance statement. Where entities restate or reclassify comparative information, they will be required to present a restated statement of financial position as at the beginning of the comparative period in addition to the current requirement to present statement of financial position at the end of the current period and comparative period. In addition, no items of income or expense are to be presented as arising from outside the entity’s ordinary activities.
As a result, the demurrage expense amounting to US$34,331 incurred beyond the normal activity of Adaro due to the bad weather in July to September 2010 which affected production and delayed coal barging and shipment, which was previously recorded as an extraordinary item will be classified as expenses from ordinary business.
The Group has made reclassification in the consolidated statement of comprehensive income for the year ended 31 December 2010, as follows:
Cost of revenue 1,854,589 34,331 1,888,920 Income tax expense 293,909 (15,449) 278,460 Extraordinary item, net of tax 18,882 (18,882)
(Expressed in thousand US Dollars, unless otherwise stated)
(continued)
(continued)
SFAS No. 4 (Revised 2009), “Consolidated and Separate Financial Statements”
The revised standard prohibits a parent company from failing to consolidate its controlled subsidiaries. Control is presumed to exist when the parent owns, directly or indirectly through subsidiaries, more than half of the voting power of an entity, unless, in exceptional circumstances, it can be clearly demonstrated that such ownership does not constitute control. The standard also acknowledges that control can still exist when the parent owns half or less of the voting power of the entity. When assessing the control, a company should consider the existence and effect of potential voting rights that are currently exercisable or convertible, including potential voting rights held by another entity.
The revised standard requires the effects of all transactions with noncontrolling interests to be recorded in equity if there is no change in control and these transactions will no longer result in goodwill or gains and losses. The standard also specifies the accounting when control is lost. Any remaining interest in the entity is remeasured to fair value and a gain or loss is recognised in the consolidated statements of income. The Group applied SFAS No. 4 (Revised 2009) prospectively to transactions with noncontrolling interests from 1 January 2011.
SFAS No. 4 requires noncontrolling interests to be presented in the consolidated statements of financial position within equity, separately from the equity of the owners of the parent. As such, for the current period, the Group has reclassified the 2010 noncontrolling interests which has been previously recorded as a mezzanine between liabilities and equity to equity of US$3,208. As result, the statement of financial position as at 1 January 2010 has been presented.
Total comprehensive income is attributed to the owners of the parent and to the noncontrolling interests even if this may result in the noncontrolling interests having a deficit balance. The Group has changed the presentation of the total comprehensive income to the owners of the parent and the noncontrolling interests. As such, for the current period, total comprehensive income attributable to the owners of the parent and the noncontrolling interests is US$557,779 and US$1,721, respectively.
SFAS No. 5 (Revised 2009), “Operating Segments”
The revised standard requires a 'management approach', under which segment information is presented on the same basis as that used for internal reporting purposes. As such, the segments are reported in a manner that is more consistent with the internal reporting provided to the chief operating decisionmaker. This has not resulted in additional reportable segments being presented.
SFAS No. 10 (Revised 2010), “The Effects of Changes in Foreign Exchange Rates”
The revised standard requires an entity to determine its functional currency and translate all foreign currency items into its functional currency. Functional currency is determined by using a hierarchy of primary and secondary factors. An entity may present its financial statements in any currency. The standard also provides guidance on the presentation of the financial statements of a group whose subsidiaries, associates and joint ventures have different functional currencies.
This statement is required to be applied for financial years beginning on or after 1 January 2012, but has been adopted early by the Group. Refer to Note 3 for details.
SFAS No. 22 (Revised 2010), “Business Combination”
The revised standard requires the acquisition method to be applied in business combinations which eliminates the option of using a poolingofinterest method. There is a choice, on an acquisitionbyacquisition basis, of measuring the noncontrolling interests in the acquiree either at fair value or at the noncontrolling interest’s proportionate share of the acquiree’s identifiable net assets. All acquisitionrelated costs should be expensed.

Adaro Energy Annual Report 2011 www.adaro.com192
(Expressed in thousand US Dollars, unless otherwise stated)
(continued)
(continued)
SFAS No. 22 (Revised 2010), “Business Combination” (continued)
The Group will apply SFAS No. 22 (Revised 2010) prospectively to all business combinations from 1 January 2011. The requirement to apply this SFAS prospectively has the following effect for a business combination which took place before the application of this SFAS:
Previously recognised goodwill As required under the standard, at 1 January 2011, the carrying amount of goodwill arising from prior business combinations will be its carrying amount at that date in accordance with the Group’s previous accounting policies. Hence, in determining that amount, the Group will eliminate the carrying amount of any accumulated amortisation of that goodwill and the corresponding decrease in goodwill. No other adjustments shall be made to the carrying amount of goodwill. The Group will discontinue amortising goodwill arising from prior business combination and the goodwill is tested annually for impairment.
Previously recognised negative goodwill As required under the standard, the carrying amount of all negative goodwill arising from prior business combinations should be derecognised at 1 January 2011 with a corresponding adjustment to the opening balance of retained earnings as at 1 January 2011. The Group did not have any negative goodwill arising from prior business combinations and as such, no adjustment has been made with respect to negative goodwill.
For investments accounted for by applying the equity method As required under this standard, for investments accounted for by applying the equity method and acquired on or after 1 January 2011, the Group will apply this standard in the accounting for:
• any acquired goodwill included in the carrying amount of that investment. Therefore, the Group will
not include any amortisation of that notional goodwill in the determination of the Group's share of the investee's profits or losses.
• any excess included in the carrying amount of the investment of the entity's interest in the net fair value of the investee's identifiable assets, liabilities and contingent liabilities over the cost of the investment. Therefore, the Group will include that excess as income in the determination of the Group's share of the investee's profits or losses in the period in which the investment is acquired.
For investments accounted for by applying the equity method and acquired before 1 January 2011:
• the Group will apply this standard on a prospective basis, from the beginning of the first annual period
beginning on or after 1 January 2011, to any acquired goodwill included in the carrying amount of that investment. Therefore, the Group will, from that date, discontinue including the amortisation of that goodwill in the determination of the Group's share of the investee's profits or losses.
• the Group will derecognise any negative goodwill included in the carrying amount of that investment at the beginning of the first annual period beginning on or after 1 January 2011, with a corresponding adjustment to the opening balance of retained earnings.
The adoption of these new and revised standards and interpretations did not result in significant changes to the Company’s accounting policies and had no material effect on the amounts reported for the current or prior financial periods:
SFAS No. 2 (Revised 2009), “Statement of Cash Flows” SFAS No. 3 (Revised 2010), “Interim Financial Reporting” SFAS No. 7 (Revised 2010), “Related Party Disclosures” SFAS No. 8 (Revised 2010), “Events after the Reporting Period” SFAS No. 12 (Revised 2009), “Interests in Joint Ventures” SFAS No. 15 (Revised 2009), “Investments in Associates” SFAS No. 19 (Revised 2010), “Intangible Assets” SFAS No. 23 (Revised 2010), “Revenue” SFAS No. 25 (Revised 2009), “Accounting Policies, Changes in Accounting Estimates and Errors”
(Expressed in thousand US Dollars, unless otherwise stated)
(continued)
(continued)
SFAS No. 48 (Revised 2009), “Impairment of Assets” SFAS No. 57 (Revised 2009), “Provision, Contingent Liabilities and Contingent Assets” SFAS No. 58 (Revised 2009), “Noncurrent Assets Held for Sale and Discontinued Operations” IFAS No. 7 (Revised 2009), “Consolidation of Special Purpose Entities” IFAS No. 9, “Changes in Existing Decommissioning, Restoration and Similar Liabilities” IFAS No. 10, “Customer Loyalty Programs” IFAS No. 11, “Distributions of NonCash Assets to Owners” IFAS No. 12, “Jointly Controlled EntitiesNon Monetary Contributions by Venturers” IFAS No. 14, “Intangible Assets Web Site Costs” IFAS No. 17, “Interim Financial Reporting and Impairment”
The withdrawals of the following standards and interpretations did not result in significant changes to the Group’s accounting policies and had no material effect on the amounts reported for the current or prior financial year: SFAS No. 6, “Accounting and Reporting for DevelopmentStage Entities” SFAS No. 21, “Accounting for Equity” SFAS No. 40, “Accounting for Changes in Equity of Subsidiaries or Associates” IFAS No. 1, “Determining Market Price of Dividends” IFAS No. 2, “Presentation of Capital in the Balance Sheet and Subscription Receivables” IFAS No. 3, “Accounting for Donations or Endowments”
The following new and revised accounting standards and interpretations have been published and are mandatory for financial years beginning on or after 1 January 2012:
SFAS No. 13 (Revised 2011), “Investment Properties” SFAS No. 16 (Revised 2011), “Property, Plant, and Equipment” SFAS No. 18 (Revised 2010), “Accounting and Reporting by Retirement Benefit Plans” SFAS No. 24 (Revised 2010), “Employee Benefits” SFAS No. 26 (Revised 2011), “Borrowing Costs” SFAS No. 28 (Revised 2010), “Accounting for Loss Insurance” SFAS No. 30 (Revised 2011), “Leases” SFAS No. 33 (Revised 2011), “Stripping Activities and Environmental Management in General Mining” SFAS No. 34 (Revised 2010), “Construction Contracts” SFAS No. 36 (Revised 2010), “Accounting for Life Insurance” SFAS No. 45 (Revised 2010), “Financial Reporting for NonProfit Organizations” SFAS No. 46 (Revised 2010), “Income Taxes” SFAS No. 50 (Revised 2010), “Financial Instruments: Presentation” SFAS No. 53 (Revised 2010), “Sharebased Payments” SFAS No. 55 (Revised 2010), “Financial Instruments: Recognition and Measurement” SFAS No. 56 (Revised 2010), “Earnings per Share” SFAS No. 60, “Financial Instruments: Disclosures” SFAS No. 61, “Accounting for Government Grants and Disclosures of Government Assistance” SFAS No. 62, “Insurance Contracts” SFAS No. 63, “Financial Reporting in Hyperinflationary Economies” SFAS No. 64, “Exploration for and Evaluation of Mineral Resources” IFAS No. 13, “Hedges of a Net Investment in a Foreign Operation” IFAS No. 15, “SFAS No. 24, The Limit on a Defined Benefit Asset, Minimum Funding Requirements and
their Interaction” IFAS No. 16, “Service Concession Arrangements” IFAS No. 18, “Government Assistance No Specific Relation to Operating Activities” IFAS No. 19, “Applying the Restatement Approach under PSAK 63: Financial Reporting in
Hyperinflationary Economies” IFAS No. 20, “Income TaxesChanges in the Tax Status of an Entity or its Shareholders” IFAS No. 21, “Agreements for the Construction of Real Estate” IFAS No. 22, “Service Concession Arrangements: Disclosure” IFAS No. 23, “Operating Leases Incentives” IFAS No. 24 “Evaluating the Substance of Transactions Involving the Legal Form of a Lease” IFAS No. 25, “Land Rights” IFAS No. 26, “Reassessment of Embedded Derivatives”

Adaro Energy Annual Report 2011www.adaro.com 193
(Expressed in thousand US Dollars, unless otherwise stated)
(continued)
(continued)
SFAS No. 22 (Revised 2010), “Business Combination” (continued)
The Group will apply SFAS No. 22 (Revised 2010) prospectively to all business combinations from 1 January 2011. The requirement to apply this SFAS prospectively has the following effect for a business combination which took place before the application of this SFAS:
Previously recognised goodwill As required under the standard, at 1 January 2011, the carrying amount of goodwill arising from prior business combinations will be its carrying amount at that date in accordance with the Group’s previous accounting policies. Hence, in determining that amount, the Group will eliminate the carrying amount of any accumulated amortisation of that goodwill and the corresponding decrease in goodwill. No other adjustments shall be made to the carrying amount of goodwill. The Group will discontinue amortising goodwill arising from prior business combination and the goodwill is tested annually for impairment.
Previously recognised negative goodwill As required under the standard, the carrying amount of all negative goodwill arising from prior business combinations should be derecognised at 1 January 2011 with a corresponding adjustment to the opening balance of retained earnings as at 1 January 2011. The Group did not have any negative goodwill arising from prior business combinations and as such, no adjustment has been made with respect to negative goodwill.
For investments accounted for by applying the equity method As required under this standard, for investments accounted for by applying the equity method and acquired on or after 1 January 2011, the Group will apply this standard in the accounting for:
• any acquired goodwill included in the carrying amount of that investment. Therefore, the Group will
not include any amortisation of that notional goodwill in the determination of the Group's share of the investee's profits or losses.
• any excess included in the carrying amount of the investment of the entity's interest in the net fair value of the investee's identifiable assets, liabilities and contingent liabilities over the cost of the investment. Therefore, the Group will include that excess as income in the determination of the Group's share of the investee's profits or losses in the period in which the investment is acquired.
For investments accounted for by applying the equity method and acquired before 1 January 2011:
• the Group will apply this standard on a prospective basis, from the beginning of the first annual period
beginning on or after 1 January 2011, to any acquired goodwill included in the carrying amount of that investment. Therefore, the Group will, from that date, discontinue including the amortisation of that goodwill in the determination of the Group's share of the investee's profits or losses.
• the Group will derecognise any negative goodwill included in the carrying amount of that investment at the beginning of the first annual period beginning on or after 1 January 2011, with a corresponding adjustment to the opening balance of retained earnings.
The adoption of these new and revised standards and interpretations did not result in significant changes to the Company’s accounting policies and had no material effect on the amounts reported for the current or prior financial periods:
SFAS No. 2 (Revised 2009), “Statement of Cash Flows” SFAS No. 3 (Revised 2010), “Interim Financial Reporting” SFAS No. 7 (Revised 2010), “Related Party Disclosures” SFAS No. 8 (Revised 2010), “Events after the Reporting Period” SFAS No. 12 (Revised 2009), “Interests in Joint Ventures” SFAS No. 15 (Revised 2009), “Investments in Associates” SFAS No. 19 (Revised 2010), “Intangible Assets” SFAS No. 23 (Revised 2010), “Revenue” SFAS No. 25 (Revised 2009), “Accounting Policies, Changes in Accounting Estimates and Errors”
(Expressed in thousand US Dollars, unless otherwise stated)
(continued)
(continued)
SFAS No. 48 (Revised 2009), “Impairment of Assets” SFAS No. 57 (Revised 2009), “Provision, Contingent Liabilities and Contingent Assets” SFAS No. 58 (Revised 2009), “Noncurrent Assets Held for Sale and Discontinued Operations” IFAS No. 7 (Revised 2009), “Consolidation of Special Purpose Entities” IFAS No. 9, “Changes in Existing Decommissioning, Restoration and Similar Liabilities” IFAS No. 10, “Customer Loyalty Programs” IFAS No. 11, “Distributions of NonCash Assets to Owners” IFAS No. 12, “Jointly Controlled EntitiesNon Monetary Contributions by Venturers” IFAS No. 14, “Intangible Assets Web Site Costs” IFAS No. 17, “Interim Financial Reporting and Impairment”
The withdrawals of the following standards and interpretations did not result in significant changes to the Group’s accounting policies and had no material effect on the amounts reported for the current or prior financial year: SFAS No. 6, “Accounting and Reporting for DevelopmentStage Entities” SFAS No. 21, “Accounting for Equity” SFAS No. 40, “Accounting for Changes in Equity of Subsidiaries or Associates” IFAS No. 1, “Determining Market Price of Dividends” IFAS No. 2, “Presentation of Capital in the Balance Sheet and Subscription Receivables” IFAS No. 3, “Accounting for Donations or Endowments”
The following new and revised accounting standards and interpretations have been published and are mandatory for financial years beginning on or after 1 January 2012:
SFAS No. 13 (Revised 2011), “Investment Properties” SFAS No. 16 (Revised 2011), “Property, Plant, and Equipment” SFAS No. 18 (Revised 2010), “Accounting and Reporting by Retirement Benefit Plans” SFAS No. 24 (Revised 2010), “Employee Benefits” SFAS No. 26 (Revised 2011), “Borrowing Costs” SFAS No. 28 (Revised 2010), “Accounting for Loss Insurance” SFAS No. 30 (Revised 2011), “Leases” SFAS No. 33 (Revised 2011), “Stripping Activities and Environmental Management in General Mining” SFAS No. 34 (Revised 2010), “Construction Contracts” SFAS No. 36 (Revised 2010), “Accounting for Life Insurance” SFAS No. 45 (Revised 2010), “Financial Reporting for NonProfit Organizations” SFAS No. 46 (Revised 2010), “Income Taxes” SFAS No. 50 (Revised 2010), “Financial Instruments: Presentation” SFAS No. 53 (Revised 2010), “Sharebased Payments” SFAS No. 55 (Revised 2010), “Financial Instruments: Recognition and Measurement” SFAS No. 56 (Revised 2010), “Earnings per Share” SFAS No. 60, “Financial Instruments: Disclosures” SFAS No. 61, “Accounting for Government Grants and Disclosures of Government Assistance” SFAS No. 62, “Insurance Contracts” SFAS No. 63, “Financial Reporting in Hyperinflationary Economies” SFAS No. 64, “Exploration for and Evaluation of Mineral Resources” IFAS No. 13, “Hedges of a Net Investment in a Foreign Operation” IFAS No. 15, “SFAS No. 24, The Limit on a Defined Benefit Asset, Minimum Funding Requirements and
their Interaction” IFAS No. 16, “Service Concession Arrangements” IFAS No. 18, “Government Assistance No Specific Relation to Operating Activities” IFAS No. 19, “Applying the Restatement Approach under PSAK 63: Financial Reporting in
Hyperinflationary Economies” IFAS No. 20, “Income TaxesChanges in the Tax Status of an Entity or its Shareholders” IFAS No. 21, “Agreements for the Construction of Real Estate” IFAS No. 22, “Service Concession Arrangements: Disclosure” IFAS No. 23, “Operating Leases Incentives” IFAS No. 24 “Evaluating the Substance of Transactions Involving the Legal Form of a Lease” IFAS No. 25, “Land Rights” IFAS No. 26, “Reassessment of Embedded Derivatives”
Adaro Energy Annual Report 2011 www.adaro.com194
(Expressed in thousand US Dollars, unless otherwise stated)
(continued)
(continued)
The following withdrawal of accounting standards and interpretations have been published and are mandatory for the financial year beginning on or after 1 January 2012:
SFAS No. 11 Translation of Financial Statements in Foreign Currencies; SFAS No. 27 Accounting for Cooperatives; SFAS No. 29 Accounting for Oil and Gas; SFAS No. 39 Accounting for Joint Operations; SFAS No. 52 Reporting Currencies; IFAS No. 4 Allowable Alternative Treatment of Foreign Exchange Differences;
The Group is still assessing the impact of these new or revised SFAS and IFAS as well as the withdrawal of the aforementioned standards and interpretations on the consolidated financial statements.
Subsidiaries are all entities (including special purpose entities), over which the Group has the power to govern the financial and operating policies generally accompanying a shareholding of more than half of the voting rights. The existence and effect of potential voting rights that are currently exercisable or convertible are considered when assessing whether the Group controls another entity. Subsidiaries are fully consolidated from the date on which control is transferred to the Group. They are deconsolidated from the date that control ceases.
The Group uses the acquisition method of accounting to account for business combinations. The consideration transferred for the acquisition of a subsidiary comprises the fair values of the assets transferred, the liabilities incurred and the equity interests issued by the Group. The consideration transferred includes the fair value of any asset or liability resulting from a contingent consideration arrangement. Acquisitionrelated costs are expensed as incurred. Identifiable assets acquired and liabilities and contingent liabilities assumed in a business combination are measured initially at their fair values at the acquisition date. On an acquisitionbyacquisition basis, the Group recognises any noncontrolling interests in the acquiree either at fair value or at the noncontrolling interest’s proportionate share of the acquiree’s identifiable net assets.
The excess of the consideration transferred, the amount of any noncontrolling interests in the acquiree and the acquisitiondate fair value of any previous equity interest in the acquiree over the fair value of the Group’s share of the identifiable net assets acquired is recorded as mining properties and/or goodwill. If those amounts are less than the fair value of the net identifiable assets of the subsidiary acquired and the measurement of all amounts has been reviewed, in the case of a bargain purchase, the difference is recognised directly in the consolidated statements of income. Mining properties represent the fair value adjustment of mining properties acquired at the date of acquisition of Adaro and are stated at cost. Mining properties are amortised over the life of the property using the units of production method from the date of the acquisition based on estimated proven and probable reserves. Changes in estimated proven and probable reserves are accounted for on a prospective basis, from the beginning of the period in which the change occurs.
For the accounting policy on goodwill please refer to Note 2l. Intercompany transactions, balances and unrealised gains on transactions between Group companies are eliminated. Unrealised losses are also eliminated. Accounting policies of subsidiaries have been changed where necessary to ensure consistency with the policies adopted by the Group.
(Expressed in thousand US Dollars, unless otherwise stated)
(continued)
(continued)
The Group treats transactions with noncontrolling interests as transactions with equity owners of the Group. For purchases from noncontrolling interests, the difference between any consideration paid and the relevant share acquired of the carrying value of net assets of the subsidiary is recorded in equity. Gains or losses on disposals to noncontrolling interests are also recorded in equity.
When the Group ceases to have control or significant influence, any retained interest in the entity is remeasured to its fair value, with the change in carrying amount recognised in the consolidated statements of income. The fair value is the initial carrying amount, for the purposes of subsequently accounting for the retained interest as an associate, joint venture or financial asset. In addition, any amounts previously recognised in other comprehensive income in respect of that entity are accounted for as if the Group had directly disposed of the related assets or liabilities. This may mean that amounts previously recognised in other comprehensive income are reclassified to the consolidated statements of income.
If the ownership interest in an associate is reduced but significant influence is retained, only a proportionate share of the amounts previously recognised in other comprehensive income is reclassified to the consolidated statements of income where appropriate.
Total comprehensive income is attributed to the owners of the parent and to the noncontrolling interests even if this may result in the noncontrolling interests having a deficit balance.
Items included in the financial statements of each of the Group’s subsidiaries are measured using the currency of the primary economic environment in which the entity operates (the functional currency). The consolidated financial statements are presented in US Dollars, which is the Group’s functional currency.
Foreign exchange gains and losses that relate to borrowings and cash and cash equivalents are presented in the consolidated statements of income within ‘finance income or cost’. All other foreign exchange gains and losses are presented in the consolidated statements of income within ‘foreign exchange gain, net’. Transactions denominated in currencies other than US Dollars are converted into US Dollars at the exchange rate prevailing at the date of the transaction. Foreign exchange gains and losses resulting from the settlement of such transactions and from the translation at yearend exchange rates of monetary assets and liabilities in currencies other than US Dollars are recognised in the consolidated statements of income, except when deferred in other comprehensive income as qualifying cash flow hedges and qualifying net investment hedges.
As at 31 December, the exchange rates used, based on the middle rates published by Bank Indonesia (the Central Bank of Indonesia), were as follows (US Dollars full amount):
Rupiah 10,000 (“Rp”) 1.10 1.11 Great Britain Pound Sterling (“₤”) 1.54 1.55 Singapore Dollars (“S$”) 0.77 0.78 Australian Dollars (“A$”) 1.01 1.02 Euro (“€”) 1.29 1.33 Japanese Yen 100 (“¥”) 1.29 1.23 Changes in the fair value of monetary securities denominated in foreign currency classified as availableforsale are analysed between translation differences resulting from changes in the amortised cost of the security and other changes in the carrying amount of the security. Translation differences related to changes in amortised cost are recognised in the consolidated statements of income and other changes in carrying amount are recognised in other comprehensive income.

Adaro Energy Annual Report 2011www.adaro.com 195
(Expressed in thousand US Dollars, unless otherwise stated)
(continued)
(continued)
The following withdrawal of accounting standards and interpretations have been published and are mandatory for the financial year beginning on or after 1 January 2012:
SFAS No. 11 Translation of Financial Statements in Foreign Currencies; SFAS No. 27 Accounting for Cooperatives; SFAS No. 29 Accounting for Oil and Gas; SFAS No. 39 Accounting for Joint Operations; SFAS No. 52 Reporting Currencies; IFAS No. 4 Allowable Alternative Treatment of Foreign Exchange Differences;
The Group is still assessing the impact of these new or revised SFAS and IFAS as well as the withdrawal of the aforementioned standards and interpretations on the consolidated financial statements.
Subsidiaries are all entities (including special purpose entities), over which the Group has the power to govern the financial and operating policies generally accompanying a shareholding of more than half of the voting rights. The existence and effect of potential voting rights that are currently exercisable or convertible are considered when assessing whether the Group controls another entity. Subsidiaries are fully consolidated from the date on which control is transferred to the Group. They are deconsolidated from the date that control ceases.
The Group uses the acquisition method of accounting to account for business combinations. The consideration transferred for the acquisition of a subsidiary comprises the fair values of the assets transferred, the liabilities incurred and the equity interests issued by the Group. The consideration transferred includes the fair value of any asset or liability resulting from a contingent consideration arrangement. Acquisitionrelated costs are expensed as incurred. Identifiable assets acquired and liabilities and contingent liabilities assumed in a business combination are measured initially at their fair values at the acquisition date. On an acquisitionbyacquisition basis, the Group recognises any noncontrolling interests in the acquiree either at fair value or at the noncontrolling interest’s proportionate share of the acquiree’s identifiable net assets.
The excess of the consideration transferred, the amount of any noncontrolling interests in the acquiree and the acquisitiondate fair value of any previous equity interest in the acquiree over the fair value of the Group’s share of the identifiable net assets acquired is recorded as mining properties and/or goodwill. If those amounts are less than the fair value of the net identifiable assets of the subsidiary acquired and the measurement of all amounts has been reviewed, in the case of a bargain purchase, the difference is recognised directly in the consolidated statements of income. Mining properties represent the fair value adjustment of mining properties acquired at the date of acquisition of Adaro and are stated at cost. Mining properties are amortised over the life of the property using the units of production method from the date of the acquisition based on estimated proven and probable reserves. Changes in estimated proven and probable reserves are accounted for on a prospective basis, from the beginning of the period in which the change occurs.
For the accounting policy on goodwill please refer to Note 2l. Intercompany transactions, balances and unrealised gains on transactions between Group companies are eliminated. Unrealised losses are also eliminated. Accounting policies of subsidiaries have been changed where necessary to ensure consistency with the policies adopted by the Group.
(Expressed in thousand US Dollars, unless otherwise stated)
(continued)
(continued)
The Group treats transactions with noncontrolling interests as transactions with equity owners of the Group. For purchases from noncontrolling interests, the difference between any consideration paid and the relevant share acquired of the carrying value of net assets of the subsidiary is recorded in equity. Gains or losses on disposals to noncontrolling interests are also recorded in equity.
When the Group ceases to have control or significant influence, any retained interest in the entity is remeasured to its fair value, with the change in carrying amount recognised in the consolidated statements of income. The fair value is the initial carrying amount, for the purposes of subsequently accounting for the retained interest as an associate, joint venture or financial asset. In addition, any amounts previously recognised in other comprehensive income in respect of that entity are accounted for as if the Group had directly disposed of the related assets or liabilities. This may mean that amounts previously recognised in other comprehensive income are reclassified to the consolidated statements of income.
If the ownership interest in an associate is reduced but significant influence is retained, only a proportionate share of the amounts previously recognised in other comprehensive income is reclassified to the consolidated statements of income where appropriate.
Total comprehensive income is attributed to the owners of the parent and to the noncontrolling interests even if this may result in the noncontrolling interests having a deficit balance.
Items included in the financial statements of each of the Group’s subsidiaries are measured using the currency of the primary economic environment in which the entity operates (the functional currency). The consolidated financial statements are presented in US Dollars, which is the Group’s functional currency.
Foreign exchange gains and losses that relate to borrowings and cash and cash equivalents are presented in the consolidated statements of income within ‘finance income or cost’. All other foreign exchange gains and losses are presented in the consolidated statements of income within ‘foreign exchange gain, net’. Transactions denominated in currencies other than US Dollars are converted into US Dollars at the exchange rate prevailing at the date of the transaction. Foreign exchange gains and losses resulting from the settlement of such transactions and from the translation at yearend exchange rates of monetary assets and liabilities in currencies other than US Dollars are recognised in the consolidated statements of income, except when deferred in other comprehensive income as qualifying cash flow hedges and qualifying net investment hedges.
As at 31 December, the exchange rates used, based on the middle rates published by Bank Indonesia (the Central Bank of Indonesia), were as follows (US Dollars full amount):
Rupiah 10,000 (“Rp”) 1.10 1.11 Great Britain Pound Sterling (“₤”) 1.54 1.55 Singapore Dollars (“S$”) 0.77 0.78 Australian Dollars (“A$”) 1.01 1.02 Euro (“€”) 1.29 1.33 Japanese Yen 100 (“¥”) 1.29 1.23 Changes in the fair value of monetary securities denominated in foreign currency classified as availableforsale are analysed between translation differences resulting from changes in the amortised cost of the security and other changes in the carrying amount of the security. Translation differences related to changes in amortised cost are recognised in the consolidated statements of income and other changes in carrying amount are recognised in other comprehensive income.

Adaro Energy Annual Report 2011 www.adaro.com196
(Expressed in thousand US Dollars, unless otherwise stated)
(continued)
(continued)
The results of the operations and financial position of all the Group subsidiaries (none of which has the currency of a hyperinflationary economy) that have a functional currency different from the reporting currency are translated into the reporting currency as follows: (a) assets and liabilities for each statement of financial position presented are translated at the closing
rate at the date of that statement of financial position; (b) income and expenses for each the consolidated statements of income are translated at average
exchange rates (unless this average is not a reasonable approximation of the cumulative effect of the rates prevailing on the transaction dates, in which case income and expenses are translated at the rate on the dates of the transactions); and
(c) all resulting exchange differences are recognised in other comprehensive income.
Cash and cash equivalents are cash on hand, cash in banks and time deposits with a maturity period of three months or less at the time of placement and which are not used as collateral or are not restricted.
The consolidated statements of cash flows have been prepared using the direct method by classifying the cash flows on the basis of operating, investing and financing activities. For the purpose of the consolidated statements of cash flows, cash and cash equivalents are presented net of overdrafts.
Trade receivables are amounts due from customers for coal sold or services performed in the ordinary course of business. Trade and other receivables are recognised initially at fair value and subsequently measured at amortised cost using the effective interest method, less provision for impairment. If collection is expected in one year or less (or in the normal operating cycle of the business if longer), they are classified as current assets. If not, they are presented as noncurrent assets.
Coal inventory is valued at the lower of cost or net realisable value. Cost is determined based on the average cost basis and includes an appropriate portion of fixed and variable overheads. Net realisable value is the estimated sales amount in the ordinary course of business less the costs of completion and selling expenses. Spare parts, fuel, lubricants and supplies are valued at cost, determined on an average cost basis, less provision for obsolete and slow moving inventory. A provision for obsolete and slow moving inventory is determined on the basis of estimated future usage or sale of individual inventory items. Supplies of maintenance materials are charged to production costs in the period in which they are used.
Associates are all entities over which the Group has significant influence but not control, generally accompanying a shareholding of between 20% and 50% of voting rights. Investments in associates are accounted for using the equity method of accounting and initially recognised at cost. The Group’s investment in associates includes mining properties and/or goodwill identified at acquisition, net of any accumulated amortisation and impairment loss. Refer to Note 2m for the impairment of nonfinancial assets including mining properties.
Under the equity method, the investment in associate are initially recognised at cost and the carrying amount is increased or decreased to recognise the Group’s share of the profits or losses of the investee or to recognise the share of movement in reserves of the investee after the date of acquisition. Profit distributions (except stock dividends) received from the investee reduce the carrying amount of the investment. The Group’s share of profit or losses is recognised in the consolidated statements of income and its share of other comprehensive income after the date of acquisition is recognised in other comprehensive income.
(Expressed in thousand US Dollars, unless otherwise stated)
(continued)
(continued)
Under the equity method, if the Group's share of losses in an associate equal or exceeding the carrying amount of the investment including any other unsecured receivables, the Group does not recognise further losses, unless it incurred obligations or payments on behalf of the associate.
Unrealised gains on transactions between the Group and its associates are eliminated to the extent of the Group’s interest in the associates. Unrealised losses are also eliminated unless the transaction provides evidence of an impairment of the assets transferred. Accounting policies of associates will be changed where necessary to ensure consistency with the policies adopted by the Group. Dilution gains or losses arising in investments in associates are recognised in the consolidated statements of income. The Group has changed its accounting policy for transactions with noncontrolling interests and the accounting for loss of control or significant influence from 1 January 2011 when revised SFAS No. 4, “Consolidated and Separate Financial Statements”, became effective. The revision to SFAS No. 4 contained consequential amendments to SFAS No. 15, “Investments in Associates” and SFAS No. 12, “Interests in Joint Ventures”.
Previously, when the Group ceased to have control or significant influence over an entity, the carrying amount of the investment at the date of control or significant influence became its cost for the purposes of subsequently accounting for the retained interests as associates, jointly controlled entity or financial assets. On the loss of significant influence, the Group will measure at fair value any investment the Group retains in the former associate provided the associate does not become a subsidiary or a joint venture. The Group will recognise in the consolidated statements of income any differences between: (a) the fair value of any retained investment and any proceeds from disposing of the part interest in the
associate; and (b) the carrying amount of the investment at the date when significant influence is lost. The Group has applied the new policy prospectively to transactions occurring on or after 1 January 2011. As a consequence, no adjustments were necessary to any of the amounts previously recognised in the consolidated financial statements.
The Group classifies its financial assets into the categories of: (i) financial assets at fair value through profit or loss; (ii) heldtomaturity investments; (iii) loans and receivables; and (iv) availableforsale financial assets.
The classification depends on the purpose for which the financial assets were acquired. Management determines the classification of its financial assets at initial recognition. Financial assets are derecognised when the rights to receive cash flows from the investments have expired or have been transferred and the Group has transferred substantially all risks and rewards of ownership.
(i) Financial assets at fair value through profit or loss
Financial assets at fair value through profit or loss are financial assets held for trading. A financial asset is classified in this category if acquired principally for the purpose of selling in the shortterm. Derivatives are also categorised as held for trading unless they are financial guarantee contracts or designated as hedges. Gains or losses arising from changes in fair value of the financial assets are presented in the consolidated statements of income within “other gains/(losses)net” in the period in which they arise. Dividend income from the financial assets at fair value through profit or loss is recognised in the consolidated statements of income as part of other income when the Group’s right to receive payments is established.

Adaro Energy Annual Report 2011www.adaro.com 197
(Expressed in thousand US Dollars, unless otherwise stated)
(continued)
(continued)
The results of the operations and financial position of all the Group subsidiaries (none of which has the currency of a hyperinflationary economy) that have a functional currency different from the reporting currency are translated into the reporting currency as follows: (a) assets and liabilities for each statement of financial position presented are translated at the closing
rate at the date of that statement of financial position; (b) income and expenses for each the consolidated statements of income are translated at average
exchange rates (unless this average is not a reasonable approximation of the cumulative effect of the rates prevailing on the transaction dates, in which case income and expenses are translated at the rate on the dates of the transactions); and
(c) all resulting exchange differences are recognised in other comprehensive income.
Cash and cash equivalents are cash on hand, cash in banks and time deposits with a maturity period of three months or less at the time of placement and which are not used as collateral or are not restricted.
The consolidated statements of cash flows have been prepared using the direct method by classifying the cash flows on the basis of operating, investing and financing activities. For the purpose of the consolidated statements of cash flows, cash and cash equivalents are presented net of overdrafts.
Trade receivables are amounts due from customers for coal sold or services performed in the ordinary course of business. Trade and other receivables are recognised initially at fair value and subsequently measured at amortised cost using the effective interest method, less provision for impairment. If collection is expected in one year or less (or in the normal operating cycle of the business if longer), they are classified as current assets. If not, they are presented as noncurrent assets.
Coal inventory is valued at the lower of cost or net realisable value. Cost is determined based on the average cost basis and includes an appropriate portion of fixed and variable overheads. Net realisable value is the estimated sales amount in the ordinary course of business less the costs of completion and selling expenses. Spare parts, fuel, lubricants and supplies are valued at cost, determined on an average cost basis, less provision for obsolete and slow moving inventory. A provision for obsolete and slow moving inventory is determined on the basis of estimated future usage or sale of individual inventory items. Supplies of maintenance materials are charged to production costs in the period in which they are used.
Associates are all entities over which the Group has significant influence but not control, generally accompanying a shareholding of between 20% and 50% of voting rights. Investments in associates are accounted for using the equity method of accounting and initially recognised at cost. The Group’s investment in associates includes mining properties and/or goodwill identified at acquisition, net of any accumulated amortisation and impairment loss. Refer to Note 2m for the impairment of nonfinancial assets including mining properties.
Under the equity method, the investment in associate are initially recognised at cost and the carrying amount is increased or decreased to recognise the Group’s share of the profits or losses of the investee or to recognise the share of movement in reserves of the investee after the date of acquisition. Profit distributions (except stock dividends) received from the investee reduce the carrying amount of the investment. The Group’s share of profit or losses is recognised in the consolidated statements of income and its share of other comprehensive income after the date of acquisition is recognised in other comprehensive income.
(Expressed in thousand US Dollars, unless otherwise stated)
(continued)
(continued)
Under the equity method, if the Group's share of losses in an associate equal or exceeding the carrying amount of the investment including any other unsecured receivables, the Group does not recognise further losses, unless it incurred obligations or payments on behalf of the associate.
Unrealised gains on transactions between the Group and its associates are eliminated to the extent of the Group’s interest in the associates. Unrealised losses are also eliminated unless the transaction provides evidence of an impairment of the assets transferred. Accounting policies of associates will be changed where necessary to ensure consistency with the policies adopted by the Group. Dilution gains or losses arising in investments in associates are recognised in the consolidated statements of income. The Group has changed its accounting policy for transactions with noncontrolling interests and the accounting for loss of control or significant influence from 1 January 2011 when revised SFAS No. 4, “Consolidated and Separate Financial Statements”, became effective. The revision to SFAS No. 4 contained consequential amendments to SFAS No. 15, “Investments in Associates” and SFAS No. 12, “Interests in Joint Ventures”.
Previously, when the Group ceased to have control or significant influence over an entity, the carrying amount of the investment at the date of control or significant influence became its cost for the purposes of subsequently accounting for the retained interests as associates, jointly controlled entity or financial assets. On the loss of significant influence, the Group will measure at fair value any investment the Group retains in the former associate provided the associate does not become a subsidiary or a joint venture. The Group will recognise in the consolidated statements of income any differences between: (a) the fair value of any retained investment and any proceeds from disposing of the part interest in the
associate; and (b) the carrying amount of the investment at the date when significant influence is lost. The Group has applied the new policy prospectively to transactions occurring on or after 1 January 2011. As a consequence, no adjustments were necessary to any of the amounts previously recognised in the consolidated financial statements.
The Group classifies its financial assets into the categories of: (i) financial assets at fair value through profit or loss; (ii) heldtomaturity investments; (iii) loans and receivables; and (iv) availableforsale financial assets.
The classification depends on the purpose for which the financial assets were acquired. Management determines the classification of its financial assets at initial recognition. Financial assets are derecognised when the rights to receive cash flows from the investments have expired or have been transferred and the Group has transferred substantially all risks and rewards of ownership.
(i) Financial assets at fair value through profit or loss
Financial assets at fair value through profit or loss are financial assets held for trading. A financial asset is classified in this category if acquired principally for the purpose of selling in the shortterm. Derivatives are also categorised as held for trading unless they are financial guarantee contracts or designated as hedges. Gains or losses arising from changes in fair value of the financial assets are presented in the consolidated statements of income within “other gains/(losses)net” in the period in which they arise. Dividend income from the financial assets at fair value through profit or loss is recognised in the consolidated statements of income as part of other income when the Group’s right to receive payments is established.

Adaro Energy Annual Report 2011 www.adaro.com198
(Expressed in thousand US Dollars, unless otherwise stated)
(continued)
(continued)
(continued)
(i) Financial assets at fair value through profit or loss (continued)
Financial assets carried at fair value through profit or loss are initially recognised at fair value and transaction costs are expensed in the consolidated statements of income and subsequently carried at fair value. Assets in this category are classified as current assets if expected to be settled within 12 months; otherwise, they are classified as noncurrent.
(ii) Heldtomaturity investments
Heldtomaturity investments are nonderivative financial assets with fixed or determinable payments and fixed maturities that the Group has the positive intention and ability to hold to maturity, except for: (a) investments that upon initial recognition are designated as financial assets at fair value through
profit or loss; (b) investments that are designated in the category of availableforsale; and (c) investments that meet the definition of loans and receivables. They are included in noncurrent assets unless the investment matures or management intends to dispose of it within 12 months of the end of the reporting period. Heldtomaturity investments are initially recognised at fair value including directly attributable transaction costs and subsequently carried at amortised cost using the effective interest method. Interest on the investments calculated using the effective interest method is recognised in the consolidated statements of income as part of other income.
(iii) Loans and receivables
Loans and receivables are nonderivative financial assets with fixed or determinable payments that are not quoted in an active market. They are included in current assets, except for maturities more than 12 months after the end of the reporting period. These are classified as noncurrent assets. Loans and receivables are initially recognised at fair value including directly attributable transaction costs and subsequently carried at amortised cost using the effective interest method.
(iv) Availableforsale financial assets
Availableforsale financial assets are nonderivative financial assets that are designated as availableforsale or that are not classified as loans or receivables, heldtomaturity investments and financial assets at fair value through profit or loss. They are included in noncurrent assets unless the investment matures or management intends to dispose of them within 12 months of the end of the reporting period.
Availableforsale financial assets are initially recognised at fair value, including directly attributable transaction costs. Subsequently, the financial assets are carried at fair value, with gains or losses recognised in equity, except for impairment losses and foreign exchange gains or losses, until the financial assets are derecognised. If the availableforsale financial assets are impaired, the cumulative gain or loss previously recognised in equity, is recognised in the consolidated statements of income.
Interest on availableforsale securities calculated using the effective interest method is recognised in the consolidated statements of income as part of other income. Dividends on availableforsale equity instruments are recognised in the consolidated statements of income as part of finance income when the Group’s right to receive the payments is established.
(Expressed in thousand US Dollars, unless otherwise stated)
(continued)
(continued)
The Group classifies its financial liabilities into the categories of: (i) financial liabilities at fair value through profit or loss and (ii) financial liabilities carried at amortised cost. The classification depends on the purpose for which the financial liabilities were acquired. Management determines the classification of its financial liabilities at initial recognition. Financial liabilities are derecognised when they are extinguished which is when the obligation specified in the contract is discharged or is cancelled or expires.
(i) Financial liabilities at fair value through profit or loss
Financial liabilities at fair value through profit or loss are financial liabilities held for trading. A financial liability is classified in this category if incurred principally for the purpose of repurchasing it in the shortterm. Financial liabilities carried at fair value through profit or loss are initially recognised at fair value and subsequently carried at fair value, with gains and losses recognised in the consolidated statements of income.
(ii) Financial liabilities carried at amortised cost
Financial liabilities that are not classified as financial liabilities carried at fair value through profit or loss, are initially recognised at fair value less directly attributable transaction costs. Subsequently, the financial liabilities are carried at amortised cost using the effective interest method. They are included in current liabilities, except for maturities more than 12 months after the end of the reporting period. These are classified as noncurrent liabilities.
Gains and losses are recognised in the consolidated statements of income when the financial liabilities are derecognised or impaired, as well as through the amortisation process.
The Group uses widely recognised valuation models for determining fair values of nonstandardised financial instruments of lower complexity, such as fuel hedging and foreign exchange forward contracts. For these financial instruments, inputs into models are generally market observable.
Financial assets and liabilities are offset and the net amount reported in the consolidated statements of financial position when there is a legally enforceable right to offset the recognised amounts and there is an intention to settle on a net basis, or realise the asset and settle the liability simultaneously.
The Group assesses at the statement of financial position date whether there is objective evidence that a financial asset or group of financial assets is impaired. A financial asset or a group of financial assets is impaired and impairment losses are incurred only if there is objective evidence of impairment as a result of one or more events that occurred after the initial recognition of the asset (a “loss event”) and that loss event (or events) has an impact on the estimated future cash flows of the financial asset or group of financial assets that can be reliably estimated.
The criteria that the Group use to determine that there is objective evidence of an impairment loss include: significant financial difficulty of the issuer or obligor; a breach of contract, such as a default or delinquency in interest or principal payments; the lenders, for economic or legal reasons relating to the borrower’s financial difficulty, granting to
the borrower a concession that the lender would not otherwise consider;

Adaro Energy Annual Report 2011www.adaro.com 199
(Expressed in thousand US Dollars, unless otherwise stated)
(continued)
(continued)
(continued)
(i) Financial assets at fair value through profit or loss (continued)
Financial assets carried at fair value through profit or loss are initially recognised at fair value and transaction costs are expensed in the consolidated statements of income and subsequently carried at fair value. Assets in this category are classified as current assets if expected to be settled within 12 months; otherwise, they are classified as noncurrent.
(ii) Heldtomaturity investments
Heldtomaturity investments are nonderivative financial assets with fixed or determinable payments and fixed maturities that the Group has the positive intention and ability to hold to maturity, except for: (a) investments that upon initial recognition are designated as financial assets at fair value through
profit or loss; (b) investments that are designated in the category of availableforsale; and (c) investments that meet the definition of loans and receivables. They are included in noncurrent assets unless the investment matures or management intends to dispose of it within 12 months of the end of the reporting period. Heldtomaturity investments are initially recognised at fair value including directly attributable transaction costs and subsequently carried at amortised cost using the effective interest method. Interest on the investments calculated using the effective interest method is recognised in the consolidated statements of income as part of other income.
(iii) Loans and receivables
Loans and receivables are nonderivative financial assets with fixed or determinable payments that are not quoted in an active market. They are included in current assets, except for maturities more than 12 months after the end of the reporting period. These are classified as noncurrent assets. Loans and receivables are initially recognised at fair value including directly attributable transaction costs and subsequently carried at amortised cost using the effective interest method.
(iv) Availableforsale financial assets
Availableforsale financial assets are nonderivative financial assets that are designated as availableforsale or that are not classified as loans or receivables, heldtomaturity investments and financial assets at fair value through profit or loss. They are included in noncurrent assets unless the investment matures or management intends to dispose of them within 12 months of the end of the reporting period.
Availableforsale financial assets are initially recognised at fair value, including directly attributable transaction costs. Subsequently, the financial assets are carried at fair value, with gains or losses recognised in equity, except for impairment losses and foreign exchange gains or losses, until the financial assets are derecognised. If the availableforsale financial assets are impaired, the cumulative gain or loss previously recognised in equity, is recognised in the consolidated statements of income.
Interest on availableforsale securities calculated using the effective interest method is recognised in the consolidated statements of income as part of other income. Dividends on availableforsale equity instruments are recognised in the consolidated statements of income as part of finance income when the Group’s right to receive the payments is established.
(Expressed in thousand US Dollars, unless otherwise stated)
(continued)
(continued)
The Group classifies its financial liabilities into the categories of: (i) financial liabilities at fair value through profit or loss and (ii) financial liabilities carried at amortised cost. The classification depends on the purpose for which the financial liabilities were acquired. Management determines the classification of its financial liabilities at initial recognition. Financial liabilities are derecognised when they are extinguished which is when the obligation specified in the contract is discharged or is cancelled or expires.
(i) Financial liabilities at fair value through profit or loss
Financial liabilities at fair value through profit or loss are financial liabilities held for trading. A financial liability is classified in this category if incurred principally for the purpose of repurchasing it in the shortterm. Financial liabilities carried at fair value through profit or loss are initially recognised at fair value and subsequently carried at fair value, with gains and losses recognised in the consolidated statements of income.
(ii) Financial liabilities carried at amortised cost
Financial liabilities that are not classified as financial liabilities carried at fair value through profit or loss, are initially recognised at fair value less directly attributable transaction costs. Subsequently, the financial liabilities are carried at amortised cost using the effective interest method. They are included in current liabilities, except for maturities more than 12 months after the end of the reporting period. These are classified as noncurrent liabilities.
Gains and losses are recognised in the consolidated statements of income when the financial liabilities are derecognised or impaired, as well as through the amortisation process.
The Group uses widely recognised valuation models for determining fair values of nonstandardised financial instruments of lower complexity, such as fuel hedging and foreign exchange forward contracts. For these financial instruments, inputs into models are generally market observable.
Financial assets and liabilities are offset and the net amount reported in the consolidated statements of financial position when there is a legally enforceable right to offset the recognised amounts and there is an intention to settle on a net basis, or realise the asset and settle the liability simultaneously.
The Group assesses at the statement of financial position date whether there is objective evidence that a financial asset or group of financial assets is impaired. A financial asset or a group of financial assets is impaired and impairment losses are incurred only if there is objective evidence of impairment as a result of one or more events that occurred after the initial recognition of the asset (a “loss event”) and that loss event (or events) has an impact on the estimated future cash flows of the financial asset or group of financial assets that can be reliably estimated.
The criteria that the Group use to determine that there is objective evidence of an impairment loss include: significant financial difficulty of the issuer or obligor; a breach of contract, such as a default or delinquency in interest or principal payments; the lenders, for economic or legal reasons relating to the borrower’s financial difficulty, granting to
the borrower a concession that the lender would not otherwise consider;

Adaro Energy Annual Report 2011 www.adaro.com200
(Expressed in thousand US Dollars, unless otherwise stated)
(continued)
continued)
(continued)
it becoming probable that the borrower will enter bankruptcy or other financial reorganisation; the disappearance of an active market for that financial asset because of financial difficulties; or observable data indicating that there is a measurable decrease in the estimated future cash flows
from a portfolio of financial assets since the initial recognition of those assets, although the decrease cannot yet be identified with the individual financial assets in the portfolio, including:
• adverse changes in the payment status of borrowers in the portfolio; and • national or local economic conditions that correlate with defaults on the assets in the portfolio.
If there is objective evidence that an impairment loss has been incurred, the amount of the loss is measured as the difference between the asset’s carrying amount and the present value of estimated future cash flows (excluding future credit losses that have not been incurred) discounted at the financial asset’s original effective interest rate. The carrying amount of the asset is reduced either directly or through the use of an allowance account. The amount of the loss is recognised in the consolidated statements of income. If, in a subsequent period, the amount of the impairment loss decreases and the decrease can be related objectively to an event occurring after the impairment was recognised (such as an improvement in the debtor’s credit rating), the previously recognised impairment loss will be reversed either directly or by adjusting an allowance account. The reversal will not result in the carrying of a financial asset that exceeds what the amortised cost would have been had the impairment not been recognised at the date at which the impairment was reversed. The reversal amount will be recognised in the consolidated statements of income.
When a decline in the fair value of an available for sale financial asset has been recognised directly in other comprehensive income within equity and there is objective evidence that the assets are impaired, the cumulative loss that had been recognised in other comprehensive income within equity will be reclassified from other comprehensive income within equity to the consolidated statements of income even though the financial asset has not been derecognised. The amount of the cumulative loss that is reclassified from other comprehensive income within equity to the consolidated statements of income will be the difference between the acquisition cost and the current fair value, less any impairment loss on that financial asset previously recognised in the consolidated statements of income. The impairment losses recognised in the consolidated statements of income for an investment in an equity instrument classified as availableforsale will not be reversed through the consolidated statements of income. If, in a subsequent period, the fair value of a debt instrument classified as availableforsale increases and the increase can be objectively related to an event occurring after the impairment loss was recognised in the consolidated statements of income, the impairment loss is reversed through the consolidated statements of income.
Land is recognised at cost and not depreciated, unless the land has met any of the following criteria: The quality of the land condition is no longer sufficient to be utilised for an entity’s main operations. The main characteristic of the operation is to leave the land and building after completion of the project. Management’s estimate or assurance that extension of renewal of rights cannot be obtained.
In such a case, land is depreciated using the straightline method over the expected useful life of land as follows: period of land utilisation that is expected to be achieved; or period of expected productivity of land; or period of rights, if the rights cannot be renewed or extended or rights are shorter than the period of land
utilisation and period of expected productivity of land.
(Expressed in thousand US Dollars, unless otherwise stated)
(continued)
(continued)
Fixed assets are initially recognised at cost and subsequently carried at cost less accumulated depreciation and accumulated impairment losses.
Fixed assets, except for fixed assets of Adaro, are depreciated using the straightline method to their residual value over the expected useful lives as follows:
Years
Buildings 20 Infrastructure 5 – 30 Operational equipment 6 – 10 Vessels 5 – 20 Project equipment 4 Mining equipment 4 Vehicles 4 Office equipment 4 – 5 The fixed assets of Adaro are depreciated using the straightline method over the lesser of the estimated useful lives of the assets, the life of the mine or the term of the CCA, stated as follows:
Years
Buildings 10 – 20 Machinery, operational equipment and vehicles 3 – 10 Office equipment 10 Crushing and handling facilities 11 – 30 Roads and bridges 11 – 30 Stockpile facilities 17 – 20 Dock facilities 20 Subsequent costs are included in the asset’s carrying amount or recognised as a separate asset, as appropriate, only when it is probable that future economic benefits associated with the item will flow to the Group and the cost of the item can be measured reliably. The carrying amount of the replaced part is derecognised. All other repairs and maintenance are charged to the consolidated statements of income during the financial period in which they are incurred. The assets’ useful lives and residual values are reviewed and adjusted if appropriate, at least at each financial yearend. The effects of any revisions are recognised in the consolidated statements of income, when the changes arise.
For assets which are no longer utilised or sold or surrendered to the Government, the carrying amounts are eliminated from the consolidated financial statements and the resulting gains and losses on the disposal of fixed assets are recognised in the consolidated statements of income. The accumulated costs of the construction of buildings and plants and the installation of machinery are capitalised as construction in progress. These costs are reclassified to the fixed asset accounts when the construction or installation is completed. Depreciation is charged from that date. Interest and other borrowing costs, such as discount fees on loans either directly or indirectly used in financing the construction of a qualifying asset, are capitalised up to the date when construction is complete. For borrowings directly attributable to a qualifying asset, the amount to be capitalised is determined as the actual borrowing costs incurred during the year, less any income earned on the temporary investment of such borrowings. For borrowings that are not directly attributable to a qualifying asset, the amount to be capitalised is determined by applying a capitalisation rate to the amount expended on the qualifying asset. The capitalisation rate is the weightedaverage of the borrowing costs applicable to the total borrowings outstanding during the period, excluding borrowings directly attributable to financing the qualifying asset under construction.

Adaro Energy Annual Report 2011www.adaro.com 201
(Expressed in thousand US Dollars, unless otherwise stated)
(continued)
continued)
(continued)
it becoming probable that the borrower will enter bankruptcy or other financial reorganisation; the disappearance of an active market for that financial asset because of financial difficulties; or observable data indicating that there is a measurable decrease in the estimated future cash flows
from a portfolio of financial assets since the initial recognition of those assets, although the decrease cannot yet be identified with the individual financial assets in the portfolio, including:
• adverse changes in the payment status of borrowers in the portfolio; and • national or local economic conditions that correlate with defaults on the assets in the portfolio.
If there is objective evidence that an impairment loss has been incurred, the amount of the loss is measured as the difference between the asset’s carrying amount and the present value of estimated future cash flows (excluding future credit losses that have not been incurred) discounted at the financial asset’s original effective interest rate. The carrying amount of the asset is reduced either directly or through the use of an allowance account. The amount of the loss is recognised in the consolidated statements of income. If, in a subsequent period, the amount of the impairment loss decreases and the decrease can be related objectively to an event occurring after the impairment was recognised (such as an improvement in the debtor’s credit rating), the previously recognised impairment loss will be reversed either directly or by adjusting an allowance account. The reversal will not result in the carrying of a financial asset that exceeds what the amortised cost would have been had the impairment not been recognised at the date at which the impairment was reversed. The reversal amount will be recognised in the consolidated statements of income.
When a decline in the fair value of an available for sale financial asset has been recognised directly in other comprehensive income within equity and there is objective evidence that the assets are impaired, the cumulative loss that had been recognised in other comprehensive income within equity will be reclassified from other comprehensive income within equity to the consolidated statements of income even though the financial asset has not been derecognised. The amount of the cumulative loss that is reclassified from other comprehensive income within equity to the consolidated statements of income will be the difference between the acquisition cost and the current fair value, less any impairment loss on that financial asset previously recognised in the consolidated statements of income. The impairment losses recognised in the consolidated statements of income for an investment in an equity instrument classified as availableforsale will not be reversed through the consolidated statements of income. If, in a subsequent period, the fair value of a debt instrument classified as availableforsale increases and the increase can be objectively related to an event occurring after the impairment loss was recognised in the consolidated statements of income, the impairment loss is reversed through the consolidated statements of income.
Land is recognised at cost and not depreciated, unless the land has met any of the following criteria: The quality of the land condition is no longer sufficient to be utilised for an entity’s main operations. The main characteristic of the operation is to leave the land and building after completion of the project. Management’s estimate or assurance that extension of renewal of rights cannot be obtained.
In such a case, land is depreciated using the straightline method over the expected useful life of land as follows: period of land utilisation that is expected to be achieved; or period of expected productivity of land; or period of rights, if the rights cannot be renewed or extended or rights are shorter than the period of land
utilisation and period of expected productivity of land.
(Expressed in thousand US Dollars, unless otherwise stated)
(continued)
(continued)
Fixed assets are initially recognised at cost and subsequently carried at cost less accumulated depreciation and accumulated impairment losses.
Fixed assets, except for fixed assets of Adaro, are depreciated using the straightline method to their residual value over the expected useful lives as follows:
Years
Buildings 20 Infrastructure 5 – 30 Operational equipment 6 – 10 Vessels 5 – 20 Project equipment 4 Mining equipment 4 Vehicles 4 Office equipment 4 – 5 The fixed assets of Adaro are depreciated using the straightline method over the lesser of the estimated useful lives of the assets, the life of the mine or the term of the CCA, stated as follows:
Years
Buildings 10 – 20 Machinery, operational equipment and vehicles 3 – 10 Office equipment 10 Crushing and handling facilities 11 – 30 Roads and bridges 11 – 30 Stockpile facilities 17 – 20 Dock facilities 20 Subsequent costs are included in the asset’s carrying amount or recognised as a separate asset, as appropriate, only when it is probable that future economic benefits associated with the item will flow to the Group and the cost of the item can be measured reliably. The carrying amount of the replaced part is derecognised. All other repairs and maintenance are charged to the consolidated statements of income during the financial period in which they are incurred. The assets’ useful lives and residual values are reviewed and adjusted if appropriate, at least at each financial yearend. The effects of any revisions are recognised in the consolidated statements of income, when the changes arise.
For assets which are no longer utilised or sold or surrendered to the Government, the carrying amounts are eliminated from the consolidated financial statements and the resulting gains and losses on the disposal of fixed assets are recognised in the consolidated statements of income. The accumulated costs of the construction of buildings and plants and the installation of machinery are capitalised as construction in progress. These costs are reclassified to the fixed asset accounts when the construction or installation is completed. Depreciation is charged from that date. Interest and other borrowing costs, such as discount fees on loans either directly or indirectly used in financing the construction of a qualifying asset, are capitalised up to the date when construction is complete. For borrowings directly attributable to a qualifying asset, the amount to be capitalised is determined as the actual borrowing costs incurred during the year, less any income earned on the temporary investment of such borrowings. For borrowings that are not directly attributable to a qualifying asset, the amount to be capitalised is determined by applying a capitalisation rate to the amount expended on the qualifying asset. The capitalisation rate is the weightedaverage of the borrowing costs applicable to the total borrowings outstanding during the period, excluding borrowings directly attributable to financing the qualifying asset under construction.

Adaro Energy Annual Report 2011 www.adaro.com202
(Expressed in thousand US Dollars, unless otherwise stated)
(continued)
Goodwill represents the excess of the acquisition cost over the fair value of the Group’s share of the net assets of the acquired subsidiaries at the date of acquisition. Previously, goodwill was amortised over a period of 5 – 20 years using the straightline method. Management determines the estimated useful life of goodwill based on its evaluation at the time of the acquisition, considering various factors inherent to the acquired companies.
As a result of adopting SFAS No. 22 (refer to Note 2b, the Group has applied the new accounting policy prospectively in respect of goodwill whereby goodwill will no longer be amortised but will be tested annually for impairment and carried at cost less impairment.
Assets that have an indefinite useful life for example, goodwill or intangible assets not ready to use are not subject to amortisation and are tested annually for impairment. Assets that are subject to amortisation or depreciation are reviewed for impairment whenever events or changes in circumstances indicate that the carrying amount may not be recoverable. An impairment loss is recognised for the amount by which the asset’s carrying amount exceeds its recoverable amount. The recoverable amount is the higher of an asset’s fair value less costs to sell and value in use. For the purposes of assessing impairment, assets are grouped at the lowest levels for which there are separately identifiable cash flows (cashgenerating units). Nonfinancial assets other than goodwill that have suffered an impairment are reviewed for possible reversal of the impairment at each reporting date.
Trade payables are obligations to pay for goods or services that have been acquired in the ordinary course of business from suppliers. Trade and other payables are recognised initially at fair value and subsequently measured at amortised cost using the effective interest method. Trade and other payables are classified as current liabilities if payment is due within one year or less (or in the normal operating cycle of the business if longer). If not, they are presented as noncurrent liabilities.
Deferred exploration expenditure represents the accumulated costs relating to general investigation, permission and administrative, geology and geophysical, exploration drilling and evaluation, that is incurred to search, discover and evaluate proven reserves in a specific mining area during a specific time period in accordance with statutory regulations.
Exploration expenditure incurred is capitalised and carried forward, on an area of interest basis, provided one of the following conditions is met: (i) such costs are expected to be recouped through successful development and exploitation of the area of
interest or, alternatively, by its sale; or (ii) exploration activities in the area of interest have not yet reached the stage which permits a reasonable
assessment of the existence or otherwise of economically recoverable reserves and active and significant operations in or in relation to the area of interest are continuing.
The ultimate recoupment of deferred exploration expenditure is dependent upon successful development and commercial exploitation or, alternatively, sale of the respective area. Deferred exploration expenditure on each area of interest is reviewed at the end of each accounting period. Exploration expenditure in respect of an area of interest which has been abandoned, or for which a decision has been made by the Group’s Directors against its commercial viability are written off in the period in which the decision is made. Deferred development expenditure represents the accumulated cost relating to administration, land clearing and the cost of opening the mine, that is conducted in the preparation of proven reserves until commercial production.
(Expressed in thousand US Dollars, unless otherwise stated)
(continued)
(continued)
Mine development expenditure and incorporated costs in developing an area of interest prior to the commencement of operations in the respective area, as long as they meet the criteria for deferral, are capitalised.
Deferred exploration and development expenditure is amortised on a straightline basis from the date of commercial production of the respective area of interest over the lesser of the life of the mine and the remaining term of the CCA.
Leases in which a significant portion of the risks and rewards of ownership are retained by the lessor are classified as operating leases. Payments made under operating leases (net of any incentives received from the lessor) are charged to the consolidated statements of income on a straightline basis over the period of the lease. Leases of fixed assets where the Group has substantially all the risks and rewards of ownership are classified as finance leases. Finance leases are capitalised at the lease’s commencement at the lower of the fair value of the leased property or the present value of the minimum lease payments. Each lease payment is allocated between the liability and finance charges so as to achieve a constant rate of interest on the outstanding finance balance. The interest element of the finance cost is charged to the consolidated statements of income over the lease period so as to produce a constant periodic rate of interest on the remaining balance of the liability for each period. Fixed assets acquired under finance leases are depreciated similarly to owned assets. If there is no reasonable certainty that the Group will hold the ownership by the end of the lease term, the asset is depreciated over the shorter of the useful life of the asset and the lease term.
Restoration, rehabilitation and environmental expenditures to be incurred related to remediation of disturbed areas during the production phase are charged to cost of revenue when the obligation arising from the disturbance occurs. Provision for decommissioning, demobilisation and restoration provides for the legal obligations associated with the retirement of property, plant and equipment and other longlived assets that result from the acquisition, construction or development and/or the normal operation of such assets. The retirement of such assets is its other than temporary removal from service including its sale, abandonment, recycling or disposal in some other manner. These obligations are recognised as liabilities when a legal obligation with respect to the retirement of an asset is incurred, with the initial and subsequent measurement of the obligation at the present value of the expenditures expected to be required to settle the obligation using a pretax rate that reflects current market assessments of the time value of money and the risks specific to the obligation. An asset retirement cost equivalent to these liabilities is capitalised as part of the related asset’s carrying value and is subsequently depreciated or depleted over the asset’s useful life. The increase in these obligations due to the passage of time is recognised as interest expense. The changes in the measurement of these obligations that result from changes in the estimated timing or amount of the outflow of resources embodying economic benefits (e.g. cash flows) required to settle the obligation, or a change in the discount rate will be added to or deducted from, the cost of the related asset in the current period. The amount deducted from the cost of the asset should not exceed its carrying amount. If a decrease in the liability exceeds the carrying amount of the asset, the excess is recognised immediately in the consolidated statements of income. If the adjustment results in an addition to the cost of an asset, the Group will consider whether this is an indication that the new carrying amount of the asset may not be fully recoverable. If there is such an indication, the Group will test the asset for impairment by estimating its recoverable amount and will account for any impairment loss incurred, if any.

Adaro Energy Annual Report 2011www.adaro.com 203
(Expressed in thousand US Dollars, unless otherwise stated)
(continued)
Goodwill represents the excess of the acquisition cost over the fair value of the Group’s share of the net assets of the acquired subsidiaries at the date of acquisition. Previously, goodwill was amortised over a period of 5 – 20 years using the straightline method. Management determines the estimated useful life of goodwill based on its evaluation at the time of the acquisition, considering various factors inherent to the acquired companies.
As a result of adopting SFAS No. 22 (refer to Note 2b, the Group has applied the new accounting policy prospectively in respect of goodwill whereby goodwill will no longer be amortised but will be tested annually for impairment and carried at cost less impairment.
Assets that have an indefinite useful life for example, goodwill or intangible assets not ready to use are not subject to amortisation and are tested annually for impairment. Assets that are subject to amortisation or depreciation are reviewed for impairment whenever events or changes in circumstances indicate that the carrying amount may not be recoverable. An impairment loss is recognised for the amount by which the asset’s carrying amount exceeds its recoverable amount. The recoverable amount is the higher of an asset’s fair value less costs to sell and value in use. For the purposes of assessing impairment, assets are grouped at the lowest levels for which there are separately identifiable cash flows (cashgenerating units). Nonfinancial assets other than goodwill that have suffered an impairment are reviewed for possible reversal of the impairment at each reporting date.
Trade payables are obligations to pay for goods or services that have been acquired in the ordinary course of business from suppliers. Trade and other payables are recognised initially at fair value and subsequently measured at amortised cost using the effective interest method. Trade and other payables are classified as current liabilities if payment is due within one year or less (or in the normal operating cycle of the business if longer). If not, they are presented as noncurrent liabilities.
Deferred exploration expenditure represents the accumulated costs relating to general investigation, permission and administrative, geology and geophysical, exploration drilling and evaluation, that is incurred to search, discover and evaluate proven reserves in a specific mining area during a specific time period in accordance with statutory regulations.
Exploration expenditure incurred is capitalised and carried forward, on an area of interest basis, provided one of the following conditions is met: (i) such costs are expected to be recouped through successful development and exploitation of the area of
interest or, alternatively, by its sale; or (ii) exploration activities in the area of interest have not yet reached the stage which permits a reasonable
assessment of the existence or otherwise of economically recoverable reserves and active and significant operations in or in relation to the area of interest are continuing.
The ultimate recoupment of deferred exploration expenditure is dependent upon successful development and commercial exploitation or, alternatively, sale of the respective area. Deferred exploration expenditure on each area of interest is reviewed at the end of each accounting period. Exploration expenditure in respect of an area of interest which has been abandoned, or for which a decision has been made by the Group’s Directors against its commercial viability are written off in the period in which the decision is made. Deferred development expenditure represents the accumulated cost relating to administration, land clearing and the cost of opening the mine, that is conducted in the preparation of proven reserves until commercial production.
(Expressed in thousand US Dollars, unless otherwise stated)
(continued)
(continued)
Mine development expenditure and incorporated costs in developing an area of interest prior to the commencement of operations in the respective area, as long as they meet the criteria for deferral, are capitalised.
Deferred exploration and development expenditure is amortised on a straightline basis from the date of commercial production of the respective area of interest over the lesser of the life of the mine and the remaining term of the CCA.
Leases in which a significant portion of the risks and rewards of ownership are retained by the lessor are classified as operating leases. Payments made under operating leases (net of any incentives received from the lessor) are charged to the consolidated statements of income on a straightline basis over the period of the lease. Leases of fixed assets where the Group has substantially all the risks and rewards of ownership are classified as finance leases. Finance leases are capitalised at the lease’s commencement at the lower of the fair value of the leased property or the present value of the minimum lease payments. Each lease payment is allocated between the liability and finance charges so as to achieve a constant rate of interest on the outstanding finance balance. The interest element of the finance cost is charged to the consolidated statements of income over the lease period so as to produce a constant periodic rate of interest on the remaining balance of the liability for each period. Fixed assets acquired under finance leases are depreciated similarly to owned assets. If there is no reasonable certainty that the Group will hold the ownership by the end of the lease term, the asset is depreciated over the shorter of the useful life of the asset and the lease term.
Restoration, rehabilitation and environmental expenditures to be incurred related to remediation of disturbed areas during the production phase are charged to cost of revenue when the obligation arising from the disturbance occurs. Provision for decommissioning, demobilisation and restoration provides for the legal obligations associated with the retirement of property, plant and equipment and other longlived assets that result from the acquisition, construction or development and/or the normal operation of such assets. The retirement of such assets is its other than temporary removal from service including its sale, abandonment, recycling or disposal in some other manner. These obligations are recognised as liabilities when a legal obligation with respect to the retirement of an asset is incurred, with the initial and subsequent measurement of the obligation at the present value of the expenditures expected to be required to settle the obligation using a pretax rate that reflects current market assessments of the time value of money and the risks specific to the obligation. An asset retirement cost equivalent to these liabilities is capitalised as part of the related asset’s carrying value and is subsequently depreciated or depleted over the asset’s useful life. The increase in these obligations due to the passage of time is recognised as interest expense. The changes in the measurement of these obligations that result from changes in the estimated timing or amount of the outflow of resources embodying economic benefits (e.g. cash flows) required to settle the obligation, or a change in the discount rate will be added to or deducted from, the cost of the related asset in the current period. The amount deducted from the cost of the asset should not exceed its carrying amount. If a decrease in the liability exceeds the carrying amount of the asset, the excess is recognised immediately in the consolidated statements of income. If the adjustment results in an addition to the cost of an asset, the Group will consider whether this is an indication that the new carrying amount of the asset may not be fully recoverable. If there is such an indication, the Group will test the asset for impairment by estimating its recoverable amount and will account for any impairment loss incurred, if any.

Adaro Energy Annual Report 2011 www.adaro.com204
(Expressed in thousand US Dollars, unless otherwise stated)
(continued)
(continued)
(continued)
Provision for environmental issues that may not involve the retirement of an asset, where the Group is a responsible party are recognised when: the Group has a present legal or constructive obligation as a result of past events; it is probable that an outflow of resources will be required to settle the obligation; and the amount has been reliably estimated. Provision is measured at the present value of the expenditures expected to be required to settle the obligation using a pretax rate that reflects current market assessments of the time value of money and the risks specific to the obligation. The increase in the provision due to the passage of time is recognised as interest expense.
Provision for restructuring costs, legal claims and others are recognised when: the Group has a present legal or constructive obligation as a result of past events; it is probable that an outflow of resources will be required to settle the obligation; and the amount has been reliably estimated. Restructuring provision may comprise items such as lease termination penalties and employee termination payments. Provision is not recognised for future operating losses.
Where there are a number of similar obligations, the likelihood that an outflow will be required in settlement is determined by considering the class of obligations as a whole. A provision is recognised even if the likelihood of an outflow with respect to any one item included in the same class of obligations may be small.
Provision is measured at the present value of the expenditures expected to be required to settle the obligation using a pretax rate that reflects current market assessments of the time value of money and the risks specific to the obligation. Increase in the provision due to the passage of time is recognised as interest expense.
Stripping costs are recognised as production costs based on the annual planned stripping ratio. The annual planned stripping ratio is determined based on current knowledge of the disposition of coal resources and is estimated not to be materially different from the long term planned stripping ratio. If the actual stripping ratio exceeds the planned ratio, the excess stripping costs are recorded in the consolidated statements of financial position as deferred stripping costs. If the actual stripping ratio is lower than the planned stripping ratio, the difference is adjusted against the amount of deferred stripping costs carried forward from prior periods or is recognised in the consolidated statements of financial position as accrued stripping costs. Changes in the planned stripping ratio are considered as changes in estimates and are accounted for on a prospective basis. The beginning balance of accrued or deferred stripping costs is amortised on a straightline basis over the remaining mine life, or the remaining term of the CCA, whichever is shorter.
Borrowings are recognised initially at fair value, net of transaction cost incurred. Borrowings are subsequently carried at amortised cost; any difference between the proceeds (net of transaction costs) and the redemption value is recognised in the consolidated statements of income over the period of the borrowings, using the effective interest method for fixed interest rate borrowings and the straightline method for floating rate borrowings.
Fees paid on the establishment of loan facilities are recognised as transaction costs of the loan to the extent that it is probable that some or all of the facility will be drawndown. In this case, the fee is deferred until the drawdown occurs. To the extent that there is no evidence that it is probable that some or all of the facility will be drawndown, the fee is capitalised as a prepayment for liquidity services and amortised over the period of the facility to which it relates.
(Expressed in thousand US Dollars, unless otherwise stated)
(continued)
Pension schemes are classified as either defined contribution plans or defined benefit plans, depending on the economic substance of the plan as derived from its principal terms and conditions. A defined contribution plan is a pension plan under which the Group pays fixed contributions into a separate entity. The Group has no legal or constructive obligations to pay further contributions if the fund does not hold sufficient assets to pay all employees the benefits relating to employee service in the current and prior periods. A defined benefit plan is a pension plan that is not a defined contribution plan. Typically defined benefit plans define an amount of pension benefit that an employee will receive on retirement, usually dependent on one or more factors such as age, years of service and compensation. The Group is required to provide a minimum amount of pension benefit in accordance with Labour Law No. 13/2003 or the Group’s Collective Labour Agreement (the “CLA”), whichever is higher. Since the Labour Law or the CLA sets the formula for determining the minimum amount of benefits, in substance pension plans under the Labour Law or the CLA represent defined benefit plans.
The liability recognised in the consolidated statements of financial position in respect of the defined benefit pension plans is the present value of the defined benefit obligation at the statement of financial position date less the fair value of plan assets, together with adjustments for unrecognised actuarial gains or losses and past service costs. The defined benefit obligation is calculated annually by independent actuaries using the projected unit credit method. The present value of the defined benefit obligation is determined by discounting the estimated future cash outflows using interest rates of high quality government bonds (considering currently there is no deep market for highquality corporate bonds) that are denominated in the currency in which the benefits will be paid and that have terms of maturity approximating the terms of the related pension liability. Expense charged to the consolidated statements of income includes the current service cost, interest expense, amortisation of past service cost and actuarial gains and losses. Pastservice costs are recognised immediately in the consolidated statements of income, unless the changes to the pension plan are conditional on the employees remaining in service for a specified period of time (the vesting period). In this case, the pastservice costs are amortised on a straightline basis over the vesting period.
Actuarial gains and losses arising from experience adjustments and changes in actuarial assumptions, when exceeding 10% of the present value of the defined benefit obligation (before deducting any plan assets) or 10% of the fair value of any plan assets at 31 December, are charged or credited to the consolidated statements of income over the average remaining service lives of the employees participating in the plan.
For defined contribution plans the Group pays contribution to publicly or privately administered pension insurance plans on a mandatory, contractual or voluntary basis. The Group has no further payment obligations once the contributions have been paid. The contributions are recognised as employee benefit expense when they are due. Prepaid contributions are recognised as an asset to the extent that a cash refund or a reduction in the future payments is available.
Termination benefits are payable when an employee’s employment is terminated by the Group before the normal retirement date, or whenever an employee accepts voluntary redundancy in exchange for these benefits. The Group recognises the termination benefits when it is demonstrably committed either to terminating the employment of current employees according to a detailed formal plan without realistic possibility of withdrawal, or to providing termination benefits as a result of an offer made to encourage voluntary redundancy. Benefits falling due more than 12 months after the end of the reporting period are discounted to their present value.
Adaro Energy Annual Report 2011www.adaro.com 205
(Expressed in thousand US Dollars, unless otherwise stated)
(continued)
(continued)
(continued)
Provision for environmental issues that may not involve the retirement of an asset, where the Group is a responsible party are recognised when: the Group has a present legal or constructive obligation as a result of past events; it is probable that an outflow of resources will be required to settle the obligation; and the amount has been reliably estimated. Provision is measured at the present value of the expenditures expected to be required to settle the obligation using a pretax rate that reflects current market assessments of the time value of money and the risks specific to the obligation. The increase in the provision due to the passage of time is recognised as interest expense.
Provision for restructuring costs, legal claims and others are recognised when: the Group has a present legal or constructive obligation as a result of past events; it is probable that an outflow of resources will be required to settle the obligation; and the amount has been reliably estimated. Restructuring provision may comprise items such as lease termination penalties and employee termination payments. Provision is not recognised for future operating losses.
Where there are a number of similar obligations, the likelihood that an outflow will be required in settlement is determined by considering the class of obligations as a whole. A provision is recognised even if the likelihood of an outflow with respect to any one item included in the same class of obligations may be small.
Provision is measured at the present value of the expenditures expected to be required to settle the obligation using a pretax rate that reflects current market assessments of the time value of money and the risks specific to the obligation. Increase in the provision due to the passage of time is recognised as interest expense.
Stripping costs are recognised as production costs based on the annual planned stripping ratio. The annual planned stripping ratio is determined based on current knowledge of the disposition of coal resources and is estimated not to be materially different from the long term planned stripping ratio. If the actual stripping ratio exceeds the planned ratio, the excess stripping costs are recorded in the consolidated statements of financial position as deferred stripping costs. If the actual stripping ratio is lower than the planned stripping ratio, the difference is adjusted against the amount of deferred stripping costs carried forward from prior periods or is recognised in the consolidated statements of financial position as accrued stripping costs. Changes in the planned stripping ratio are considered as changes in estimates and are accounted for on a prospective basis. The beginning balance of accrued or deferred stripping costs is amortised on a straightline basis over the remaining mine life, or the remaining term of the CCA, whichever is shorter.
Borrowings are recognised initially at fair value, net of transaction cost incurred. Borrowings are subsequently carried at amortised cost; any difference between the proceeds (net of transaction costs) and the redemption value is recognised in the consolidated statements of income over the period of the borrowings, using the effective interest method for fixed interest rate borrowings and the straightline method for floating rate borrowings.
Fees paid on the establishment of loan facilities are recognised as transaction costs of the loan to the extent that it is probable that some or all of the facility will be drawndown. In this case, the fee is deferred until the drawdown occurs. To the extent that there is no evidence that it is probable that some or all of the facility will be drawndown, the fee is capitalised as a prepayment for liquidity services and amortised over the period of the facility to which it relates.
(Expressed in thousand US Dollars, unless otherwise stated)
(continued)
Pension schemes are classified as either defined contribution plans or defined benefit plans, depending on the economic substance of the plan as derived from its principal terms and conditions. A defined contribution plan is a pension plan under which the Group pays fixed contributions into a separate entity. The Group has no legal or constructive obligations to pay further contributions if the fund does not hold sufficient assets to pay all employees the benefits relating to employee service in the current and prior periods. A defined benefit plan is a pension plan that is not a defined contribution plan. Typically defined benefit plans define an amount of pension benefit that an employee will receive on retirement, usually dependent on one or more factors such as age, years of service and compensation. The Group is required to provide a minimum amount of pension benefit in accordance with Labour Law No. 13/2003 or the Group’s Collective Labour Agreement (the “CLA”), whichever is higher. Since the Labour Law or the CLA sets the formula for determining the minimum amount of benefits, in substance pension plans under the Labour Law or the CLA represent defined benefit plans.
The liability recognised in the consolidated statements of financial position in respect of the defined benefit pension plans is the present value of the defined benefit obligation at the statement of financial position date less the fair value of plan assets, together with adjustments for unrecognised actuarial gains or losses and past service costs. The defined benefit obligation is calculated annually by independent actuaries using the projected unit credit method. The present value of the defined benefit obligation is determined by discounting the estimated future cash outflows using interest rates of high quality government bonds (considering currently there is no deep market for highquality corporate bonds) that are denominated in the currency in which the benefits will be paid and that have terms of maturity approximating the terms of the related pension liability. Expense charged to the consolidated statements of income includes the current service cost, interest expense, amortisation of past service cost and actuarial gains and losses. Pastservice costs are recognised immediately in the consolidated statements of income, unless the changes to the pension plan are conditional on the employees remaining in service for a specified period of time (the vesting period). In this case, the pastservice costs are amortised on a straightline basis over the vesting period.
Actuarial gains and losses arising from experience adjustments and changes in actuarial assumptions, when exceeding 10% of the present value of the defined benefit obligation (before deducting any plan assets) or 10% of the fair value of any plan assets at 31 December, are charged or credited to the consolidated statements of income over the average remaining service lives of the employees participating in the plan.
For defined contribution plans the Group pays contribution to publicly or privately administered pension insurance plans on a mandatory, contractual or voluntary basis. The Group has no further payment obligations once the contributions have been paid. The contributions are recognised as employee benefit expense when they are due. Prepaid contributions are recognised as an asset to the extent that a cash refund or a reduction in the future payments is available.
Termination benefits are payable when an employee’s employment is terminated by the Group before the normal retirement date, or whenever an employee accepts voluntary redundancy in exchange for these benefits. The Group recognises the termination benefits when it is demonstrably committed either to terminating the employment of current employees according to a detailed formal plan without realistic possibility of withdrawal, or to providing termination benefits as a result of an offer made to encourage voluntary redundancy. Benefits falling due more than 12 months after the end of the reporting period are discounted to their present value.
Adaro Energy Annual Report 2011 www.adaro.com206
(Expressed in thousand US Dollars, unless otherwise stated)
(continued)
The tax expense for the period comprises current and deferred tax. Tax is recognised in the consolidated statements of income, except to the extent that it relates to items recognised in other comprehensive income or directly in equity. In this case, the tax is also recognised in other comprehensive income or directly in equity, respectively. The current income tax charge is calculated on the basis of the tax laws enacted or substantively enacted at the statement of financial position date in the countries where the Company and its subsidiaries operate and generate taxable income. Specific for Adaro, the tax rate used is 45% as stipulated in its CCA. Management periodically evaluates positions taken in tax returns with respect to situations in which applicable tax regulation is subject to interpretation. Where appropriate, it establishes provision based on amounts expected to be paid to the tax authorities. Deferred income tax is recognised, using the liability method, on temporary differences arising between the tax bases of assets and liabilities and their carrying amounts in the consolidated financial statements. However, deferred tax liabilities are not recognised if they arise from the initial recognition of goodwill; deferred income tax is not accounted for if it arises from the initial recognition of an asset or liability in a transaction other than a business combination that at the time of the transaction affects neither accounting nor taxable profit or loss. Deferred income tax is determined, except for Adaro, using tax rates (and laws) that have been enacted or substantially enacted by the statement of financial position date and are expected to apply when the related deferred income tax asset is realised or the deferred income tax liability is settled. The tax rate used by Adaro is, according to the CCA, 35% for the first ten years from the date of the CCA and 45% for subsequent years. Deferred income tax assets are recognised only to the extent that it is probable that future taxable profit will be available against which the temporary differences can be utilised. Deferred income tax is provided on temporary differences arising on investments in subsidiaries and associates, except for deferred income tax liability where the timing of the reversal of the temporary difference is controlled by the Group and it is probable that the temporary difference will not reverse in the foreseeable future. For income which is subject to final tax, income tax expense is recognised proportionally with revenue recognised in the current period. The difference between the amount of final tax payable and the amount charged as current tax for the calculation of profit or loss is recognised as prepaid tax or accrued tax. Amendments to taxation obligations are recorded when an assessment letter is received or, if objected to or appealed against, when the results of the objection or appeal are determined.
Revenue comprises the fair value of the consideration received or receivable for the sale of coal and services rendered in the ordinary course of the Group’s activities. Revenue is shown net of value added tax, returns, rebates and discounts and after eliminating sales within the Group. Revenue from sales of goods is recognised when all the following conditions are met: the Group has transferred to the buyer the significant risks and rewards of ownership of the goods; the Group retains neither continuing managerial involvement nor effective control over the goods sold; the amount of revenue can be measured reliably; it is probable that the economic benefits associated with the transaction will flow to the Group; and the costs incurred or to be incurred with respect to the sales transaction can be measured reliably. When the outcome of a transaction involving the rendering of services can be estimated reliably, revenue associated with the transaction is recognised by reference to the stage of completion of the transaction at the statement of financial position date. The outcome of a transaction can be estimated reliably when all the following conditions are met: the amount of revenue can be measured reliably; it is probable that the economic benefits associated with the transaction will flow to the Group; the stage of completion of the transaction at the statement of financial position date can be measured
reliably; and the costs incurred for the transaction and the costs to complete the transaction, can be measured
reliably.
(Expressed in thousand US Dollars, unless otherwise stated)
(continued) (continued)
When the outcome of a transaction involving the rendering of services cannot be estimated reliably, revenue is recognised only to the extent of the expenses recognised that are recoverable. Expenses are recognised as incurred on an accrual basis.
Derivative financial instruments are initially recognised at fair value on the date at which a derivative contract is entered into and are subsequently remeasured at their fair value. The method of recognising the resulting gain or loss depends on whether the derivative is designated as a hedging instrument and if so the nature of the item being hedged. The Group designates certain derivatives as either (1) a hedge of the exposure to changes in fair value of a recognised asset or liability or an unrecognised firm commitment, or an identified portion of such an asset, liability or firm commitment, that is attributable to a particular risk and could affect profit or loss (fair value hedge); or (2) a hedge of the exposure to variability in cash flows that (i) is attributable to a particular risk associated with a recognised asset or liability or a highly probable forecast transaction and (ii) could affect profit or loss (cash flow hedge).
The Group documents at the inception of the transaction the relationship between hedging instruments and hedged items, as well as its risk management objectives and strategy for undertaking various hedge transactions. The Group also documents its assessment, both at the hedge inception and on an ongoing basis, of whether the derivatives that are used in hedging transactions are highly effective in offsetting changes in fair values or cash flows of hedged items. The full value of a hedging derivative is classified as a noncurrent asset or liability when the remaining maturity of the hedged item is more than 12 months and as a current asset or liability when the remaining maturity of the hedged item is less than 12 months. (i) fair value hedge
Changes in the fair value of derivatives that are designated and qualify as fair value hedges are recognised in the consolidated statements of income, together with any changes in the fair value of the hedged asset or liability that is attributable to the hedged risk. The gain or loss relating to the effective portion of such fair value hedge is recognised in the consolidated statements of income in the similar line of changes in the fair value of the hedge items to which it is charged. The gain or loss relating to the ineffective portion is recognised immediately in the consolidated statements of income within “other expensesnet”.
(ii) cash flow hedge The effective portion of changes in the fair value of derivatives that are designated and qualify as cash flow hedges is recognised in equity within the “fair value reserve” account. The gain or loss relating to the ineffective portion is recognised immediately in the consolidated statements of income within “other expensesnet”. Amounts accumulated in equity are reclassified to the consolidated statements of income in the periods when the hedged item affects the statements of income. The gain or loss relating to the effective portion of the cash flow hedge is recognised in the consolidated statements of income in the similar line of the hedged items to which it is usually charged. The gain or loss relating to the ineffective portion is recognised in the consolidated statements of income within “other gains/(losses)net”. However, when the forecast transaction that is hedged results in the recognition of a nonfinancial asset, the gains and losses previously deferred in equity are transferred from equity and included in the initial measurement of the cost of the asset. When a hedging instrument expires or is sold, or when a hedge no longer meets the criteria for hedge accounting, any cumulative gain or loss existing in equity at that time remains in equity and is recognised when the forecast transaction is ultimately recognised in the consolidated statements of income. When a forecast transaction is no longer expected to occur, the cumulative gain or loss that was reported in equity is immediately transferred to the consolidated statements of income within “other expensesnet”. Changes in the fair value of any derivative instruments that are not designated or do not qualify for hedge accounting are recognised immediately in the consolidated statements of income within “other expensesnet”.

Adaro Energy Annual Report 2011www.adaro.com 207
(Expressed in thousand US Dollars, unless otherwise stated)
(continued)
The tax expense for the period comprises current and deferred tax. Tax is recognised in the consolidated statements of income, except to the extent that it relates to items recognised in other comprehensive income or directly in equity. In this case, the tax is also recognised in other comprehensive income or directly in equity, respectively. The current income tax charge is calculated on the basis of the tax laws enacted or substantively enacted at the statement of financial position date in the countries where the Company and its subsidiaries operate and generate taxable income. Specific for Adaro, the tax rate used is 45% as stipulated in its CCA. Management periodically evaluates positions taken in tax returns with respect to situations in which applicable tax regulation is subject to interpretation. Where appropriate, it establishes provision based on amounts expected to be paid to the tax authorities. Deferred income tax is recognised, using the liability method, on temporary differences arising between the tax bases of assets and liabilities and their carrying amounts in the consolidated financial statements. However, deferred tax liabilities are not recognised if they arise from the initial recognition of goodwill; deferred income tax is not accounted for if it arises from the initial recognition of an asset or liability in a transaction other than a business combination that at the time of the transaction affects neither accounting nor taxable profit or loss. Deferred income tax is determined, except for Adaro, using tax rates (and laws) that have been enacted or substantially enacted by the statement of financial position date and are expected to apply when the related deferred income tax asset is realised or the deferred income tax liability is settled. The tax rate used by Adaro is, according to the CCA, 35% for the first ten years from the date of the CCA and 45% for subsequent years. Deferred income tax assets are recognised only to the extent that it is probable that future taxable profit will be available against which the temporary differences can be utilised. Deferred income tax is provided on temporary differences arising on investments in subsidiaries and associates, except for deferred income tax liability where the timing of the reversal of the temporary difference is controlled by the Group and it is probable that the temporary difference will not reverse in the foreseeable future. For income which is subject to final tax, income tax expense is recognised proportionally with revenue recognised in the current period. The difference between the amount of final tax payable and the amount charged as current tax for the calculation of profit or loss is recognised as prepaid tax or accrued tax. Amendments to taxation obligations are recorded when an assessment letter is received or, if objected to or appealed against, when the results of the objection or appeal are determined.
Revenue comprises the fair value of the consideration received or receivable for the sale of coal and services rendered in the ordinary course of the Group’s activities. Revenue is shown net of value added tax, returns, rebates and discounts and after eliminating sales within the Group. Revenue from sales of goods is recognised when all the following conditions are met: the Group has transferred to the buyer the significant risks and rewards of ownership of the goods; the Group retains neither continuing managerial involvement nor effective control over the goods sold; the amount of revenue can be measured reliably; it is probable that the economic benefits associated with the transaction will flow to the Group; and the costs incurred or to be incurred with respect to the sales transaction can be measured reliably. When the outcome of a transaction involving the rendering of services can be estimated reliably, revenue associated with the transaction is recognised by reference to the stage of completion of the transaction at the statement of financial position date. The outcome of a transaction can be estimated reliably when all the following conditions are met: the amount of revenue can be measured reliably; it is probable that the economic benefits associated with the transaction will flow to the Group; the stage of completion of the transaction at the statement of financial position date can be measured
reliably; and the costs incurred for the transaction and the costs to complete the transaction, can be measured
reliably.
(Expressed in thousand US Dollars, unless otherwise stated)
(continued) (continued)
When the outcome of a transaction involving the rendering of services cannot be estimated reliably, revenue is recognised only to the extent of the expenses recognised that are recoverable. Expenses are recognised as incurred on an accrual basis.
Derivative financial instruments are initially recognised at fair value on the date at which a derivative contract is entered into and are subsequently remeasured at their fair value. The method of recognising the resulting gain or loss depends on whether the derivative is designated as a hedging instrument and if so the nature of the item being hedged. The Group designates certain derivatives as either (1) a hedge of the exposure to changes in fair value of a recognised asset or liability or an unrecognised firm commitment, or an identified portion of such an asset, liability or firm commitment, that is attributable to a particular risk and could affect profit or loss (fair value hedge); or (2) a hedge of the exposure to variability in cash flows that (i) is attributable to a particular risk associated with a recognised asset or liability or a highly probable forecast transaction and (ii) could affect profit or loss (cash flow hedge).
The Group documents at the inception of the transaction the relationship between hedging instruments and hedged items, as well as its risk management objectives and strategy for undertaking various hedge transactions. The Group also documents its assessment, both at the hedge inception and on an ongoing basis, of whether the derivatives that are used in hedging transactions are highly effective in offsetting changes in fair values or cash flows of hedged items. The full value of a hedging derivative is classified as a noncurrent asset or liability when the remaining maturity of the hedged item is more than 12 months and as a current asset or liability when the remaining maturity of the hedged item is less than 12 months. (i) fair value hedge
Changes in the fair value of derivatives that are designated and qualify as fair value hedges are recognised in the consolidated statements of income, together with any changes in the fair value of the hedged asset or liability that is attributable to the hedged risk. The gain or loss relating to the effective portion of such fair value hedge is recognised in the consolidated statements of income in the similar line of changes in the fair value of the hedge items to which it is charged. The gain or loss relating to the ineffective portion is recognised immediately in the consolidated statements of income within “other expensesnet”.
(ii) cash flow hedge The effective portion of changes in the fair value of derivatives that are designated and qualify as cash flow hedges is recognised in equity within the “fair value reserve” account. The gain or loss relating to the ineffective portion is recognised immediately in the consolidated statements of income within “other expensesnet”. Amounts accumulated in equity are reclassified to the consolidated statements of income in the periods when the hedged item affects the statements of income. The gain or loss relating to the effective portion of the cash flow hedge is recognised in the consolidated statements of income in the similar line of the hedged items to which it is usually charged. The gain or loss relating to the ineffective portion is recognised in the consolidated statements of income within “other gains/(losses)net”. However, when the forecast transaction that is hedged results in the recognition of a nonfinancial asset, the gains and losses previously deferred in equity are transferred from equity and included in the initial measurement of the cost of the asset. When a hedging instrument expires or is sold, or when a hedge no longer meets the criteria for hedge accounting, any cumulative gain or loss existing in equity at that time remains in equity and is recognised when the forecast transaction is ultimately recognised in the consolidated statements of income. When a forecast transaction is no longer expected to occur, the cumulative gain or loss that was reported in equity is immediately transferred to the consolidated statements of income within “other expensesnet”. Changes in the fair value of any derivative instruments that are not designated or do not qualify for hedge accounting are recognised immediately in the consolidated statements of income within “other expensesnet”.

Adaro Energy Annual Report 2011 www.adaro.com208
(Expressed in thousand US Dollars, unless otherwise stated)
(continued)
Basic earnings per share is calculated by dividing net income attributable to the equity holder of the Company by the weightedaverage number of ordinary shares outstanding during the period. Diluted earnings per share is calculated by dividing net income attributable to the equity holder of the Company adjusted for interest expense and foreign exchange gains or losses on convertible bonds and its related tax effects, by the weightedaverage number of issued and fully paidup shares during the period, assuming that all options have been exercised and all convertible bonds have been converted.
Operating segments are reported in a manner consistent with the internal reporting provided to the chief operating decisionmaker. The chief operating decisionmaker is responsible for allocating resources, assessing performance of the operating segments and making strategic decisions.
Ordinary shares are classified as equity. Incremental costs directly attributable to the issue of new shares are shown in equity as a deduction, net of tax, from the proceeds.
Restructuring transactions among entities under common control are accounted for using the poolingofinterest method.
The difference between the transfer price and the book value of each restructuring transaction among entities under common control is recorded under the account “difference in value from restructuring transactions of entities under common control” in the equity section of the consolidated statements of financial position. The balance of the account “difference in value from restructuring transactions of entities under common control” can change when: (i) there are reciprocal transactions between entities under common control; (ii) there is quasireorganisation; (iii) under common control status is lost between transacting entities; or (iv) there is a transfer of the assets, liabilities, share or other ownership instruments that has caused the
difference from restructuring transactions of entities under common control to another party that is not under common control.
When changes in the balance of this account result from point (i), the existing balance is nettedoff with the new transaction, hence creating a new balance for the account. When changes in the balance of the account come from point (ii), the balance is used to eliminate or add to the negative retained earnings balance. When changes in the balance of the account come from points (iii) or (iv), the balance is recognised as realised gain or loss.
Dividend distribution to the Group’s shareholders is recognised as a liability in the Group’s consolidated financial statements in the period in which the dividends are declared.
A person or a close member of the person’s family is related to a reporting entity if that person:
(i) has control or joint control over the reporting entity; (ii) has significant influence over the reporting entity; or (iii) is a member of the key management personnel of the reporting entity or of a parent of the reporting
entity.
(Expressed in thousand US Dollars, unless otherwise stated)
(continued)
(continued)
An entity is related to a reporting entity if any of the following conditions applies: (i) The entity and the reporting entity are members of the same group (which means that each parent,
subsidiary and fellow subsidiary is related to the others). (ii) One entity is an associate or joint venture of the other entity (or an associate or joint venture of a
member of a group of which the other entity is a member). (iii) Both entities are joint ventures of the same third party. (iv) One entity is a joint venture of a third entity and the other entity is an associate of the third entity. (v) The entity is a postemployment benefit plan for the benefit of employees of either the reporting entity
or an entity related to the reporting entity. If the reporting entity itself is such a plan, the sponsoring employers are also related to the reporting entity.
(vi) The entity is controlled or jointly controlled by a related person as identified above. (vii) A person that has control or joint control over the reporting entity that has significant influence over the
entity or is a member of the key management personnel of the entity (or of a parent of the entity). All major transactions with related parties are disclosed in the notes to the consolidated financial statements.
On 1 January 2011, the Company changed its reporting currency from Rupiah to US Dollars, its functional currency, due to substantially, if not all:
The Group’s sales and earnings are originated in US Dollars The Group’s expenditure are originated in US Dollars The Group’s financing activities are originated in US Dollars As such, the Board of Directors believe the change will result in a more appropriate presentation of the Group’s transaction in the consolidated financial statements. The change of the Company’s reporting currency has been accounted for in accordance with SFAS No. 10 (Revised 2010) “The Effects of Changes in Foreign Exchange Rates” which should be applied on or after 1 January 2012 but allows early implementation. For comparative purposes, the consolidated financial statements and associated notes as at and for the year ended 31 December 2010 have been remeasured, as though the US Dollar were the reporting currency in that year, using the procedures outlined below: • The Company’s monetary items are converted into US Dollars using the closing rate, while nonmonetary items
including equity are converted using the exchange rate at the date of the transactions; and • Income and expenses are converted using a yearly average rate, except for several transactions which were
converted using the exchange rate at the date of the transactions.

Adaro Energy Annual Report 2011www.adaro.com 209
(Expressed in thousand US Dollars, unless otherwise stated)
(continued)
Basic earnings per share is calculated by dividing net income attributable to the equity holder of the Company by the weightedaverage number of ordinary shares outstanding during the period. Diluted earnings per share is calculated by dividing net income attributable to the equity holder of the Company adjusted for interest expense and foreign exchange gains or losses on convertible bonds and its related tax effects, by the weightedaverage number of issued and fully paidup shares during the period, assuming that all options have been exercised and all convertible bonds have been converted.
Operating segments are reported in a manner consistent with the internal reporting provided to the chief operating decisionmaker. The chief operating decisionmaker is responsible for allocating resources, assessing performance of the operating segments and making strategic decisions.
Ordinary shares are classified as equity. Incremental costs directly attributable to the issue of new shares are shown in equity as a deduction, net of tax, from the proceeds.
Restructuring transactions among entities under common control are accounted for using the poolingofinterest method.
The difference between the transfer price and the book value of each restructuring transaction among entities under common control is recorded under the account “difference in value from restructuring transactions of entities under common control” in the equity section of the consolidated statements of financial position. The balance of the account “difference in value from restructuring transactions of entities under common control” can change when: (i) there are reciprocal transactions between entities under common control; (ii) there is quasireorganisation; (iii) under common control status is lost between transacting entities; or (iv) there is a transfer of the assets, liabilities, share or other ownership instruments that has caused the
difference from restructuring transactions of entities under common control to another party that is not under common control.
When changes in the balance of this account result from point (i), the existing balance is nettedoff with the new transaction, hence creating a new balance for the account. When changes in the balance of the account come from point (ii), the balance is used to eliminate or add to the negative retained earnings balance. When changes in the balance of the account come from points (iii) or (iv), the balance is recognised as realised gain or loss.
Dividend distribution to the Group’s shareholders is recognised as a liability in the Group’s consolidated financial statements in the period in which the dividends are declared.
A person or a close member of the person’s family is related to a reporting entity if that person:
(i) has control or joint control over the reporting entity; (ii) has significant influence over the reporting entity; or (iii) is a member of the key management personnel of the reporting entity or of a parent of the reporting
entity.
(Expressed in thousand US Dollars, unless otherwise stated)
(continued)
(continued)
An entity is related to a reporting entity if any of the following conditions applies: (i) The entity and the reporting entity are members of the same group (which means that each parent,
subsidiary and fellow subsidiary is related to the others). (ii) One entity is an associate or joint venture of the other entity (or an associate or joint venture of a
member of a group of which the other entity is a member). (iii) Both entities are joint ventures of the same third party. (iv) One entity is a joint venture of a third entity and the other entity is an associate of the third entity. (v) The entity is a postemployment benefit plan for the benefit of employees of either the reporting entity
or an entity related to the reporting entity. If the reporting entity itself is such a plan, the sponsoring employers are also related to the reporting entity.
(vi) The entity is controlled or jointly controlled by a related person as identified above. (vii) A person that has control or joint control over the reporting entity that has significant influence over the
entity or is a member of the key management personnel of the entity (or of a parent of the entity). All major transactions with related parties are disclosed in the notes to the consolidated financial statements.
On 1 January 2011, the Company changed its reporting currency from Rupiah to US Dollars, its functional currency, due to substantially, if not all:
The Group’s sales and earnings are originated in US Dollars The Group’s expenditure are originated in US Dollars The Group’s financing activities are originated in US Dollars As such, the Board of Directors believe the change will result in a more appropriate presentation of the Group’s transaction in the consolidated financial statements. The change of the Company’s reporting currency has been accounted for in accordance with SFAS No. 10 (Revised 2010) “The Effects of Changes in Foreign Exchange Rates” which should be applied on or after 1 January 2012 but allows early implementation. For comparative purposes, the consolidated financial statements and associated notes as at and for the year ended 31 December 2010 have been remeasured, as though the US Dollar were the reporting currency in that year, using the procedures outlined below: • The Company’s monetary items are converted into US Dollars using the closing rate, while nonmonetary items
including equity are converted using the exchange rate at the date of the transactions; and • Income and expenses are converted using a yearly average rate, except for several transactions which were
converted using the exchange rate at the date of the transactions.
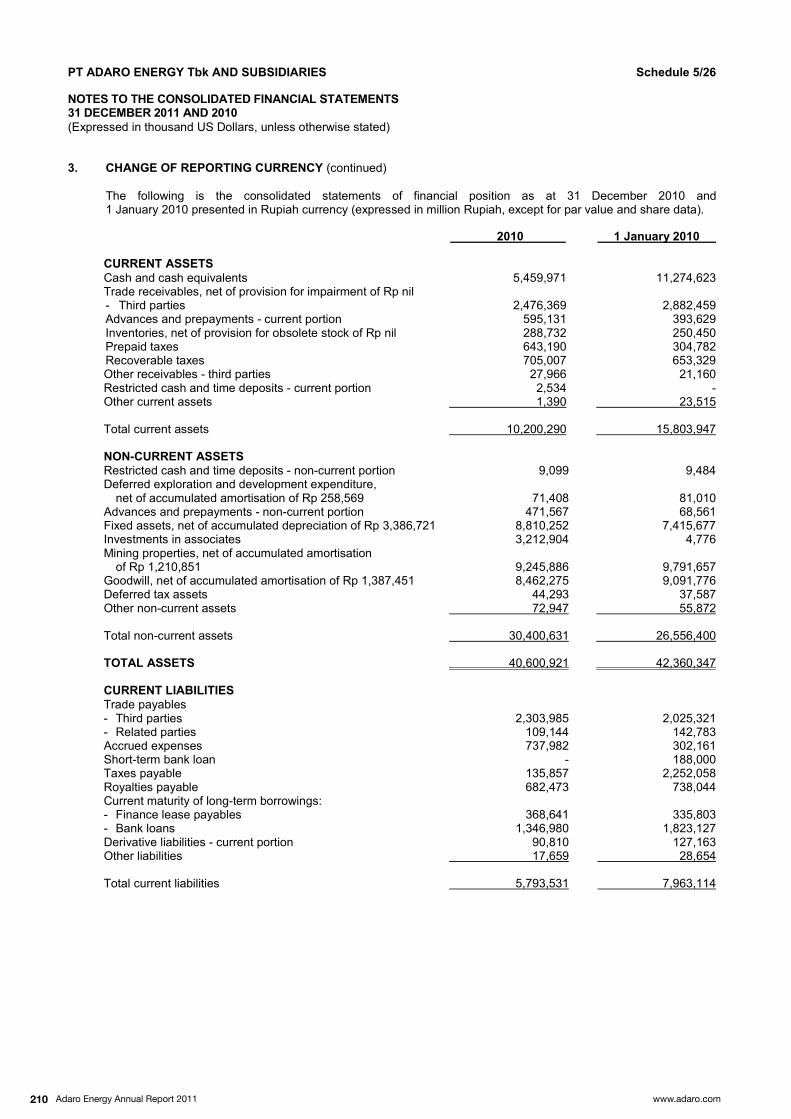
Adaro Energy Annual Report 2011 www.adaro.com210
(Expressed in thousand US Dollars, unless otherwise stated)
(continued)
The following is the consolidated statements of financial position as at 31 December 2010 and 1 January 2010 presented in Rupiah currency (expressed in million Rupiah, except for par value and share data).
Cash and cash equivalents 5,459,971 11,274,623 Trade receivables, net of provision for impairment of Rp nil Third parties 2,476,369 2,882,459 Advances and prepayments current portion 595,131 393,629 Inventories, net of provision for obsolete stock of Rp nil 288,732 250,450 Prepaid taxes 643,190 304,782 Recoverable taxes 705,007 653,329 Other receivables third parties 27,966 21,160 Restricted cash and time deposits current portion 2,534 Other current assets 1,390 23,515 Total current assets 10,200,290 15,803,947 Restricted cash and time deposits noncurrent portion 9,099 9,484 Deferred exploration and development expenditure, net of accumulated amortisation of Rp 258,569 71,408 81,010 Advances and prepayments noncurrent portion 471,567 68,561 Fixed assets, net of accumulated depreciation of Rp 3,386,721 8,810,252 7,415,677 Investments in associates 3,212,904 4,776 Mining properties, net of accumulated amortisation of Rp 1,210,851 9,245,886 9,791,657 Goodwill, net of accumulated amortisation of Rp 1,387,451 8,462,275 9,091,776 Deferred tax assets 44,293 37,587 Other noncurrent assets 72,947 55,872 Total noncurrent assets 30,400,631 26,556,400 40,600,921 42,360,347
Trade payables Third parties 2,303,985 2,025,321 Related parties 109,144 142,783 Accrued expenses 737,982 302,161 Shortterm bank loan 188,000 Taxes payable 135,857 2,252,058 Royalties payable 682,473 738,044 Current maturity of longterm borrowings: Finance lease payables 368,641 335,803 Bank loans 1,346,980 1,823,127 Derivative liabilities current portion 90,810 127,163 Other liabilities 17,659 28,654 Total current liabilities 5,793,531 7,963,114
(Expressed in thousand US Dollars, unless otherwise stated)
(continued)
Longterm borrowings, net of current maturities: Finance lease payables 429,406 475,755 Bank loans 5,102,587 5,548,196 Senior Notes 7,068,256 7,379,848 Derivative liabilities noncurrent portion 55,127 40,505 Accrued stripping costs 308,425 365,980 Deferred tax liabilities 2,981,363 2,933,399 Amounts due to a related party 4,495 4,700 Provision for employee benefits 142,191 90,419 Provision for mine reclamation 46,354 27,784 Provision for mine closure 38,634 18,713 Total noncurrent liabilities 16,176,838 16,885,299
Share capital authorised 80,000,000,000 shares; issued and fully paidup 31,985,962,000 shares with par value of Rp 100 per share 3,198,596 3,198,596 Additional paidincapital 10,732,663 10,732,663 Difference in value from restructuring transactions of entities under common control (191,843) (191,843) Other reserves: Exchange difference due to financial statement translation (440,097) (214,163) Difference from equity changes in subsidiaries and associates 4,188 4,188 Fair value reserve (103,683) (112,677) Retained earnings Appropriated 262,723 44,360 Unappropriated 5,113,894 3,983,767 18,576,441 17,444,891 Noncontrolling interests 54,111 67,043 Total equity 18,630,552 17,511,934 40,600,921 42,360,347

Adaro Energy Annual Report 2011www.adaro.com 211
(Expressed in thousand US Dollars, unless otherwise stated)
(continued)
The following is the consolidated statements of financial position as at 31 December 2010 and 1 January 2010 presented in Rupiah currency (expressed in million Rupiah, except for par value and share data).
Cash and cash equivalents 5,459,971 11,274,623 Trade receivables, net of provision for impairment of Rp nil Third parties 2,476,369 2,882,459 Advances and prepayments current portion 595,131 393,629 Inventories, net of provision for obsolete stock of Rp nil 288,732 250,450 Prepaid taxes 643,190 304,782 Recoverable taxes 705,007 653,329 Other receivables third parties 27,966 21,160 Restricted cash and time deposits current portion 2,534 Other current assets 1,390 23,515 Total current assets 10,200,290 15,803,947 Restricted cash and time deposits noncurrent portion 9,099 9,484 Deferred exploration and development expenditure, net of accumulated amortisation of Rp 258,569 71,408 81,010 Advances and prepayments noncurrent portion 471,567 68,561 Fixed assets, net of accumulated depreciation of Rp 3,386,721 8,810,252 7,415,677 Investments in associates 3,212,904 4,776 Mining properties, net of accumulated amortisation of Rp 1,210,851 9,245,886 9,791,657 Goodwill, net of accumulated amortisation of Rp 1,387,451 8,462,275 9,091,776 Deferred tax assets 44,293 37,587 Other noncurrent assets 72,947 55,872 Total noncurrent assets 30,400,631 26,556,400 40,600,921 42,360,347
Trade payables Third parties 2,303,985 2,025,321 Related parties 109,144 142,783 Accrued expenses 737,982 302,161 Shortterm bank loan 188,000 Taxes payable 135,857 2,252,058 Royalties payable 682,473 738,044 Current maturity of longterm borrowings: Finance lease payables 368,641 335,803 Bank loans 1,346,980 1,823,127 Derivative liabilities current portion 90,810 127,163 Other liabilities 17,659 28,654 Total current liabilities 5,793,531 7,963,114
(Expressed in thousand US Dollars, unless otherwise stated)
(continued)
Longterm borrowings, net of current maturities: Finance lease payables 429,406 475,755 Bank loans 5,102,587 5,548,196 Senior Notes 7,068,256 7,379,848 Derivative liabilities noncurrent portion 55,127 40,505 Accrued stripping costs 308,425 365,980 Deferred tax liabilities 2,981,363 2,933,399 Amounts due to a related party 4,495 4,700 Provision for employee benefits 142,191 90,419 Provision for mine reclamation 46,354 27,784 Provision for mine closure 38,634 18,713 Total noncurrent liabilities 16,176,838 16,885,299
Share capital authorised 80,000,000,000 shares; issued and fully paidup 31,985,962,000 shares with par value of Rp 100 per share 3,198,596 3,198,596 Additional paidincapital 10,732,663 10,732,663 Difference in value from restructuring transactions of entities under common control (191,843) (191,843) Other reserves: Exchange difference due to financial statement translation (440,097) (214,163) Difference from equity changes in subsidiaries and associates 4,188 4,188 Fair value reserve (103,683) (112,677) Retained earnings Appropriated 262,723 44,360 Unappropriated 5,113,894 3,983,767 18,576,441 17,444,891 Noncontrolling interests 54,111 67,043 Total equity 18,630,552 17,511,934 40,600,921 42,360,347

Adaro Energy Annual Report 2011 www.adaro.com212
(Expressed in thousand US Dollars, unless otherwise stated)
(continued) The following is the consolidated statement of income for the year ended 31 December 2010 presented in Rupiah
currency (expressed in million Rupiah, except for basic earnings per share).
24,689,333 (16,957,291) 7,732,042 Selling and marketing (497,646) General and administrative (460,118) Total operating expenses (957,764) 6,774,278 Finance costs (1,048,252) Finance income 42,377 Loss on disposal of fixed assets (51,235) Foreign exchange loss, net (28,286) Share in net loss of associates (13,485) Amortisation of goodwill (490,045) Other expenses, net (135,434) (1,724,360) 5,049,918 Income tax expense (2,668,668) 2,381,250 Extraordinary item, net of tax (171,544) 2,209,706 Preacquisition loss 200 2,209,906 Minority interest in net income of subsidiaries (2,593) 2,207,313 69,0
(Expressed in thousand US Dollars, unless otherwise stated)
The preparation of consolidated financial statements in conformity with Indonesian Financial Accounting Standards requires management to make estimates and assumptions that affect the reported amounts of assets and liabilities and disclosure of contingent assets and liabilities at the date of the consolidated financial statements and the reported amounts of revenue and expenses during the reporting period. Estimates, assumptions and judgements are continually evaluated and are based on historical experience and other factors, including expectations of future events that are believed to be reasonable under the circumstances. The Group has identified the following critical accounting policies under which significant judgements, estimates and assumptions are made and where actual results may differ from these estimates under different assumptions and conditions and may materially affect financial results or the financial position reported in future periods. Reserve estimates
Reserves are estimates of the amount of product that can be economically and legally extracted from the Group’s properties. The Group determines and reports its coal reserves under the principles incorporated in the Code for Reporting of Mineral Resources and Ore Reserves (the “JORC Code”). In order to estimate coal reserves, assumptions are required about a range of geological, technical and economic factors, including quantities, production techniques, stripping ratio, production costs, transport costs, commodity demand, commodity prices and exchange rates. Estimating the quantity and/or calorific value of coal reserves requires the size, shape and depth of coal bodies or fields to be determined by analysing geological data such as drilling samples. This process may require complex and difficult geological judgements to interpret the data.
Because the economic assumptions used to estimate reserves change from period to period and because additional geological data is generated during the course of operations, estimates of reserves may change from period to period. Changes in reported reserves may affect the Group’s financial results and financial position in a number of ways, including the following:
• Asset carrying values may be affected due to changes in estimated future cash flows. • Depreciation, depletion and amortisation charged in the consolidated statements of income may change
where such changes are determined on a unitofproduction basis or where the useful economic lives of assets change.
• Overburden removal costs recorded in the the consolidated statements of financial position or charged to the statements of income may change due to changes in stripping ratios.
• Decommissioning, site restoration and environmental provision may change where changes in estimated reserves affect expectations about the timing or cost of these activities.
• The carrying value of deferred tax assets/liabilities may change due to changes in estimates of the likely recovery of the tax benefits.
Deferred stripping costs
Stripping of waste materials takes place throughout the production stage of the mine or pit. Some mining companies expense their production stage stripping costs as incurred, while others defer such stripping costs. In operations that experience material fluctuations in the ratio of waste materials to ore or contained minerals on a year to year basis over the life of the mine or pit, deferral of stripping costs reduces the volatility of the cost of stripping expensed in individual reporting periods. Those mining companies that expense stripping costs as incurred will therefore report greater volatility in the results of their operations from period to period.
The life of mine or pit wastetoore ratio is a function of an individual mine’s pit design and therefore changes to that design will generally result in changes to the ratio. Changes in other technical or economic parameters that have an impact on reserves will also have an impact on the life of mine or pit ratio even if they do not affect the mine or pit design. Changes to the life of mine or pit ratio are accounted for prospectively. The Group’s determination of whether multiple pit mines are considered separate or integrated operations depends on each mine’s specific circumstances and the analysis requires judgement. Another company could make the determination that a mine is separate or integrated differently than the Group, even if the fact pattern appears to be similar. To the extent that the determination is different, the resulting accounting would also be different.
Adaro Energy Annual Report 2011www.adaro.com 213
(Expressed in thousand US Dollars, unless otherwise stated)
(continued) The following is the consolidated statement of income for the year ended 31 December 2010 presented in Rupiah
currency (expressed in million Rupiah, except for basic earnings per share).
24,689,333 (16,957,291) 7,732,042 Selling and marketing (497,646) General and administrative (460,118) Total operating expenses (957,764) 6,774,278 Finance costs (1,048,252) Finance income 42,377 Loss on disposal of fixed assets (51,235) Foreign exchange loss, net (28,286) Share in net loss of associates (13,485) Amortisation of goodwill (490,045) Other expenses, net (135,434) (1,724,360) 5,049,918 Income tax expense (2,668,668) 2,381,250 Extraordinary item, net of tax (171,544) 2,209,706 Preacquisition loss 200 2,209,906 Minority interest in net income of subsidiaries (2,593) 2,207,313 69,0
(Expressed in thousand US Dollars, unless otherwise stated)
The preparation of consolidated financial statements in conformity with Indonesian Financial Accounting Standards requires management to make estimates and assumptions that affect the reported amounts of assets and liabilities and disclosure of contingent assets and liabilities at the date of the consolidated financial statements and the reported amounts of revenue and expenses during the reporting period. Estimates, assumptions and judgements are continually evaluated and are based on historical experience and other factors, including expectations of future events that are believed to be reasonable under the circumstances. The Group has identified the following critical accounting policies under which significant judgements, estimates and assumptions are made and where actual results may differ from these estimates under different assumptions and conditions and may materially affect financial results or the financial position reported in future periods. Reserve estimates
Reserves are estimates of the amount of product that can be economically and legally extracted from the Group’s properties. The Group determines and reports its coal reserves under the principles incorporated in the Code for Reporting of Mineral Resources and Ore Reserves (the “JORC Code”). In order to estimate coal reserves, assumptions are required about a range of geological, technical and economic factors, including quantities, production techniques, stripping ratio, production costs, transport costs, commodity demand, commodity prices and exchange rates. Estimating the quantity and/or calorific value of coal reserves requires the size, shape and depth of coal bodies or fields to be determined by analysing geological data such as drilling samples. This process may require complex and difficult geological judgements to interpret the data.
Because the economic assumptions used to estimate reserves change from period to period and because additional geological data is generated during the course of operations, estimates of reserves may change from period to period. Changes in reported reserves may affect the Group’s financial results and financial position in a number of ways, including the following:
• Asset carrying values may be affected due to changes in estimated future cash flows. • Depreciation, depletion and amortisation charged in the consolidated statements of income may change
where such changes are determined on a unitofproduction basis or where the useful economic lives of assets change.
• Overburden removal costs recorded in the the consolidated statements of financial position or charged to the statements of income may change due to changes in stripping ratios.
• Decommissioning, site restoration and environmental provision may change where changes in estimated reserves affect expectations about the timing or cost of these activities.
• The carrying value of deferred tax assets/liabilities may change due to changes in estimates of the likely recovery of the tax benefits.
Deferred stripping costs
Stripping of waste materials takes place throughout the production stage of the mine or pit. Some mining companies expense their production stage stripping costs as incurred, while others defer such stripping costs. In operations that experience material fluctuations in the ratio of waste materials to ore or contained minerals on a year to year basis over the life of the mine or pit, deferral of stripping costs reduces the volatility of the cost of stripping expensed in individual reporting periods. Those mining companies that expense stripping costs as incurred will therefore report greater volatility in the results of their operations from period to period.
The life of mine or pit wastetoore ratio is a function of an individual mine’s pit design and therefore changes to that design will generally result in changes to the ratio. Changes in other technical or economic parameters that have an impact on reserves will also have an impact on the life of mine or pit ratio even if they do not affect the mine or pit design. Changes to the life of mine or pit ratio are accounted for prospectively. The Group’s determination of whether multiple pit mines are considered separate or integrated operations depends on each mine’s specific circumstances and the analysis requires judgement. Another company could make the determination that a mine is separate or integrated differently than the Group, even if the fact pattern appears to be similar. To the extent that the determination is different, the resulting accounting would also be different.

Adaro Energy Annual Report 2011 www.adaro.com214
(Expressed in thousand US Dollars, unless otherwise stated)
(continued)
Impairment of nonfinancial assets
In accordance with the Group’s accounting policy, each asset or cash generating unit is evaluated for every reporting period to determine whether there are any indications of impairment. If any such indication exists, a formal estimate of recoverable amount is performed and an impairment loss recognised to the extent that the carrying amount exceeds the recoverable amount. The recoverable amount of an asset or cash generating group of assets is measured at the higher of fair value less costs to sell or value in use.
Assets that have an indefinite useful life for example, goodwill or intangible assets not ready to use are not subject to amortisation and are tested annually for impairment. The recoverable amounts of cash generating units have been determined based on the greater of an asset’s fair value less costs to sell or value in use.
The determination of fair value and value in use requires management to make estimates and assumptions about expected production and sales volumes, commodity prices (considering current and historical prices, price trends and related factors), reserves (see ‘Reserve Estimates’ above), operating costs, closure and rehabilitation costs and future capital expenditure. These estimates and assumptions are subject to risk and uncertainty; hence there is a possibility that changes in circumstances will alter these projections, which may have an impact on the recoverable amount of the assets. In such circumstances, some or all of the carrying value of the assets may be further impaired or the impairment charge reduced with the impact recorded in the consolidated statements of income.
Income taxes
Judgement and assumptions are required in determining the capital allowances and deductibility of certain expenses during the estimation of the provision for income taxes for each company within the Group. In particular, the calculation of Adaro income tax expense involves the interpretation of applicable tax laws and regulations including Adaro’s CCA. There are many transactions and calculations for which the ultimate tax determination is uncertain during the ordinary course of business. The resolution of tax positions taken by each company within the Group can take several years to complete and in some cases it is difficult to predict the ultimate outcome. Where the final tax outcome of these matters is different from the amounts that were initially recorded, such differences will have an impact on the income tax and deferred income tax provision in the period in which such a determination is made.
Deferred tax assets, including those arising from unrecouped tax losses, capital allowances and temporary differences, are recognised only where it is considered more likely than not that they will be recovered, which is dependent on the generation of sufficient future taxable profits. Assumptions about the generation of future taxable profits depend on management’s estimates of future cash flows. These depend on estimates of future production, sales volumes or sales of service, commodity prices, reserves, operating costs, closure and rehabilitation costs, capital expenditure, dividends and other capital management transactions.
There is an uncertainty about the recoverability of value added taxes input and vehicle fuel tax (refer to Note
34b).
On 27 January 2010, ATA acquired an additional 20% interest in JCI for US$10,000. From this transaction, the Company’s direct and indirect interest in SIS and APM increased from 97.18% to 100%. The details of the net assets acquired and goodwill are as follows:
Purchase consideration through cash payment 10,000 Fair value of net assets acquired (1,639) Goodwill 8,361
* As restated (refer to Note 3)
(Expressed in thousand US Dollars, unless otherwise stated)
(continued)
On 22 October 2010, Ariane Investments (Australia) Pty Ltd and Indonesia Coal Pty Ltd were deregistered
from the Australian Securities & Investments Commission, in relation to the liquidation of both companies.
On 30 November 2010, PT Sarana Multi Persada and ATA acquired 100% interest in PBMM for Rp 400 million (or equivalent to US$42).
Purchase consideration through cash payment 42 Fair value of net assets acquired (5) Goodwill 37 Details of assets and liabilities arising from the acquisition are as follows: Cash and cash equivalents 5 Other assets Net assets acquired 5 Goodwill 37 Purchase consideration through cash payment 42 Cash and cash equivalents in PBMM (5) Net cash outflow from acquisition of subsidiary 37 From this transaction, the Group recognised preacquisition losses amounting to US$21 in the consolidated financial statements for the year ended 31 December 2010.
On 17 December 2010, the Company and ATA established PT Adaro Power, each with ownership of 50%, from capital injection of Rp 30 million (or equivalent to US$3), respectively. The establishment deed was approved by the Minister of Law and Human Rights of the Republic of Indonesia on 28 December 2010.
On 10 March 2011, the Company and ATA established PT Rehabilitasi Lingkungan Indonesia with ownership of 0.008% and 99.992%, respectively, from capital injection of Rp 1 million (or equivalent to US$110, full amount) and Rp 12,499 million (or equivalent to US$1,380), respectively. The establishment deed has been approved by the Minister of Law and Human Rights of the Republic of Indonesia on 15 March 2011.
On 1 July 2011, PT Adaro Logistics acquired 85% interest in IMPT for Rp 2,125 million (or equivalent to US$247). This acquisition has been accounted for as purchase of assets.
Purchase consideration through cash payment 247 Fair value of net liabilities acquired 1,261 Intangible asset 1,508
* As restated (refer to Note 3)

Adaro Energy Annual Report 2011www.adaro.com 215
(Expressed in thousand US Dollars, unless otherwise stated)
(continued)
Impairment of nonfinancial assets
In accordance with the Group’s accounting policy, each asset or cash generating unit is evaluated for every reporting period to determine whether there are any indications of impairment. If any such indication exists, a formal estimate of recoverable amount is performed and an impairment loss recognised to the extent that the carrying amount exceeds the recoverable amount. The recoverable amount of an asset or cash generating group of assets is measured at the higher of fair value less costs to sell or value in use.
Assets that have an indefinite useful life for example, goodwill or intangible assets not ready to use are not subject to amortisation and are tested annually for impairment. The recoverable amounts of cash generating units have been determined based on the greater of an asset’s fair value less costs to sell or value in use.
The determination of fair value and value in use requires management to make estimates and assumptions about expected production and sales volumes, commodity prices (considering current and historical prices, price trends and related factors), reserves (see ‘Reserve Estimates’ above), operating costs, closure and rehabilitation costs and future capital expenditure. These estimates and assumptions are subject to risk and uncertainty; hence there is a possibility that changes in circumstances will alter these projections, which may have an impact on the recoverable amount of the assets. In such circumstances, some or all of the carrying value of the assets may be further impaired or the impairment charge reduced with the impact recorded in the consolidated statements of income.
Income taxes
Judgement and assumptions are required in determining the capital allowances and deductibility of certain expenses during the estimation of the provision for income taxes for each company within the Group. In particular, the calculation of Adaro income tax expense involves the interpretation of applicable tax laws and regulations including Adaro’s CCA. There are many transactions and calculations for which the ultimate tax determination is uncertain during the ordinary course of business. The resolution of tax positions taken by each company within the Group can take several years to complete and in some cases it is difficult to predict the ultimate outcome. Where the final tax outcome of these matters is different from the amounts that were initially recorded, such differences will have an impact on the income tax and deferred income tax provision in the period in which such a determination is made.
Deferred tax assets, including those arising from unrecouped tax losses, capital allowances and temporary differences, are recognised only where it is considered more likely than not that they will be recovered, which is dependent on the generation of sufficient future taxable profits. Assumptions about the generation of future taxable profits depend on management’s estimates of future cash flows. These depend on estimates of future production, sales volumes or sales of service, commodity prices, reserves, operating costs, closure and rehabilitation costs, capital expenditure, dividends and other capital management transactions.
There is an uncertainty about the recoverability of value added taxes input and vehicle fuel tax (refer to Note
34b).
On 27 January 2010, ATA acquired an additional 20% interest in JCI for US$10,000. From this transaction, the Company’s direct and indirect interest in SIS and APM increased from 97.18% to 100%. The details of the net assets acquired and goodwill are as follows:
Purchase consideration through cash payment 10,000 Fair value of net assets acquired (1,639) Goodwill 8,361
* As restated (refer to Note 3)
(Expressed in thousand US Dollars, unless otherwise stated)
(continued)
On 22 October 2010, Ariane Investments (Australia) Pty Ltd and Indonesia Coal Pty Ltd were deregistered
from the Australian Securities & Investments Commission, in relation to the liquidation of both companies.
On 30 November 2010, PT Sarana Multi Persada and ATA acquired 100% interest in PBMM for Rp 400 million (or equivalent to US$42).
Purchase consideration through cash payment 42 Fair value of net assets acquired (5) Goodwill 37 Details of assets and liabilities arising from the acquisition are as follows: Cash and cash equivalents 5 Other assets Net assets acquired 5 Goodwill 37 Purchase consideration through cash payment 42 Cash and cash equivalents in PBMM (5) Net cash outflow from acquisition of subsidiary 37 From this transaction, the Group recognised preacquisition losses amounting to US$21 in the consolidated financial statements for the year ended 31 December 2010.
On 17 December 2010, the Company and ATA established PT Adaro Power, each with ownership of 50%, from capital injection of Rp 30 million (or equivalent to US$3), respectively. The establishment deed was approved by the Minister of Law and Human Rights of the Republic of Indonesia on 28 December 2010.
On 10 March 2011, the Company and ATA established PT Rehabilitasi Lingkungan Indonesia with ownership of 0.008% and 99.992%, respectively, from capital injection of Rp 1 million (or equivalent to US$110, full amount) and Rp 12,499 million (or equivalent to US$1,380), respectively. The establishment deed has been approved by the Minister of Law and Human Rights of the Republic of Indonesia on 15 March 2011.
On 1 July 2011, PT Adaro Logistics acquired 85% interest in IMPT for Rp 2,125 million (or equivalent to US$247). This acquisition has been accounted for as purchase of assets.
Purchase consideration through cash payment 247 Fair value of net liabilities acquired 1,261 Intangible asset 1,508
* As restated (refer to Note 3)
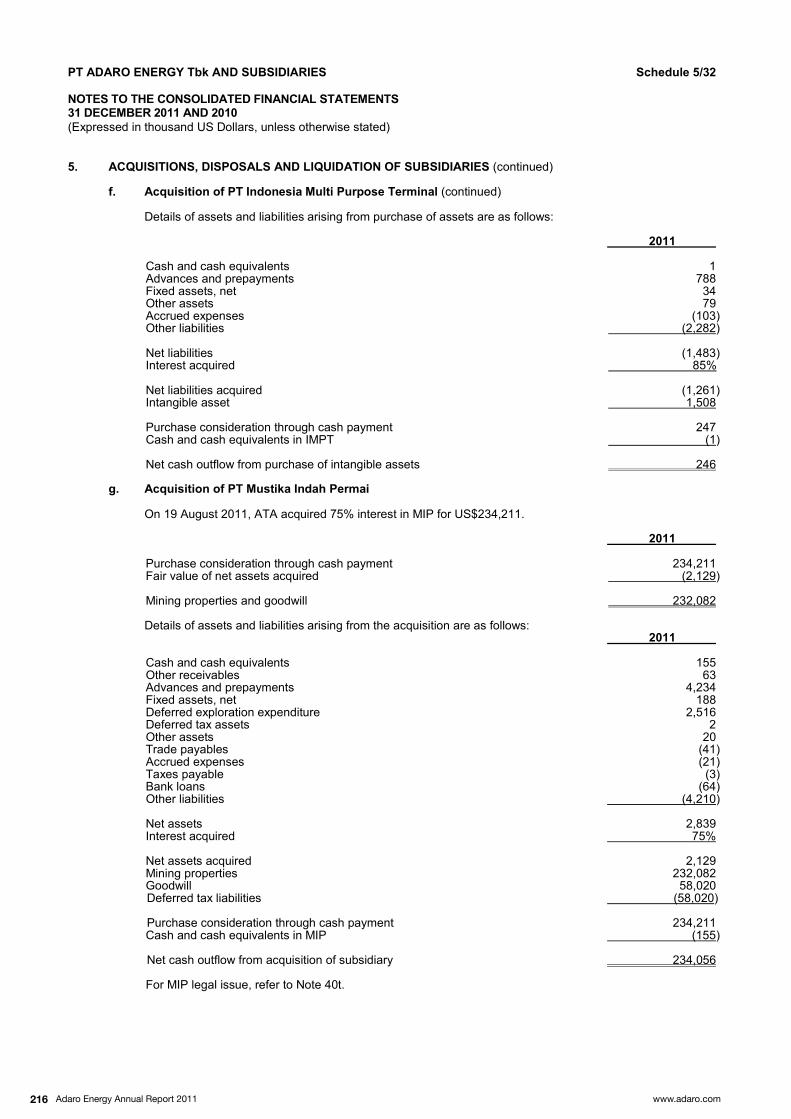
Adaro Energy Annual Report 2011 www.adaro.com216
(Expressed in thousand US Dollars, unless otherwise stated)
(continued)
(continued)
Details of assets and liabilities arising from purchase of assets are as follows:
Cash and cash equivalents 1 Advances and prepayments 788 Fixed assets, net 34 Other assets 79 Accrued expenses (103) Other liabilities (2,282) Net liabilities (1,483) Interest acquired 85% Net liabilities acquired (1,261) Intangible asset 1,508 Purchase consideration through cash payment 247 Cash and cash equivalents in IMPT (1) Net cash outflow from purchase of intangible assets 246
On 19 August 2011, ATA acquired 75% interest in MIP for US$234,211.
Purchase consideration through cash payment 234,211 Fair value of net assets acquired (2,129) Mining properties and goodwill 232,082
Details of assets and liabilities arising from the acquisition are as follows: Cash and cash equivalents 155 Other receivables 63 Advances and prepayments 4,234 Fixed assets, net 188 Deferred exploration expenditure 2,516 Deferred tax assets 2 Other assets 20 Trade payables (41) Accrued expenses (21) Taxes payable (3) Bank loans (64) Other liabilities (4,210) Net assets 2,839 Interest acquired 75% Net assets acquired 2,129 Mining properties 232,082 Goodwill 58,020 Deferred tax liabilities (58,020) Purchase consideration through cash payment 234,211 Cash and cash equivalents in MIP (155) Net cash outflow from acquisition of subsidiary 234,056 For MIP legal issue, refer to Note 40t.
(Expressed in thousand US Dollars, unless otherwise stated)
(continued)
On 12 August 2011, the name of PT Sarana Multi Persada was changed to PT Adaro Logistics. This change has been approved by the Minister of Law and Human Rights of the Republic of Indonesia in Decree No. AHU41977.AH.01.02.Tahun 2011 dated 18 August 2011.
On 4 July 2011 and 14 October 2011, ATA acquired 15.04% and 46% interest in BEE, respectively, for total cost of US$67,040.
Purchase consideration through cash payment 67,040 Fair value of net assets acquired (68) Mining properties and goodwill 66,972
Details of assets and liabilities arising from the acquisition are as follows:
Fixed assets, net 4 Other assets 107 Net assets 111 Interest acquired 61% Net assets acquired 68 Mining properties 66,972 Goodwill 16,743 Deferred tax liabilities (16,743) Purchase consideration through cash payment 67,040 Cash and cash equivalents in BEE Net cash outflow from acquisition of subsidiary 67,040
On 24 October 2011, ATA and AL established PT Adaro Mining Technologies with ownership of 99.97% and 0.03%, respectively, from capital injection of Rp 3,499 million and Rp 1 million, respectively. The establishment deed has been approved by the Minister of Law and Human Rights of the Republic of Indonesia on 27 October 2011.
On 17 October 2011, ATA acquired 40% interest in PT Trikarya Intidrill Persada for Rp 1.4 billion. On 15 December 2011, PT Trikarya Intidrill Persada’s Extraordinary General Shareholders Meeting approved the change of name for PT Trikarya Intidrill Persada to PT Adaro Eksplorasi Indonesia (“AEI”) and approved the issue of 450 new shares that will be taken and paid by AMT for Rp 450 million. As such, AMT owns 18.37% interest in AEI and ownership of ATA in AEI diluted to 32.65%. Total ownership of the Group in AEI is 51.02%.

Adaro Energy Annual Report 2011www.adaro.com 217
(Expressed in thousand US Dollars, unless otherwise stated)
(continued)
(continued)
Details of assets and liabilities arising from purchase of assets are as follows:
Cash and cash equivalents 1 Advances and prepayments 788 Fixed assets, net 34 Other assets 79 Accrued expenses (103) Other liabilities (2,282) Net liabilities (1,483) Interest acquired 85% Net liabilities acquired (1,261) Intangible asset 1,508 Purchase consideration through cash payment 247 Cash and cash equivalents in IMPT (1) Net cash outflow from purchase of intangible assets 246
On 19 August 2011, ATA acquired 75% interest in MIP for US$234,211.
Purchase consideration through cash payment 234,211 Fair value of net assets acquired (2,129) Mining properties and goodwill 232,082
Details of assets and liabilities arising from the acquisition are as follows: Cash and cash equivalents 155 Other receivables 63 Advances and prepayments 4,234 Fixed assets, net 188 Deferred exploration expenditure 2,516 Deferred tax assets 2 Other assets 20 Trade payables (41) Accrued expenses (21) Taxes payable (3) Bank loans (64) Other liabilities (4,210) Net assets 2,839 Interest acquired 75% Net assets acquired 2,129 Mining properties 232,082 Goodwill 58,020 Deferred tax liabilities (58,020) Purchase consideration through cash payment 234,211 Cash and cash equivalents in MIP (155) Net cash outflow from acquisition of subsidiary 234,056 For MIP legal issue, refer to Note 40t.
(Expressed in thousand US Dollars, unless otherwise stated)
(continued)
On 12 August 2011, the name of PT Sarana Multi Persada was changed to PT Adaro Logistics. This change has been approved by the Minister of Law and Human Rights of the Republic of Indonesia in Decree No. AHU41977.AH.01.02.Tahun 2011 dated 18 August 2011.
On 4 July 2011 and 14 October 2011, ATA acquired 15.04% and 46% interest in BEE, respectively, for total cost of US$67,040.
Purchase consideration through cash payment 67,040 Fair value of net assets acquired (68) Mining properties and goodwill 66,972
Details of assets and liabilities arising from the acquisition are as follows:
Fixed assets, net 4 Other assets 107 Net assets 111 Interest acquired 61% Net assets acquired 68 Mining properties 66,972 Goodwill 16,743 Deferred tax liabilities (16,743) Purchase consideration through cash payment 67,040 Cash and cash equivalents in BEE Net cash outflow from acquisition of subsidiary 67,040
On 24 October 2011, ATA and AL established PT Adaro Mining Technologies with ownership of 99.97% and 0.03%, respectively, from capital injection of Rp 3,499 million and Rp 1 million, respectively. The establishment deed has been approved by the Minister of Law and Human Rights of the Republic of Indonesia on 27 October 2011.
On 17 October 2011, ATA acquired 40% interest in PT Trikarya Intidrill Persada for Rp 1.4 billion. On 15 December 2011, PT Trikarya Intidrill Persada’s Extraordinary General Shareholders Meeting approved the change of name for PT Trikarya Intidrill Persada to PT Adaro Eksplorasi Indonesia (“AEI”) and approved the issue of 450 new shares that will be taken and paid by AMT for Rp 450 million. As such, AMT owns 18.37% interest in AEI and ownership of ATA in AEI diluted to 32.65%. Total ownership of the Group in AEI is 51.02%.

Adaro Energy Annual Report 2011 www.adaro.com218
(Expressed in thousand US Dollars, unless otherwise stated)
(continued)
(continued)
Purchase consideration through cash payment 208 Fair value of net assets acquired (306) Negative goodwill charged to the consolidated statements of income 98
Details of assets and liabilities arising from the acquisition are as follows:
Cash and cash equivalents 92 Trade receivables 627 Advances and prepayments 77 Inventories 9 Prepaid taxes 71 Fixed assets, net 190 Trade payables (419) Accrued expenses (11) Taxes payable (37) Net assets 599 Interest acquired 51% Net assets acquired 306 Negative goodwill (98)
Purchase consideration through cash payment 208 Cash and cash equivalents in AEI (92) Net cash outflow from acquisition of subsidiary 116
On 26 December 2011, the name of PT Satya Mandiri Persada was changed to PT Adaro Persada Mandiri. This change has been approved by the Minister of Law and Human Rights of the Republic of Indonesia in Decree No. AHU64525.AH.01.02.Tahun 2011 dated 29 December 2011.
On 8 August 2011, Joyce Corner International Ltd was struck off from the register of Companies of the Republic of Seychelles and has been dissolved from that date. All the assets and liabilities of JCI have been transferred to its shareholder. On 26 April 2011, Rach (M) was liquidated and all assets and liabilities were transferred to its shareholder. However, the notice from the Registrar of Companies confirming the dissolution was only received on 9 January 2012.
(Expressed in thousand US Dollars, unless otherwise stated)
Others (each below US$50,000) 107 94 84 Total cash on hand 107 94 84 Others (each below US$50,000) 42,804 47,062 18,751 Total Rupiah accounts 42,804 47,062 18,751 PT Bank OCBC NISP Tbk 128,360 75 1,001 PT Bank DBS Indonesia 64,466 1,079 101,197 OverseaChinese Banking Corporation Ltd 61,842 73,116 124,193 Sumitomo Mitsui Banking Corporation 61,117 71,097 145,825 PT Bank Mandiri (Persero) Tbk 53,658 11,429 6,153 PT Bank Sumitomo Mitsui Indonesia 17,374 101,635 3,644 DBS Bank Ltd 308 56,120 93,411 Others (each below US$50,000) 19,053 14,277 3,349 Total US Dollars accounts 406,178 328,828 478,773 Others (each below US$50,000) 1,032 3,809 641 Total Singapore Dollars accounts 1,032 3,809 641 Others (each below US$50,000) 1,736 15,931 36,994 Total Euro accounts 1,736 15,931 36,994 Total cash in banks 451,750 395,630 535,159 Others (each below US$50,000) 18,167 16,065 10,296 Total Rupiah deposits 18,167 16,065 10,296 PT ANZ Panin Bank 20,000 122,376 PT Bank UOB Indonesia 6,125 66,165 168,389 OverseaChinese Banking Corporation Ltd 235,000 Others (each below US$50,000) 62,723 103,036 128,123 Total US Dollars deposits 88,848 169,201 653,888 Others (each below US$50,000) 26,281 Total Euro deposits 26,281 Total deposits 107,015 211,547 664,184 558,872 607,271 1,199,427
* As restated (refer to Note 3)

Adaro Energy Annual Report 2011www.adaro.com 219
(Expressed in thousand US Dollars, unless otherwise stated)
(continued)
(continued)
Purchase consideration through cash payment 208 Fair value of net assets acquired (306) Negative goodwill charged to the consolidated statements of income 98
Details of assets and liabilities arising from the acquisition are as follows:
Cash and cash equivalents 92 Trade receivables 627 Advances and prepayments 77 Inventories 9 Prepaid taxes 71 Fixed assets, net 190 Trade payables (419) Accrued expenses (11) Taxes payable (37) Net assets 599 Interest acquired 51% Net assets acquired 306 Negative goodwill (98)
Purchase consideration through cash payment 208 Cash and cash equivalents in AEI (92) Net cash outflow from acquisition of subsidiary 116
On 26 December 2011, the name of PT Satya Mandiri Persada was changed to PT Adaro Persada Mandiri. This change has been approved by the Minister of Law and Human Rights of the Republic of Indonesia in Decree No. AHU64525.AH.01.02.Tahun 2011 dated 29 December 2011.
On 8 August 2011, Joyce Corner International Ltd was struck off from the register of Companies of the Republic of Seychelles and has been dissolved from that date. All the assets and liabilities of JCI have been transferred to its shareholder. On 26 April 2011, Rach (M) was liquidated and all assets and liabilities were transferred to its shareholder. However, the notice from the Registrar of Companies confirming the dissolution was only received on 9 January 2012.
(Expressed in thousand US Dollars, unless otherwise stated)
Others (each below US$50,000) 107 94 84 Total cash on hand 107 94 84 Others (each below US$50,000) 42,804 47,062 18,751 Total Rupiah accounts 42,804 47,062 18,751 PT Bank OCBC NISP Tbk 128,360 75 1,001 PT Bank DBS Indonesia 64,466 1,079 101,197 OverseaChinese Banking Corporation Ltd 61,842 73,116 124,193 Sumitomo Mitsui Banking Corporation 61,117 71,097 145,825 PT Bank Mandiri (Persero) Tbk 53,658 11,429 6,153 PT Bank Sumitomo Mitsui Indonesia 17,374 101,635 3,644 DBS Bank Ltd 308 56,120 93,411 Others (each below US$50,000) 19,053 14,277 3,349 Total US Dollars accounts 406,178 328,828 478,773 Others (each below US$50,000) 1,032 3,809 641 Total Singapore Dollars accounts 1,032 3,809 641 Others (each below US$50,000) 1,736 15,931 36,994 Total Euro accounts 1,736 15,931 36,994 Total cash in banks 451,750 395,630 535,159 Others (each below US$50,000) 18,167 16,065 10,296 Total Rupiah deposits 18,167 16,065 10,296 PT ANZ Panin Bank 20,000 122,376 PT Bank UOB Indonesia 6,125 66,165 168,389 OverseaChinese Banking Corporation Ltd 235,000 Others (each below US$50,000) 62,723 103,036 128,123 Total US Dollars deposits 88,848 169,201 653,888 Others (each below US$50,000) 26,281 Total Euro deposits 26,281 Total deposits 107,015 211,547 664,184 558,872 607,271 1,199,427
* As restated (refer to Note 3)

Adaro Energy Annual Report 2011 www.adaro.com220
(Expressed in thousand US Dollars, unless otherwise stated)
(continued) The interest rates of the above deposits were as follows:
Rupiah 6.0% 9.5% 5.0% 11.0% 6.9% 9.5% US Dollars 1.0% 2.7% 0.1% 2.0% 0.2% 3.5% Euro 0.7%
There are no cash and cash equivalents with related parties.
PT Bank OCBC NISP Tbk 140 282 The Hongkong and Shanghai Banking Corporation Ltd 601 600 600 PT Bank DBS Indonesia 200 412 409 801 1,012 1,009 Total restricted cash and time deposits 941 1,294 1,009
Less: current portion (140) (282) Noncurrent portion 801 1,012 1,009 The interest rates of the above deposits were as follows:
US Dollars 0.4% 0.8% 0.1% 2.0% 0.1% 2.0%
There are no restricted cash and time deposits with related parties. The restricted deposits in The Hongkong and Shanghai Banking Corporation Ltd and PT Bank DBS Indonesia are placed as security for bank guarantees issued by these banks, as described in Note 40e. The balance in PT Bank OCBC NISP Tbk represents the placement of a sinking fund by SDM to pay installments of the principal and interest that will be due, in relation to the bank loan to PT Bank OCBC NISP Tbk (refer to Note 21c).
* As restated (refer to Note 3)
(Expressed in thousand US Dollars, unless otherwise stated)
Third parties: PT Paiton Energy 63,819 56,353 37,848 Zhushui International Pty Ltd (formerly International Energy Group Ltd) 61,121 16,297 41,727 PT Berau Coal 44,267 33,173 27,921 Carboex International Ltd 32,669 5,210 5,712 PT Pembangkitan JawaBali 31,351 8,675 6,611 Korea SouthEast Power Co Ltd 24,500 3,616 2,955 Castle Peak Power Co Ltd 20,622 11,533 Others (each below US$20,000) 213,389 131,480 172,338 471,116 275,426 306,645 Related party: PT Jasa Tambang Indonesia 226 471,342 275,426 306,645
The aging analysis of trade receivables is as follows:
Current and overdue by 1 30 days 449,289 268,880 287,868 Overdue by 31 60 days 20,146 35 2,700 Overdue by 61 90 days 2 1,322 9,096 Overdue by more than 90 days 1,905 5,189 6,981
471,342 275,426 306,645
Details of trade receivables based on currencies are as follows:
US Dollars 351,537 186,564 222,344 Rupiah 119,805 88,862 84,301
471,342 275,426 306,645
As at 31 December 2011, the trade receivables of SDM amounting to US$3,151 were pledged as collateral for a loan from PT Bank OCBC NISP Tbk (refer to Note 21c).
As at 31 December 2010, the trade receivables of SIS, amounting to US$84,961 (including receivables from Adaro amounting to US$28,210 that had been eliminated), were pledged as collateral for the Senior Credit Facility (refer to Note 21b). In March 2011, the loan has been refinanced using the Syndicated Bank Loan (refer to Note 21d). Based on a review of the status of the individual trade receivable accounts at the end of the period, the Group’s management is of the opinion that these receivables will be collected in full and therefore a provision for impairment is not considered necessary.
Refer to Note 35 for details of related party balances and transactions.
* As restated (refer to Note 3)

Adaro Energy Annual Report 2011www.adaro.com 221
(Expressed in thousand US Dollars, unless otherwise stated)
(continued) The interest rates of the above deposits were as follows:
Rupiah 6.0% 9.5% 5.0% 11.0% 6.9% 9.5% US Dollars 1.0% 2.7% 0.1% 2.0% 0.2% 3.5% Euro 0.7%
There are no cash and cash equivalents with related parties.
PT Bank OCBC NISP Tbk 140 282 The Hongkong and Shanghai Banking Corporation Ltd 601 600 600 PT Bank DBS Indonesia 200 412 409 801 1,012 1,009 Total restricted cash and time deposits 941 1,294 1,009
Less: current portion (140) (282) Noncurrent portion 801 1,012 1,009 The interest rates of the above deposits were as follows:
US Dollars 0.4% 0.8% 0.1% 2.0% 0.1% 2.0%
There are no restricted cash and time deposits with related parties. The restricted deposits in The Hongkong and Shanghai Banking Corporation Ltd and PT Bank DBS Indonesia are placed as security for bank guarantees issued by these banks, as described in Note 40e. The balance in PT Bank OCBC NISP Tbk represents the placement of a sinking fund by SDM to pay installments of the principal and interest that will be due, in relation to the bank loan to PT Bank OCBC NISP Tbk (refer to Note 21c).
* As restated (refer to Note 3)
(Expressed in thousand US Dollars, unless otherwise stated)
Third parties: PT Paiton Energy 63,819 56,353 37,848 Zhushui International Pty Ltd (formerly International Energy Group Ltd) 61,121 16,297 41,727 PT Berau Coal 44,267 33,173 27,921 Carboex International Ltd 32,669 5,210 5,712 PT Pembangkitan JawaBali 31,351 8,675 6,611 Korea SouthEast Power Co Ltd 24,500 3,616 2,955 Castle Peak Power Co Ltd 20,622 11,533 Others (each below US$20,000) 213,389 131,480 172,338 471,116 275,426 306,645 Related party: PT Jasa Tambang Indonesia 226 471,342 275,426 306,645
The aging analysis of trade receivables is as follows:
Current and overdue by 1 30 days 449,289 268,880 287,868 Overdue by 31 60 days 20,146 35 2,700 Overdue by 61 90 days 2 1,322 9,096 Overdue by more than 90 days 1,905 5,189 6,981
471,342 275,426 306,645
Details of trade receivables based on currencies are as follows:
US Dollars 351,537 186,564 222,344 Rupiah 119,805 88,862 84,301
471,342 275,426 306,645
As at 31 December 2011, the trade receivables of SDM amounting to US$3,151 were pledged as collateral for a loan from PT Bank OCBC NISP Tbk (refer to Note 21c).
As at 31 December 2010, the trade receivables of SIS, amounting to US$84,961 (including receivables from Adaro amounting to US$28,210 that had been eliminated), were pledged as collateral for the Senior Credit Facility (refer to Note 21b). In March 2011, the loan has been refinanced using the Syndicated Bank Loan (refer to Note 21d). Based on a review of the status of the individual trade receivable accounts at the end of the period, the Group’s management is of the opinion that these receivables will be collected in full and therefore a provision for impairment is not considered necessary.
Refer to Note 35 for details of related party balances and transactions.
* As restated (refer to Note 3)

Adaro Energy Annual Report 2011 www.adaro.com222
(Expressed in thousand US Dollars, unless otherwise stated)
Advances to suppliers 99,053 36,229 23,017 Prepayment for liquidity services 23,503 7,294 9,239 Advances for investments 18,875 47,100 Advances for purchase of fuel 11,342 10,089 11,231 Prepaid rent and insurance 3,001 2,944 2,589 Others 7,018 15,286 3,434 Total advances and prepayments 162,792 118,942 49,510 Less: current portion (40,301) (41,612) (20,910) Noncurrent portion 122,491 77,330 28,600
Advances for investments amounting to US$18,875 represents the fund placement by ATA for the future development of a coal mining project (refer to Note 13). The funds will be reclassified as investments in associates when they are used by associates through the issue of new shares. Advances to suppliers mostly represent advance payments for the purchase of fixed assets and advance payments for the construction of the Coal Fired Power Plant and steam turbine generators.
Coal inventory 27,556 12,669 8,140 Tools and supplies 11,537 6,378 7,549 Spare parts 9,380 8,792 7,495 Fuel and lubricants 3,947 4,206 3,409
52,420 32,045 26,593
The Group’s management is of the opinion that the inventories can be either used or sold and therefore a provision for obsolete stock is not considered necessary.
As at 31 December 2011, the Group’s inventories were covered by insurance against the risk of material damage with total coverage of US$27,944. The Group’s management is of the opinion that inventories are adequately insured to cover the risk of loss and damage.
Commercial producing areas South Paringin, North Paringin and Tutupan 31,906 31,906 31,906 Wara 4,795 4,795 4,795 36,701 36,701 36,701 Area of interest which has not reached the commercial production stage Lahat 3,056 39,757 36,701 36,701
* As restated (refer to Note 3)
(Expressed in thousand US Dollars, unless otherwise stated)
(continued)
Commercial producing areas South Paringin, North Paringin and Tutupan Carrying amount beginning balance (28,383) (28,083) (27,783) Amortisation (300) (300) (300)
(28,683) (28,383) (28,083) Wara Carrying amount beginning balance (376) Amortisation (376) (376) (752) (376) (29,435) (28,759) (28,083) 10,322 7,942 8,618
Direct ownership Land 64,609 251 107 (21) 64,946 Buildings 25,093 3,992 4,519 (24) 33,580 Infrastructure 78,049 89 3,328 81,466 Machinery, operational equipment and vehicles 447,123 276,204 465 9,177 (18) 732,951 Vessels 134,383 6,334 14,695 155,412 Mining equipment 976 551 (2) 1,525 Project equipment 4,921 1,585 (52) 6,454 Office equipment 8,406 2,772 124 155 (5) 11,452 Crushing and handling facilities 143,397 92,823 6,527 242,747 Roads and bridges 115,061 16,867 131,928 Stockpile facilities 6,101 6,101 Dock facilities 2,459 2,459
1,030,578 384,601 589 55,321 (68) 1,471,021 Construction in progress 116,076 204,884 (52,285) (87) 268,588 Leased assets Operational equipment 176,267 30,982 (27,129) 180,120 1,322,921 620,467 589 (24,093) (155) 1,919,729 Direct ownership Buildings (5,195) (1,572) 111 12 (6,644) Infrastructure (15,245) (4,396) (19,641) Machinery, operational equipment and vehicles (180,655) (83,992) (138) 803 8 (263,974) Vessels (9,888) (8,386) 340 (17,934) Mining equipment (354) (279) 6 (627) Project equipment (1,997) (1,137) 54 (3,080) Office equipment (5,756) (1,571) (35) 55 3 (7,304) Crushing and handling facilities (39,104) (13,688) (52,792) Roads and bridges (43,127) (6,376) (49,503) Stockpile facilities (4,249) (307) (4,556) Dock facilities (1,926) (132) (2,058)
(307,496) (121,836) (173) 1,369 23 (428,113)
Leased assets Operational equipment (47,628) (25,890) 14,201 (59,317) (355,124) (147,726) (173) 15,570 23 (487,430) 967,797 1,432,299 * As restated (refer to Note 3)

Adaro Energy Annual Report 2011www.adaro.com 223
(Expressed in thousand US Dollars, unless otherwise stated)
Advances to suppliers 99,053 36,229 23,017 Prepayment for liquidity services 23,503 7,294 9,239 Advances for investments 18,875 47,100 Advances for purchase of fuel 11,342 10,089 11,231 Prepaid rent and insurance 3,001 2,944 2,589 Others 7,018 15,286 3,434 Total advances and prepayments 162,792 118,942 49,510 Less: current portion (40,301) (41,612) (20,910) Noncurrent portion 122,491 77,330 28,600
Advances for investments amounting to US$18,875 represents the fund placement by ATA for the future development of a coal mining project (refer to Note 13). The funds will be reclassified as investments in associates when they are used by associates through the issue of new shares. Advances to suppliers mostly represent advance payments for the purchase of fixed assets and advance payments for the construction of the Coal Fired Power Plant and steam turbine generators.
Coal inventory 27,556 12,669 8,140 Tools and supplies 11,537 6,378 7,549 Spare parts 9,380 8,792 7,495 Fuel and lubricants 3,947 4,206 3,409
52,420 32,045 26,593
The Group’s management is of the opinion that the inventories can be either used or sold and therefore a provision for obsolete stock is not considered necessary.
As at 31 December 2011, the Group’s inventories were covered by insurance against the risk of material damage with total coverage of US$27,944. The Group’s management is of the opinion that inventories are adequately insured to cover the risk of loss and damage.
Commercial producing areas South Paringin, North Paringin and Tutupan 31,906 31,906 31,906 Wara 4,795 4,795 4,795 36,701 36,701 36,701 Area of interest which has not reached the commercial production stage Lahat 3,056 39,757 36,701 36,701
* As restated (refer to Note 3)
(Expressed in thousand US Dollars, unless otherwise stated)
(continued)
Commercial producing areas South Paringin, North Paringin and Tutupan Carrying amount beginning balance (28,383) (28,083) (27,783) Amortisation (300) (300) (300)
(28,683) (28,383) (28,083) Wara Carrying amount beginning balance (376) Amortisation (376) (376) (752) (376) (29,435) (28,759) (28,083) 10,322 7,942 8,618
Direct ownership Land 64,609 251 107 (21) 64,946 Buildings 25,093 3,992 4,519 (24) 33,580 Infrastructure 78,049 89 3,328 81,466 Machinery, operational equipment and vehicles 447,123 276,204 465 9,177 (18) 732,951 Vessels 134,383 6,334 14,695 155,412 Mining equipment 976 551 (2) 1,525 Project equipment 4,921 1,585 (52) 6,454 Office equipment 8,406 2,772 124 155 (5) 11,452 Crushing and handling facilities 143,397 92,823 6,527 242,747 Roads and bridges 115,061 16,867 131,928 Stockpile facilities 6,101 6,101 Dock facilities 2,459 2,459
1,030,578 384,601 589 55,321 (68) 1,471,021 Construction in progress 116,076 204,884 (52,285) (87) 268,588 Leased assets Operational equipment 176,267 30,982 (27,129) 180,120 1,322,921 620,467 589 (24,093) (155) 1,919,729 Direct ownership Buildings (5,195) (1,572) 111 12 (6,644) Infrastructure (15,245) (4,396) (19,641) Machinery, operational equipment and vehicles (180,655) (83,992) (138) 803 8 (263,974) Vessels (9,888) (8,386) 340 (17,934) Mining equipment (354) (279) 6 (627) Project equipment (1,997) (1,137) 54 (3,080) Office equipment (5,756) (1,571) (35) 55 3 (7,304) Crushing and handling facilities (39,104) (13,688) (52,792) Roads and bridges (43,127) (6,376) (49,503) Stockpile facilities (4,249) (307) (4,556) Dock facilities (1,926) (132) (2,058)
(307,496) (121,836) (173) 1,369 23 (428,113)
Leased assets Operational equipment (47,628) (25,890) 14,201 (59,317) (355,124) (147,726) (173) 15,570 23 (487,430) 967,797 1,432,299 * As restated (refer to Note 3)

Adaro Energy Annual Report 2011 www.adaro.com224
(Expressed in thousand US Dollars, unless otherwise stated)
(continued)
Direct ownership Land 64,445 45 8 111 64,609 Buildings 21,335 2,746 891 121 25,093 Infrastructure 67,435 10 10,604 78,049 Machinery, operational equipment and vehicles 322,512 118,828 5,779 4 447,123 Vessels 151,891 1,897 (19,405) 134,383 Mining equipment 362 615 (1) 976 Project equipment 2,928 1,300 693 4,921 Office equipment 8,371 1,026 (992) 1 8,406 Crushing and handling facilities 99,454 30,166 13,777 143,397 Roads and bridges 99,612 70 15,379 115,061 Stockpile facilities 6,101 6,101 Dock facilities 2,174 285 2,459
846,620 156,703 27,018 237 1,030,578 Construction in progress 61,390 99,437 (44,751) 116,076 Leased assets Operational equipment 158,190 42,356 (24,279) 176,267 1,066,200 298,496 (42,012) 237 1,322,921
Direct ownership Buildings (3,975) (1,229) 33 (24) (5,195) Infrastructure (11,158) (4,087) (15,245) Machinery, operational equipment and vehicles (127,389) (54,235) 972 (3) (180,655) Vessels (21,355) (7,753) 19,220 (9,888) Mining equipment (266) (89) 1 (354) Project equipment (1,054) (952) 9 (1,997) Office equipment (4,448) (1,456) 148 (5,756) Crushing and handling facilities (31,812) (7,292) (39,104) Roads and bridges (37,744) (5,383) (43,127) Stockpile facilities (3,943) (306) (4,249) Dock facilities (1,802) (124) (1,926) (244,946) (82,906) 20,383 (27) (307,496) Leased assets Operational equipment (34,942) (24,915) 12,229 (47,628) (279,888) (107,821) 32,612 (27) (355,124) 786,312 967,797
Depreciation expense for the years ended 31 December 2011 and 2010 was allocated as follows:
Cost of revenue 144,909 101,489 General and administrative expenses 2,817 6,332 147,726 107,821
* As restated (refer to Note 3)
(Expressed in thousand US Dollars, unless otherwise stated)
(continued)
The calculation of loss on disposals of fixed assets for the years ended 31 December 2011 and 2010 was as follows:
Acquisition costs 24,093 42,012 Accumulated depreciation (15,570) (32,612) Carrying value of fixed assets 8,523 9,400 Proceeds from disposals of fixed assets 5,699 3,800 Loss on disposal of fixed assets (2,824) (5,600) In accordance with the CCA, the fixed assets of Adaro as at 31 December 2011 amounting to US$543,638 (31 December 2010: US$281,582) remain the property of the Government. However, Adaro has an exclusive right to use these assets over the contract period, or their useful lives, whichever is shorter. In accordance with the Cooperation Agreement, the fixed assets of IBT as at 31 December 2011 amounting to US$67,824 (31 December 2010: US$71,725), in the coal port operation become the property of Pelindo III at the end of the 30year operation period. The Group owns 28 plots of land with “Hak Guna Bangunan” titles (“BuildingUse Titles” or “HGB”) with remaining useful lives of between 9 and 30 years. The Group’s management believes that there will be no difficulty in extending the land rights as the land was acquired legally and this is supported by sufficient evidence of ownership.
In August 2008, ATA paid land compensation amounting to US$60,000 to PT Cakung Permata Nusa (“Cakung”), PT Cakradenta Agung Pertiwi (“Cakradenta”) and PT Astra Agro Lestari Tbk (“AAL”) to settle the status of overlapping land plots between the mining area owned by Adaro and the plantation areas owned by Cakung and Cakradenta of 7,163 hectares. Currently, the land title is still in the process of being transferred to ATA.
As at 31 December 2011, the Group’s fixed assets were insured against all risks of damage with a total coverage of approximately US$1,507,528, which also included the construction of the Tanjung Tabalong coal fired power plant project by MSW, except for fixed assets that could not be insured such as land, Barito channel dredging and parts of construction in progress. The Group’s management believes that the fixed assets as at 31 December 2011 were adequately insured. As at 31 December 2010, the moveable fixed assets owned by SIS and the land and building owned by APM were pledged as collateral for the Senior Credit Facility (refer to Note 21b). In March 2011, the loan was refinanced using the Syndicated Bank Loan (refer to Note 21d). Construction in progress represents projects that have not been completed at the statement of financial position date as follows:
Power plant 83% 119,810 May 2012 Overburden crushing and conveying system 38% 96,103 May 2013 February Crushing and handling facilities 3% 95% 22,474 December 2012 Conveyor belt 10% 16,726 On hold Others (each below US$10,000) 3% 99% 13,475 2012
268,588 * As restated (refer to Note 3)

Adaro Energy Annual Report 2011www.adaro.com 225
(Expressed in thousand US Dollars, unless otherwise stated)
(continued)
Direct ownership Land 64,445 45 8 111 64,609 Buildings 21,335 2,746 891 121 25,093 Infrastructure 67,435 10 10,604 78,049 Machinery, operational equipment and vehicles 322,512 118,828 5,779 4 447,123 Vessels 151,891 1,897 (19,405) 134,383 Mining equipment 362 615 (1) 976 Project equipment 2,928 1,300 693 4,921 Office equipment 8,371 1,026 (992) 1 8,406 Crushing and handling facilities 99,454 30,166 13,777 143,397 Roads and bridges 99,612 70 15,379 115,061 Stockpile facilities 6,101 6,101 Dock facilities 2,174 285 2,459
846,620 156,703 27,018 237 1,030,578 Construction in progress 61,390 99,437 (44,751) 116,076 Leased assets Operational equipment 158,190 42,356 (24,279) 176,267 1,066,200 298,496 (42,012) 237 1,322,921
Direct ownership Buildings (3,975) (1,229) 33 (24) (5,195) Infrastructure (11,158) (4,087) (15,245) Machinery, operational equipment and vehicles (127,389) (54,235) 972 (3) (180,655) Vessels (21,355) (7,753) 19,220 (9,888) Mining equipment (266) (89) 1 (354) Project equipment (1,054) (952) 9 (1,997) Office equipment (4,448) (1,456) 148 (5,756) Crushing and handling facilities (31,812) (7,292) (39,104) Roads and bridges (37,744) (5,383) (43,127) Stockpile facilities (3,943) (306) (4,249) Dock facilities (1,802) (124) (1,926) (244,946) (82,906) 20,383 (27) (307,496) Leased assets Operational equipment (34,942) (24,915) 12,229 (47,628) (279,888) (107,821) 32,612 (27) (355,124) 786,312 967,797
Depreciation expense for the years ended 31 December 2011 and 2010 was allocated as follows:
Cost of revenue 144,909 101,489 General and administrative expenses 2,817 6,332 147,726 107,821
* As restated (refer to Note 3)
(Expressed in thousand US Dollars, unless otherwise stated)
(continued)
The calculation of loss on disposals of fixed assets for the years ended 31 December 2011 and 2010 was as follows:
Acquisition costs 24,093 42,012 Accumulated depreciation (15,570) (32,612) Carrying value of fixed assets 8,523 9,400 Proceeds from disposals of fixed assets 5,699 3,800 Loss on disposal of fixed assets (2,824) (5,600) In accordance with the CCA, the fixed assets of Adaro as at 31 December 2011 amounting to US$543,638 (31 December 2010: US$281,582) remain the property of the Government. However, Adaro has an exclusive right to use these assets over the contract period, or their useful lives, whichever is shorter. In accordance with the Cooperation Agreement, the fixed assets of IBT as at 31 December 2011 amounting to US$67,824 (31 December 2010: US$71,725), in the coal port operation become the property of Pelindo III at the end of the 30year operation period. The Group owns 28 plots of land with “Hak Guna Bangunan” titles (“BuildingUse Titles” or “HGB”) with remaining useful lives of between 9 and 30 years. The Group’s management believes that there will be no difficulty in extending the land rights as the land was acquired legally and this is supported by sufficient evidence of ownership.
In August 2008, ATA paid land compensation amounting to US$60,000 to PT Cakung Permata Nusa (“Cakung”), PT Cakradenta Agung Pertiwi (“Cakradenta”) and PT Astra Agro Lestari Tbk (“AAL”) to settle the status of overlapping land plots between the mining area owned by Adaro and the plantation areas owned by Cakung and Cakradenta of 7,163 hectares. Currently, the land title is still in the process of being transferred to ATA.
As at 31 December 2011, the Group’s fixed assets were insured against all risks of damage with a total coverage of approximately US$1,507,528, which also included the construction of the Tanjung Tabalong coal fired power plant project by MSW, except for fixed assets that could not be insured such as land, Barito channel dredging and parts of construction in progress. The Group’s management believes that the fixed assets as at 31 December 2011 were adequately insured. As at 31 December 2010, the moveable fixed assets owned by SIS and the land and building owned by APM were pledged as collateral for the Senior Credit Facility (refer to Note 21b). In March 2011, the loan was refinanced using the Syndicated Bank Loan (refer to Note 21d). Construction in progress represents projects that have not been completed at the statement of financial position date as follows:
Power plant 83% 119,810 May 2012 Overburden crushing and conveying system 38% 96,103 May 2013 February Crushing and handling facilities 3% 95% 22,474 December 2012 Conveyor belt 10% 16,726 On hold Others (each below US$10,000) 3% 99% 13,475 2012
268,588 * As restated (refer to Note 3)

Adaro Energy Annual Report 2011 www.adaro.com226
(Expressed in thousand US Dollars, unless otherwise stated)
(continued)
(continued)
January – March Power plant 49% 69,936 2012 Conveyor belt 10% 16,260 On hold Vessels 98% 12,958 March 2011 February May Crushing and handling facilities 3% 98% 10,454 2011 Others (each below US$10,000) 1% 90% 6,468 2011 2012 116,076
Power plant 28% 17,277 November 2011 Conveyor belt 10% 10,477 On hold Others (each below US$10,000) 10% 98% 33,636 2010 2011 61,390
Borrowing costs capitalised as fixed assets for year ended 31 December 2011 amounted to US$9,111 (2010: US$8,750).
PT Juloi Coal Percentage of interest 25.00% 25.00% Carrying amount beginning balance 142,305 Initial investment 142,175 Addition of investment 9,435 1,750 Share in net loss of associate (7,001) (1,620) 144,739 142,305 PT Kalteng Coal Percentage of interest 25.00% 25.00% Carrying amount beginning balance 74,627 Initial investment 74,642 Addition of investment 532 375 Share in net loss of associate (614) (390) 74,545 74,627 PT Maruwai Coal Percentage of interest 25.00% 25.00% Carrying amount beginning balance 54,049 Initial investment 53,315 Addition of investment 2,961 625 Share in net (loss)/income of associate (1,641) 109 55,369 54,049 * As restated (refer to Note 3)
(Expressed in thousand US Dollars, unless otherwise stated)
(continued)
PT Lahai Coal Percentage of interest 25.00% 25.00% Carrying amount beginning balance 43,547 Initial investment 42,652 Addition of investment 14,705 Share in net (loss)/income of associate (4,932) 895 53,320 43,547
PT Sumber Barito Coal Percentage of interest 25.00% 25.00% Carrying amount beginning balance 28,058 Initial investment 28,435 Addition of investment 550 Share in net loss of associate (559) (377) 28,049 28,058
PT Pari Coal Percentage of interest 25.00% 25.00% Carrying amount beginning balance 7,104 Initial investment 7,109 Addition of investment 128 75 Share in net loss of associate (205) (80) 7,027 7,104
PT Ratah Coal Percentage of interest 25.00% 25.00% Carrying amount beginning balance 7,153 Initial investment 7,109 Addition of investment 66 75 Share in net loss of associate (139) (31) 7,080 7,153
PT Bhimasena Power Indonesia Percentage of interest 34.00% Initial investment 3,400 Share in net loss of associate (37) 3,363 PT Rachindo Investments Percentage of interest 50.00% 50.00% Carrying amount beginning balance 504 504
504 504
PT Servo Meda Sejahtera Percentage of interest 35.00% Initial investment 22,335 Share in net loss of associate (427) Exchange difference due to financial statement translation (121) 21,787 395,783 357,347
* As restated (refer to Note 3)

Adaro Energy Annual Report 2011www.adaro.com 227
(Expressed in thousand US Dollars, unless otherwise stated)
(continued)
(continued)
January – March Power plant 49% 69,936 2012 Conveyor belt 10% 16,260 On hold Vessels 98% 12,958 March 2011 February May Crushing and handling facilities 3% 98% 10,454 2011 Others (each below US$10,000) 1% 90% 6,468 2011 2012 116,076
Power plant 28% 17,277 November 2011 Conveyor belt 10% 10,477 On hold Others (each below US$10,000) 10% 98% 33,636 2010 2011 61,390
Borrowing costs capitalised as fixed assets for year ended 31 December 2011 amounted to US$9,111 (2010: US$8,750).
PT Juloi Coal Percentage of interest 25.00% 25.00% Carrying amount beginning balance 142,305 Initial investment 142,175 Addition of investment 9,435 1,750 Share in net loss of associate (7,001) (1,620) 144,739 142,305 PT Kalteng Coal Percentage of interest 25.00% 25.00% Carrying amount beginning balance 74,627 Initial investment 74,642 Addition of investment 532 375 Share in net loss of associate (614) (390) 74,545 74,627 PT Maruwai Coal Percentage of interest 25.00% 25.00% Carrying amount beginning balance 54,049 Initial investment 53,315 Addition of investment 2,961 625 Share in net (loss)/income of associate (1,641) 109 55,369 54,049 * As restated (refer to Note 3)
(Expressed in thousand US Dollars, unless otherwise stated)
(continued)
PT Lahai Coal Percentage of interest 25.00% 25.00% Carrying amount beginning balance 43,547 Initial investment 42,652 Addition of investment 14,705 Share in net (loss)/income of associate (4,932) 895 53,320 43,547
PT Sumber Barito Coal Percentage of interest 25.00% 25.00% Carrying amount beginning balance 28,058 Initial investment 28,435 Addition of investment 550 Share in net loss of associate (559) (377) 28,049 28,058
PT Pari Coal Percentage of interest 25.00% 25.00% Carrying amount beginning balance 7,104 Initial investment 7,109 Addition of investment 128 75 Share in net loss of associate (205) (80) 7,027 7,104
PT Ratah Coal Percentage of interest 25.00% 25.00% Carrying amount beginning balance 7,153 Initial investment 7,109 Addition of investment 66 75 Share in net loss of associate (139) (31) 7,080 7,153
PT Bhimasena Power Indonesia Percentage of interest 34.00% Initial investment 3,400 Share in net loss of associate (37) 3,363 PT Rachindo Investments Percentage of interest 50.00% 50.00% Carrying amount beginning balance 504 504
504 504
PT Servo Meda Sejahtera Percentage of interest 35.00% Initial investment 22,335 Share in net loss of associate (427) Exchange difference due to financial statement translation (121) 21,787 395,783 357,347
* As restated (refer to Note 3)

Adaro Energy Annual Report 2011 www.adaro.com228
(Expressed in thousand US Dollars, unless otherwise stated)
(continued) Details of the share in the net loss of associates for the years ended 31 December 2011 and 2010 were as follows:
PT Juloi Coal (7,001) (1,620) PT Kalteng Coal (614) (390) PT Maruwai Coal (1,641) 109 PT Lahai Coal (4,932) 895 PT Sumber Barito Coal (559) (377) PT Pari Coal (205) (80) PT Ratah Coal (139) (31) PT Bhimasena Power Indonesia (37) PT Servo Meda Sejahtera (427) (15,555) (1,494)
In May 2010, after being approved by the Directorate General of Mineral, Coal and Geothermal (“DGoMCG”), ATA acquired 25% ownership in PT Juloi Coal, PT Kalteng Coal, PT Maruwai Coal, PT Lahai Coal, PT Sumber Barito Coal, PT Pari Coal and PT Ratah Coal. On 25 July 2011, Adaro Power, Electric Power Development Co Ltd and Itochu Corporation established PT Bhimasena Power Indonesia with issued and fully paidup capital of US$3,400, US$3,400 and US$3,200, respectively and for ownership of 34%, 34% and 32%, respectively.
On 10 October 2011, ATA and PT Servo Infrastruktur (“SI”) signed sales and purchase and shares transfer deeds, whereby ATA purchased 35% interest in PT Servo Meda Sejahtera (“SMS”) from SI, for Rp 200 billion.
The Group’s share of the results of its principal associates, all of which are unlisted, and its aggregated assets and liabilities, are as follows:
PT Juloi Coal Indonesia 20,277 6,191 (28,005) 25% PT Kalteng Coal Indonesia 1,780 417 (2,454) 25% PT Maruwai Coal Indonesia 136,595 1,675 (6,563) 25% PT Lahai Coal Indonesia 63,802 8,905 (19,729) 25% PT Sumber Barito Coal Indonesia 1,663 285 (2,234) 25% PT Pari Coal Indonesia 560 128 (821) 25% PT Ratah Coal Indonesia 247 91 (556) 25% PT Bhimasena Power Indonesia Indonesia 40,453 30,562 (109) 34% PT Rachindo Investments Indonesia 1,010 50% PT Servo Meda Sejahtera Indonesia 54,146 44,587 6,817 (3,328) 35% PT Juloi Coal Indonesia 7,653 3,062 (8,521) 25% PT Kalteng Coal Indonesia 2,223 405 (2,687) 25% PT Maruwai Coal Indonesia 130,483 750 643 25% PT Lahai Coal Indonesia 16,002 127 3,118 25% PT Sumber Barito Coal Indonesia 1,814 352 (1,860) 25% PT Pari Coal Indonesia 819 66 (339) 25% PT Ratah Coal Indonesia 506 44 (132) 25% PT Rachindo Investments Indonesia 1,010 50%
* As restated (refer to Note 3)
(Expressed in thousand US Dollars, unless otherwise stated)
PT Bhakti Energi Persada Percentage of interest 10.22% Initial investment 65,708 65,708
On 27 January 2011 and amended on 28 February 2011, ATA entered into a Conditional Sale and Purchase Agreement to acquire a 10.22% interest in PT Bhakti Energi Persada for US$65,708, which further entered into a Settlement Agreement on 14 June 2011 to effect the closing of this transaction.
The carrying amount of investment in equity securities is approximate to its fair value due to the recent purchase of the investment.
Carrying amount beginning balance 1,137,000 1,137,000 Addition 299,054 1,436,054 1,137,000 Carrying amount beginning balance (131,730) (77,842) Amortisation (59,674) (53,888) (191,404) (131,730) 1,244,650 1,005,270
Carrying amount beginning balance 930,743 1,073,596 Addition 74,763 8,401 1,005,506 1,081,997 Carrying amount beginning balance (97,744) Amortisation (53,510) (151,254) 1,005,506 930,743
As disclosed in Note 2l, starting on 1 January 2011, goodwill is no longer amortised.
* As restated (refer to Note 3)
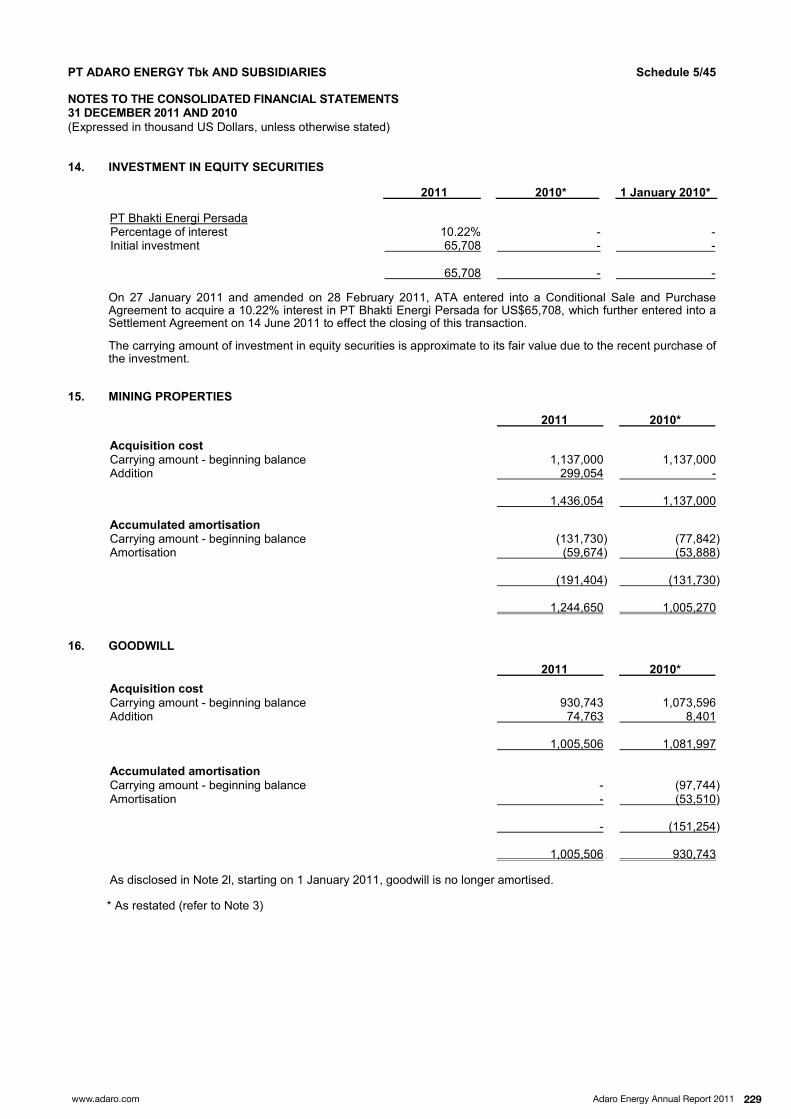
Adaro Energy Annual Report 2011www.adaro.com 229
(Expressed in thousand US Dollars, unless otherwise stated)
(continued) Details of the share in the net loss of associates for the years ended 31 December 2011 and 2010 were as follows:
PT Juloi Coal (7,001) (1,620) PT Kalteng Coal (614) (390) PT Maruwai Coal (1,641) 109 PT Lahai Coal (4,932) 895 PT Sumber Barito Coal (559) (377) PT Pari Coal (205) (80) PT Ratah Coal (139) (31) PT Bhimasena Power Indonesia (37) PT Servo Meda Sejahtera (427) (15,555) (1,494)
In May 2010, after being approved by the Directorate General of Mineral, Coal and Geothermal (“DGoMCG”), ATA acquired 25% ownership in PT Juloi Coal, PT Kalteng Coal, PT Maruwai Coal, PT Lahai Coal, PT Sumber Barito Coal, PT Pari Coal and PT Ratah Coal. On 25 July 2011, Adaro Power, Electric Power Development Co Ltd and Itochu Corporation established PT Bhimasena Power Indonesia with issued and fully paidup capital of US$3,400, US$3,400 and US$3,200, respectively and for ownership of 34%, 34% and 32%, respectively.
On 10 October 2011, ATA and PT Servo Infrastruktur (“SI”) signed sales and purchase and shares transfer deeds, whereby ATA purchased 35% interest in PT Servo Meda Sejahtera (“SMS”) from SI, for Rp 200 billion.
The Group’s share of the results of its principal associates, all of which are unlisted, and its aggregated assets and liabilities, are as follows:
PT Juloi Coal Indonesia 20,277 6,191 (28,005) 25% PT Kalteng Coal Indonesia 1,780 417 (2,454) 25% PT Maruwai Coal Indonesia 136,595 1,675 (6,563) 25% PT Lahai Coal Indonesia 63,802 8,905 (19,729) 25% PT Sumber Barito Coal Indonesia 1,663 285 (2,234) 25% PT Pari Coal Indonesia 560 128 (821) 25% PT Ratah Coal Indonesia 247 91 (556) 25% PT Bhimasena Power Indonesia Indonesia 40,453 30,562 (109) 34% PT Rachindo Investments Indonesia 1,010 50% PT Servo Meda Sejahtera Indonesia 54,146 44,587 6,817 (3,328) 35% PT Juloi Coal Indonesia 7,653 3,062 (8,521) 25% PT Kalteng Coal Indonesia 2,223 405 (2,687) 25% PT Maruwai Coal Indonesia 130,483 750 643 25% PT Lahai Coal Indonesia 16,002 127 3,118 25% PT Sumber Barito Coal Indonesia 1,814 352 (1,860) 25% PT Pari Coal Indonesia 819 66 (339) 25% PT Ratah Coal Indonesia 506 44 (132) 25% PT Rachindo Investments Indonesia 1,010 50%
* As restated (refer to Note 3)
(Expressed in thousand US Dollars, unless otherwise stated)
PT Bhakti Energi Persada Percentage of interest 10.22% Initial investment 65,708 65,708
On 27 January 2011 and amended on 28 February 2011, ATA entered into a Conditional Sale and Purchase Agreement to acquire a 10.22% interest in PT Bhakti Energi Persada for US$65,708, which further entered into a Settlement Agreement on 14 June 2011 to effect the closing of this transaction.
The carrying amount of investment in equity securities is approximate to its fair value due to the recent purchase of the investment.
Carrying amount beginning balance 1,137,000 1,137,000 Addition 299,054 1,436,054 1,137,000 Carrying amount beginning balance (131,730) (77,842) Amortisation (59,674) (53,888) (191,404) (131,730) 1,244,650 1,005,270
Carrying amount beginning balance 930,743 1,073,596 Addition 74,763 8,401 1,005,506 1,081,997 Carrying amount beginning balance (97,744) Amortisation (53,510) (151,254) 1,005,506 930,743
As disclosed in Note 2l, starting on 1 January 2011, goodwill is no longer amortised.
* As restated (refer to Note 3)

Adaro Energy Annual Report 2011 www.adaro.com230
(Expressed in thousand US Dollars, unless otherwise stated)
(continued) Details of goodwill based on segment reporting, are as follows:
31 December 2011 733,710 39,665 232,131 1,005,506 31 December 2010* 658,947 39,665 232,131 930,743 1 January 2010* 696,741 33,743 245,368 975,852
In 2011, the impairment testing of the goodwill has been tested on a cashgenerating units level.
The key assumptions used for value in use calculations are as follows:
Growth rate after five years 0% 0% 0% Pretax discount rate 6.6% – 28.7% 10.7% 10.5% – 12.0%
Management determined that the key assumptions are based on the combination of past experience and external sources.
The pretax discount rate is the posttax discount rate adjusted to reflect the specific amount and timing of the future tax cash flows. Discounting posttax cash flows at a posttax discount rate and discounting pretax cash flows at a pretax discount rate will give the same result. In segment others, the recoverable amount calculated based on value in used exceeded the carrying value ranging from US$5,988 – US$15,287. A rise in discount rate from 0.4% – 0.7% would remove the remaining headroom.
PT Pamapersada Nusantara 89,323 68,299 73,456 PT Shell Indonesia 26,386 17,189 20,273 PT United Tractors Tbk 21,596 19,933 8,618 PT Batuah Abadi Lines 18,963 19,957 22,115 Others (each below US$20,000) 214,673 130,877 90,998
370,941 256,255 215,460 PT Rahman Abdijaya 10,471 6,615 10,145 PT Pulau Seroja Jaya 6,530 4,561 3,148 PT Anugerah Buminusantara Abadi 212 639 514 PT Jasa Tambang Indonesia 152 PT Pulau Seroja Jaya Pratama 36 324 1,383 17,401 12,139 15,190 388,342 268,394 230,650
* As restated (refer to Note 3)
(Expressed in thousand US Dollars, unless otherwise stated)
(continued)
Details of trade payables based on currencies are as follows:
US Dollars 326,144 219,931 190,206 Rupiah 47,920 43,403 37,562 Euro 7,410 4,590 2,500 Australian Dollars 4,460 223 91 Great Britain Pound Sterling 1,346 6 20 Singapore Dollars 1,018 103 139 Japanese Yen 44 138 132 388,342 268,394 230,650
The aging analysis of trade payables is as follows:
Current and overdue by 1 30 days 384,854 261,030 229,558 Overdue by 31 60 days 538 5,315 143 Overdue by 61 90 days 376 153 58 Overdue by more than 90 days 2,574 1,896 891 388,342 268,394 230,650
Trade payables balances mainly arose from the purchase of fuel, spare parts, repair and maintenance services, coal transportation services and coal mining services.
Refer to Note 35 for details of related party balances and transactions.
Accrued interest 16,542 14,513 15,024 Freight cost 8,701 53,579 8,224 Others 13,949 13,988 8,897 39,192 82,080 32,145
Accrued freight cost in the year ended 31 December 2010 mainly arose from demurrage expenses.
Government royalties payable, net 132,429 75,906 78,515 Since 1 July 1999, Adaro has adopted a salesbased cash royalty method to satisfy the Government’s production entitlement (refer to Note 1c). Payments of the Government’s entitlement are based on Adaro’s calculation of the net sales price, which is subject to audit by the Directorate of Mineral and Coal Business Supervision, Ministry of Energy and Mineral Resources (“MoEMR”). Part of the settlement of the royalty is offset by Adaro with the VAT input and vehicle fuel tax (refer to Note 34b).
* As restated (refer to Note 3)

Adaro Energy Annual Report 2011www.adaro.com 231
(Expressed in thousand US Dollars, unless otherwise stated)
(continued) Details of goodwill based on segment reporting, are as follows:
31 December 2011 733,710 39,665 232,131 1,005,506 31 December 2010* 658,947 39,665 232,131 930,743 1 January 2010* 696,741 33,743 245,368 975,852
In 2011, the impairment testing of the goodwill has been tested on a cashgenerating units level.
The key assumptions used for value in use calculations are as follows:
Growth rate after five years 0% 0% 0% Pretax discount rate 6.6% – 28.7% 10.7% 10.5% – 12.0%
Management determined that the key assumptions are based on the combination of past experience and external sources.
The pretax discount rate is the posttax discount rate adjusted to reflect the specific amount and timing of the future tax cash flows. Discounting posttax cash flows at a posttax discount rate and discounting pretax cash flows at a pretax discount rate will give the same result. In segment others, the recoverable amount calculated based on value in used exceeded the carrying value ranging from US$5,988 – US$15,287. A rise in discount rate from 0.4% – 0.7% would remove the remaining headroom.
PT Pamapersada Nusantara 89,323 68,299 73,456 PT Shell Indonesia 26,386 17,189 20,273 PT United Tractors Tbk 21,596 19,933 8,618 PT Batuah Abadi Lines 18,963 19,957 22,115 Others (each below US$20,000) 214,673 130,877 90,998
370,941 256,255 215,460 PT Rahman Abdijaya 10,471 6,615 10,145 PT Pulau Seroja Jaya 6,530 4,561 3,148 PT Anugerah Buminusantara Abadi 212 639 514 PT Jasa Tambang Indonesia 152 PT Pulau Seroja Jaya Pratama 36 324 1,383 17,401 12,139 15,190 388,342 268,394 230,650
* As restated (refer to Note 3)
(Expressed in thousand US Dollars, unless otherwise stated)
(continued)
Details of trade payables based on currencies are as follows:
US Dollars 326,144 219,931 190,206 Rupiah 47,920 43,403 37,562 Euro 7,410 4,590 2,500 Australian Dollars 4,460 223 91 Great Britain Pound Sterling 1,346 6 20 Singapore Dollars 1,018 103 139 Japanese Yen 44 138 132 388,342 268,394 230,650
The aging analysis of trade payables is as follows:
Current and overdue by 1 30 days 384,854 261,030 229,558 Overdue by 31 60 days 538 5,315 143 Overdue by 61 90 days 376 153 58 Overdue by more than 90 days 2,574 1,896 891 388,342 268,394 230,650
Trade payables balances mainly arose from the purchase of fuel, spare parts, repair and maintenance services, coal transportation services and coal mining services.
Refer to Note 35 for details of related party balances and transactions.
Accrued interest 16,542 14,513 15,024 Freight cost 8,701 53,579 8,224 Others 13,949 13,988 8,897 39,192 82,080 32,145
Accrued freight cost in the year ended 31 December 2010 mainly arose from demurrage expenses.
Government royalties payable, net 132,429 75,906 78,515 Since 1 July 1999, Adaro has adopted a salesbased cash royalty method to satisfy the Government’s production entitlement (refer to Note 1c). Payments of the Government’s entitlement are based on Adaro’s calculation of the net sales price, which is subject to audit by the Directorate of Mineral and Coal Business Supervision, Ministry of Energy and Mineral Resources (“MoEMR”). Part of the settlement of the royalty is offset by Adaro with the VAT input and vehicle fuel tax (refer to Note 34b).
* As restated (refer to Note 3)

Adaro Energy Annual Report 2011 www.adaro.com232
(Expressed in thousand US Dollars, unless otherwise stated)
PT Komatsu Astra Finance 59,270 65,502 78,935 PT Austindo Nusantara Jaya Finance 13,915 19,072 Others (each below US$5,000) 2,061 4,187 7,401 75,246 88,761 86,336 Less: Current portion (35,695) (41,001) (35,724) Noncurrent portion 39,551 47,760 50,612 The future minimum lease payments under the finance lease agreements are as follows: Payable not later than one year 37,495 43,645 38,444 Payable later than one year and not later than five years 41,401 49,644 52,578 78,896 93,289 91,022 Less: Future financing charges (3,650) (4,528) (4,686) Present value of minimum finance lease payments 75,246 88,761 86,336
The significant general terms and conditions of the finance leases are as follows: the Group is restricted from selling, lending, leasing, or otherwise disposing of or ceasing to exercise direct
control over the leased assets; the Group is restricted from creating or allowing any encumbrance to all or any part of the leased assets; and all leased assets are pledged as collateral for the underlying finance lease payables.
Syndicated Loan, net of unamortised financing cost of US$2,554 (2010: US$4,430 and 1 January 2010: US$6,123) 384,946 483,070 543,877 Syndicated Bank Loan SIS, net of unamortised financing cost of US$13,191 (2010: US$nil) 286,809 US$750,000 Facility Agreement, net of unamortised financing cost of US$5,876 144,124 Amortising Revolving Credit Facility, net of unamortised financing cost of US$5,349 414,651 Senior Credit Facility (syndicated loan), net of unamortised financing cost of US$nil (2010: US$3,643 and 1 January 2010: US$5,054) 220,517 225,306 PT Bank OCBC NISP Tbk 11,499 13,749 15,000 1,242,029 717,336 784,183 Less: Current portion (102,549) (149,814) (193,950) Noncurrent portion 1,139,480 567,522 590,233
* As restated (refer to Note 3)
(Expressed in thousand US Dollars, unless otherwise stated)
(continued) The interest rates on the longterm bank loans are as follows:
US Dollars 1.7% 4.6% 1.4% 4.8% 1.5% 6.7%
On 2 November 2007, Adaro and Coaltrade, as the Borrowers, entered into a syndicated loan facility agreement with several foreign banks (the “Lenders”), which consisted of DBS Bank Ltd, Standard Chartered Bank (Singapore branch), Sumitomo Mitsui Banking Corporation (Singapore branch) (“SMBC”), the Bank of TokyoMitsubishi UFJ Ltd (Singapore branch) and United Overseas Bank Ltd (Singapore and Labuan branch), wherein DBS Bank Ltd acted as the facility agent. Based on the agreement, the Lenders agreed to grant bank loan facilities of US$750,000, of which Adaro and Coaltrade obtained facilities of US$550,000 and US$200,000, respectively. These facilities consisted of a term loan facility of US$650,000 and a revolving loan facility of US$100,000 with interest rates at London Interbank Offered Rate (“LIBOR”) plus a certain percentage. These facilities were used to refinance certain existing loans of Adaro.
The term loan facility is payable quarterly with the first installment on 7 March 2008. The term loan facility had a maturity date on the fifth anniversary from the date of the loan agreement. Based on the amended agreement dated 25 March 2010, the Company, IBT and the Borrowers (collectively hereinafter referred to as the “Guarantors”), act as the guarantors of this syndicated loan.
On 30 September 2010, the Borrowers, the Guarantors and DBS Bank Ltd, as the facility agent, entered into an amendment agreement to amend the maturity date of the term loan facility to 7 December 2015 and all amounts outstanding under the revolving loan facility shall be deemed to be amounts outstanding under the term loan facility. The margin of interest was increased by a certain percentage. The effective date of this amendment agreement is 7 October 2010.
The remaining payment schedule for the outstanding term loan, after the amendment agreement, is as follows:
2012 73,079 26,921 100,000 2013 73,079 26,921 100,000 2014 73,079 26,921 100,000 2015 65,864 21,636 87,500 285,101 102,399 387,500 In accordance with the loan agreements, Adaro, IBT and Coaltrade (the “Primary Operating Companies”) are required to maintain certain financial ratios, with which the Primary Operating Companies were in compliance as at 31 December 2011. The Primary Operating Companies are also required to comply with certain terms and conditions with regard to its Articles of Association, the nature of business, dividends, corporate actions, financing activities and other matters. The Primary Operating Companies are in compliance with the terms and conditions.
On 13 August 2008, SIS (the “Borrower”) and the Company (the “Guarantor”), entered into a Senior Credit Facility agreement of US$300,000 with a syndicate of banks consisting of ANZ Banking Group Ltd, Calyon, Standard Chartered Bank, DBS Bank Ltd, SMBC, United Overseas Bank Ltd, The Bank of TokyoMitsubishi UFJ Ltd (Singapore Branch), OverseaChinese Banking Corporation Ltd, PT Bank Ekspor Indonesia (“BEI”), PT Bank Mandiri (Persero) Tbk (“Mandiri”) (Singapore Branch) as Mandated Lead Arrangers, SMBC as Facility Agent, PT ANZ Panin Bank as Common Security Agent and DBS Bank Ltd and PT Bank DBS Indonesia as account banks.
* As restated (refer to Note 3)

Adaro Energy Annual Report 2011www.adaro.com 233
(Expressed in thousand US Dollars, unless otherwise stated)
PT Komatsu Astra Finance 59,270 65,502 78,935 PT Austindo Nusantara Jaya Finance 13,915 19,072 Others (each below US$5,000) 2,061 4,187 7,401 75,246 88,761 86,336 Less: Current portion (35,695) (41,001) (35,724) Noncurrent portion 39,551 47,760 50,612 The future minimum lease payments under the finance lease agreements are as follows: Payable not later than one year 37,495 43,645 38,444 Payable later than one year and not later than five years 41,401 49,644 52,578 78,896 93,289 91,022 Less: Future financing charges (3,650) (4,528) (4,686) Present value of minimum finance lease payments 75,246 88,761 86,336
The significant general terms and conditions of the finance leases are as follows: the Group is restricted from selling, lending, leasing, or otherwise disposing of or ceasing to exercise direct
control over the leased assets; the Group is restricted from creating or allowing any encumbrance to all or any part of the leased assets; and all leased assets are pledged as collateral for the underlying finance lease payables.
Syndicated Loan, net of unamortised financing cost of US$2,554 (2010: US$4,430 and 1 January 2010: US$6,123) 384,946 483,070 543,877 Syndicated Bank Loan SIS, net of unamortised financing cost of US$13,191 (2010: US$nil) 286,809 US$750,000 Facility Agreement, net of unamortised financing cost of US$5,876 144,124 Amortising Revolving Credit Facility, net of unamortised financing cost of US$5,349 414,651 Senior Credit Facility (syndicated loan), net of unamortised financing cost of US$nil (2010: US$3,643 and 1 January 2010: US$5,054) 220,517 225,306 PT Bank OCBC NISP Tbk 11,499 13,749 15,000 1,242,029 717,336 784,183 Less: Current portion (102,549) (149,814) (193,950) Noncurrent portion 1,139,480 567,522 590,233
* As restated (refer to Note 3)
(Expressed in thousand US Dollars, unless otherwise stated)
(continued) The interest rates on the longterm bank loans are as follows:
US Dollars 1.7% 4.6% 1.4% 4.8% 1.5% 6.7%
On 2 November 2007, Adaro and Coaltrade, as the Borrowers, entered into a syndicated loan facility agreement with several foreign banks (the “Lenders”), which consisted of DBS Bank Ltd, Standard Chartered Bank (Singapore branch), Sumitomo Mitsui Banking Corporation (Singapore branch) (“SMBC”), the Bank of TokyoMitsubishi UFJ Ltd (Singapore branch) and United Overseas Bank Ltd (Singapore and Labuan branch), wherein DBS Bank Ltd acted as the facility agent. Based on the agreement, the Lenders agreed to grant bank loan facilities of US$750,000, of which Adaro and Coaltrade obtained facilities of US$550,000 and US$200,000, respectively. These facilities consisted of a term loan facility of US$650,000 and a revolving loan facility of US$100,000 with interest rates at London Interbank Offered Rate (“LIBOR”) plus a certain percentage. These facilities were used to refinance certain existing loans of Adaro.
The term loan facility is payable quarterly with the first installment on 7 March 2008. The term loan facility had a maturity date on the fifth anniversary from the date of the loan agreement. Based on the amended agreement dated 25 March 2010, the Company, IBT and the Borrowers (collectively hereinafter referred to as the “Guarantors”), act as the guarantors of this syndicated loan.
On 30 September 2010, the Borrowers, the Guarantors and DBS Bank Ltd, as the facility agent, entered into an amendment agreement to amend the maturity date of the term loan facility to 7 December 2015 and all amounts outstanding under the revolving loan facility shall be deemed to be amounts outstanding under the term loan facility. The margin of interest was increased by a certain percentage. The effective date of this amendment agreement is 7 October 2010.
The remaining payment schedule for the outstanding term loan, after the amendment agreement, is as follows:
2012 73,079 26,921 100,000 2013 73,079 26,921 100,000 2014 73,079 26,921 100,000 2015 65,864 21,636 87,500 285,101 102,399 387,500 In accordance with the loan agreements, Adaro, IBT and Coaltrade (the “Primary Operating Companies”) are required to maintain certain financial ratios, with which the Primary Operating Companies were in compliance as at 31 December 2011. The Primary Operating Companies are also required to comply with certain terms and conditions with regard to its Articles of Association, the nature of business, dividends, corporate actions, financing activities and other matters. The Primary Operating Companies are in compliance with the terms and conditions.
On 13 August 2008, SIS (the “Borrower”) and the Company (the “Guarantor”), entered into a Senior Credit Facility agreement of US$300,000 with a syndicate of banks consisting of ANZ Banking Group Ltd, Calyon, Standard Chartered Bank, DBS Bank Ltd, SMBC, United Overseas Bank Ltd, The Bank of TokyoMitsubishi UFJ Ltd (Singapore Branch), OverseaChinese Banking Corporation Ltd, PT Bank Ekspor Indonesia (“BEI”), PT Bank Mandiri (Persero) Tbk (“Mandiri”) (Singapore Branch) as Mandated Lead Arrangers, SMBC as Facility Agent, PT ANZ Panin Bank as Common Security Agent and DBS Bank Ltd and PT Bank DBS Indonesia as account banks.
* As restated (refer to Note 3)

Adaro Energy Annual Report 2011 www.adaro.com234
(Expressed in thousand US Dollars, unless otherwise stated)
(continued)
(continued) This facility had a final maturity date of 30 June 2013 and was payable on a quarterly basis. This facility bears interest at LIBOR plus a certain percentage. This credit facility was used for the purpose of refinancing all the bank and other third party loans and to finance the capital expenditures, working capital and the acquisition of shares in APM. Under this senior credit facility agreement, SIS was required to maintain certain financial ratios. SIS was also required to comply with certain terms and conditions with regard to its Articles of Association, the nature of business, corporate actions, financing activities and other matters. SIS is in compliance with the related terms and conditions. This loan was collateralised by: all trade receivables owned by SIS; all equipment, machinery, vehicles and other moveable goods owned by SIS; insurance claims on all equipment, machinery, vehicles and other moveable goods owned by SIS; all Principal Agreements owned by SIS; land and buildings owned by APM; and a corporate guarantee from the Company.
In August 2010, SIS made an additional drawdown of US$40,000. As at 31 December 2010, the outstanding balance of this facility was US$224,160. In March 2011, SIS refinanced all the outstanding loan balance under Senior Credit amounting to US$224,160 by entering into a new syndicated loan (refer to Note 21d).
On 3 December 2009, SDM obtained a term loan facility of US$15,000 from PT Bank OCBC NISP Tbk. This credit facility was used for the purpose of refinancing a portion of the Barito Channel project cost which was previously financed by ATA. The facility has a final maturity date of five years after first withdrawal and is payable on a semester basis. The loan bears interest at 3month Singapore Interbank Offered Rate (“SIBOR”) plus a certain percentage and is payable on a quarterly basis. Under the loan agreement, SDM is required to maintain certain financial ratios, with which SDM was in compliance as at 31 December 2011. SDM is also required to comply with certain terms and conditions with regards to its Articles of Association, the nature of business, corporate actions, financing activities and other matters. SDM is in compliance with the related terms and conditions. The loan is collateralised by: all trade receivables owned by SDM at the maximum of US$15,000; insurance claim which covers the risk of operating loss; and Letter of Comfort from Adaro. As at 31 December 2011, the outstanding balance of this facility was US$11,499 (31 December 2010: US$13,749) which is repayable according to the following schedule:
2012 3,000 2013 3,500 2014 4,999 11,499
(Expressed in thousand US Dollars, unless otherwise stated)
(continued)
On 18 February 2011, SIS, as Borrower, entered into a Facility Agreement of US$400,000 with a syndicate of banks consisting of The Hongkong and Shanghai Banking Corporation Limited, OverseaChinese Banking Corporation Limited, PT Bank UOB Buana, DBS Bank Ltd, Sumitomo Mitsui Banking Corporation (Singapore Branch), PT Bank Mandiri (Persero) Tbk (Singapore Branch), The Bank of TokyoMitsubishi UFJ Ltd (Jakarta Branch), PT ANZ Panin Bank, PT Bank OCBC NISP Tbk, Credit Agricole Corporate and Investment Bank and Standard Chartered Bank (Jakarta Branch) as Mandated Lead Arrangers, Chinatrust Commercial Bank Co Ltd (Singapore Branch) and Societe Generale (Singapore Branch) as Lead Arrangers, The Hongkong and Shanghai Banking Corporation Limited as Facility Agent, PT DBS Bank Indonesia as Security Agent and OverseaChinese Banking Corporation Limited and PT Bank OCBC NISP Tbk as Account Banks. The Company, under this Facilities Agreement provides corporate guarantee. This loan is collateralised by the mining service contract with Adaro. These facilities consist of a term loan facility of US$300,000 and a revolving loan facility of US$100,000. This loan facility was used for the purpose of refinancing the Senior Credit facility, to finance the capital expenditure, payment of transaction costs and expenses associated with the facility and other general corporate purpose. This loan facility has a final maturity date of 18 February 2018 and is payable on a quarterly basis. This facility bears interest at LIBOR plus a certain percentage. Under this senior credit facility agreement, SIS is required to maintain certain financial ratios, with which SIS was in compliance as at 31 December 2011. SIS is also required to comply with certain terms and conditions with regard to its Articles of Association, the nature of business, corporate actions, financing activities and others. SIS is in compliance with the related terms and conditions. As at 31 December 2011, the outstanding balance of the term loan facility was US$300,000 (31 December 2010: US$nil), which is repayable according to the following schedule:
2014 33,750 2015 45,000 2016 56,250 2017 71,250 2018 93,750 300,000
On 2 October 2009, Adaro entered into an Amortising Revolving Credit Facility with a syndicate of banks consisting of OverseaChinese Banking Corporation Ltd, DBS Bank Ltd, Sumitomo Mitsui Banking Corporation (Singapore Branch), BNP Paribas (Singapore Branch), The Bank of TokyoMitsubishi UFJ Ltd (Singapore Branch), United Overseas Bank Ltd (Labuan Branch), Chinatrust Commercial Bank Co Ltd (Singapore Branch), PT ANZ Panin Bank, PT Bank Mandiri (Persero) Tbk (Singapore Branch), Standard Chartered Bank (Jakarta Branch) and The Hongkong and Shanghai Banking Corporation Ltd, in an aggregate amount of US$500,000 for capital expenditure purposes.

Adaro Energy Annual Report 2011www.adaro.com 235
(Expressed in thousand US Dollars, unless otherwise stated)
(continued)
(continued) This facility had a final maturity date of 30 June 2013 and was payable on a quarterly basis. This facility bears interest at LIBOR plus a certain percentage. This credit facility was used for the purpose of refinancing all the bank and other third party loans and to finance the capital expenditures, working capital and the acquisition of shares in APM. Under this senior credit facility agreement, SIS was required to maintain certain financial ratios. SIS was also required to comply with certain terms and conditions with regard to its Articles of Association, the nature of business, corporate actions, financing activities and other matters. SIS is in compliance with the related terms and conditions. This loan was collateralised by: all trade receivables owned by SIS; all equipment, machinery, vehicles and other moveable goods owned by SIS; insurance claims on all equipment, machinery, vehicles and other moveable goods owned by SIS; all Principal Agreements owned by SIS; land and buildings owned by APM; and a corporate guarantee from the Company.
In August 2010, SIS made an additional drawdown of US$40,000. As at 31 December 2010, the outstanding balance of this facility was US$224,160. In March 2011, SIS refinanced all the outstanding loan balance under Senior Credit amounting to US$224,160 by entering into a new syndicated loan (refer to Note 21d).
On 3 December 2009, SDM obtained a term loan facility of US$15,000 from PT Bank OCBC NISP Tbk. This credit facility was used for the purpose of refinancing a portion of the Barito Channel project cost which was previously financed by ATA. The facility has a final maturity date of five years after first withdrawal and is payable on a semester basis. The loan bears interest at 3month Singapore Interbank Offered Rate (“SIBOR”) plus a certain percentage and is payable on a quarterly basis. Under the loan agreement, SDM is required to maintain certain financial ratios, with which SDM was in compliance as at 31 December 2011. SDM is also required to comply with certain terms and conditions with regards to its Articles of Association, the nature of business, corporate actions, financing activities and other matters. SDM is in compliance with the related terms and conditions. The loan is collateralised by: all trade receivables owned by SDM at the maximum of US$15,000; insurance claim which covers the risk of operating loss; and Letter of Comfort from Adaro. As at 31 December 2011, the outstanding balance of this facility was US$11,499 (31 December 2010: US$13,749) which is repayable according to the following schedule:
2012 3,000 2013 3,500 2014 4,999 11,499
(Expressed in thousand US Dollars, unless otherwise stated)
(continued)
On 18 February 2011, SIS, as Borrower, entered into a Facility Agreement of US$400,000 with a syndicate of banks consisting of The Hongkong and Shanghai Banking Corporation Limited, OverseaChinese Banking Corporation Limited, PT Bank UOB Buana, DBS Bank Ltd, Sumitomo Mitsui Banking Corporation (Singapore Branch), PT Bank Mandiri (Persero) Tbk (Singapore Branch), The Bank of TokyoMitsubishi UFJ Ltd (Jakarta Branch), PT ANZ Panin Bank, PT Bank OCBC NISP Tbk, Credit Agricole Corporate and Investment Bank and Standard Chartered Bank (Jakarta Branch) as Mandated Lead Arrangers, Chinatrust Commercial Bank Co Ltd (Singapore Branch) and Societe Generale (Singapore Branch) as Lead Arrangers, The Hongkong and Shanghai Banking Corporation Limited as Facility Agent, PT DBS Bank Indonesia as Security Agent and OverseaChinese Banking Corporation Limited and PT Bank OCBC NISP Tbk as Account Banks. The Company, under this Facilities Agreement provides corporate guarantee. This loan is collateralised by the mining service contract with Adaro. These facilities consist of a term loan facility of US$300,000 and a revolving loan facility of US$100,000. This loan facility was used for the purpose of refinancing the Senior Credit facility, to finance the capital expenditure, payment of transaction costs and expenses associated with the facility and other general corporate purpose. This loan facility has a final maturity date of 18 February 2018 and is payable on a quarterly basis. This facility bears interest at LIBOR plus a certain percentage. Under this senior credit facility agreement, SIS is required to maintain certain financial ratios, with which SIS was in compliance as at 31 December 2011. SIS is also required to comply with certain terms and conditions with regard to its Articles of Association, the nature of business, corporate actions, financing activities and others. SIS is in compliance with the related terms and conditions. As at 31 December 2011, the outstanding balance of the term loan facility was US$300,000 (31 December 2010: US$nil), which is repayable according to the following schedule:
2014 33,750 2015 45,000 2016 56,250 2017 71,250 2018 93,750 300,000
On 2 October 2009, Adaro entered into an Amortising Revolving Credit Facility with a syndicate of banks consisting of OverseaChinese Banking Corporation Ltd, DBS Bank Ltd, Sumitomo Mitsui Banking Corporation (Singapore Branch), BNP Paribas (Singapore Branch), The Bank of TokyoMitsubishi UFJ Ltd (Singapore Branch), United Overseas Bank Ltd (Labuan Branch), Chinatrust Commercial Bank Co Ltd (Singapore Branch), PT ANZ Panin Bank, PT Bank Mandiri (Persero) Tbk (Singapore Branch), Standard Chartered Bank (Jakarta Branch) and The Hongkong and Shanghai Banking Corporation Ltd, in an aggregate amount of US$500,000 for capital expenditure purposes.

Adaro Energy Annual Report 2011 www.adaro.com236
(Expressed in thousand US Dollars, unless otherwise stated)
(continued)
(continued)
The availability of the loan will be stepped down as set forth in the table below:
The date falling 12 months after 2 October 2009 US$460,000 The date falling 24 months after 2 October 2009 US$420,000 The date falling 36 months after 2 October 2009 US$380,000 The date falling 48 months after 2 October 2009 US$230,000 Final maturity 2 October 2014 US$0
This facility will be charged with interest rates at LIBOR plus a certain percentage and has a maturity date on the date falling five years after the date of this loan agreement. The Company acted as the guarantor for this loan facility. In 2011, Adaro made drawndowns amounting to US$420,000. As at 31 December 2011, the outstanding balance on this facility amounted to US$420,000.
In accordance with the loan agreement, Adaro is required to maintain certain financial ratios, with which Adaro was in compliance as at 31 December 2011. Adaro is also required to comply with certain terms and conditions with regard to its Articles of Association, the nature of business, dividends, corporate actions, financing activities and other matters. Adaro is in compliance with the related terms and conditions.
On 4 July 2011, Adaro, as the Borrower, entered into a syndicated loan facility agreement with several banks (the “Lenders”) which consisted of DBS Bank Ltd, OverseaChinese Banking Corporation Limited, PT Bank Mandiri (Persero) Tbk., The Bank of TokyoMitsubishi UFJ Ltd (Singapore Branch) and The Bank of TokyoMitsubishi UFJ Ltd (Jakarta Branch), wherein PT Bank Mandiri (Persero) Tbk acts as the facility agent. These facilities consist of a term loan facility of US$350,000 and an amortising revolving loan facility of US$400,000, with interest rates at LIBOR plus a certain percentage. These facilities were used for capital expenditure, working capital and other general corporate purposes. The Company acts as the guarantor of this syndicated loan. The term loan facility is payable quarterly with the first installment on 4 October 2012. The availability of the amortising revolving loan facility will be stepped down as set forth in the table below:
4 July 2011 4 July 2013 US$400,000 5 July 2013 4 July 2014 US$378,500 5 July 2014 4 July 2015 US$352,000 5 July 2015 4 July 2016 US$317,500 5 July 2016 4 July 2017 US$275,000 5 July 2017 4 July 2018 US$227,000 5 July 2018 4 July 2020 US$218,500 5 July 2020 4 April 2021 US$149,500 5 April 2021 4 July 2021 US$0 Both the term loan facility and the amortising revolving loan facility have a maturity date on the tenth anniversary from the date of the loan agreement. As at 31 December 2011, Adaro had made drawdowns on the term loan facility amounting to US$150,000, which is repayable according to the following schedule:
(Expressed in thousand US Dollars, unless otherwise stated)
(continued)
(continued) 2012 1,929 2013 8,143 2014 10,286 2015 13,500 2016 16,071 2017 18,428 2018 14,786 2019 6,428 2020 29,036 2021 31,393 150,000
In accordance with the loan agreement, Adaro is required to maintain certain financial ratios, with which Adaro was in compliance as at 31 December 2011. Adaro is also required to comply with certain terms and conditions with regard to its Articles of Association, the nature of business, dividends, corporate actions, financing activities and other matters. Adaro is in compliance with the related terms and conditions.
Face value 800,000 800,000 800,000 Discount and issue cost (15,161) (15,161) (15,161) Amortisation of discount and issue cost 2,453 1,309 251 787,292 786,148 785,090
On 22 October 2009, Adaro issued Guaranteed Senior Notes (the “Senior Notes”) amounting to US$800,000, with a selling price of 99.141%. The Senior Notes will mature in 2019. The Senior Notes bear a fixed interest rate of 7.625%, payable semiannually in arrears on 22 April and 22 October of each year commencing on 22 April 2010. The Senior Notes are unconditionally and irrevocably guaranteed by the Company. The Senior Notes were issued under an indenture between Adaro, the Company and The Bank of New York Mellon, as the trustee. The Senior Notes have been rated “Ba1” by Moody’s and “BB+” by Fitch. The ratings reflect the rating agencies’ assessments of the likelihood of timely payment of the principal and interest on the Senior Notes. The proceeds of the Senior Notes will be used primarily to finance the expansion of the Group’s infrastructure to support the expansion of Adaro’s coal production capacity. The Senior Notes and the guarantee of the Senior Notes are unsecured and rank equally with all existing and future unsecured senior debt of Adaro and the Company, respectively. The Senior Notes and the guarantee of the Senior Notes are effectively subordinated to all of Adaro’s and the Company’s existing and future secured debt to the extent of the assets securing the debt. The Company’s guarantee of the Senior Notes is structurally subordinated to all liabilities (including trade payables) of all of the Company’s other subsidiaries, which are not initially issuing guarantees for the Senior Notes. The Company may in the future designate its subsidiaries to guarantee the Senior Notes. The Senior Notes were listed on the Singapore Exchange Securities Trading. Adaro and the Company are required to comply with certain terms and conditions on incurrence of indebtedness and issue of disqualified stock, designation of the Subsidiary’s Guarantor, merger, consolidation and sales of assets, certain transactions with affiliates, business activities and other matters. Adaro and the Company are in compliance with the related terms and conditions.
* As restated (refer to Note 3)
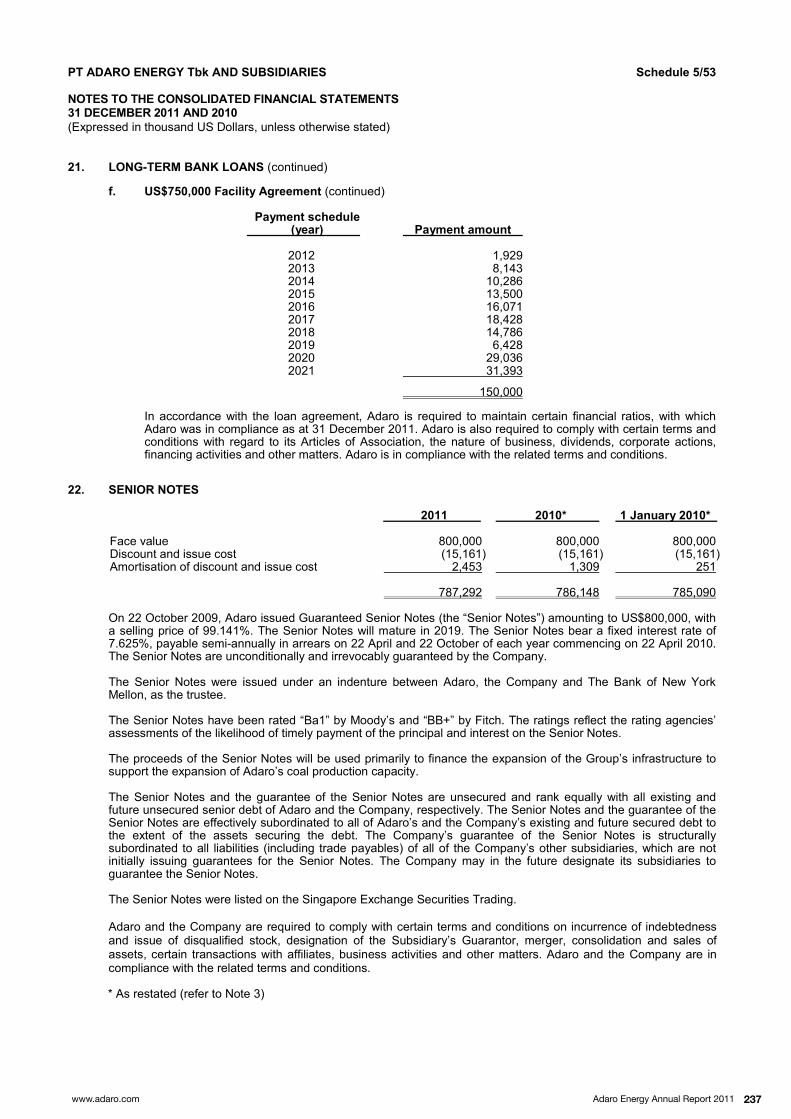
Adaro Energy Annual Report 2011www.adaro.com 237
(Expressed in thousand US Dollars, unless otherwise stated)
(continued)
(continued)
The availability of the loan will be stepped down as set forth in the table below:
The date falling 12 months after 2 October 2009 US$460,000 The date falling 24 months after 2 October 2009 US$420,000 The date falling 36 months after 2 October 2009 US$380,000 The date falling 48 months after 2 October 2009 US$230,000 Final maturity 2 October 2014 US$0
This facility will be charged with interest rates at LIBOR plus a certain percentage and has a maturity date on the date falling five years after the date of this loan agreement. The Company acted as the guarantor for this loan facility. In 2011, Adaro made drawndowns amounting to US$420,000. As at 31 December 2011, the outstanding balance on this facility amounted to US$420,000.
In accordance with the loan agreement, Adaro is required to maintain certain financial ratios, with which Adaro was in compliance as at 31 December 2011. Adaro is also required to comply with certain terms and conditions with regard to its Articles of Association, the nature of business, dividends, corporate actions, financing activities and other matters. Adaro is in compliance with the related terms and conditions.
On 4 July 2011, Adaro, as the Borrower, entered into a syndicated loan facility agreement with several banks (the “Lenders”) which consisted of DBS Bank Ltd, OverseaChinese Banking Corporation Limited, PT Bank Mandiri (Persero) Tbk., The Bank of TokyoMitsubishi UFJ Ltd (Singapore Branch) and The Bank of TokyoMitsubishi UFJ Ltd (Jakarta Branch), wherein PT Bank Mandiri (Persero) Tbk acts as the facility agent. These facilities consist of a term loan facility of US$350,000 and an amortising revolving loan facility of US$400,000, with interest rates at LIBOR plus a certain percentage. These facilities were used for capital expenditure, working capital and other general corporate purposes. The Company acts as the guarantor of this syndicated loan. The term loan facility is payable quarterly with the first installment on 4 October 2012. The availability of the amortising revolving loan facility will be stepped down as set forth in the table below:
4 July 2011 4 July 2013 US$400,000 5 July 2013 4 July 2014 US$378,500 5 July 2014 4 July 2015 US$352,000 5 July 2015 4 July 2016 US$317,500 5 July 2016 4 July 2017 US$275,000 5 July 2017 4 July 2018 US$227,000 5 July 2018 4 July 2020 US$218,500 5 July 2020 4 April 2021 US$149,500 5 April 2021 4 July 2021 US$0 Both the term loan facility and the amortising revolving loan facility have a maturity date on the tenth anniversary from the date of the loan agreement. As at 31 December 2011, Adaro had made drawdowns on the term loan facility amounting to US$150,000, which is repayable according to the following schedule:
(Expressed in thousand US Dollars, unless otherwise stated)
(continued)
(continued) 2012 1,929 2013 8,143 2014 10,286 2015 13,500 2016 16,071 2017 18,428 2018 14,786 2019 6,428 2020 29,036 2021 31,393 150,000
In accordance with the loan agreement, Adaro is required to maintain certain financial ratios, with which Adaro was in compliance as at 31 December 2011. Adaro is also required to comply with certain terms and conditions with regard to its Articles of Association, the nature of business, dividends, corporate actions, financing activities and other matters. Adaro is in compliance with the related terms and conditions.
Face value 800,000 800,000 800,000 Discount and issue cost (15,161) (15,161) (15,161) Amortisation of discount and issue cost 2,453 1,309 251 787,292 786,148 785,090
On 22 October 2009, Adaro issued Guaranteed Senior Notes (the “Senior Notes”) amounting to US$800,000, with a selling price of 99.141%. The Senior Notes will mature in 2019. The Senior Notes bear a fixed interest rate of 7.625%, payable semiannually in arrears on 22 April and 22 October of each year commencing on 22 April 2010. The Senior Notes are unconditionally and irrevocably guaranteed by the Company. The Senior Notes were issued under an indenture between Adaro, the Company and The Bank of New York Mellon, as the trustee. The Senior Notes have been rated “Ba1” by Moody’s and “BB+” by Fitch. The ratings reflect the rating agencies’ assessments of the likelihood of timely payment of the principal and interest on the Senior Notes. The proceeds of the Senior Notes will be used primarily to finance the expansion of the Group’s infrastructure to support the expansion of Adaro’s coal production capacity. The Senior Notes and the guarantee of the Senior Notes are unsecured and rank equally with all existing and future unsecured senior debt of Adaro and the Company, respectively. The Senior Notes and the guarantee of the Senior Notes are effectively subordinated to all of Adaro’s and the Company’s existing and future secured debt to the extent of the assets securing the debt. The Company’s guarantee of the Senior Notes is structurally subordinated to all liabilities (including trade payables) of all of the Company’s other subsidiaries, which are not initially issuing guarantees for the Senior Notes. The Company may in the future designate its subsidiaries to guarantee the Senior Notes. The Senior Notes were listed on the Singapore Exchange Securities Trading. Adaro and the Company are required to comply with certain terms and conditions on incurrence of indebtedness and issue of disqualified stock, designation of the Subsidiary’s Guarantor, merger, consolidation and sales of assets, certain transactions with affiliates, business activities and other matters. Adaro and the Company are in compliance with the related terms and conditions.
* As restated (refer to Note 3)

Adaro Energy Annual Report 2011 www.adaro.com238
(Expressed in thousand US Dollars, unless otherwise stated)
PT Agrarizki Media 20,000 PT Servo Infrastruktur 16,542 36,542
The interest rates on the loans to third parties are as follows:
US Dollars 1.3% 9% On 1 July 2011, ATA entered into a Loan Agreement with PT Agrarizki Media, whereas ATA will provide loan facility of US$20,000. This loan bears annual fixed interest rate and the interest will be paid every three months from the date of the first drawdown. This loan was due on 30 December 2011. On 23 December 2011, the maturity of this loan was extended to 30 June 2012.
On 10 October 2011, ATA entered into a Loan Agreement with PT Servo Infrastruktur (“SI”), whereas ATA will provide a loan facility of US$16,670 (equivalent to Rp 150 billion) to SI. ATA also will provide an additional loan facility of US$4,440 (equivalent to Rp 40 billion) based on a written request and on the discretion of ATA. This loan bears interest at LIBOR plus a certain percentage and the interest will be paid every month from the date of the first drawdown. This loan will be due on 10 October 2012.
Carrying amount beginning balance 34,304 38,934 Amortisation (2,816) (3,063) 31,488 35,871 Movement of deferred stripping costs (79,399) (1,567) (47,911) 34,304
The actual average stripping ratio for the Tutupan area for the year ended 31 December 2011 was 6.69:1 (31 December 2010: 5.52:1) and for the Wara area was 3.34:1 (31 December 2010: 2.70:1). The planned stripping ratio for the Tutupan area as at 31 December 2011 was 6.36:1 (31 December 2010: 5.50:1) and for the Wara area was 2.00:1 (31 December 2010: 2.67:1).
* As restated (refer to Note 3)
(Expressed in thousand US Dollars, unless otherwise stated)
Percentage of noncontrolling interest 48.80% 48.80% Carrying amount beginning balance 2,834 2,976 Share in net income/(loss) of subsidiary 1,644 (142)
4,478 2,834
Percentage of noncontrolling interest 14.00% 14.00% Carrying amount beginning balance 205 324 Share in net income/(loss) of subsidiary 171 (154) Increase due to change in equity of subsidiary 33 34 Exchange difference due to financial statement translation 1 409 205
Percentage of noncontrolling interest 15.00% Noncontrolling interest at acquisition (223) Share in net loss of subsidiary (19) Additional during the year 600 Exchange difference due to financial statement translation (16) 342
Percentage of noncontrolling interest 25.00% Noncontrolling interest at acquisition 710 Share in net loss of subsidiary (48) Exchange difference due to financial statement translation (43)
619
Percentage of noncontrolling interest 48.98% Noncontrolling interest at acquisition 293 293
Percentage of noncontrolling interest 38.96% Noncontrolling interest at acquisition 43 Exchange difference due to financial statement translation (1)
42
* As restated (refer to Note 3)

Adaro Energy Annual Report 2011www.adaro.com 239
(Expressed in thousand US Dollars, unless otherwise stated)
PT Agrarizki Media 20,000 PT Servo Infrastruktur 16,542 36,542
The interest rates on the loans to third parties are as follows:
US Dollars 1.3% 9% On 1 July 2011, ATA entered into a Loan Agreement with PT Agrarizki Media, whereas ATA will provide loan facility of US$20,000. This loan bears annual fixed interest rate and the interest will be paid every three months from the date of the first drawdown. This loan was due on 30 December 2011. On 23 December 2011, the maturity of this loan was extended to 30 June 2012.
On 10 October 2011, ATA entered into a Loan Agreement with PT Servo Infrastruktur (“SI”), whereas ATA will provide a loan facility of US$16,670 (equivalent to Rp 150 billion) to SI. ATA also will provide an additional loan facility of US$4,440 (equivalent to Rp 40 billion) based on a written request and on the discretion of ATA. This loan bears interest at LIBOR plus a certain percentage and the interest will be paid every month from the date of the first drawdown. This loan will be due on 10 October 2012.
Carrying amount beginning balance 34,304 38,934 Amortisation (2,816) (3,063) 31,488 35,871 Movement of deferred stripping costs (79,399) (1,567) (47,911) 34,304
The actual average stripping ratio for the Tutupan area for the year ended 31 December 2011 was 6.69:1 (31 December 2010: 5.52:1) and for the Wara area was 3.34:1 (31 December 2010: 2.70:1). The planned stripping ratio for the Tutupan area as at 31 December 2011 was 6.36:1 (31 December 2010: 5.50:1) and for the Wara area was 2.00:1 (31 December 2010: 2.67:1).
* As restated (refer to Note 3)
(Expressed in thousand US Dollars, unless otherwise stated)
Percentage of noncontrolling interest 48.80% 48.80% Carrying amount beginning balance 2,834 2,976 Share in net income/(loss) of subsidiary 1,644 (142)
4,478 2,834
Percentage of noncontrolling interest 14.00% 14.00% Carrying amount beginning balance 205 324 Share in net income/(loss) of subsidiary 171 (154) Increase due to change in equity of subsidiary 33 34 Exchange difference due to financial statement translation 1 409 205
Percentage of noncontrolling interest 15.00% Noncontrolling interest at acquisition (223) Share in net loss of subsidiary (19) Additional during the year 600 Exchange difference due to financial statement translation (16) 342
Percentage of noncontrolling interest 25.00% Noncontrolling interest at acquisition 710 Share in net loss of subsidiary (48) Exchange difference due to financial statement translation (43)
619
Percentage of noncontrolling interest 48.98% Noncontrolling interest at acquisition 293 293
Percentage of noncontrolling interest 38.96% Noncontrolling interest at acquisition 43 Exchange difference due to financial statement translation (1)
42
* As restated (refer to Note 3)

Adaro Energy Annual Report 2011 www.adaro.com240
(Expressed in thousand US Dollars, unless otherwise stated)
(continued)
(continued)
Percentage of noncontrolling interest 25.50% 25.50% Carrying amount beginning balance 169 171 Share in net income/(loss) of subsidiary 1 (10) Exchange difference due to financial statement translation (1) 8 169 169
Percentage of noncontrolling interest Carrying amount beginning balance 1,639 Decrease due to acquisition of noncontrolling interest by the Group (1,639) 6,352 3,208
SDM 1,644 (142) MIP (48) IMPT (19) Coronado 171 (154) Marindo 1 (10) 1,749 (306)
All shares in the Company have been listed on the Indonesian Stock Exchange since 16 July 2008. The Company’s shareholders as at 31 December 2011, 31 December 2010 and 1 January 2010 based on the records maintained by PT Kustodian Sentral Efek Indonesia (“KSEI”), the share administrator, were as follows: PT Adaro Strategic Investments 14,045,425,500 43.91 150,589 Garibaldi Thohir (President Director) 1,967,600,654 6.15 21,096 Edwin Soeryadjaya (President Commissioner) 1,359,777,646 4.25 14,579 Theodore Permadi Rachmat (Vice President Commissioner) 707,420,430 2.21 7,585 Sandiaga Salahuddin Uno (Director) 633,338,202 1.98 6,790 Ir. Subianto (Commissioner) 416,932,620 1.30 4,470 Andre J. Mamuaya (Director) 7,545,000 0.02 81 Chia Ah Hoo (Director) 4,815,500 0.01 52 Public 12,843,106,448 40.17 137,698 31,985,962,000 100.00 342,940 * As restated (refer to Notes 3)
(Expressed in thousand US Dollars, unless otherwise stated)
(continued)
PT Adaro Strategic Investments 14,045,425,500 43.91 150,589 Garibaldi Thohir (President Director) 1,967,600,654 6.15 21,096 Edwin Soeryadjaya (President Commissioner) 1,359,777,646 4.25 14,579 Theodore Permadi Rachmat (Vice President Commissioner) 707,420,430 2.21 7,585 Sandiaga Salahuddin Uno (Director) 633,338,202 1.98 6,790 Ir. Subianto (Commissioner) 416,932,620 1.30 4,470 Andre J. Mamuaya (Director) 7,545,000 0.02 81 Chia Ah Hoo (Director) 4,815,500 0.01 52 Alastair Bruce Grant (Director) 1,414,500 0.00 15 Public 12,841,691,948 40.17 137,683 31,985,962,000 100.00 342,940
PT Adaro Strategic Investments 14,045,425,500 43.91 150,589 Garibaldi Thohir (President Director) 2,065,100,654 6.46 22,141 GSCO Adcorp Holdings 1,656,321,073 5.18 17,758 Edwin Soeryadjaya (President Commissioner) 1,377,777,646 4.31 14,772 Theodore Permadi Rachmat (Vice President Commissioner) 724,420,430 2.27 7,767 Sandiaga Salahuddin Uno (Director) 660,838,202 2.07 7,085 Ir. Subianto (Commissioner) 416,932,620 1.30 4,470 Andre J. Mamuaya (Director) 8,545,000 0.03 92 Alastair Bruce Grant (Director) 6,764,500 0.02 73 Chia Ah Hoo (Director) 6,315,500 0.02 68 David Tendian (Director) 2,250,000 0.01 24 Public 11,015,270,875 34.42 118,101 31,985,962,000 100.00 342,940
Additional paidincapital from IPO 1,219,813 1,219,813 1,219,813 Share issue costs (44,532) (44,532) (44,532) Additional paidincapital 1,175,281 1,175,281 1,175,281
The additional paidincapital represents the balance from the initial public offering in 2008.
Cost of acquisition 36,114 36,114 36,114 Book value of net assets acquired (42,251) (42,251) (42,251) Difference in value from restructuring transactions of entities under common control (6,137) (6,137) (6,137)
* As restated (refer to Note 3)

Adaro Energy Annual Report 2011www.adaro.com 241
(Expressed in thousand US Dollars, unless otherwise stated)
(continued)
(continued)
Percentage of noncontrolling interest 25.50% 25.50% Carrying amount beginning balance 169 171 Share in net income/(loss) of subsidiary 1 (10) Exchange difference due to financial statement translation (1) 8 169 169
Percentage of noncontrolling interest Carrying amount beginning balance 1,639 Decrease due to acquisition of noncontrolling interest by the Group (1,639) 6,352 3,208
SDM 1,644 (142) MIP (48) IMPT (19) Coronado 171 (154) Marindo 1 (10) 1,749 (306)
All shares in the Company have been listed on the Indonesian Stock Exchange since 16 July 2008. The Company’s shareholders as at 31 December 2011, 31 December 2010 and 1 January 2010 based on the records maintained by PT Kustodian Sentral Efek Indonesia (“KSEI”), the share administrator, were as follows: PT Adaro Strategic Investments 14,045,425,500 43.91 150,589 Garibaldi Thohir (President Director) 1,967,600,654 6.15 21,096 Edwin Soeryadjaya (President Commissioner) 1,359,777,646 4.25 14,579 Theodore Permadi Rachmat (Vice President Commissioner) 707,420,430 2.21 7,585 Sandiaga Salahuddin Uno (Director) 633,338,202 1.98 6,790 Ir. Subianto (Commissioner) 416,932,620 1.30 4,470 Andre J. Mamuaya (Director) 7,545,000 0.02 81 Chia Ah Hoo (Director) 4,815,500 0.01 52 Public 12,843,106,448 40.17 137,698 31,985,962,000 100.00 342,940 * As restated (refer to Notes 3)
(Expressed in thousand US Dollars, unless otherwise stated)
(continued)
PT Adaro Strategic Investments 14,045,425,500 43.91 150,589 Garibaldi Thohir (President Director) 1,967,600,654 6.15 21,096 Edwin Soeryadjaya (President Commissioner) 1,359,777,646 4.25 14,579 Theodore Permadi Rachmat (Vice President Commissioner) 707,420,430 2.21 7,585 Sandiaga Salahuddin Uno (Director) 633,338,202 1.98 6,790 Ir. Subianto (Commissioner) 416,932,620 1.30 4,470 Andre J. Mamuaya (Director) 7,545,000 0.02 81 Chia Ah Hoo (Director) 4,815,500 0.01 52 Alastair Bruce Grant (Director) 1,414,500 0.00 15 Public 12,841,691,948 40.17 137,683 31,985,962,000 100.00 342,940
PT Adaro Strategic Investments 14,045,425,500 43.91 150,589 Garibaldi Thohir (President Director) 2,065,100,654 6.46 22,141 GSCO Adcorp Holdings 1,656,321,073 5.18 17,758 Edwin Soeryadjaya (President Commissioner) 1,377,777,646 4.31 14,772 Theodore Permadi Rachmat (Vice President Commissioner) 724,420,430 2.27 7,767 Sandiaga Salahuddin Uno (Director) 660,838,202 2.07 7,085 Ir. Subianto (Commissioner) 416,932,620 1.30 4,470 Andre J. Mamuaya (Director) 8,545,000 0.03 92 Alastair Bruce Grant (Director) 6,764,500 0.02 73 Chia Ah Hoo (Director) 6,315,500 0.02 68 David Tendian (Director) 2,250,000 0.01 24 Public 11,015,270,875 34.42 118,101 31,985,962,000 100.00 342,940
Additional paidincapital from IPO 1,219,813 1,219,813 1,219,813 Share issue costs (44,532) (44,532) (44,532) Additional paidincapital 1,175,281 1,175,281 1,175,281
The additional paidincapital represents the balance from the initial public offering in 2008.
Cost of acquisition 36,114 36,114 36,114 Book value of net assets acquired (42,251) (42,251) (42,251) Difference in value from restructuring transactions of entities under common control (6,137) (6,137) (6,137)
* As restated (refer to Note 3)

Adaro Energy Annual Report 2011 www.adaro.com242
(Expressed in thousand US Dollars, unless otherwise stated)
(continued)
Cost of acquisition 1,390,727 1,390,727 1,390,727 Book value of net assets acquired (1,364,041) (1,364,041) (1,364,041) Difference in value from restructuring transactions of entities under common control 26,686 26,686 26,686
Cost of acquisition 4,904 4,904 4,904 Book value of net assets acquired (4,666) (4,666) (4,666) Difference in value from restructuring transactions of entities under common control 238 238 238 20,787 20,787 20,787
The difference in value from restructuring transactions of entities under common control represents the difference between the acquisition cost and net book value of net assets acquired, incurred through restructuring transactions among entities under common control.
At the Company’s Annual General Meeting of Shareholders (“AGMS”) held on 23 April 2010, a total cash dividend for 2009 of Rp 927,593 million or equivalent to US$100,842 (Rp 29/share or equivalent to US$0.0032/sharefull amount), was approved. This included an interim cash dividend for 2009 of Rp 383,832 million or equivalent to US$40,531, paid on 30 December 2009. The remaining final cash dividend for 2009 of Rp 543,761 million, which was equivalent to US$60,311, was paid on 18 June 2010.
At the Company’s Board of Commissioners and Directors Meeting held on 4 November 2010, a total interim cash dividend for 2010 of Rp 315,062 million or equivalent to US$35,364 (Rp 9.85/share or equivalent to US$0.0011/sharefull amount), was approved. The cash dividend was paid on 10 December 2010. At the Company’s AGMS held on 20 April 2011, a total cash dividend for 2010 of Rp 970,774 million or equivalent to US$111,108 (Rp 30.35/share or equivalent to US$0.0035/sharefull amount) was approved. This included an interim cash dividend for 2010 of Rp 315,062 million or equivalent to US$35,364, paid on 10 December 2010. The remaining Rp 655,712 million, equivalent to US$75,744, final cash dividend for 2010, was paid on 9 June 2011. At the Company’s Board of Commissioners and Directors Meeting held on 8 November 2011, a total interim cash dividend for 2011 of US$75,167 (US$0.00235/sharefull amount), was approved. The cash dividend was paid on 9 December 2011.
Limited Liability Company Law of the Republic of Indonesia No. 1/1995 introduced in March 1995 and amended by Law No. 40/2007, issued in August 2007, requires the establishment of a general reserve from net income amounting to at least 20% of a company’s issued and paidup capital. There is no time limit on the establishment of that reserve. At the Company’s AGMS held on 3 June 2009, an appropriation of the statutory reserve was approved amounting to Rp 44,360 million (equivalent to US$4,582) from the 2008 consolidated net income.
At the Company’s AGMS held on 23 April 2010, an appropriation of the statutory reserve was approved amounting to Rp 218,363 million (equivalent to US$21,001) from the 2009 consolidated net income. At the Company’s AGMS held on 20 April 2011, an appropriation of the statutory reserve was approved amounting to Rp 110,336 million (equivalent to US$12,148) from the 2010 consolidated net income. * As restated (refer to Note 3)
(Expressed in thousand US Dollars, unless otherwise stated)
Export
Third parties 2,875,890 1,844,651 Domestic Third parties 829,893 662,539
3,705,783 2,507,190 Domestic Third parties 192,249 141,273 Export Third parties 4,698 6,472 Domestic Third parties 84,675 62,708
89,373 69,180 3,987,405 2,717,643
There are no customers having transactions of more than 10% of the consolidated revenue.
Mining 1,048,413 825,646 Coal processing 146,509 113,131 Total production costs 1,194,922 938,777 Royalties to Government 405,376 264,042 Freight and handling costs 283,918 309,534 Purchase of coal 275,271 85,602 Depreciation and other amortisation 100,595 63,221 Amortisation of mining properties 59,675 53,888 Coal inventory: Beginning balance 12,669 8,140 Ending balance (27,556) (12,669) Increase in coal inventory (14,887) (4,529) Total cost of revenue coal mining and trading 2,304,870 1,710,535
* As restated (refer to Notes 2b and 3)

Adaro Energy Annual Report 2011www.adaro.com 243
(Expressed in thousand US Dollars, unless otherwise stated)
(continued)
Cost of acquisition 1,390,727 1,390,727 1,390,727 Book value of net assets acquired (1,364,041) (1,364,041) (1,364,041) Difference in value from restructuring transactions of entities under common control 26,686 26,686 26,686
Cost of acquisition 4,904 4,904 4,904 Book value of net assets acquired (4,666) (4,666) (4,666) Difference in value from restructuring transactions of entities under common control 238 238 238 20,787 20,787 20,787
The difference in value from restructuring transactions of entities under common control represents the difference between the acquisition cost and net book value of net assets acquired, incurred through restructuring transactions among entities under common control.
At the Company’s Annual General Meeting of Shareholders (“AGMS”) held on 23 April 2010, a total cash dividend for 2009 of Rp 927,593 million or equivalent to US$100,842 (Rp 29/share or equivalent to US$0.0032/sharefull amount), was approved. This included an interim cash dividend for 2009 of Rp 383,832 million or equivalent to US$40,531, paid on 30 December 2009. The remaining final cash dividend for 2009 of Rp 543,761 million, which was equivalent to US$60,311, was paid on 18 June 2010.
At the Company’s Board of Commissioners and Directors Meeting held on 4 November 2010, a total interim cash dividend for 2010 of Rp 315,062 million or equivalent to US$35,364 (Rp 9.85/share or equivalent to US$0.0011/sharefull amount), was approved. The cash dividend was paid on 10 December 2010. At the Company’s AGMS held on 20 April 2011, a total cash dividend for 2010 of Rp 970,774 million or equivalent to US$111,108 (Rp 30.35/share or equivalent to US$0.0035/sharefull amount) was approved. This included an interim cash dividend for 2010 of Rp 315,062 million or equivalent to US$35,364, paid on 10 December 2010. The remaining Rp 655,712 million, equivalent to US$75,744, final cash dividend for 2010, was paid on 9 June 2011. At the Company’s Board of Commissioners and Directors Meeting held on 8 November 2011, a total interim cash dividend for 2011 of US$75,167 (US$0.00235/sharefull amount), was approved. The cash dividend was paid on 9 December 2011.
Limited Liability Company Law of the Republic of Indonesia No. 1/1995 introduced in March 1995 and amended by Law No. 40/2007, issued in August 2007, requires the establishment of a general reserve from net income amounting to at least 20% of a company’s issued and paidup capital. There is no time limit on the establishment of that reserve. At the Company’s AGMS held on 3 June 2009, an appropriation of the statutory reserve was approved amounting to Rp 44,360 million (equivalent to US$4,582) from the 2008 consolidated net income.
At the Company’s AGMS held on 23 April 2010, an appropriation of the statutory reserve was approved amounting to Rp 218,363 million (equivalent to US$21,001) from the 2009 consolidated net income. At the Company’s AGMS held on 20 April 2011, an appropriation of the statutory reserve was approved amounting to Rp 110,336 million (equivalent to US$12,148) from the 2010 consolidated net income. * As restated (refer to Note 3)
(Expressed in thousand US Dollars, unless otherwise stated)
Export
Third parties 2,875,890 1,844,651 Domestic Third parties 829,893 662,539
3,705,783 2,507,190 Domestic Third parties 192,249 141,273 Export Third parties 4,698 6,472 Domestic Third parties 84,675 62,708
89,373 69,180 3,987,405 2,717,643
There are no customers having transactions of more than 10% of the consolidated revenue.
Mining 1,048,413 825,646 Coal processing 146,509 113,131 Total production costs 1,194,922 938,777 Royalties to Government 405,376 264,042 Freight and handling costs 283,918 309,534 Purchase of coal 275,271 85,602 Depreciation and other amortisation 100,595 63,221 Amortisation of mining properties 59,675 53,888 Coal inventory: Beginning balance 12,669 8,140 Ending balance (27,556) (12,669) Increase in coal inventory (14,887) (4,529) Total cost of revenue coal mining and trading 2,304,870 1,710,535
* As restated (refer to Notes 2b and 3)

Adaro Energy Annual Report 2011 www.adaro.com244
(Expressed in thousand US Dollars, unless otherwise stated)
(continued)
Repair and maintenance 42,130 24,639 Consumables 41,558 28,729 Depreciation and amortisation 34,437 28,900 Employee costs 22,864 18,703 Subcontractors 14,921 11,174 Other costs (each below US$5,000) 12,973 9,014 Total cost of revenue mining services 168,883 121,159
Consumables 59,004 44,803 Depreciation and amortisation 8,153 6,981 Other costs (each below US$5,000) 18,102 5,442 Total cost of revenue others 85,259 57,226 2,559,012 1,888,920 Details of the suppliers having transactions of more than 10% of the consolidated cost of revenue are as follows:
Third parties: PT Pamapersada Nusantara 344,487 263,325 PT Shell Indonesia 296,838 216,625 641,325 479,950
Refer to Note 35 for details of related party balances and transactions.
Sales commission 63,162 52,076 Others 2,919 2,701 66,081 54,777
Employee costs 40,081 28,037 Others 38,660 34,414 78,741 62,451
* As restated (refer to Notes 2b and 3)
(Expressed in thousand US Dollars, unless otherwise stated)
Corporate income tax 3,133 1,350 785 VAT 13 3,133 1,350 798
Corporate income tax 14,511 65,213 24,321 VAT 7,930 3,158 1,876 Income tax Article 15 1,623 5,395 Final income tax Article 4(2) 119 33 22,441 70,113 31,625 25,574 71,463 32,423
Vehicle fuel tax receivable 41,556 33,370 22,243 VAT input 38,854 28,457 31,474 Deposit to Government 16,540 16,585 15,786 96,950 78,412 69,503 Less: Current portion (80,410) (78,412) (69,503) Noncurrent portion 16,540
Receivable relating to VAT input represents the balance of VAT input to be offset against the royalty payable due to the Government of Indonesia.
According to Government Regulation No. 144/2000 which has been effective from 1 January 2001, raw coal prior to processing to briquettes is no longer subject to VAT. Since that date, Adaro has been unable to seek restitution for VAT input. The Coordinating Minister for Economics has requested that the Minister of Finance postpone the implementation of this regulation. The final decision regarding this matter cannot be predicted at present. For the year ended 31 December 2011, Adaro has offset the claim for recoverable VAT input amounting to US$133,238 (31 December 2010: US$101,977, 2009: US$100,216, 2008: US$50,870, 2007: US$39,735, 2006: US$36,424, 2005: US$20,631, 2004: US$22,377, 2003: US$18,882, 2002: US$25,472 and 2001: US$857) against royalty payments due to the Government of Indonesia. Until 31 December 2011, Adaro has offset the claim for recoverable VAT input totalling US$550,679 against royalty payables. Based on the CCA, Adaro was subject to sales tax on services received, in accordance with prevailing laws and regulations. However, with the enforcement of Law No. 8 of 1983 regarding VAT, the regulations on sales tax were no longer valid. Adaro is of the opinion that the sales tax is different from VAT in both form and substance and therefore VAT is a new tax. According to the provisions of the CCA, the Government will pay and assume and hold Adaro harmless from this new tax. As such, management believes that Adaro can recover its VAT input in this manner and expects that the outstanding balance will be recovered in full. These consolidated financial statements do not include any adjustments that might ultimately result from the decision made by the Government regarding this matter. Refer to Note 40c for further details.
* As restated (refer to Note 3)

Adaro Energy Annual Report 2011www.adaro.com 245
(Expressed in thousand US Dollars, unless otherwise stated)
(continued)
Repair and maintenance 42,130 24,639 Consumables 41,558 28,729 Depreciation and amortisation 34,437 28,900 Employee costs 22,864 18,703 Subcontractors 14,921 11,174 Other costs (each below US$5,000) 12,973 9,014 Total cost of revenue mining services 168,883 121,159
Consumables 59,004 44,803 Depreciation and amortisation 8,153 6,981 Other costs (each below US$5,000) 18,102 5,442 Total cost of revenue others 85,259 57,226 2,559,012 1,888,920 Details of the suppliers having transactions of more than 10% of the consolidated cost of revenue are as follows:
Third parties: PT Pamapersada Nusantara 344,487 263,325 PT Shell Indonesia 296,838 216,625 641,325 479,950
Refer to Note 35 for details of related party balances and transactions.
Sales commission 63,162 52,076 Others 2,919 2,701 66,081 54,777
Employee costs 40,081 28,037 Others 38,660 34,414 78,741 62,451
* As restated (refer to Notes 2b and 3)
(Expressed in thousand US Dollars, unless otherwise stated)
Corporate income tax 3,133 1,350 785 VAT 13 3,133 1,350 798
Corporate income tax 14,511 65,213 24,321 VAT 7,930 3,158 1,876 Income tax Article 15 1,623 5,395 Final income tax Article 4(2) 119 33 22,441 70,113 31,625 25,574 71,463 32,423
Vehicle fuel tax receivable 41,556 33,370 22,243 VAT input 38,854 28,457 31,474 Deposit to Government 16,540 16,585 15,786 96,950 78,412 69,503 Less: Current portion (80,410) (78,412) (69,503) Noncurrent portion 16,540
Receivable relating to VAT input represents the balance of VAT input to be offset against the royalty payable due to the Government of Indonesia.
According to Government Regulation No. 144/2000 which has been effective from 1 January 2001, raw coal prior to processing to briquettes is no longer subject to VAT. Since that date, Adaro has been unable to seek restitution for VAT input. The Coordinating Minister for Economics has requested that the Minister of Finance postpone the implementation of this regulation. The final decision regarding this matter cannot be predicted at present. For the year ended 31 December 2011, Adaro has offset the claim for recoverable VAT input amounting to US$133,238 (31 December 2010: US$101,977, 2009: US$100,216, 2008: US$50,870, 2007: US$39,735, 2006: US$36,424, 2005: US$20,631, 2004: US$22,377, 2003: US$18,882, 2002: US$25,472 and 2001: US$857) against royalty payments due to the Government of Indonesia. Until 31 December 2011, Adaro has offset the claim for recoverable VAT input totalling US$550,679 against royalty payables. Based on the CCA, Adaro was subject to sales tax on services received, in accordance with prevailing laws and regulations. However, with the enforcement of Law No. 8 of 1983 regarding VAT, the regulations on sales tax were no longer valid. Adaro is of the opinion that the sales tax is different from VAT in both form and substance and therefore VAT is a new tax. According to the provisions of the CCA, the Government will pay and assume and hold Adaro harmless from this new tax. As such, management believes that Adaro can recover its VAT input in this manner and expects that the outstanding balance will be recovered in full. These consolidated financial statements do not include any adjustments that might ultimately result from the decision made by the Government regarding this matter. Refer to Note 40c for further details.
* As restated (refer to Note 3)

Adaro Energy Annual Report 2011 www.adaro.com246
(Expressed in thousand US Dollars, unless otherwise stated)
(continued)
(continued)
In 2008, the Government of Indonesia through the Financial and Development Supervisory Board (“BPKP”), commenced an audit to resolve this dispute on the offset of VAT paid againts royalties payable for the period of 2001 to 2007. However, as at the date of these consolidated financial statements, the formal result of this audit had not been issued by the Government of Indonesia. In September 2008, Adaro placed a fund amounting to Rp 150 billion as a deposit in relation to the settlement of this dispute. In August 2009, BPKP continued its audit in relation to VAT and sales tax for the fiscal periods prior to 2001, as well as the 2008 fiscal period. As at the date of these consolidated financial statements, the audit is still ongoing. Management is of the opinion that the audit result will not have a material impact on the Group’s financial position and cash flows. Vehicle fuel tax (Pajak Bahan Bakar Kendaraan Bermotor/“PBBKB”) receivable represents the balance of PBBKB that Adaro believes should be compensated by the Government of Indonesia, since PBBKB is a new tax according to the provisions of the CCA. For the year ended 31 December 2011, Adaro has started to offset the claim for vehicle fuel tax amounting to US$17,495 against royalty payments due to the Government of Indonesia.
Income tax Articles 23 and 26 5,631 2,477 968 Final income tax Article 4(2) 607 194 214 VAT 349 54 Income tax Article 21 192 92 21 6,779 2,817 1,203
Corporate income tax 50,774 9,524 232,243 Income tax Articles 23 and 26 5,146 1,306 2,136 VAT 2,942 384 2,990 Income tax Article 21 2,143 1,030 963 Land and building tax 1,540 Final income tax Article 4(2) 241 49 46 Income tax Article 15 26 62,812 12,293 238,378 69,591 15,110 239,581
Current Deferred 4,744 4,305 4,744 4,305
Current 420,102 270,624 Deferred 25,662 3,531 445,764 274,155
Current 420,102 270,624 Deferred 30,406 7,836 450,508 278,460
* As restated (refer to Notes 2b and 3)
(Expressed in thousand US Dollars, unless otherwise stated)
(continued)
(continued)
The reconciliation between profit before income tax and estimated taxable income is as follows:
Consolidated profit before income tax 1,002,611 525,297 Profit before income tax subsidiaries (1,005,743) (523,907) Adjusted for consolidation elimination 549,881 241,375 Profit before income tax the Company 546,749 242,765
Provision for employee benefits 909 458
Income subject to final tax (216) (343) Income from investments in subsidiaries and associates (559,296) (241,246) Nondeductible expenses 13,622 2,830 Taxable income 6,005 Difference due to changes in reporting currency (16,886) (4,212) (556,771) (242,971) Taxable (loss)/income the Company (9,113) 252 Tax losses used (252) Current income tax the Company Current income tax subsidiaries 420,102 270,624 Consolidated current income tax 420,102 270,624
Current income tax computations are based on estimated taxable income. The amounts may be adjusted when Annual Tax Returns are filed with the tax office.
The reconciliation between income tax expense and the theoretical tax amount on the Company’s profit before income tax using currently enacted tax rates is as follows:
Consolidated profit before income tax 1,002,611 525,297 Profit before income tax subsidiaries (1,005,743) (523,907) Adjusted for consolidation elimination 549,881 241,375 Profit before income tax the Company 546,749 242,765 Income tax calculated at prevailing tax rate 136,687 60,691 Income subject to final tax (54) (86) Nondeductible expenses 3,406 708 Income from investments in subsidiaries and associates (139,824) (60,312) Capitalised borrowing cost 4,076 4,266 Taxable income 1,501 Unrecognised tax loss carry forward 2,278 Adjusments relating to prior year 896 91 Difference due to changes in reporting currency (4,222) (1,053)
Income tax expense the Company 4,744 4,305 Income tax expense subsidiaries 445,764 274,155 Consolidated income tax expense 450,508 278,460
* As restated (refer to Notes 2b and 3)

Adaro Energy Annual Report 2011www.adaro.com 247
(Expressed in thousand US Dollars, unless otherwise stated)
(continued)
(continued)
In 2008, the Government of Indonesia through the Financial and Development Supervisory Board (“BPKP”), commenced an audit to resolve this dispute on the offset of VAT paid againts royalties payable for the period of 2001 to 2007. However, as at the date of these consolidated financial statements, the formal result of this audit had not been issued by the Government of Indonesia. In September 2008, Adaro placed a fund amounting to Rp 150 billion as a deposit in relation to the settlement of this dispute. In August 2009, BPKP continued its audit in relation to VAT and sales tax for the fiscal periods prior to 2001, as well as the 2008 fiscal period. As at the date of these consolidated financial statements, the audit is still ongoing. Management is of the opinion that the audit result will not have a material impact on the Group’s financial position and cash flows. Vehicle fuel tax (Pajak Bahan Bakar Kendaraan Bermotor/“PBBKB”) receivable represents the balance of PBBKB that Adaro believes should be compensated by the Government of Indonesia, since PBBKB is a new tax according to the provisions of the CCA. For the year ended 31 December 2011, Adaro has started to offset the claim for vehicle fuel tax amounting to US$17,495 against royalty payments due to the Government of Indonesia.
Income tax Articles 23 and 26 5,631 2,477 968 Final income tax Article 4(2) 607 194 214 VAT 349 54 Income tax Article 21 192 92 21 6,779 2,817 1,203
Corporate income tax 50,774 9,524 232,243 Income tax Articles 23 and 26 5,146 1,306 2,136 VAT 2,942 384 2,990 Income tax Article 21 2,143 1,030 963 Land and building tax 1,540 Final income tax Article 4(2) 241 49 46 Income tax Article 15 26 62,812 12,293 238,378 69,591 15,110 239,581
Current Deferred 4,744 4,305 4,744 4,305
Current 420,102 270,624 Deferred 25,662 3,531 445,764 274,155
Current 420,102 270,624 Deferred 30,406 7,836 450,508 278,460
* As restated (refer to Notes 2b and 3)
(Expressed in thousand US Dollars, unless otherwise stated)
(continued)
(continued)
The reconciliation between profit before income tax and estimated taxable income is as follows:
Consolidated profit before income tax 1,002,611 525,297 Profit before income tax subsidiaries (1,005,743) (523,907) Adjusted for consolidation elimination 549,881 241,375 Profit before income tax the Company 546,749 242,765
Provision for employee benefits 909 458
Income subject to final tax (216) (343) Income from investments in subsidiaries and associates (559,296) (241,246) Nondeductible expenses 13,622 2,830 Taxable income 6,005 Difference due to changes in reporting currency (16,886) (4,212) (556,771) (242,971) Taxable (loss)/income the Company (9,113) 252 Tax losses used (252) Current income tax the Company Current income tax subsidiaries 420,102 270,624 Consolidated current income tax 420,102 270,624
Current income tax computations are based on estimated taxable income. The amounts may be adjusted when Annual Tax Returns are filed with the tax office.
The reconciliation between income tax expense and the theoretical tax amount on the Company’s profit before income tax using currently enacted tax rates is as follows:
Consolidated profit before income tax 1,002,611 525,297 Profit before income tax subsidiaries (1,005,743) (523,907) Adjusted for consolidation elimination 549,881 241,375 Profit before income tax the Company 546,749 242,765 Income tax calculated at prevailing tax rate 136,687 60,691 Income subject to final tax (54) (86) Nondeductible expenses 3,406 708 Income from investments in subsidiaries and associates (139,824) (60,312) Capitalised borrowing cost 4,076 4,266 Taxable income 1,501 Unrecognised tax loss carry forward 2,278 Adjusments relating to prior year 896 91 Difference due to changes in reporting currency (4,222) (1,053)
Income tax expense the Company 4,744 4,305 Income tax expense subsidiaries 445,764 274,155 Consolidated income tax expense 450,508 278,460
* As restated (refer to Notes 2b and 3)

Adaro Energy Annual Report 2011 www.adaro.com248
(Expressed in thousand US Dollars, unless otherwise stated)
(continued)
(continued) The income tax charged/(credited) relating to other comprehensive income during the year is as follows:
Hedging reserve 4,083 740
Tax loss carried forward 975 (155) 820 Provision for employee benefits 107 121 228 1,082 (34) 1,048 Unrecognised deferred tax assets 1,082 (34) 1,048
Tax loss carried forward 39,386 (13,662) 25,724 Provision for employee benefits 89 89 178 Loss from changes in fair value of derivative instruments 727 (93) 634 40,202 (13,573) (93) 26,536 Unrecognised deferred tax assets (37,287) 14,492 (22,795) 2,915 919 (93) 3,741
Tax loss carried forward 40,361 (13,817) 26,544 Provision for employee benefits 196 210 406 Loss from changes in fair value of derivative instruments 727 (93) 634 41,284 (13,607) (93) 27,584 Unrecognised deferred tax assets (37,287) 14,492 (22,795) Deferred tax assets at the end of the year 3,997 885 (93) 4,789
* As restated (refer to Notes 2b and 3)
(Expressed in thousand US Dollars, unless otherwise stated)
(continued)
(continued)
Tax loss carried forward 820 (820) Provision for employee benefits 228 218 446 1,048 (602) 446 Unrecognised deferred tax assets 1,048 (602) 446
Tax loss carried forward 25,724 (7,048) 18,676 Provision for employee benefits 178 (10) 529 697 Difference between commercial and tax net book value of fixed assets (473) (473) Loss from changes in fair value of derivative instruments 634 (451) 183 26,536 (7,058) 56 (451) 19,083 Unrecognised deferred tax assets (22,795) 8,810 (13,985) 3,741 1,752 56 (451) 5,098
Tax loss carried forward 26,544 (7,868) 18,676 Provision for employee benefits 406 208 529 1,143 Difference between commercial and tax net book value of fixed assets (473) (473) Loss from changes in fair value of derivative instruments 634 (451) 183 27,584 (7,660) 56 (451) 19,529 Unrecognised deferred tax assets (22,795) 8,810 (13,985) Deferred tax assets at the end of the year 4,789 1,150 56 (451) 5,544
Due to the fact that several subsidiaries are in a loss position and only function as a head office, there is a
limitation on the future use of tax loss carry forwards and uncertainty as to whether the deferred tax assets will be realised. Thus, a portion of deferred tax assets relating to tax losses carried forward have not been recognised in these consolidated financial statements.
Most of the deferred tax assets are expected to be recovered after more than 12 months.

Adaro Energy Annual Report 2011www.adaro.com 249
(Expressed in thousand US Dollars, unless otherwise stated)
(continued)
(continued) The income tax charged/(credited) relating to other comprehensive income during the year is as follows:
Hedging reserve 4,083 740
Tax loss carried forward 975 (155) 820 Provision for employee benefits 107 121 228 1,082 (34) 1,048 Unrecognised deferred tax assets 1,082 (34) 1,048
Tax loss carried forward 39,386 (13,662) 25,724 Provision for employee benefits 89 89 178 Loss from changes in fair value of derivative instruments 727 (93) 634 40,202 (13,573) (93) 26,536 Unrecognised deferred tax assets (37,287) 14,492 (22,795) 2,915 919 (93) 3,741
Tax loss carried forward 40,361 (13,817) 26,544 Provision for employee benefits 196 210 406 Loss from changes in fair value of derivative instruments 727 (93) 634 41,284 (13,607) (93) 27,584 Unrecognised deferred tax assets (37,287) 14,492 (22,795) Deferred tax assets at the end of the year 3,997 885 (93) 4,789
* As restated (refer to Notes 2b and 3)
(Expressed in thousand US Dollars, unless otherwise stated)
(continued)
(continued)
Tax loss carried forward 820 (820) Provision for employee benefits 228 218 446 1,048 (602) 446 Unrecognised deferred tax assets 1,048 (602) 446
Tax loss carried forward 25,724 (7,048) 18,676 Provision for employee benefits 178 (10) 529 697 Difference between commercial and tax net book value of fixed assets (473) (473) Loss from changes in fair value of derivative instruments 634 (451) 183 26,536 (7,058) 56 (451) 19,083 Unrecognised deferred tax assets (22,795) 8,810 (13,985) 3,741 1,752 56 (451) 5,098
Tax loss carried forward 26,544 (7,868) 18,676 Provision for employee benefits 406 208 529 1,143 Difference between commercial and tax net book value of fixed assets (473) (473) Loss from changes in fair value of derivative instruments 634 (451) 183 27,584 (7,660) 56 (451) 19,529 Unrecognised deferred tax assets (22,795) 8,810 (13,985) Deferred tax assets at the end of the year 4,789 1,150 56 (451) 5,544
Due to the fact that several subsidiaries are in a loss position and only function as a head office, there is a
limitation on the future use of tax loss carry forwards and uncertainty as to whether the deferred tax assets will be realised. Thus, a portion of deferred tax assets relating to tax losses carried forward have not been recognised in these consolidated financial statements.
Most of the deferred tax assets are expected to be recovered after more than 12 months.

Adaro Energy Annual Report 2011 www.adaro.com250
(Expressed in thousand US Dollars, unless otherwise stated)
(continued)
Capitalised borrowing costs 4,266 4,266 Provision for employee benefits (1,096) (667) (1,763) Mining properties 264,437 (13,151) 251,286 Loss from changes in fair value of derivative instruments (5,917) 647 (5,270) Difference between commercial and tax net book value of fixed assets 47,403 16,240 63,643 Tax loss carried forward (12,369) 535 (11,834) Difference in fixed assets under finance lease and lease installments 7,908 2,136 10,044 Deferred exploration and development expenditure 3,878 (304) 3,574 304,244 4,789 647 309,680 Unrecognised deferred tax assets 12,187 (353) 11,834 316,431 4,436 647 321,514
Capitalised borrowing costs 4,266 4,266 Provision for employee benefits (1,096) (667) (1,763) Mining properties 264,437 (13,151) 251,286 Loss from changes in fair value of derivative instruments (5,917) 647 (5,270) Difference between commercial and tax net book value of fixed assets 47,403 16,240 63,643 Tax loss carried forward (12,369) 535 (11,834) Difference in fixed assets under finance lease and lease 7,908 2,136 10,044 installments Deferred exploration and development expenditure 3,878 (304) 3,574 304,244 9,055 647 313,946 Unrecognised deferred tax assets 12,187 (353) 11,834 316,431 8,702 647 325,780
* As restated (refer to Note 3)
(Expressed in thousand US Dollars, unless otherwise stated)
(continued) (continued)
Capitalised borrowing costs 4,266 4,266 8,532
Provision for employee benefits (1,763) (318) 529 (1,552) Mining properties 251,286 (14,919) 74,764 311,131 Loss from changes in fair value of derivative instruments (5,270) 3,632 (1,638) Difference between commercial and tax net book value of fixed assets 63,643 39,805 (473) 102,975 Tax loss carried forward (11,834) 2,544 (9,290) Difference in fixed assets under finance lease and lease installments 10,044 2,932 12,976 Deferred exploration and development expenditure 3,574 (304) 3,270 309,680 29,740 56 74,764 3,632 417,872 Unrecognised deferred tax assets 11,834 (2,544) 9,290 321,514 27,196 56 74,764 3,632 427,162
Capitalised borrowing costs 4,266 4,266 8,532 Provision for employee benefits (1,763) (318) 529 (1,552) Mining properties 251,286 (14,919) 74,764 311,131 Loss from changes in fair value of derivative instruments (5,270) 3,632 (1,638) Difference between commercial and tax net book value of fixed assets 63,643 39,805 (473) 102,975 Tax loss carried forward (11,834) 2,544 (9,290) Difference in fixed assets under finance lease and lease installments 10,044 2,932 12,976 Deferred exploration and development expenditure 3,574 (304) 3,270 313,946 34,006 56 74,764 3,632 426,404 Unrecognised deferred tax assets 11,834 (2,544) 9,290 325,780 31,462 56 74,764 3,632 435,694

Adaro Energy Annual Report 2011www.adaro.com 251
(Expressed in thousand US Dollars, unless otherwise stated)
(continued)
Capitalised borrowing costs 4,266 4,266 Provision for employee benefits (1,096) (667) (1,763) Mining properties 264,437 (13,151) 251,286 Loss from changes in fair value of derivative instruments (5,917) 647 (5,270) Difference between commercial and tax net book value of fixed assets 47,403 16,240 63,643 Tax loss carried forward (12,369) 535 (11,834) Difference in fixed assets under finance lease and lease installments 7,908 2,136 10,044 Deferred exploration and development expenditure 3,878 (304) 3,574 304,244 4,789 647 309,680 Unrecognised deferred tax assets 12,187 (353) 11,834 316,431 4,436 647 321,514
Capitalised borrowing costs 4,266 4,266 Provision for employee benefits (1,096) (667) (1,763) Mining properties 264,437 (13,151) 251,286 Loss from changes in fair value of derivative instruments (5,917) 647 (5,270) Difference between commercial and tax net book value of fixed assets 47,403 16,240 63,643 Tax loss carried forward (12,369) 535 (11,834) Difference in fixed assets under finance lease and lease 7,908 2,136 10,044 installments Deferred exploration and development expenditure 3,878 (304) 3,574 304,244 9,055 647 313,946 Unrecognised deferred tax assets 12,187 (353) 11,834 316,431 8,702 647 325,780
* As restated (refer to Note 3)
(Expressed in thousand US Dollars, unless otherwise stated)
(continued) (continued)
Capitalised borrowing costs 4,266 4,266 8,532
Provision for employee benefits (1,763) (318) 529 (1,552) Mining properties 251,286 (14,919) 74,764 311,131 Loss from changes in fair value of derivative instruments (5,270) 3,632 (1,638) Difference between commercial and tax net book value of fixed assets 63,643 39,805 (473) 102,975 Tax loss carried forward (11,834) 2,544 (9,290) Difference in fixed assets under finance lease and lease installments 10,044 2,932 12,976 Deferred exploration and development expenditure 3,574 (304) 3,270 309,680 29,740 56 74,764 3,632 417,872 Unrecognised deferred tax assets 11,834 (2,544) 9,290 321,514 27,196 56 74,764 3,632 427,162
Capitalised borrowing costs 4,266 4,266 8,532 Provision for employee benefits (1,763) (318) 529 (1,552) Mining properties 251,286 (14,919) 74,764 311,131 Loss from changes in fair value of derivative instruments (5,270) 3,632 (1,638) Difference between commercial and tax net book value of fixed assets 63,643 39,805 (473) 102,975 Tax loss carried forward (11,834) 2,544 (9,290) Difference in fixed assets under finance lease and lease installments 10,044 2,932 12,976 Deferred exploration and development expenditure 3,574 (304) 3,270 313,946 34,006 56 74,764 3,632 426,404 Unrecognised deferred tax assets 11,834 (2,544) 9,290 325,780 31,462 56 74,764 3,632 435,694

Adaro Energy Annual Report 2011 www.adaro.com252
(Expressed in thousand US Dollars, unless otherwise stated)
(continued)
(continued) The analysis of deferred tax liabilities is as follows:
Deferred tax liabilities to be recovered after more than 12 months 415,474 311,370 Deferred tax liabilities to be recovered within 12 months 20,220 14,410 435,694 325,780
Under the taxation laws of Indonesia, the companies within the Group which are domiciled in Indonesia calculate and pay tax on the basis of self assessment. The Directorate General of Tax (“DGT”) may assess or amend taxes within ten years of the time the tax becomes due, or until the end of 2013, whichever is earlier. There are new rules applicable to the fiscal year 2008 and subsequent years stipulating that the DGT may assess or amend taxes within five years of the time the tax becomes due.
Management of SIS disagreed with the tax assessments of corporate income tax and income tax Article 23 that were received in 2008 and therefore filed objection letters with the DGT against the tax assessment amounting to Rp 3,421 million (US$364). On 21 April 2009, the DGT accepted the objection on income tax Article 23 of Rp 142 million (US$15) and rejected the objection to corporate income tax of Rp 3,279 million (US$349). On 3 June 2009, SIS filed an appeal against the rejection amounting to Rp 3,279 million (US$349). On 27 June 2011, the tax court issued a decision to partially accept the appeal from SIS, amounting to Rp 2,397 million. On 8 December 2011, DGT requested a civil review on the decision of the tax court.
As at the date of these consolidated financial statements, the Company was audited for all taxes for the fiscal year 2010, Adaro was audited for all taxes for fiscal year 2008 and 2009, and MSW was audited for all taxes for fiscal year 2010. The Company, Adaro and MSW have not yet received the audit results. Management is of the opinion that the audit results will not have a material impact on the Company’s, Adaro’s and MSW’s financial position and cash flows.
Details of the balances and transactions with related parties are as follows:
Trade receivables (refer to Note 8) 226 Loan to a related party: PT Servo Meda Sejahtera 15,508 15,734 As a percentage of total assets 0.28% On 18 July 2011, ATA entered into a Loan Agreement with SMS and SI, which has been amended by Amendment I of Loan Agreement dated 25 November 2011, where ATA provided a loan facility of US$15,000 to SMS. This loan bears annual fixed interest rate and the interest will be paid every month since the date of the first drawdown. This loan is due on 1 December 2011. As at 31 December 2011, the outstanding balance from this loan amounted to US$15,508 (including accrued interest of US$508). On 16 March 2012, based on Amendment II of the Loan Agreement, ATA, SMS and SI extended the maturity of this loan to 1 June 2012 and ATA provided an additional loan of Rp 50 billion to SMS. This loan was secured with 35% shares in SMS that are owned by SI.
* As restated (refer to Note 3)
(Expressed in thousand US Dollars, unless otherwise stated)
(continued)
Trade payables (refer to Note 17) 17,401 12,139 15,190 Amounts due to a related party: PT Rachindo Investments 500 500 500 17,901 12,639 15,690 As a percentage of total liabilities 0.56% 0.52% 0.59%
Cost of revenue Mining service: PT Rahman Abdijaya 74,781 61,356 Coal barging services: PT Pulau Seroja Jaya 26,561 19,074 PT Pulau Seroja Jaya Pratama 895 5,332 Rental: PT Anugerah Buminusantara Abadi 2,386 2,858 104,623 88,620 As a percentage of total cost of revenue 4.09% 4.69% The Board of Commissioners and the Board of Directors of the Company are considered as key management personnel.
Remuneration for the Board of Commissioners and the Board of Directors of the Company is as follows:
Salaries and bonuses 4,701 2,314
The nature of relationships with related parties: PT Rachindo Investments Associates PT Servo Meda Sejahtera Associates PT Anugerah Buminusantara Abadi Affiliate PT Pulau Seroja Jaya Affiliate PT Pulau Seroja Jaya Pratama Affiliate PT Rahman Abdijaya Affiliate PT Jasa Tambang Indonesia Affiliate The Group’s pricing policy in relation to the transactions with related parties is set based on contracted prices.
Compensation for customer claim 152,818 Other (income)/expense, net (1,285) 14,922 151,533 14,922
* As restated (refer to Notes 2b and 3)

Adaro Energy Annual Report 2011www.adaro.com 253
(Expressed in thousand US Dollars, unless otherwise stated)
(continued)
(continued) The analysis of deferred tax liabilities is as follows:
Deferred tax liabilities to be recovered after more than 12 months 415,474 311,370 Deferred tax liabilities to be recovered within 12 months 20,220 14,410 435,694 325,780
Under the taxation laws of Indonesia, the companies within the Group which are domiciled in Indonesia calculate and pay tax on the basis of self assessment. The Directorate General of Tax (“DGT”) may assess or amend taxes within ten years of the time the tax becomes due, or until the end of 2013, whichever is earlier. There are new rules applicable to the fiscal year 2008 and subsequent years stipulating that the DGT may assess or amend taxes within five years of the time the tax becomes due.
Management of SIS disagreed with the tax assessments of corporate income tax and income tax Article 23 that were received in 2008 and therefore filed objection letters with the DGT against the tax assessment amounting to Rp 3,421 million (US$364). On 21 April 2009, the DGT accepted the objection on income tax Article 23 of Rp 142 million (US$15) and rejected the objection to corporate income tax of Rp 3,279 million (US$349). On 3 June 2009, SIS filed an appeal against the rejection amounting to Rp 3,279 million (US$349). On 27 June 2011, the tax court issued a decision to partially accept the appeal from SIS, amounting to Rp 2,397 million. On 8 December 2011, DGT requested a civil review on the decision of the tax court.
As at the date of these consolidated financial statements, the Company was audited for all taxes for the fiscal year 2010, Adaro was audited for all taxes for fiscal year 2008 and 2009, and MSW was audited for all taxes for fiscal year 2010. The Company, Adaro and MSW have not yet received the audit results. Management is of the opinion that the audit results will not have a material impact on the Company’s, Adaro’s and MSW’s financial position and cash flows.
Details of the balances and transactions with related parties are as follows:
Trade receivables (refer to Note 8) 226 Loan to a related party: PT Servo Meda Sejahtera 15,508 15,734 As a percentage of total assets 0.28% On 18 July 2011, ATA entered into a Loan Agreement with SMS and SI, which has been amended by Amendment I of Loan Agreement dated 25 November 2011, where ATA provided a loan facility of US$15,000 to SMS. This loan bears annual fixed interest rate and the interest will be paid every month since the date of the first drawdown. This loan is due on 1 December 2011. As at 31 December 2011, the outstanding balance from this loan amounted to US$15,508 (including accrued interest of US$508). On 16 March 2012, based on Amendment II of the Loan Agreement, ATA, SMS and SI extended the maturity of this loan to 1 June 2012 and ATA provided an additional loan of Rp 50 billion to SMS. This loan was secured with 35% shares in SMS that are owned by SI.
* As restated (refer to Note 3)
(Expressed in thousand US Dollars, unless otherwise stated)
(continued)
Trade payables (refer to Note 17) 17,401 12,139 15,190 Amounts due to a related party: PT Rachindo Investments 500 500 500 17,901 12,639 15,690 As a percentage of total liabilities 0.56% 0.52% 0.59%
Cost of revenue Mining service: PT Rahman Abdijaya 74,781 61,356 Coal barging services: PT Pulau Seroja Jaya 26,561 19,074 PT Pulau Seroja Jaya Pratama 895 5,332 Rental: PT Anugerah Buminusantara Abadi 2,386 2,858 104,623 88,620 As a percentage of total cost of revenue 4.09% 4.69% The Board of Commissioners and the Board of Directors of the Company are considered as key management personnel.
Remuneration for the Board of Commissioners and the Board of Directors of the Company is as follows:
Salaries and bonuses 4,701 2,314
The nature of relationships with related parties: PT Rachindo Investments Associates PT Servo Meda Sejahtera Associates PT Anugerah Buminusantara Abadi Affiliate PT Pulau Seroja Jaya Affiliate PT Pulau Seroja Jaya Pratama Affiliate PT Rahman Abdijaya Affiliate PT Jasa Tambang Indonesia Affiliate The Group’s pricing policy in relation to the transactions with related parties is set based on contracted prices.
Compensation for customer claim 152,818 Other (income)/expense, net (1,285) 14,922 151,533 14,922
* As restated (refer to Notes 2b and 3)

Adaro Energy Annual Report 2011 www.adaro.com254
(Expressed in thousand US Dollars, unless otherwise stated)
(continued)
In 2008, MoEMR requested that Indonesian coal producers renegotiate existing term coal supply contracts to match then current market prices. Those Indonesian coal producers were instructed by MoEMR that they would be required to suspend shipments if they failed to comply with the request. Adaro declared force majeure and suspended deliveries to three customers. One of these customers later agreed with Adaro a renegotiated price under their contract in line with the Government requirement. The remaining two customers have asserted separate claims against Adaro seeking amounts by way of compensation through arbitrations. At the end of 2010, one of the arbitration case was withdrawn. For the other claim, the arbitration has asserted that Adaro should compensate the customer with a payment of US$152,818. With the payment of that amount in August 2011, all claims have now been resolved.
Net income attributable to owners of the parent 550,354 247,162 Weighted average number of ordinary shares outstanding (in thousands of shares) 31,985,962 31,985,962 Basic earnings per share (full amount) 0.01721 0.00773
The Group did not have any dilutive ordinary shares at 31 December 2011 and 2010.
As at 31 December 2011, the Group had monetary assets and liabilities denominated in currencies other than US Dollars as follows:
Cash and cash equivalents Rp 553,818,923,064 61,073 S$ 1,345,168 1,034 € 1,311,204 1,736 Trade receivables Rp 1,086,391,193,881 119,805 Prepaid taxes Rp 67,081,913,296 7,398 Total monetary assets 191,046
Trade payables Rp 434,538,107,418 47,920 S$ 1,322,790 1,018 € 5,724,194 7,410 ¥ 3,379,329 44 A$ 4,394,591 4,460 £ 873,634 1,346 Accrued expenses Rp 14,353,690,904 1,583 € 2,204,552 2,854 Taxes payable Rp 102,299,214,621 11,281 Total monetary liabilities 77,916 113,130
If assets and liabilities in currencies other than US Dollars as at 31 December 2011 are translated using the exchange rate as at 22 March 2012, the total net monetery assets will decrease by approximately US$1,809.
* As restated (refer to Notes 2b and 3)
(Expressed in thousand US Dollars, unless otherwise stated)
Management has determined the operating segment based on reports reviewed by the Board of Directors that are used to make strategic decisions. The Board of Directors considers the business operation by business type. The segment information provided to the Board of Directors for the reportable segments for the years ended 31 December 2011 and 2010, is as follows:
External revenue 3,705,783 192,249 89,373 3,987,405 Intersegment revenue 220,251 232,378 252,943 (705,572) 3,926,034 424,627 342,316 (705,572) 3,987,405 1,397,684 51,678 89,034 (110,003) 1,428,393 Selling and marketing expense (111,858) 45,777 (66,081) General and administrative expense (10,457) (19,432) (51,171) 2,319 (78,741) 1,275,369 32,246 37,863 (61,907) 1,283,571 Finance costs (106,269) (21,868) (18,563) 26,942 (119,758) Finance income 17,353 502 7,451 (18,588) 6,718 Other income/(expenses), net (146,610) 1,334 (23,874) 1,230 (167,920) 1,039,843 12,214 2,877 (52,323) 1,002,611 Income tax expense (449,020) (891) (11,439) 10,842 (450,508) 590,823 11,323 (8,562) (41,481) 552,103 Depreciation and amortisation 49,793 78,166 15,842 61,908 205,709 Segment assets 2,925,103 561,003 1,988,074 184,781 5,658,961 Segment liabilities 2,469,602 453,226 1,672,033 (1,378,123) 3,216,738 Capital expenditure 314,745 138,341 171,874 (4,493) 620,467
External revenue 2,507,190 141,273 69,180 2,717,643 Intersegment revenue 194,173 163,082 133,808 (491,063) 2,701,363 304,355 202,988 (491,063) 2,717,643 815,138 43,405 56,849 (86,669) 828,723 Selling and marketing expense (83,947) 29,170 (54,777) General and administrative expense (14,226) (22,816) (26,969) 1,560 (62,451) 716,965 20,589 29,880 (55,939) 711,495 Finance costs (108,212) (15,123) (8,816) 16,727 (115,424) Finance income 9,965 236 2,440 (7,976) 4,665 Other income/(expenses), net (5,111) (2,336) (14,348) (53,644) (75,439) 613,607 3,366 9,156 (100,832) 525,297 Income tax expense (272,123) (789) (14,432) 8,884 (278,460) 341,484 2,577 (5,276) (91,948) 246,837 Depreciation and amortisation 20,565 68,526 14,372 109,630 213,093 Segment assets 2,053,842 475,802 1,279,605 660,870 4,470,119 Segment liabilities 1,794,831 381,811 1,068,426 (807,160) 2,437,908 Capital expenditure 152,248 73,805 83,500 (11,057) 298,496
* As restated (refer to Notes 2b and 3)

Adaro Energy Annual Report 2011www.adaro.com 255
(Expressed in thousand US Dollars, unless otherwise stated)
(continued)
In 2008, MoEMR requested that Indonesian coal producers renegotiate existing term coal supply contracts to match then current market prices. Those Indonesian coal producers were instructed by MoEMR that they would be required to suspend shipments if they failed to comply with the request. Adaro declared force majeure and suspended deliveries to three customers. One of these customers later agreed with Adaro a renegotiated price under their contract in line with the Government requirement. The remaining two customers have asserted separate claims against Adaro seeking amounts by way of compensation through arbitrations. At the end of 2010, one of the arbitration case was withdrawn. For the other claim, the arbitration has asserted that Adaro should compensate the customer with a payment of US$152,818. With the payment of that amount in August 2011, all claims have now been resolved.
Net income attributable to owners of the parent 550,354 247,162 Weighted average number of ordinary shares outstanding (in thousands of shares) 31,985,962 31,985,962 Basic earnings per share (full amount) 0.01721 0.00773
The Group did not have any dilutive ordinary shares at 31 December 2011 and 2010.
As at 31 December 2011, the Group had monetary assets and liabilities denominated in currencies other than US Dollars as follows:
Cash and cash equivalents Rp 553,818,923,064 61,073 S$ 1,345,168 1,034 € 1,311,204 1,736 Trade receivables Rp 1,086,391,193,881 119,805 Prepaid taxes Rp 67,081,913,296 7,398 Total monetary assets 191,046
Trade payables Rp 434,538,107,418 47,920 S$ 1,322,790 1,018 € 5,724,194 7,410 ¥ 3,379,329 44 A$ 4,394,591 4,460 £ 873,634 1,346 Accrued expenses Rp 14,353,690,904 1,583 € 2,204,552 2,854 Taxes payable Rp 102,299,214,621 11,281 Total monetary liabilities 77,916 113,130
If assets and liabilities in currencies other than US Dollars as at 31 December 2011 are translated using the exchange rate as at 22 March 2012, the total net monetery assets will decrease by approximately US$1,809.
* As restated (refer to Notes 2b and 3)
(Expressed in thousand US Dollars, unless otherwise stated)
Management has determined the operating segment based on reports reviewed by the Board of Directors that are used to make strategic decisions. The Board of Directors considers the business operation by business type. The segment information provided to the Board of Directors for the reportable segments for the years ended 31 December 2011 and 2010, is as follows:
External revenue 3,705,783 192,249 89,373 3,987,405 Intersegment revenue 220,251 232,378 252,943 (705,572) 3,926,034 424,627 342,316 (705,572) 3,987,405 1,397,684 51,678 89,034 (110,003) 1,428,393 Selling and marketing expense (111,858) 45,777 (66,081) General and administrative expense (10,457) (19,432) (51,171) 2,319 (78,741) 1,275,369 32,246 37,863 (61,907) 1,283,571 Finance costs (106,269) (21,868) (18,563) 26,942 (119,758) Finance income 17,353 502 7,451 (18,588) 6,718 Other income/(expenses), net (146,610) 1,334 (23,874) 1,230 (167,920) 1,039,843 12,214 2,877 (52,323) 1,002,611 Income tax expense (449,020) (891) (11,439) 10,842 (450,508) 590,823 11,323 (8,562) (41,481) 552,103 Depreciation and amortisation 49,793 78,166 15,842 61,908 205,709 Segment assets 2,925,103 561,003 1,988,074 184,781 5,658,961 Segment liabilities 2,469,602 453,226 1,672,033 (1,378,123) 3,216,738 Capital expenditure 314,745 138,341 171,874 (4,493) 620,467
External revenue 2,507,190 141,273 69,180 2,717,643 Intersegment revenue 194,173 163,082 133,808 (491,063) 2,701,363 304,355 202,988 (491,063) 2,717,643 815,138 43,405 56,849 (86,669) 828,723 Selling and marketing expense (83,947) 29,170 (54,777) General and administrative expense (14,226) (22,816) (26,969) 1,560 (62,451) 716,965 20,589 29,880 (55,939) 711,495 Finance costs (108,212) (15,123) (8,816) 16,727 (115,424) Finance income 9,965 236 2,440 (7,976) 4,665 Other income/(expenses), net (5,111) (2,336) (14,348) (53,644) (75,439) 613,607 3,366 9,156 (100,832) 525,297 Income tax expense (272,123) (789) (14,432) 8,884 (278,460) 341,484 2,577 (5,276) (91,948) 246,837 Depreciation and amortisation 20,565 68,526 14,372 109,630 213,093 Segment assets 2,053,842 475,802 1,279,605 660,870 4,470,119 Segment liabilities 1,794,831 381,811 1,068,426 (807,160) 2,437,908 Capital expenditure 152,248 73,805 83,500 (11,057) 298,496
* As restated (refer to Notes 2b and 3)

Adaro Energy Annual Report 2011 www.adaro.com256
(Expressed in thousand US Dollars, unless otherwise stated)
Adaro, as a coal producer, has entered into a number of coal mining agreements. Under the agreements, Adaro is required to pay contractors a service fee, calculated on a monthly basis, based on a formula which includes the amount of raw coal and overburden mined and transported. The contractors will provide all equipment, machinery, appliances and other supplies necessary for performing the mining and transportation services and are required to meet certain minimum production requirements. Adaro has also entered into coal barging, transport and transhipment agreement with contractors to provide coal transportation services from Adaro’s main area to certain port destinations. Adaro is required to pay contractors a service fee, calculated on a monthly basis, based on a formula which includes the amount of coal transported.
In addition, Adaro has also entered into a fuel supply agreement with PT Shell Indonesia (“Shell”). Adaro is required to pay Shell a price, based on a formula which includes the amount of fuel supplied and the market price of fuel. Adaro is also required to purchase a certain minimum yearly volume of fuel.
PT Pamapersada
Nusantara Coal mining and
transportation 7 September 2009 31 July 2013
PT Bukit Makmur Mandiri Utama
Coal mining and transportation
13 November 2008 31 December 2013
PT Rahman Abdijaya
Coal mining and transportation
14 December 2008 31 December 2013
PT Rante Mutiara Insani
Coal mining and transportation
22 February 2010 22 February 2015
PT Pulau Seroja Jaya
Coal barging 1 October 2010 31 October 2017
PT Batuah Abadi Lines
Coal barging 18 February 2000 30 June 2012
PT Mitra Bahtera Segara Sejati
Tbk
Coal barging 1 October 2010 31 October 2017
PT Meratus Advance Maritim
Coal barging 1 December 2010 31 October 2017
PT Shell Indonesia
Fuel supply 8 December 2009 1 October 2022
SIS provides mining contractor services to various coal producers. Under the agreements, SIS provides labour, equipment and material for overburden removal, coal mining and coal transportation and overburden hauling and is required to meet certain minimum production requirements for these activities. SIS receives a service fee calculated on a monthly basis, based on a formula which includes several adjustment clauses.
PT Berau Coal (Binungan H4) 27 December 2004 31 December 2013 PT Berau Coal (Binungan Blok C 14) 1 March 2007 31 December 2015 PT Berau Coal (Sambarata) 25 February 2004 31 December 2011* PT Berau Coal (Sambarata Blok B1) 21 January 2008 14 July 2012 PT Sumber Kurnia Buana 10 May 2005
9 May 2013 or
certain production level PT Borneo Indobara 17 October 2006
31 August 2014 or
certain production level PT Indomining 14 August 2007
13 August 2012 or
certain production level PT Tunas Muda Jaya 8 April 2009 2013 or certain production level
* In process of extending the agreement
(Expressed in thousand US Dollars, unless otherwise stated)
(continued)
On 4 November 2009, MSW and the Government of Tabalong Regency entered into a landuse cooperation agreement for the cooperation to use 100.2 hectares of land from the Government of Tabalong Regency, located in Mabu’un village, Murung Pudak SubDistrict, Tabalong Regency, in relation to the construction and operation of a Coal fired Power Plant. The Government of Tabalong Regency will provide the right to use the land. Subsequently the Group can apply for land rights for 30 years and this could be extended according to the prevailing law. In return for the land rights, MSW will supply electricity of 1.5 Mega Watts (“MW”) for regency street lighting.
In May 2006, MoEMR alleged that Adaro had underpaid the royalties due from coal sales for the period from 2001 and demanded payment. Adaro strongly rejected the allegation because it had discharged its obligation to pay such royalties by way of offsetting it against the Government’s obligation to reimburse Adaro for its VAT payment as prescribed under the CCA. In May 2006, Adaro filed an objection with the Jakarta Administrative Court against the MoEMR. Upon Adaro’s application, in May 2006, the Jakarta Administrative Court granted an order restricting the MoEMR from taking any further administrative steps on the issue until a final and binding judgement was delivered. In September 2006, the Jakarta Administrative Court issued a decision in favour of Adaro. The Jakarta High Administrative Court concurred with the Jakarta Administrative Court in February 2007. On 26 September 2008, the Indonesian Supreme Court concurred with the decision of the Jakarta High Administrative Court and the decision of the Indonesian Supreme Court is final and binding. In June 2006, MoEMR granted authority to the Committee for State Claim Affairs (the “Committee”) to pursue the alleged underpayment on its behalf. In July 2007, the Committee issued a demand for payment to Adaro. As this is an industrywide problem, similar demands have been made by the Committee to other firstgeneration companies.
In September 2007, Adaro filed an objection with the Jakarta Administrative Court against the Committee. Upon Adaro’s application, in September 2007 the Jakarta Administrative Court granted an order restricting the Committee from taking any further administrative steps on the issue until a final and binding judgement had been delivered. On 15 February 2008, the Jakarta Administrative Court issued a decision in favour of Adaro. The Jakarta High Administrative Court concurred with the Jakarta Admistrative Court on 1 July 2008. On 22 July 2009, the Indonesian Supreme Court concurred with the decision of the Jakarta High Administrative Court and the decision of the Indonesian Supreme Court is final and binding. On 29 January 2010, the Committee filed a civil review (Peninjauan Kembali) on the decision of the Indonesian Supreme Court. On 31 January 2011, the Jakarta Administrative Court delivered the decision on the civil review (Peninjauan Kembali), where the Supreme Court decided to reject the request of the civil review (Peninjauan Kembali) from the Committee, based on decision No. 47PK/TUN/2010 dated 20 July 2010. As management believes that Adaro has strong grounds supporting the case and the recent court decision was in favour of Adaro, no provision has been booked in the consolidated financial statements in relation to this matter.
As at 31 December 2011, Adaro had outstanding purchase orders for mining equipment amounting to US$499,548 and SIS for operational equipment amounting to US$121,651.
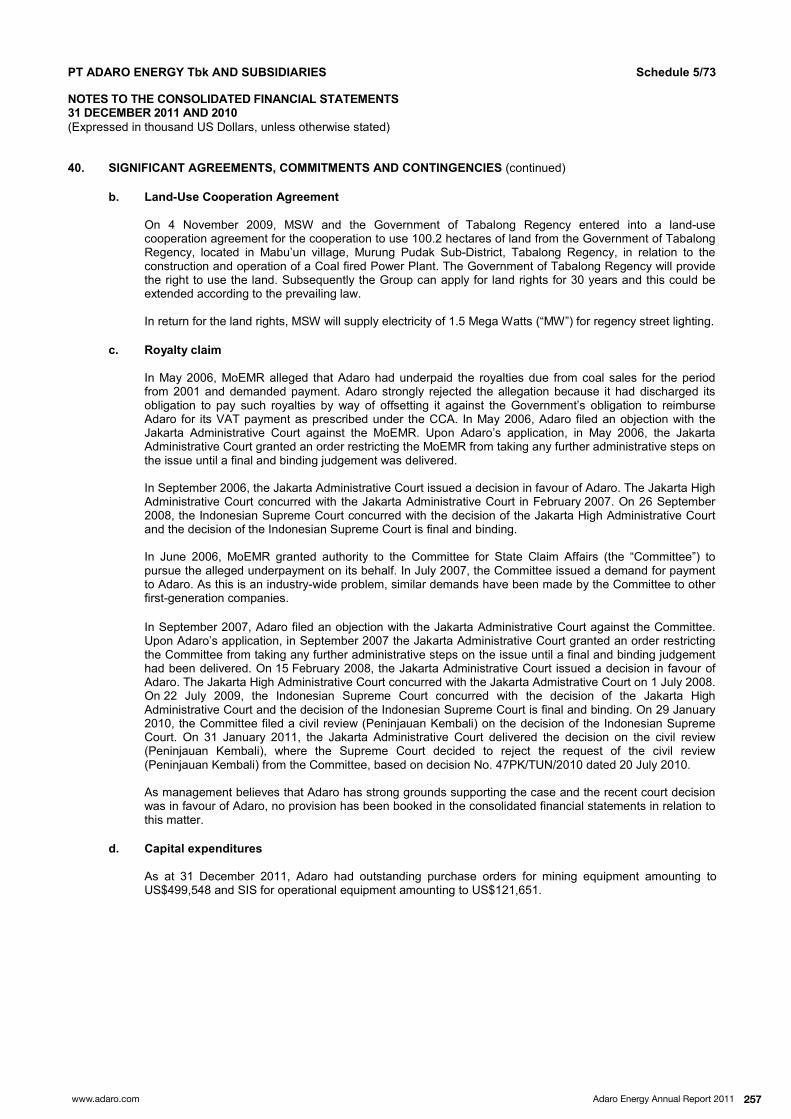
Adaro Energy Annual Report 2011www.adaro.com 257
(Expressed in thousand US Dollars, unless otherwise stated)
Adaro, as a coal producer, has entered into a number of coal mining agreements. Under the agreements, Adaro is required to pay contractors a service fee, calculated on a monthly basis, based on a formula which includes the amount of raw coal and overburden mined and transported. The contractors will provide all equipment, machinery, appliances and other supplies necessary for performing the mining and transportation services and are required to meet certain minimum production requirements. Adaro has also entered into coal barging, transport and transhipment agreement with contractors to provide coal transportation services from Adaro’s main area to certain port destinations. Adaro is required to pay contractors a service fee, calculated on a monthly basis, based on a formula which includes the amount of coal transported.
In addition, Adaro has also entered into a fuel supply agreement with PT Shell Indonesia (“Shell”). Adaro is required to pay Shell a price, based on a formula which includes the amount of fuel supplied and the market price of fuel. Adaro is also required to purchase a certain minimum yearly volume of fuel.
PT Pamapersada
Nusantara Coal mining and
transportation 7 September 2009 31 July 2013
PT Bukit Makmur Mandiri Utama
Coal mining and transportation
13 November 2008 31 December 2013
PT Rahman Abdijaya
Coal mining and transportation
14 December 2008 31 December 2013
PT Rante Mutiara Insani
Coal mining and transportation
22 February 2010 22 February 2015
PT Pulau Seroja Jaya
Coal barging 1 October 2010 31 October 2017
PT Batuah Abadi Lines
Coal barging 18 February 2000 30 June 2012
PT Mitra Bahtera Segara Sejati
Tbk
Coal barging 1 October 2010 31 October 2017
PT Meratus Advance Maritim
Coal barging 1 December 2010 31 October 2017
PT Shell Indonesia
Fuel supply 8 December 2009 1 October 2022
SIS provides mining contractor services to various coal producers. Under the agreements, SIS provides labour, equipment and material for overburden removal, coal mining and coal transportation and overburden hauling and is required to meet certain minimum production requirements for these activities. SIS receives a service fee calculated on a monthly basis, based on a formula which includes several adjustment clauses.
PT Berau Coal (Binungan H4) 27 December 2004 31 December 2013 PT Berau Coal (Binungan Blok C 14) 1 March 2007 31 December 2015 PT Berau Coal (Sambarata) 25 February 2004 31 December 2011* PT Berau Coal (Sambarata Blok B1) 21 January 2008 14 July 2012 PT Sumber Kurnia Buana 10 May 2005
9 May 2013 or
certain production level PT Borneo Indobara 17 October 2006
31 August 2014 or
certain production level PT Indomining 14 August 2007
13 August 2012 or
certain production level PT Tunas Muda Jaya 8 April 2009 2013 or certain production level
* In process of extending the agreement
(Expressed in thousand US Dollars, unless otherwise stated)
(continued)
On 4 November 2009, MSW and the Government of Tabalong Regency entered into a landuse cooperation agreement for the cooperation to use 100.2 hectares of land from the Government of Tabalong Regency, located in Mabu’un village, Murung Pudak SubDistrict, Tabalong Regency, in relation to the construction and operation of a Coal fired Power Plant. The Government of Tabalong Regency will provide the right to use the land. Subsequently the Group can apply for land rights for 30 years and this could be extended according to the prevailing law. In return for the land rights, MSW will supply electricity of 1.5 Mega Watts (“MW”) for regency street lighting.
In May 2006, MoEMR alleged that Adaro had underpaid the royalties due from coal sales for the period from 2001 and demanded payment. Adaro strongly rejected the allegation because it had discharged its obligation to pay such royalties by way of offsetting it against the Government’s obligation to reimburse Adaro for its VAT payment as prescribed under the CCA. In May 2006, Adaro filed an objection with the Jakarta Administrative Court against the MoEMR. Upon Adaro’s application, in May 2006, the Jakarta Administrative Court granted an order restricting the MoEMR from taking any further administrative steps on the issue until a final and binding judgement was delivered. In September 2006, the Jakarta Administrative Court issued a decision in favour of Adaro. The Jakarta High Administrative Court concurred with the Jakarta Administrative Court in February 2007. On 26 September 2008, the Indonesian Supreme Court concurred with the decision of the Jakarta High Administrative Court and the decision of the Indonesian Supreme Court is final and binding. In June 2006, MoEMR granted authority to the Committee for State Claim Affairs (the “Committee”) to pursue the alleged underpayment on its behalf. In July 2007, the Committee issued a demand for payment to Adaro. As this is an industrywide problem, similar demands have been made by the Committee to other firstgeneration companies.
In September 2007, Adaro filed an objection with the Jakarta Administrative Court against the Committee. Upon Adaro’s application, in September 2007 the Jakarta Administrative Court granted an order restricting the Committee from taking any further administrative steps on the issue until a final and binding judgement had been delivered. On 15 February 2008, the Jakarta Administrative Court issued a decision in favour of Adaro. The Jakarta High Administrative Court concurred with the Jakarta Admistrative Court on 1 July 2008. On 22 July 2009, the Indonesian Supreme Court concurred with the decision of the Jakarta High Administrative Court and the decision of the Indonesian Supreme Court is final and binding. On 29 January 2010, the Committee filed a civil review (Peninjauan Kembali) on the decision of the Indonesian Supreme Court. On 31 January 2011, the Jakarta Administrative Court delivered the decision on the civil review (Peninjauan Kembali), where the Supreme Court decided to reject the request of the civil review (Peninjauan Kembali) from the Committee, based on decision No. 47PK/TUN/2010 dated 20 July 2010. As management believes that Adaro has strong grounds supporting the case and the recent court decision was in favour of Adaro, no provision has been booked in the consolidated financial statements in relation to this matter.
As at 31 December 2011, Adaro had outstanding purchase orders for mining equipment amounting to US$499,548 and SIS for operational equipment amounting to US$121,651.

Adaro Energy Annual Report 2011 www.adaro.com258
(Expressed in thousand US Dollars, unless otherwise stated)
(continued)
On 5 September 2007, Adaro entered into a bank facility agreement with HSBC to issue a bank guarantee. This agreement has been amended several times and the last amendment was to extend the maturity date of this agreement to 31 July 2012. The total limit of this facility is US$30,000 which includes the issuing of a standby documentary credit amounting to US$20,000, performance bonds amounting to US$15,000 and tender bonds amounting to US$15,000. This facility is not bound by any collateral. On 20 August 2008, Adaro entered into a banking facility amendment agreement with PT Bank DBS Indonesia for the banking facility in bank guarantee, bid bonds, performance bonds and standby letters of credit, with a total limit of US$15,000. This agreement has been amended several times and the last amendment was to extend the maturity date of this agreement to 14 July 2012. This facility is not bound by any collateral. The use of certain banking facilities requires Adaro to maintain time deposits (refer to Note 7). As at 31 December 2011, the total bank facilities used by Adaro which were obtained from HSBC and PT Bank DBS Indonesia and from other financial institutions (obtained without any facility) in various currencies, aggregated to US$43,588 (31 December 2010: US$59,544). Those facilities had been issued in relation to sales contracts and reclamation guarantees.
As at 31 December 2011, Adaro had various commitments to deliver 213.9 million metric tonnes of coal to various buyers, subject to price agreement. The coal will be periodically delivered from 2012 until 2022.
Based on Government Regulation No. 2 dated 4 February 2008, all companies that have activities in production and protected forest areas but not related to forestry will have an obligation to pay a forestry fee ranging from Rp 1,200,000 (full amount) to Rp 3,000,000 (full amount) per hectare. This fee is effective from 2008. The Group has recognised this fee on an accrual basis.
On 23 April 2008, MSW entered into an Engineering, Procurement and Construction (“EPC”) Agreement with PT Punj Llyod Indonesia (“Punj Llyod Indonesia”). Under this agreement, Punj Llyod Indonesia will provide construction services for the Project Tanjung Tabalong 2x30 MW coal fired power plant project, located in Kalimantan, Indonesia. Under the agreement, MSW is required to pay a 15% advance to Punj Llyod Indonesia and installments upon the achievement of project milestones. On 23 April 2008, MSW entered into an EPC Agreement with Punj Llyod Pte Ltd (“Punj Llyod”). Under this agreement, Punj Llyod will supply equipment for the Tanjung Tabalong 2x30 MW coal fired power plant project, located in Kalimantan, Indonesia. Under the agreement, MSW is required to pay Punj Llyod a 15% advance and installments upon the achievement of project milestones.
Adaro has various agency agreements with third party agents to market their coal for certain customers. The agents will receive commission based on a percentage of sales to those customers.
From time to time, the Group is involved in various legal proceedings as a normal incident to the Group’s business. The Group is of the opinion that adverse decisions in any pending or threatened proceeding, or that any amounts it may be required to pay by reason thereof will not have a material adverse effect on its financial condition or the results of its operations.
(Expressed in thousand US Dollars, unless otherwise stated)
(continued)
On 24 February 2009, Adaro entered into a Multicurrency Revolving Credit Facility agreement with DBS Bank Ltd which acted as Original Lender and Facility Agent. Under this agreement, DBS Bank Ltd agreed to provide a multicurrency revolving credit facility in an aggregate amount of US$40,000 for a period of 36 months after the date of the agreement. This facility will be charged with interest rates at LIBOR plus a certain percentage. Coaltrade, IBT and the Company act as guarantors of this loan facility. On 12 November 2010, an amendment agreement was entered into to amend and restate in its entirety the facility, among others, changing the facility amount to US$36,000. As at 31 December 2011, Adaro had utilised the facility amounting to US$15,000 for standby letter of credit.
In accordance with the terms of the agreement, Adaro is required to maintain certain financial ratios. This loan has similar significant terms and conditions to the longterm Syndicated Loan (refer to Note 21a).
On 29 December 2009, JPI, Sandvik Asia Ltd and PT Tripatra Engineers and Constructors, entered into contracts for the construction of an Overland Conveyor, for the purpose of supporting Adaro’s increase of its coal production capacity with total contract amounts (including provisional sums) of approximately US$237,000. The construction is planned to be completed within two years from the date of the commencement of the project. Until 31 December 2011, there had been no spending related to this contract and the project had been put on hold.
On 1 September 2009, IBT entered into a Fuel Facilities Agreement with Shell. Based on the agreement, Shell agreed to build a fuel storage facility with a minimum capacity of 60,000 tonnes of diesel on land belonging to IBT and IBT agreed to build shared facilities within the terminal for unloading and loading of the diesel. For the use of the shared facilities, Shell agreed to pay a handling fee of a certain amount per barrel of the loaded quantities of diesel. The agreement will expire on 31 December 2022. At the end of the agreement period, Shell will transfer the ownership of the fuel storage facility to IBT.
On 16 December 2008, the Indonesian Parliament passed a new Law on Mineral and Coal Mining (the “Law”), which received the assent of the President on 12 January 2009, becoming Law No. 4/2009. The CCA system under which Adaro, one of the Group’s subsidiaries, operates, will no longer be available to investors. However, the Law indicates that existing CCAs, such as those held by Adaro, will be honoured. There are a number of issues which existing CCA holders, including Adaro, are currently analysing. Among others these include:
the Law notes that existing CCAs will be honoured until their expiration. However, it also states that
existing CCAs must be amended within one year to conform to the provisions of the Law (other than terms relating to State revenue which is not defined, but presumably includes royalties and taxes); and
the requirement for CCA holders which have already commenced some form of activity to, within one year of enactment of the Law, submit a mining activity plan for the entire contract area. If this plan is not fulfilled, the contract area may be reduced to that allowed for mining business licences (“Izin Usaha Pertambangan” or “IUP”) under the Law.
In February 2010, the Government of Indonesia released two implementing regulations for Mining Law No. 4/2009, i.e. Government Regulation No. 22/2010 and 23/2010 (“GR No. 22” and “GR No. 23”). GR No. 22 deals with the establishment of the mining areas under the new mining business license (IUP). GR No. 23 provides clarifications surrounding the procedures to obtain the new IUP. GR No. 23 indicates that existing CCAs will be honoured by the Government although any extension of existing CCAs will be through the issue of an IUP. On 10 January 2012, the President of the Republic of Indonesia issued a Presidential Decree (Keppres No.3/2012) on Evaluation Team for Contract of Work (“COW”) and CCA Adjustment.

Adaro Energy Annual Report 2011www.adaro.com 259
(Expressed in thousand US Dollars, unless otherwise stated)
(continued)
On 5 September 2007, Adaro entered into a bank facility agreement with HSBC to issue a bank guarantee. This agreement has been amended several times and the last amendment was to extend the maturity date of this agreement to 31 July 2012. The total limit of this facility is US$30,000 which includes the issuing of a standby documentary credit amounting to US$20,000, performance bonds amounting to US$15,000 and tender bonds amounting to US$15,000. This facility is not bound by any collateral. On 20 August 2008, Adaro entered into a banking facility amendment agreement with PT Bank DBS Indonesia for the banking facility in bank guarantee, bid bonds, performance bonds and standby letters of credit, with a total limit of US$15,000. This agreement has been amended several times and the last amendment was to extend the maturity date of this agreement to 14 July 2012. This facility is not bound by any collateral. The use of certain banking facilities requires Adaro to maintain time deposits (refer to Note 7). As at 31 December 2011, the total bank facilities used by Adaro which were obtained from HSBC and PT Bank DBS Indonesia and from other financial institutions (obtained without any facility) in various currencies, aggregated to US$43,588 (31 December 2010: US$59,544). Those facilities had been issued in relation to sales contracts and reclamation guarantees.
As at 31 December 2011, Adaro had various commitments to deliver 213.9 million metric tonnes of coal to various buyers, subject to price agreement. The coal will be periodically delivered from 2012 until 2022.
Based on Government Regulation No. 2 dated 4 February 2008, all companies that have activities in production and protected forest areas but not related to forestry will have an obligation to pay a forestry fee ranging from Rp 1,200,000 (full amount) to Rp 3,000,000 (full amount) per hectare. This fee is effective from 2008. The Group has recognised this fee on an accrual basis.
On 23 April 2008, MSW entered into an Engineering, Procurement and Construction (“EPC”) Agreement with PT Punj Llyod Indonesia (“Punj Llyod Indonesia”). Under this agreement, Punj Llyod Indonesia will provide construction services for the Project Tanjung Tabalong 2x30 MW coal fired power plant project, located in Kalimantan, Indonesia. Under the agreement, MSW is required to pay a 15% advance to Punj Llyod Indonesia and installments upon the achievement of project milestones. On 23 April 2008, MSW entered into an EPC Agreement with Punj Llyod Pte Ltd (“Punj Llyod”). Under this agreement, Punj Llyod will supply equipment for the Tanjung Tabalong 2x30 MW coal fired power plant project, located in Kalimantan, Indonesia. Under the agreement, MSW is required to pay Punj Llyod a 15% advance and installments upon the achievement of project milestones.
Adaro has various agency agreements with third party agents to market their coal for certain customers. The agents will receive commission based on a percentage of sales to those customers.
From time to time, the Group is involved in various legal proceedings as a normal incident to the Group’s business. The Group is of the opinion that adverse decisions in any pending or threatened proceeding, or that any amounts it may be required to pay by reason thereof will not have a material adverse effect on its financial condition or the results of its operations.
(Expressed in thousand US Dollars, unless otherwise stated)
(continued)
On 24 February 2009, Adaro entered into a Multicurrency Revolving Credit Facility agreement with DBS Bank Ltd which acted as Original Lender and Facility Agent. Under this agreement, DBS Bank Ltd agreed to provide a multicurrency revolving credit facility in an aggregate amount of US$40,000 for a period of 36 months after the date of the agreement. This facility will be charged with interest rates at LIBOR plus a certain percentage. Coaltrade, IBT and the Company act as guarantors of this loan facility. On 12 November 2010, an amendment agreement was entered into to amend and restate in its entirety the facility, among others, changing the facility amount to US$36,000. As at 31 December 2011, Adaro had utilised the facility amounting to US$15,000 for standby letter of credit.
In accordance with the terms of the agreement, Adaro is required to maintain certain financial ratios. This loan has similar significant terms and conditions to the longterm Syndicated Loan (refer to Note 21a).
On 29 December 2009, JPI, Sandvik Asia Ltd and PT Tripatra Engineers and Constructors, entered into contracts for the construction of an Overland Conveyor, for the purpose of supporting Adaro’s increase of its coal production capacity with total contract amounts (including provisional sums) of approximately US$237,000. The construction is planned to be completed within two years from the date of the commencement of the project. Until 31 December 2011, there had been no spending related to this contract and the project had been put on hold.
On 1 September 2009, IBT entered into a Fuel Facilities Agreement with Shell. Based on the agreement, Shell agreed to build a fuel storage facility with a minimum capacity of 60,000 tonnes of diesel on land belonging to IBT and IBT agreed to build shared facilities within the terminal for unloading and loading of the diesel. For the use of the shared facilities, Shell agreed to pay a handling fee of a certain amount per barrel of the loaded quantities of diesel. The agreement will expire on 31 December 2022. At the end of the agreement period, Shell will transfer the ownership of the fuel storage facility to IBT.
On 16 December 2008, the Indonesian Parliament passed a new Law on Mineral and Coal Mining (the “Law”), which received the assent of the President on 12 January 2009, becoming Law No. 4/2009. The CCA system under which Adaro, one of the Group’s subsidiaries, operates, will no longer be available to investors. However, the Law indicates that existing CCAs, such as those held by Adaro, will be honoured. There are a number of issues which existing CCA holders, including Adaro, are currently analysing. Among others these include:
the Law notes that existing CCAs will be honoured until their expiration. However, it also states that
existing CCAs must be amended within one year to conform to the provisions of the Law (other than terms relating to State revenue which is not defined, but presumably includes royalties and taxes); and
the requirement for CCA holders which have already commenced some form of activity to, within one year of enactment of the Law, submit a mining activity plan for the entire contract area. If this plan is not fulfilled, the contract area may be reduced to that allowed for mining business licences (“Izin Usaha Pertambangan” or “IUP”) under the Law.
In February 2010, the Government of Indonesia released two implementing regulations for Mining Law No. 4/2009, i.e. Government Regulation No. 22/2010 and 23/2010 (“GR No. 22” and “GR No. 23”). GR No. 22 deals with the establishment of the mining areas under the new mining business license (IUP). GR No. 23 provides clarifications surrounding the procedures to obtain the new IUP. GR No. 23 indicates that existing CCAs will be honoured by the Government although any extension of existing CCAs will be through the issue of an IUP. On 10 January 2012, the President of the Republic of Indonesia issued a Presidential Decree (Keppres No.3/2012) on Evaluation Team for Contract of Work (“COW”) and CCA Adjustment.
Adaro Energy Annual Report 2011 www.adaro.com260
(Expressed in thousand US Dollars, unless otherwise stated)
(continued)
(continued) The Team’s task consists of the following: (1) evaluating the articles in the COW and CCA to be in compliance with the Law; (2) determining the steps to be taken to determining COW and CCA areas and state income/revenue for the purpose of COW and CCA negotiation; and (3) determining steps to be taken for the implementation of the COW and CCA holder’s obligations, on the processing and/or refinery of mineral and coal.
The Group is closely monitoring the progress of the implementing regulations for the Law and will consider the impact on its operation, if any, once these regulations are issued.
In September 2009, the Minister of Energy and Mineral Resources issued Ministerial Regulation No. 28/2009, which, among others, requires the Directorate General’s approval to use an affiliate as a mining service contractor. The regulation provides the definition of affiliates and provides exception only when there are no similar mining services companies in the regency/city and/or province, or when there are no other capable mining service companies operating in the area. The regulation requires mining concession companies under their existing contracts to be conducting all coal extraction activities themselves within three years of the issue of the regulation, but for new contracts the obligation is effective from the date of the contract. Accordingly, Adaro will be required to develop its own extraction capabilities in lieu of relying on third party contractors.
The regulation provides a threeyear transition period for changes to existing arrangements. The Group is currently considering the implications of this regulation, given that SIS provides mining services to Adaro. The Director General of Mineral, Coal and Geothermal has recently issued Director General Regulation No. 376.K/30/DJB/2010 dated 10 May 2010 on the procedures and requirements of a request for approval to involve a subsidiary and/or an affiliate in mining services activities (“Dirgen Regulation”). The Dirgen Regulation regulates further Ministerial Regulation No. 28/2009, specifically on the procedures and requirements regarding the involvement of a subsidiary and/or an affiliate in mining services activities.
Management believes that Adaro carrying out coal extraction activity itself will not substantially change the operating structure of either Adaro or SIS (as a result of changes at Adaro or other similar customers of SIS), since SIS would be able to provide rental equipment service in relation to coal extraction activity subject to obtaining license/registration from MoEMR.
In December 2009, the Minister of Energy and Mineral Resources issued another regulation, Ministerial Regulation No. 34/2009, which provides a legal framework to require mining companies to sell a portion of their output to domestic customers (“Domestic Market Obligation” or “DMO”). Subsequently, on 1 December 2011, MoEMR issued Ministrial Decree No. 1334/K/32/DJB/2011 which revised the minimum DMO percentage for the year 2011 to be 18.41%. Adaro has met the minimum DMO percentage for the year ended 31 December 2011.
In September 2010, the Minister of Energy and Mineral Resources issued Ministerial Regulation No. 17/2010 on The Procedure for the Setting of Benchmark Prices For Mineral and Coal Sales, which regulates that the sale of coal shall be conducted with reference to the benchmark price as issued by the Government, which will be regulated by a regulation issued by the Director General of Mineral, Coal and Geothermal. In the Ministerial Regulation, existing spot and term contracts which have been signed prior to the date of the Ministerial Regulation must confirm its provisions with the provisions under Ministerial Regulation within six months for spot contracts and 12 months for term contracts. Those contracts whose coal sales prices have been renegotiated under and in accordance with the instruction of the Minister or Director General are exempted.
(Expressed in thousand US Dollars, unless otherwise stated)
(continued)
(continued)
On 3 March 2011, Minister of Energy and Mineral Resources issued Ministerial Decision No. 0617 K/32/MEM/2011 on The Benchmark Price for PT Perusahaan Listrik Negara (Persero) (“PLN”) in Operation of Coal Fired Power Plant, which regulates:
• The coal purchase price by PLN in their operation of coal fired power plant is the coal benchmark price
at the time that agreement between PLN and CCA company or IUP Coal Production, was made; • The agreed coal purchase price should be adjusted every 12 months with the coal purchase price based
on the coal benchmark price enacted at the date of adjustment; and • The coal benchmark price will be regulated further by regulation of the Director General of Mineral, Coal
and Geothermal.
On 24 March 2011, the Director General of Mineral and Coal issued Director General Regulation No. 515.K/32/DJB/2011 on the Formula for Setting the Coal Benchmark Price, which regulates: • Setting the coal benchmark price every month based on the formula which is the average of several coal
price indices; • Coal benchmark price should be used as the basis in coal sales; and • For the coal sales on a term basis, the coal price is based on the average of the three last benchmarked
prices at the month where the price was agreed.
On 26 August 2011, the Director General of Mineral and Coal issued Director General Regulation No. 999.K/30/DJB/2011 on the Procedure for Determining the Adjustment Coal Benchmark Price, which regulates: • Setting the cost adjustment for the calculation of coal benchmark price for Free on Board Barge coal
sales, cost insurance freight coal sales and coal sales within one island; and • The regulated adjustment is the maximum adjustment that can be applied for calculating Government
royalties. The Group has complied with the requirements of the regulation, as mentioned above.
On 25 March 2011, Adaro and FLSmidth Spokane, Inc entered into a contract in relation to the overburden crushing and conveying system equipment supply and offshore services (“FLSmidth Spokane Contract”), for the purpose of supporting Adaro’s increase of its coal production capacity, with a total contract amount of US$92,003. Either party may assign their interest in the contract to another entity, with written consent from the other party. On 10 November 2011, Adaro, JPI and FLSmidth Spokane, Inc entered into a deed of novation of a contract, where Adaro transfers all its rights and obligations under the FLSmidth Spokane Contract, to JPI. On 25 March 2011, Adaro and PT Wijaya Karya (Persero) Tbk entered into a construction contract in relation to the overburden crushing and conveying system (“WIKA Contract”), with a total contract amount of US$83,870. The construction is planned to be completed within two years from the date of the commencement of the project. Either party may assign their interest in the contract to another entity, with written consent from the other party.
On 10 November 2011, Adaro, JPI and PT Wijaya Karya (Persero) Tbk entered into a deed of novation of a contract, whereas Adaro transfers all its rights and obligations under the WIKA Contract to JPI.
The Company, together with Electric Power Development Co Ltd (“JPower”) and Itochu Corporation (“Itochu”), which form JPowerAdaroItochu Consortium and established PT Bhimasena Power Indonesia (“BPI”) in July 2011, which the Company through its subsidiary, PT Adaro Power, owns participation interests of 34%, 34% and 32% respectively, to build, own and operate a coal fired power plant.

Adaro Energy Annual Report 2011www.adaro.com 261
(Expressed in thousand US Dollars, unless otherwise stated)
(continued)
(continued) The Team’s task consists of the following: (1) evaluating the articles in the COW and CCA to be in compliance with the Law; (2) determining the steps to be taken to determining COW and CCA areas and state income/revenue for the purpose of COW and CCA negotiation; and (3) determining steps to be taken for the implementation of the COW and CCA holder’s obligations, on the processing and/or refinery of mineral and coal.
The Group is closely monitoring the progress of the implementing regulations for the Law and will consider the impact on its operation, if any, once these regulations are issued.
In September 2009, the Minister of Energy and Mineral Resources issued Ministerial Regulation No. 28/2009, which, among others, requires the Directorate General’s approval to use an affiliate as a mining service contractor. The regulation provides the definition of affiliates and provides exception only when there are no similar mining services companies in the regency/city and/or province, or when there are no other capable mining service companies operating in the area. The regulation requires mining concession companies under their existing contracts to be conducting all coal extraction activities themselves within three years of the issue of the regulation, but for new contracts the obligation is effective from the date of the contract. Accordingly, Adaro will be required to develop its own extraction capabilities in lieu of relying on third party contractors.
The regulation provides a threeyear transition period for changes to existing arrangements. The Group is currently considering the implications of this regulation, given that SIS provides mining services to Adaro. The Director General of Mineral, Coal and Geothermal has recently issued Director General Regulation No. 376.K/30/DJB/2010 dated 10 May 2010 on the procedures and requirements of a request for approval to involve a subsidiary and/or an affiliate in mining services activities (“Dirgen Regulation”). The Dirgen Regulation regulates further Ministerial Regulation No. 28/2009, specifically on the procedures and requirements regarding the involvement of a subsidiary and/or an affiliate in mining services activities.
Management believes that Adaro carrying out coal extraction activity itself will not substantially change the operating structure of either Adaro or SIS (as a result of changes at Adaro or other similar customers of SIS), since SIS would be able to provide rental equipment service in relation to coal extraction activity subject to obtaining license/registration from MoEMR.
In December 2009, the Minister of Energy and Mineral Resources issued another regulation, Ministerial Regulation No. 34/2009, which provides a legal framework to require mining companies to sell a portion of their output to domestic customers (“Domestic Market Obligation” or “DMO”). Subsequently, on 1 December 2011, MoEMR issued Ministrial Decree No. 1334/K/32/DJB/2011 which revised the minimum DMO percentage for the year 2011 to be 18.41%. Adaro has met the minimum DMO percentage for the year ended 31 December 2011.
In September 2010, the Minister of Energy and Mineral Resources issued Ministerial Regulation No. 17/2010 on The Procedure for the Setting of Benchmark Prices For Mineral and Coal Sales, which regulates that the sale of coal shall be conducted with reference to the benchmark price as issued by the Government, which will be regulated by a regulation issued by the Director General of Mineral, Coal and Geothermal. In the Ministerial Regulation, existing spot and term contracts which have been signed prior to the date of the Ministerial Regulation must confirm its provisions with the provisions under Ministerial Regulation within six months for spot contracts and 12 months for term contracts. Those contracts whose coal sales prices have been renegotiated under and in accordance with the instruction of the Minister or Director General are exempted.
(Expressed in thousand US Dollars, unless otherwise stated)
(continued)
(continued)
On 3 March 2011, Minister of Energy and Mineral Resources issued Ministerial Decision No. 0617 K/32/MEM/2011 on The Benchmark Price for PT Perusahaan Listrik Negara (Persero) (“PLN”) in Operation of Coal Fired Power Plant, which regulates:
• The coal purchase price by PLN in their operation of coal fired power plant is the coal benchmark price
at the time that agreement between PLN and CCA company or IUP Coal Production, was made; • The agreed coal purchase price should be adjusted every 12 months with the coal purchase price based
on the coal benchmark price enacted at the date of adjustment; and • The coal benchmark price will be regulated further by regulation of the Director General of Mineral, Coal
and Geothermal.
On 24 March 2011, the Director General of Mineral and Coal issued Director General Regulation No. 515.K/32/DJB/2011 on the Formula for Setting the Coal Benchmark Price, which regulates: • Setting the coal benchmark price every month based on the formula which is the average of several coal
price indices; • Coal benchmark price should be used as the basis in coal sales; and • For the coal sales on a term basis, the coal price is based on the average of the three last benchmarked
prices at the month where the price was agreed.
On 26 August 2011, the Director General of Mineral and Coal issued Director General Regulation No. 999.K/30/DJB/2011 on the Procedure for Determining the Adjustment Coal Benchmark Price, which regulates: • Setting the cost adjustment for the calculation of coal benchmark price for Free on Board Barge coal
sales, cost insurance freight coal sales and coal sales within one island; and • The regulated adjustment is the maximum adjustment that can be applied for calculating Government
royalties. The Group has complied with the requirements of the regulation, as mentioned above.
On 25 March 2011, Adaro and FLSmidth Spokane, Inc entered into a contract in relation to the overburden crushing and conveying system equipment supply and offshore services (“FLSmidth Spokane Contract”), for the purpose of supporting Adaro’s increase of its coal production capacity, with a total contract amount of US$92,003. Either party may assign their interest in the contract to another entity, with written consent from the other party. On 10 November 2011, Adaro, JPI and FLSmidth Spokane, Inc entered into a deed of novation of a contract, where Adaro transfers all its rights and obligations under the FLSmidth Spokane Contract, to JPI. On 25 March 2011, Adaro and PT Wijaya Karya (Persero) Tbk entered into a construction contract in relation to the overburden crushing and conveying system (“WIKA Contract”), with a total contract amount of US$83,870. The construction is planned to be completed within two years from the date of the commencement of the project. Either party may assign their interest in the contract to another entity, with written consent from the other party.
On 10 November 2011, Adaro, JPI and PT Wijaya Karya (Persero) Tbk entered into a deed of novation of a contract, whereas Adaro transfers all its rights and obligations under the WIKA Contract to JPI.
The Company, together with Electric Power Development Co Ltd (“JPower”) and Itochu Corporation (“Itochu”), which form JPowerAdaroItochu Consortium and established PT Bhimasena Power Indonesia (“BPI”) in July 2011, which the Company through its subsidiary, PT Adaro Power, owns participation interests of 34%, 34% and 32% respectively, to build, own and operate a coal fired power plant.

Adaro Energy Annual Report 2011 www.adaro.com262
(Expressed in thousand US Dollars, unless otherwise stated)
(continued)
(continued) On 6 October 2011, BPI and PLN signed a longterm Power Purchase Agreement (“PPA”). The PPA includes the construction of a coal fired power plant with a total capacity of 2,000 MW in the Province of Central Java (Central Java Power Plant/“CJPP”) and a 25year supply of electricity to PLN. In addition to the PPA, a Guarantee Agreement was also signed by and among the Government of the Republic of Indonesia, PT Penjaminan Infrastruktur Indonesia (Persero) and BPI, which in this case, guarantee PLN’s payment obligation for the CJPP project under the PPA. The construction is expected to begin in October 2012 and commercial operations are expected to start in late 2016.
On 31 January 2008, PT Tambang Batubara Bukit Asam (Persero), Tbk. (“the Plaintiff”) filed a lawsuit of “Tort” on (i) Lahat Regent, (ii) Head of Mines and Energy Department of Lahat Regency, (iii) Head of Mines and Energy Development Department of the Provincial Government of South Sumatera qq. South Sumatera Governor, (iv) PT Mustika Indah Permai, (v) PT Bukit Bara Alam, (vi) PT Muara Alam Sejahtera, (vii) PT Bara Alam Utama, and (viii) PT Bumi Merapi Energi (“the Defendants”), through District Court of Lahat in civil case No. 04/Pdt.G/2008/PN.LT. On 12 August 2008, the case was resolved by a decision that in principal declared that the District Court of Lahat is not authorised by its jurisdiction to adjudicate the case. The Plaintiff further appealed to the High Court of Palembang and on 16 December 2008 the High Court of Palembang issued decision No. 78/PDT/2008/PT.PLG on the appeal. For the decision of the High Court of Palembang, the Defendants has filed a cassation and the Supreme Court issued Cassation decision No. 2157K/PDT/2009 on 28 January 2010. Further to the Cassation decision, a Judicial Review has been filed to the Supreme Court, that is recorded under case register No. 405 PK/PDT/2011. The Judicial Review that was requested by (i) PT Bumi Merapi Energi, (ii) PT Bara Alam Utama, (iii) PT Mustika Indah Permai, (iv) PT Bukit Bara Alam, (v) PT Muara Alam Sejahtera, (vi) Lahat Regent, and (vii) Head of Mines and Energy Department of Lahat Regency, was decided by the Supreme Court on 10 November 2011 and received on 20 March 2012 through Announcement for Judicial Review Decision No: 405 PK/PDT/2011 No: 04/Pdt.G/2008/PN.LT with the decision to grant the judicial review request of the Requestors of the Judicial Review and to revoke the decision of the Supreme Court No. 2157 K/Pdt/2009 on 28 January 2010, and to declare that the District Court of Lahat is not authorised to adjudicate case No. 04/Pdt.G/2009/PN.LT.
With the issuance of Supreme Court Decision No. 405 PK/PDT/2011 that granted the Judicial Review’s request and in favor of the Judicial Review Requestors, and considering that case No. 04/Pdt.G/2008/PN.LT jo. No. 78/PDT/2008/PT.PLG jo. No. 2157K/PDT/2011 has obtained a final and binding decision (“inkracht van gewijsde”) and that the Judicial Review made the final decision that no further appeal can be made to this decision, the Management is of the opinion that the decision of the Supreme Court on the Judicial Review case No. 405 PK/PDT/2011 was the final and binding decision and shall be obeyed by the disputing parties, therefore it can be the legal reference for all parties concerned.
In addition, letter from Lahat Regent to Director General of Mineral and Coal No. 540/244/Pertamb.II/2012 dated 20 March 2012, concerning the Correction on IUP Reconciliation Announcement in Lahat Regency, as forwarded to the Defendants, declared that on 10 October 2011 the Supreme Court made a decision on Administrative Court Judicial Review case No. 109 PK/TUN/2011 which granted the Judicial Review request of Lahat Regent with the following decision: grant the Judicial Review request from the Judicial Review Requestor (Lahat Regent); revoke Supreme Court decision No: 326 K/TUN/2006 dated 10 May 2007; and fully reject the lawsuit of the Plaintiff (PT Tambang Batubara Bukit Asam (Persero), Tbk.).
As such, the lawsuit of PT Tambang Batubara Bukit Asam (Persero), Tbk. to the Lahat Regent in Administrative Case No.06/G.TUN/2005/PTUNPLG jo. No.100/BDG/2005/PT.TUNMDN jo. No.326 K/TUN/2006 jo. No.109 PK/TUN/2011 has been fully rejected and the case has obtained a final and binding decision (“inkracht van gewijsde”). Therefore Lahat Regent Decision No. 540/29/KEP/PERTAMBEN/2005 dated 24 January 2005, for the Determination of the Status of the Former Exploitation Mining Rights Area (KW.97.PP0350) and Exploitation Mining Rights (KW.DP.16.03.04.01.03) of PT Tambang Batubara Bukit Asam (Persero), Tbk., that confirms the authority of the Lahat Regency Government in managing the license of the mining area inside the area of Lahat Regency, and its implementations or further actions, including the process of IUP issuance is lawful, and it is therefore the legal reference for all parties concerned.
(Expressed in thousand US Dollars, unless otherwise stated)
On 29 May 2008, the Minister of Energy and Mineral Resources announced a new regulation regarding mine reclamation and mine closure, as detailed in Ministerial Regulation No. 18/2008. It is stated that a company is required to provide mine reclamation and mine closure guarantees which may be in the form of a time deposit, bank guarantee or insurance, all of which with a duration corresponding to the reclamation schedule. The mine reclamation guarantee may also be in the form of an accounting reserve, if the company either is a publicly listed company or has paidup capital of at least US$25,000 as stated in the audited financial statements. If in the form of a time deposit, the mine closure guarantee may be placed in Rupiah or US$ funds, with a state owned bank in Indonesia on behalf of the Minister of Energy and Mineral Resources, Governor or Mayor qq of the relevant company with a duration corresponding to the mine closure schedule.
Based on the Decree of the DGoMCG No. 882/37.06/DJB/2010 dated 26 March 2010 and No. 1153/30/DJB/2011 dated 11 March 2011, Adaro is required to provide a Reclamation Guarantee in the form of performance bonds. As at the statement of financial position date, Adaro had placed reclamation guarantees in the form of performance bonds amounting to Rp 47.1 billion (31 December 2010: Rp 46.2 billion). On 20 December 2010, the Government of Indonesia released an implementing regulation for Mining Law No.4/2009, i.e. Government Regulation No.78/2010 (“GR No.78”) that deals with reclamations and postmining activities for both IUPExploration and IUPProduction Operation holders. This regulation updates Ministerial Regulation No.18/2008 issued by the Minister of Energy and Mineral Resources on 29 May 2008.
An IUPExploration holder, among other requirements, must include a reclamation plan in its exploration work plan and budget and provide a reclamation guarantee in the form of a time deposit placed at a stateowned bank. An IUPProduction Operation holder, among other requirements, must prepare (1) a fiveyear reclamation plan; (2) a postmining plan; (3) provide a reclamation guarantee which may be in the form of a joint account or time deposit placed at a stateowned bank, a bank guarantee, or an accounting provision (if eligible); and (4) provide a postmine guarantee in the form of a time deposit at a stateowned bank. The requirement to provide a reclamation guarantee and a postmine guarantee does not release the IUP holder from the requirement to perform reclamation and postmine activities. The transitional provisions in GR No. 78 make it clear that CCA holders are also required to comply with this regulation. In 2009, Adaro submitted its mine closure plan to the MoEMR. Adaro is still discussing the mine closure plan with MoEMR. The form of the guarantee for the mine closure will be decided once MoEMR has approved Adaro’s mine closure plan.
The information given below relates to the Group’s financial assets and liabilities by categories: Cash and cash equivalents 558,872 558,872 Trade receivables 471,342 471,342 Recoverable taxes 96,950 96,950 Other receivables 13,528 13,528 Loans to third parties 36,542 36,542 Loan to a related party 15,508 15,508 Derivative assets 666 666 Restricted cash and time deposits 941 941 Investment in equity securities 65,708 65,708 Other current assets 2,222 2,222 Other noncurrent assets 13,881 13,881 1,276,160 1,209,786 666 65,708

Adaro Energy Annual Report 2011www.adaro.com 263
(Expressed in thousand US Dollars, unless otherwise stated)
(continued)
(continued) On 6 October 2011, BPI and PLN signed a longterm Power Purchase Agreement (“PPA”). The PPA includes the construction of a coal fired power plant with a total capacity of 2,000 MW in the Province of Central Java (Central Java Power Plant/“CJPP”) and a 25year supply of electricity to PLN. In addition to the PPA, a Guarantee Agreement was also signed by and among the Government of the Republic of Indonesia, PT Penjaminan Infrastruktur Indonesia (Persero) and BPI, which in this case, guarantee PLN’s payment obligation for the CJPP project under the PPA. The construction is expected to begin in October 2012 and commercial operations are expected to start in late 2016.
On 31 January 2008, PT Tambang Batubara Bukit Asam (Persero), Tbk. (“the Plaintiff”) filed a lawsuit of “Tort” on (i) Lahat Regent, (ii) Head of Mines and Energy Department of Lahat Regency, (iii) Head of Mines and Energy Development Department of the Provincial Government of South Sumatera qq. South Sumatera Governor, (iv) PT Mustika Indah Permai, (v) PT Bukit Bara Alam, (vi) PT Muara Alam Sejahtera, (vii) PT Bara Alam Utama, and (viii) PT Bumi Merapi Energi (“the Defendants”), through District Court of Lahat in civil case No. 04/Pdt.G/2008/PN.LT. On 12 August 2008, the case was resolved by a decision that in principal declared that the District Court of Lahat is not authorised by its jurisdiction to adjudicate the case. The Plaintiff further appealed to the High Court of Palembang and on 16 December 2008 the High Court of Palembang issued decision No. 78/PDT/2008/PT.PLG on the appeal. For the decision of the High Court of Palembang, the Defendants has filed a cassation and the Supreme Court issued Cassation decision No. 2157K/PDT/2009 on 28 January 2010. Further to the Cassation decision, a Judicial Review has been filed to the Supreme Court, that is recorded under case register No. 405 PK/PDT/2011. The Judicial Review that was requested by (i) PT Bumi Merapi Energi, (ii) PT Bara Alam Utama, (iii) PT Mustika Indah Permai, (iv) PT Bukit Bara Alam, (v) PT Muara Alam Sejahtera, (vi) Lahat Regent, and (vii) Head of Mines and Energy Department of Lahat Regency, was decided by the Supreme Court on 10 November 2011 and received on 20 March 2012 through Announcement for Judicial Review Decision No: 405 PK/PDT/2011 No: 04/Pdt.G/2008/PN.LT with the decision to grant the judicial review request of the Requestors of the Judicial Review and to revoke the decision of the Supreme Court No. 2157 K/Pdt/2009 on 28 January 2010, and to declare that the District Court of Lahat is not authorised to adjudicate case No. 04/Pdt.G/2009/PN.LT.
With the issuance of Supreme Court Decision No. 405 PK/PDT/2011 that granted the Judicial Review’s request and in favor of the Judicial Review Requestors, and considering that case No. 04/Pdt.G/2008/PN.LT jo. No. 78/PDT/2008/PT.PLG jo. No. 2157K/PDT/2011 has obtained a final and binding decision (“inkracht van gewijsde”) and that the Judicial Review made the final decision that no further appeal can be made to this decision, the Management is of the opinion that the decision of the Supreme Court on the Judicial Review case No. 405 PK/PDT/2011 was the final and binding decision and shall be obeyed by the disputing parties, therefore it can be the legal reference for all parties concerned.
In addition, letter from Lahat Regent to Director General of Mineral and Coal No. 540/244/Pertamb.II/2012 dated 20 March 2012, concerning the Correction on IUP Reconciliation Announcement in Lahat Regency, as forwarded to the Defendants, declared that on 10 October 2011 the Supreme Court made a decision on Administrative Court Judicial Review case No. 109 PK/TUN/2011 which granted the Judicial Review request of Lahat Regent with the following decision: grant the Judicial Review request from the Judicial Review Requestor (Lahat Regent); revoke Supreme Court decision No: 326 K/TUN/2006 dated 10 May 2007; and fully reject the lawsuit of the Plaintiff (PT Tambang Batubara Bukit Asam (Persero), Tbk.).
As such, the lawsuit of PT Tambang Batubara Bukit Asam (Persero), Tbk. to the Lahat Regent in Administrative Case No.06/G.TUN/2005/PTUNPLG jo. No.100/BDG/2005/PT.TUNMDN jo. No.326 K/TUN/2006 jo. No.109 PK/TUN/2011 has been fully rejected and the case has obtained a final and binding decision (“inkracht van gewijsde”). Therefore Lahat Regent Decision No. 540/29/KEP/PERTAMBEN/2005 dated 24 January 2005, for the Determination of the Status of the Former Exploitation Mining Rights Area (KW.97.PP0350) and Exploitation Mining Rights (KW.DP.16.03.04.01.03) of PT Tambang Batubara Bukit Asam (Persero), Tbk., that confirms the authority of the Lahat Regency Government in managing the license of the mining area inside the area of Lahat Regency, and its implementations or further actions, including the process of IUP issuance is lawful, and it is therefore the legal reference for all parties concerned.
(Expressed in thousand US Dollars, unless otherwise stated)
On 29 May 2008, the Minister of Energy and Mineral Resources announced a new regulation regarding mine reclamation and mine closure, as detailed in Ministerial Regulation No. 18/2008. It is stated that a company is required to provide mine reclamation and mine closure guarantees which may be in the form of a time deposit, bank guarantee or insurance, all of which with a duration corresponding to the reclamation schedule. The mine reclamation guarantee may also be in the form of an accounting reserve, if the company either is a publicly listed company or has paidup capital of at least US$25,000 as stated in the audited financial statements. If in the form of a time deposit, the mine closure guarantee may be placed in Rupiah or US$ funds, with a state owned bank in Indonesia on behalf of the Minister of Energy and Mineral Resources, Governor or Mayor qq of the relevant company with a duration corresponding to the mine closure schedule.
Based on the Decree of the DGoMCG No. 882/37.06/DJB/2010 dated 26 March 2010 and No. 1153/30/DJB/2011 dated 11 March 2011, Adaro is required to provide a Reclamation Guarantee in the form of performance bonds. As at the statement of financial position date, Adaro had placed reclamation guarantees in the form of performance bonds amounting to Rp 47.1 billion (31 December 2010: Rp 46.2 billion). On 20 December 2010, the Government of Indonesia released an implementing regulation for Mining Law No.4/2009, i.e. Government Regulation No.78/2010 (“GR No.78”) that deals with reclamations and postmining activities for both IUPExploration and IUPProduction Operation holders. This regulation updates Ministerial Regulation No.18/2008 issued by the Minister of Energy and Mineral Resources on 29 May 2008.
An IUPExploration holder, among other requirements, must include a reclamation plan in its exploration work plan and budget and provide a reclamation guarantee in the form of a time deposit placed at a stateowned bank. An IUPProduction Operation holder, among other requirements, must prepare (1) a fiveyear reclamation plan; (2) a postmining plan; (3) provide a reclamation guarantee which may be in the form of a joint account or time deposit placed at a stateowned bank, a bank guarantee, or an accounting provision (if eligible); and (4) provide a postmine guarantee in the form of a time deposit at a stateowned bank. The requirement to provide a reclamation guarantee and a postmine guarantee does not release the IUP holder from the requirement to perform reclamation and postmine activities. The transitional provisions in GR No. 78 make it clear that CCA holders are also required to comply with this regulation. In 2009, Adaro submitted its mine closure plan to the MoEMR. Adaro is still discussing the mine closure plan with MoEMR. The form of the guarantee for the mine closure will be decided once MoEMR has approved Adaro’s mine closure plan.
The information given below relates to the Group’s financial assets and liabilities by categories: Cash and cash equivalents 558,872 558,872 Trade receivables 471,342 471,342 Recoverable taxes 96,950 96,950 Other receivables 13,528 13,528 Loans to third parties 36,542 36,542 Loan to a related party 15,508 15,508 Derivative assets 666 666 Restricted cash and time deposits 941 941 Investment in equity securities 65,708 65,708 Other current assets 2,222 2,222 Other noncurrent assets 13,881 13,881 1,276,160 1,209,786 666 65,708

Adaro Energy Annual Report 2011 www.adaro.com264
(Expressed in thousand US Dollars, unless otherwise stated)
(continued) Cash and cash equivalents 607,271 607,271 Trade receivables 275,426 275,426 Recoverable taxes 78,412 78,412 Other receivables 3,110 3,110 Restricted cash and time deposits 1,294 1,294 Other current assets 155 155 Other noncurrent assets 8,113 8,113 973,781 973,781 Cash and cash equivalents 1,199,427 1,199,427 Trade receivables 306,645 306,645 Recoverable taxes 69,503 69,503 Other receivables 2,251 2,251 Restricted cash and time deposits 1,009 1,009 Other current assets 2,422 2,422 Other noncurrent assets 5,944 5,944 1,587,201 1,587,201 Trade payables 388,342 388,342 Accrued expenses 39,192 39,192 Royalties payable 132,429 132,429 Derivative liabilities 5,482 5,482 Other liabilities 7,306 7,306 Amounts due to a related party 500 500 Finance lease payables 75,246 75,246 Longterm bank loans 1,242,029 1,242,029 Senior Notes 787,292 787,292 2,677,818 5,482 2,672,336Trade payables 268,394 268,394 Accrued expenses 82,080 82,080 Royalties payable 75,906 75,906 Derivative liabilities 16,231 2,628 13,603 Other liabilities 2,092 2,092 Amounts due to a related party 500 500 Finance lease payables 88,761 88,761 Longterm bank loans 717,336 717,336 Senior Notes 786,148 786,148 2,037,448 2,628 13,603 2,021,217
* As restated (refer to Note 3)
(Expressed in thousand US Dollars, unless otherwise stated)
(continued)
Trade payables 230,650 230,650 Accrued expenses 32,145 32,145 Shortterm bank loan 20,000 20,000 Royalties payable 78,515 78,515 Derivative liabilities 17,837 17,837 Other liabilities 3,248 3,248 Amounts due to a related party 500 500 Finance lease payables 86,336 86,336 Longterm bank loans 784,183 784,183 Senior Notes 785,090 785,090 2,038,504 17,837 2,020,667
The Group’s activities expose it to a variety of financial risks, including the effects of foreign currency exchange rates, commodity prices and interest rates. The objectives of the Group’s risk management are to identify, measure, monitor and manage basic risks in order to safeguard the Group's long term business continuity and to minimise potential adverse effects on the financial performance of the Group.
(i) Foreign exchange risk
The financing and the majority of revenue and operating expenditures of the operating subsidiaries of the Company are denominated in US Dollars, which indirectly represents a natural hedge on exposure to the fluctuation in foreign exchange rates.
However, the Group is exposed to foreign exchange risk arising from Rupiah dividend payments to the shareholders and other operation expenses. Management has set up a policy to require group companies to manage their foreign exchange risk against their functional currency. To manage their foreign exchange risk, the Group use forward contracts, transacted only with reputable financial institutions.
(ii) Price risk
The Group faces commodity price risk because coal is a commodity product traded in the world coal markets. Prices for Adaro’s coal (“Envirocoal”) are based on global coal prices, which tend to be highly cyclical and subject to significant fluctuations. As a commodity product, global coal prices are principally dependent on the supply and demand dynamics of coal in the world export market. The Group did not engage in spot coal trading and has not entered into longterm coal pricing agreements to hedge its exposure to fluctuations in the coal price but may do so in the future. Instead, the Group entered into oneyear fixed price coal contracts with some of its customers to safeguard a portion of its revenue for each year.
The Group also faces commodity price risk relating to purchases of fuel necessary to run its coal mining operations. The Group enters into fuel hedge contracts to hedge against the fluctuation in fuel prices for part of the estimated annual fuel usage. Besides this, for mining services provided to its customers, to manage the price risk, the Group entered into longterm contracts with its customers (maximum five years) which also allows price adjustments when the fuel price increases.
* As restated (refer to Note 3)

Adaro Energy Annual Report 2011www.adaro.com 265
(Expressed in thousand US Dollars, unless otherwise stated)
(continued) Cash and cash equivalents 607,271 607,271 Trade receivables 275,426 275,426 Recoverable taxes 78,412 78,412 Other receivables 3,110 3,110 Restricted cash and time deposits 1,294 1,294 Other current assets 155 155 Other noncurrent assets 8,113 8,113 973,781 973,781 Cash and cash equivalents 1,199,427 1,199,427 Trade receivables 306,645 306,645 Recoverable taxes 69,503 69,503 Other receivables 2,251 2,251 Restricted cash and time deposits 1,009 1,009 Other current assets 2,422 2,422 Other noncurrent assets 5,944 5,944 1,587,201 1,587,201 Trade payables 388,342 388,342 Accrued expenses 39,192 39,192 Royalties payable 132,429 132,429 Derivative liabilities 5,482 5,482 Other liabilities 7,306 7,306 Amounts due to a related party 500 500 Finance lease payables 75,246 75,246 Longterm bank loans 1,242,029 1,242,029 Senior Notes 787,292 787,292 2,677,818 5,482 2,672,336Trade payables 268,394 268,394 Accrued expenses 82,080 82,080 Royalties payable 75,906 75,906 Derivative liabilities 16,231 2,628 13,603 Other liabilities 2,092 2,092 Amounts due to a related party 500 500 Finance lease payables 88,761 88,761 Longterm bank loans 717,336 717,336 Senior Notes 786,148 786,148 2,037,448 2,628 13,603 2,021,217
* As restated (refer to Note 3)
(Expressed in thousand US Dollars, unless otherwise stated)
(continued)
Trade payables 230,650 230,650 Accrued expenses 32,145 32,145 Shortterm bank loan 20,000 20,000 Royalties payable 78,515 78,515 Derivative liabilities 17,837 17,837 Other liabilities 3,248 3,248 Amounts due to a related party 500 500 Finance lease payables 86,336 86,336 Longterm bank loans 784,183 784,183 Senior Notes 785,090 785,090 2,038,504 17,837 2,020,667
The Group’s activities expose it to a variety of financial risks, including the effects of foreign currency exchange rates, commodity prices and interest rates. The objectives of the Group’s risk management are to identify, measure, monitor and manage basic risks in order to safeguard the Group's long term business continuity and to minimise potential adverse effects on the financial performance of the Group.
(i) Foreign exchange risk
The financing and the majority of revenue and operating expenditures of the operating subsidiaries of the Company are denominated in US Dollars, which indirectly represents a natural hedge on exposure to the fluctuation in foreign exchange rates.
However, the Group is exposed to foreign exchange risk arising from Rupiah dividend payments to the shareholders and other operation expenses. Management has set up a policy to require group companies to manage their foreign exchange risk against their functional currency. To manage their foreign exchange risk, the Group use forward contracts, transacted only with reputable financial institutions.
(ii) Price risk
The Group faces commodity price risk because coal is a commodity product traded in the world coal markets. Prices for Adaro’s coal (“Envirocoal”) are based on global coal prices, which tend to be highly cyclical and subject to significant fluctuations. As a commodity product, global coal prices are principally dependent on the supply and demand dynamics of coal in the world export market. The Group did not engage in spot coal trading and has not entered into longterm coal pricing agreements to hedge its exposure to fluctuations in the coal price but may do so in the future. Instead, the Group entered into oneyear fixed price coal contracts with some of its customers to safeguard a portion of its revenue for each year.
The Group also faces commodity price risk relating to purchases of fuel necessary to run its coal mining operations. The Group enters into fuel hedge contracts to hedge against the fluctuation in fuel prices for part of the estimated annual fuel usage. Besides this, for mining services provided to its customers, to manage the price risk, the Group entered into longterm contracts with its customers (maximum five years) which also allows price adjustments when the fuel price increases.
* As restated (refer to Note 3)
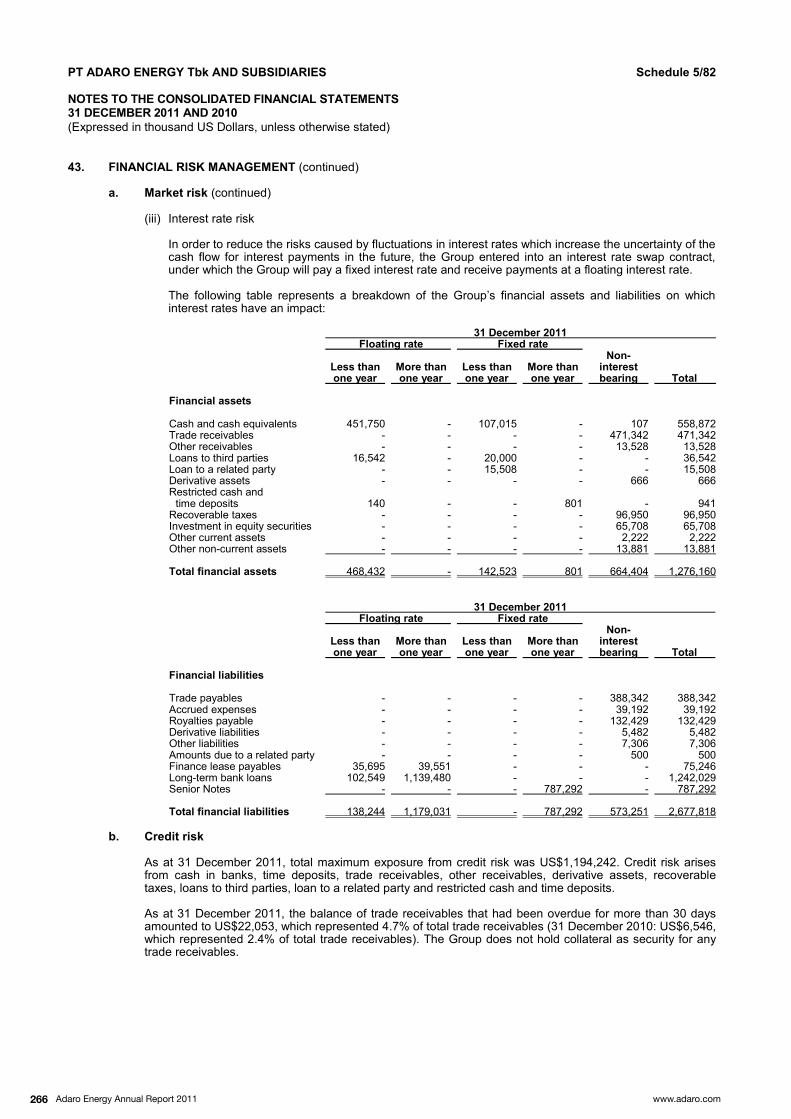
Adaro Energy Annual Report 2011 www.adaro.com266
(Expressed in thousand US Dollars, unless otherwise stated)
(continued)
(continued)
(iii) Interest rate risk
In order to reduce the risks caused by fluctuations in interest rates which increase the uncertainty of the cash flow for interest payments in the future, the Group entered into an interest rate swap contract, under which the Group will pay a fixed interest rate and receive payments at a floating interest rate. The following table represents a breakdown of the Group’s financial assets and liabilities on which interest rates have an impact:
Cash and cash equivalents 451,750 107,015 107 558,872 Trade receivables 471,342 471,342 Other receivables 13,528 13,528 Loans to third parties 16,542 20,000 36,542 Loan to a related party 15,508 15,508 Derivative assets 666 666 Restricted cash and time deposits 140 801 941 Recoverable taxes 96,950 96,950 Investment in equity securities 65,708 65,708 Other current assets 2,222 2,222 Other noncurrent assets 13,881 13,881 468,432 142,523 801 664,404 1,276,160 Trade payables 388,342 388,342 Accrued expenses 39,192 39,192 Royalties payable 132,429 132,429 Derivative liabilities 5,482 5,482 Other liabilities 7,306 7,306 Amounts due to a related party 500 500 Finance lease payables 35,695 39,551 75,246 Longterm bank loans 102,549 1,139,480 1,242,029 Senior Notes 787,292 787,292 138,244 1,179,031 787,292 573,251 2,677,818
As at 31 December 2011, total maximum exposure from credit risk was US$1,194,242. Credit risk arises from cash in banks, time deposits, trade receivables, other receivables, derivative assets, recoverable taxes, loans to third parties, loan to a related party and restricted cash and time deposits. As at 31 December 2011, the balance of trade receivables that had been overdue for more than 30 days amounted to US$22,053, which represented 4.7% of total trade receivables (31 December 2010: US$6,546, which represented 2.4% of total trade receivables). The Group does not hold collateral as security for any trade receivables.
(Expressed in thousand US Dollars, unless otherwise stated)
(continued)
(continued)
Management is confident in its ability to continue to control and maintain minimal exposure to credit risk, since the Group has clear policies on the selection of customers, legally binding agreements in place for coal sales transactions and mining services and other services rendered and historically low levels of bad debts. The Group’s general policies for coal sales and rendering services to new and existing customers are as follows: Selecting customers (mostly blue chip power plant companies) with a strong financial condition and a
good reputation. Acceptance of new customers and sales of coal and rendering service are approved by authorised
personnel according to the Group’s delegation of authority policy.
Liquidity risk is defined as a risk that arises in situations where the cash inflow from shortterm revenue is not enough to cover the cash outflow of shortterm expenditure. To manage its liquidity risk, the Group monitors its level of cash and cash equivalents and maintains these at a level deemed adequate to finance the Group's operational activities and to mitigate the effect of fluctuation in cash flows. The Group's management also regularly monitor projected and actual cash flows, including their loan maturity profiles and continuously assess the financial markets for opportunities to raise funds. In addition, the Group has a standby loan facility which can be withdrawn upon request to fund its operations when needed.
Fair value is the amount for which an asset could be exchanged or liability settled between knowledgeable and willing parties in an arm's length transaction. The table below describes the carrying amounts and fair value of financial assets and liabilities that are not presented by the Group at fair value:
Finance lease payables 75,246 74,575 Longterm bank loans 1,242,029 1,256,165 Senior Notes 787,292 878,184
The fair value of finance lease payables and longterm bank loans is measured using discounted cash flows based on the interest rate on the latest finance lease payable and the latest bank loan facility entered by the Group. The fair value of Senior Notes is estimated using the quoted market price as at 31 December 2011. The carrying amount of other financial assets and liabilities are approximate to their fair values because of the shortterm nature of the financial instruments.
In managing capital, the Group safeguards its ability to continue as a going concern and to maximise benefits to the shareholders and other stakeholders. The Group actively and regularly reviews and manages its capital to ensure the optimal capital structure and return to the shareholders, taking into consideration the efficiency of capital use based on operating cash flows and capital expenditures and also consideration of future capital needs. The Group also seeks to maintain a balance between the level of borrowings and equity position to ensure the optimal capital structure and return. There were no changes in the Group’s approach to capital management during the year.

Adaro Energy Annual Report 2011www.adaro.com 267
(Expressed in thousand US Dollars, unless otherwise stated)
(continued)
(continued)
(iii) Interest rate risk
In order to reduce the risks caused by fluctuations in interest rates which increase the uncertainty of the cash flow for interest payments in the future, the Group entered into an interest rate swap contract, under which the Group will pay a fixed interest rate and receive payments at a floating interest rate. The following table represents a breakdown of the Group’s financial assets and liabilities on which interest rates have an impact:
Cash and cash equivalents 451,750 107,015 107 558,872 Trade receivables 471,342 471,342 Other receivables 13,528 13,528 Loans to third parties 16,542 20,000 36,542 Loan to a related party 15,508 15,508 Derivative assets 666 666 Restricted cash and time deposits 140 801 941 Recoverable taxes 96,950 96,950 Investment in equity securities 65,708 65,708 Other current assets 2,222 2,222 Other noncurrent assets 13,881 13,881 468,432 142,523 801 664,404 1,276,160 Trade payables 388,342 388,342 Accrued expenses 39,192 39,192 Royalties payable 132,429 132,429 Derivative liabilities 5,482 5,482 Other liabilities 7,306 7,306 Amounts due to a related party 500 500 Finance lease payables 35,695 39,551 75,246 Longterm bank loans 102,549 1,139,480 1,242,029 Senior Notes 787,292 787,292 138,244 1,179,031 787,292 573,251 2,677,818
As at 31 December 2011, total maximum exposure from credit risk was US$1,194,242. Credit risk arises from cash in banks, time deposits, trade receivables, other receivables, derivative assets, recoverable taxes, loans to third parties, loan to a related party and restricted cash and time deposits. As at 31 December 2011, the balance of trade receivables that had been overdue for more than 30 days amounted to US$22,053, which represented 4.7% of total trade receivables (31 December 2010: US$6,546, which represented 2.4% of total trade receivables). The Group does not hold collateral as security for any trade receivables.
(Expressed in thousand US Dollars, unless otherwise stated)
(continued)
(continued)
Management is confident in its ability to continue to control and maintain minimal exposure to credit risk, since the Group has clear policies on the selection of customers, legally binding agreements in place for coal sales transactions and mining services and other services rendered and historically low levels of bad debts. The Group’s general policies for coal sales and rendering services to new and existing customers are as follows: Selecting customers (mostly blue chip power plant companies) with a strong financial condition and a
good reputation. Acceptance of new customers and sales of coal and rendering service are approved by authorised
personnel according to the Group’s delegation of authority policy.
Liquidity risk is defined as a risk that arises in situations where the cash inflow from shortterm revenue is not enough to cover the cash outflow of shortterm expenditure. To manage its liquidity risk, the Group monitors its level of cash and cash equivalents and maintains these at a level deemed adequate to finance the Group's operational activities and to mitigate the effect of fluctuation in cash flows. The Group's management also regularly monitor projected and actual cash flows, including their loan maturity profiles and continuously assess the financial markets for opportunities to raise funds. In addition, the Group has a standby loan facility which can be withdrawn upon request to fund its operations when needed.
Fair value is the amount for which an asset could be exchanged or liability settled between knowledgeable and willing parties in an arm's length transaction. The table below describes the carrying amounts and fair value of financial assets and liabilities that are not presented by the Group at fair value:
Finance lease payables 75,246 74,575 Longterm bank loans 1,242,029 1,256,165 Senior Notes 787,292 878,184
The fair value of finance lease payables and longterm bank loans is measured using discounted cash flows based on the interest rate on the latest finance lease payable and the latest bank loan facility entered by the Group. The fair value of Senior Notes is estimated using the quoted market price as at 31 December 2011. The carrying amount of other financial assets and liabilities are approximate to their fair values because of the shortterm nature of the financial instruments.
In managing capital, the Group safeguards its ability to continue as a going concern and to maximise benefits to the shareholders and other stakeholders. The Group actively and regularly reviews and manages its capital to ensure the optimal capital structure and return to the shareholders, taking into consideration the efficiency of capital use based on operating cash flows and capital expenditures and also consideration of future capital needs. The Group also seeks to maintain a balance between the level of borrowings and equity position to ensure the optimal capital structure and return. There were no changes in the Group’s approach to capital management during the year.

Adaro Energy Annual Report 2011 www.adaro.com268
(Expressed in thousand US Dollars, unless otherwise stated)
On 12 March 2012, AMT and PT Industri Terminal Batubara (“ITB”) signed sales and purchase agreement and share transfer deeds, whereby AMT will purchase 48.98% interest in AEI from ITB for Rp 2.1 billion.

Adaro Energy Annual Report 2011www.adaro.com 269
(Expressed in thousand US Dollars, unless otherwise stated)
On 12 March 2012, AMT and PT Industri Terminal Batubara (“ITB”) signed sales and purchase agreement and share transfer deeds, whereby AMT will purchase 48.98% interest in AEI from ITB for Rp 2.1 billion.
Corporate Identity
Name of CorporationPT Adaro Energy Tbk
FoundedJuly 28, 2004
Authorized CapitalRp 8,000 billion
Issued and Fully Paid CapitalRp 3,198.60 billion
OwnershipPT Adaro Strategic Investments 43.91%Garibaldi Thohir 6.15%Public* 49.94%
*includes the remaining ownership held by key shareholders.
Line of BusinessIntegrated coal mining through subsidiaries
AddressJl. H.R. Rasuna Said, Blok X-5, Kav. 1-2Jakarta 12950IndonesiaTel.: 6221 – 5211265Fax.: 6221 – 57944687Email: [email protected]
For more information please visit our website www.adaro.com
A Snapshot of Adaro Energy
From Us to You
Running Adaro
Management Report
Owning Adaro
Governing Adaro
Financial Report
Additional Information
1
2
3
4
5
6
7
8
04
26
35
68
144
152
164
269
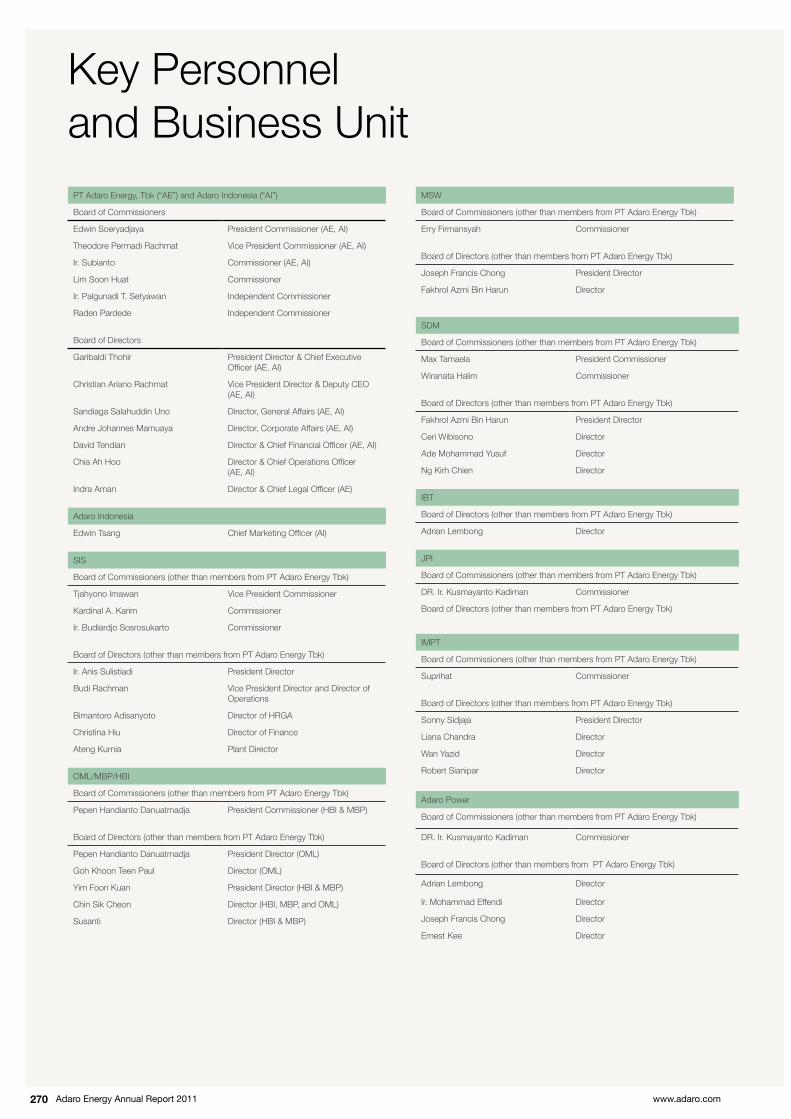
Adaro Energy Annual Report 2011 www.adaro.com270
Key Personnel and Business Unit
PT Adaro Energy, Tbk (“AE”) and Adaro Indonesia (“AI”)
Board of Commissioners
Edwin Soeryadjaya President Commissioner (AE, AI)
Theodore Permadi Rachmat Vice President Commissioner (AE, AI)
Ir. Subianto Commissioner (AE, AI)
Lim Soon Huat Commissioner
Ir. Palgunadi T. Setyawan Independent Commissioner
Raden Pardede Independent Commissioner
Board of Directors
Garibaldi Thohir President Director & Chief Executive Officer (AE, AI)
Christian Ariano Rachmat Vice President Director & Deputy CEO (AE, AI)
Sandiaga Salahuddin Uno Director, General Affairs (AE, AI)
Andre Johannes Mamuaya Director, Corporate Affairs (AE, AI)
David Tendian Director & Chief Financial Officer (AE, AI)
Chia Ah Hoo Director & Chief Operations Officer (AE, AI)
Indra Aman Director & Chief Legal Officer (AE)
Adaro Indonesia
Edwin Tsang Chief Marketing Officer (AI)
SIS
Board of Commissioners (other than members from PT Adaro Energy Tbk)
Tjahyono Imawan Vice President Commissioner
Kardinal A. Karim Commissioner
Ir. Budiardjo Sosrosukarto Commissioner
Board of Directors (other than members from PT Adaro Energy Tbk)
Ir. Anis Sulistiadi President Director
Budi Rachman Vice President Director and Director of Operations
Bimantoro Adisanyoto Director of HRGA
Christina Hiu Director of Finance
Ateng Kurnia Plant Director
OML/MBP/HBI
Board of Commissioners (other than members from PT Adaro Energy Tbk)
Pepen Handianto Danuatmadja President Commissioner (HBI & MBP)
Board of Directors (other than members from PT Adaro Energy Tbk)
Pepen Handianto Danuatmadja President Director (OML)
Goh Khoon Teen Paul Director (OML)
Yim Foon Kuan President Director (HBI & MBP)
Chin Sik Cheon Director (HBI, MBP, and OML)
Susanti Director (HBI & MBP)
MSW
Board of Commissioners (other than members from PT Adaro Energy Tbk)
Erry Firmansyah Commissioner
Board of Directors (other than members from PT Adaro Energy Tbk)
Joseph Francis Chong President Director
Fakhrol Azmi Bin Harun Director
SDM
Board of Commissioners (other than members from PT Adaro Energy Tbk)
Max Tamaela President Commissioner
Wiranata Halim Commissioner
Board of Directors (other than members from PT Adaro Energy Tbk)
Fakhrol Azmi Bin Harun President Director
Ceri Wibisono Director
Ade Mohammad Yusuf Director
Ng Kirh Chien Director
IBT
Board of Directors (other than members from PT Adaro Energy Tbk)
Adrian Lembong Director
JPI
Board of Commissioners (other than members from PT Adaro Energy Tbk)
DR. Ir. Kusmayanto Kadiman Commissioner
Board of Directors (other than members from PT Adaro Energy Tbk)
IMPT
Board of Commissioners (other than members from PT Adaro Energy Tbk)
Suprihat Commissioner
Board of Directors (other than members from PT Adaro Energy Tbk)
Sonny Sidjaja President Director
Liana Chandra Director
Wan Yazid Director
Robert Sianipar Director
Adaro Power
Board of Commissioners (other than members from PT Adaro Energy Tbk)
DR. Ir. Kusmayanto Kadiman Commissioner
Board of Directors (other than members from PT Adaro Energy Tbk)
Adrian Lembong Director
Ir. Mohammad Effendi Director
Joseph Francis Chong Director
Ernest Kee Director

Adaro Energy Annual Report 2011www.adaro.com 271
Mustika Indah Permai
Board of Commissioners (other than members from PT Adaro Energy Tbk)
Hasim Sutiono Commissioner
Board of Directors (other than members from PT Adaro Energy Tbk)
Ariya Somanatta Director
Andri Wijono Sutiono Director
Freddy Hartono Director
Servo Meda Sejahtera
Board of Commissioners (other than members from PT Adaro Energy Tbk)
Setiawan Herlianto Saputro Commissioner
Fajar Surya Bayuaji Commissioner
Syahrul Commissioner
Board of Directors (other than members from PT Adaro Energy Tbk)
Fitrot Agung Pribadi President Director
Hendra Hartono Santoso Director
Julius Edy Wibowo Director
Muliawati Pahala Guptha Director
Togam Gultom Director
Ng Kirh Chien Director
Adaro Persada Mandiri
Board of Directors (other than members from PT Adaro Energy Tbk)
Ari Hariadi Director
Luckman Director
Bukit Enim Energi
Board of Commissioners (other than members from PT Adaro Energy Tbk)
Ellyus Achiruddin Commissioner
Eldy Ellyus Commissioner
Board of Directors (other than members from PT Adaro Energy Tbk)
Octavianus Achiruddin Director
H. Karman Hadinata MD Director
Coaltrade Services International
Board of Directors (other than members from PT Adaro Energy Tbk)
Edwin Tsang Director
Chong Siong Siang Peter Director

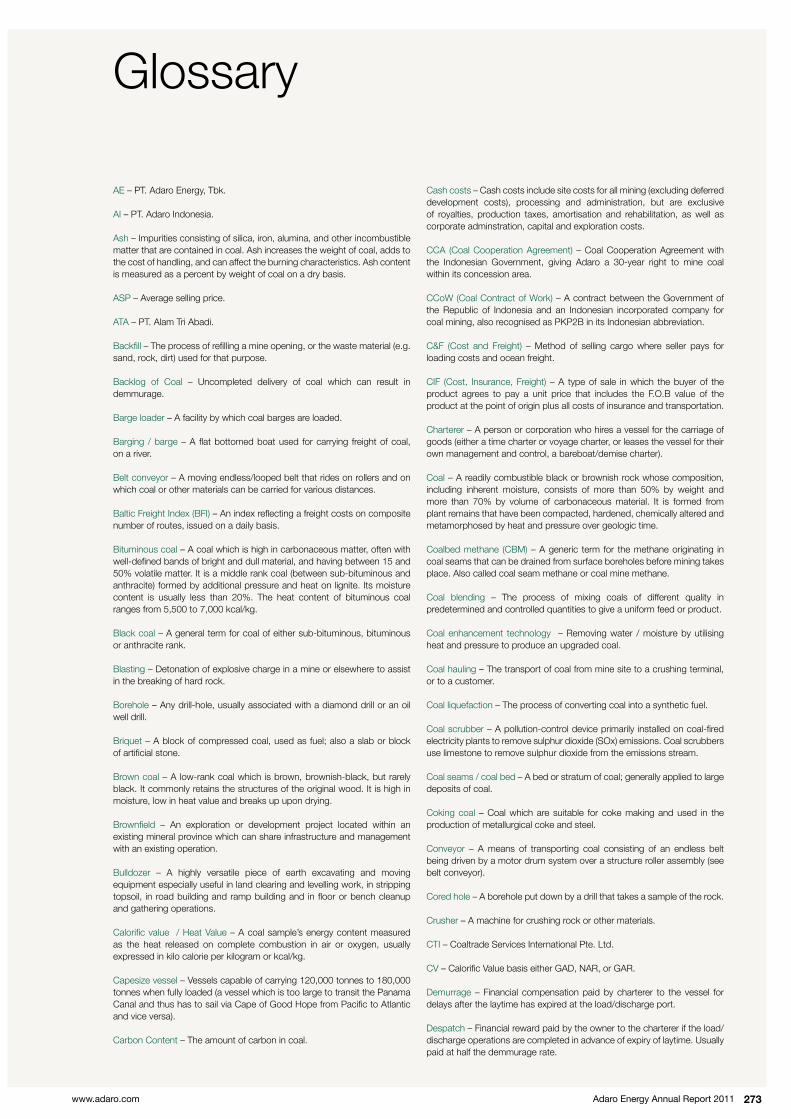
Adaro Energy Annual Report 2011www.adaro.com 273
Management’s Responsibilityfor Annual Report
Ir. SubiantoCommissioner
Sandiaga Salahuddin UnoDirector, General Affairs
Dr. Ir. Raden PardedeIndependent Commissioner
Chia Ah HooDirector & Chief Operations Officer
Glossary
AE – PT. Adaro Energy, Tbk.
AI – PT. Adaro Indonesia.
Ash – Impurities consisting of silica, iron, alumina, and other incombustible matter that are contained in coal. Ash increases the weight of coal, adds to the cost of handling, and can affect the burning characteristics. Ash content is measured as a percent by weight of coal on a dry basis.
ASP – Average selling price.
ATA – PT. Alam Tri Abadi.
Backfill – The process of refilling a mine opening, or the waste material (e.g. sand, rock, dirt) used for that purpose.
Backlog of Coal – Uncompleted delivery of coal which can result in demmurage.
Barge loader – A facility by which coal barges are loaded.
Barging / barge – A flat bottomed boat used for carrying freight of coal, on a river.
Belt conveyor – A moving endless/looped belt that rides on rollers and on which coal or other materials can be carried for various distances.
Baltic Freight Index (BFI) – An index reflecting a freight costs on composite number of routes, issued on a daily basis.
Bituminous coal – A coal which is high in carbonaceous matter, often with well-defined bands of bright and dull material, and having between 15 and 50% volatile matter. It is a middle rank coal (between sub-bituminous and anthracite) formed by additional pressure and heat on lignite. Its moisture content is usually less than 20%. The heat content of bituminous coal ranges from 5,500 to 7,000 kcal/kg.
Black coal – A general term for coal of either sub-bituminous, bituminous or anthracite rank.
Blasting – Detonation of explosive charge in a mine or elsewhere to assist in the breaking of hard rock.
Borehole – Any drill-hole, usually associated with a diamond drill or an oil well drill.
Briquet – A block of compressed coal, used as fuel; also a slab or block of artificial stone.
Brown coal – A low-rank coal which is brown, brownish-black, but rarely black. It commonly retains the structures of the original wood. It is high in moisture, low in heat value and breaks up upon drying.
Brownfield – An exploration or development project located within an existing mineral province which can share infrastructure and management with an existing operation.
Bulldozer – A highly versatile piece of earth excavating and moving equipment especially useful in land clearing and levelling work, in stripping topsoil, in road building and ramp building and in floor or bench cleanup and gathering operations.
Calorific value / Heat Value – A coal sample’s energy content measured as the heat released on complete combustion in air or oxygen, usually expressed in kilo calorie per kilogram or kcal/kg.
Capesize vessel – Vessels capable of carrying 120,000 tonnes to 180,000 tonnes when fully loaded (a vessel which is too large to transit the Panama Canal and thus has to sail via Cape of Good Hope from Pacific to Atlantic and vice versa).
Carbon Content – The amount of carbon in coal.
Cash costs – Cash costs include site costs for all mining (excluding deferred development costs), processing and administration, but are exclusive of royalties, production taxes, amortisation and rehabilitation, as well as corporate adminstration, capital and exploration costs.
CCA (Coal Cooperation Agreement) – Coal Cooperation Agreement with the Indonesian Government, giving Adaro a 30-year right to mine coal within its concession area.
CCoW (Coal Contract of Work) – A contract between the Government of the Republic of Indonesia and an Indonesian incorporated company for coal mining, also recognised as PKP2B in its Indonesian abbreviation.
C&F (Cost and Freight) – Method of selling cargo where seller pays for loading costs and ocean freight.
CIF (Cost, Insurance, Freight) – A type of sale in which the buyer of the product agrees to pay a unit price that includes the F.O.B value of the product at the point of origin plus all costs of insurance and transportation.
Charterer – A person or corporation who hires a vessel for the carriage of goods (either a time charter or voyage charter, or leases the vessel for their own management and control, a bareboat/demise charter).
Coal – A readily combustible black or brownish rock whose composition, including inherent moisture, consists of more than 50% by weight and more than 70% by volume of carbonaceous material. It is formed from plant remains that have been compacted, hardened, chemically altered and metamorphosed by heat and pressure over geologic time.
Coalbed methane (CBM) – A generic term for the methane originating in coal seams that can be drained from surface boreholes before mining takes place. Also called coal seam methane or coal mine methane.
Coal blending – The process of mixing coals of different quality in predetermined and controlled quantities to give a uniform feed or product.
Coal enhancement technology – Removing water / moisture by utilising heat and pressure to produce an upgraded coal.
Coal hauling – The transport of coal from mine site to a crushing terminal, or to a customer.
Coal liquefaction – The process of converting coal into a synthetic fuel.
Coal scrubber – A pollution-control device primarily installed on coal-fired electricity plants to remove sulphur dioxide (SOx) emissions. Coal scrubbers use limestone to remove sulphur dioxide from the emissions stream.
Coal seams / coal bed – A bed or stratum of coal; generally applied to large deposits of coal.
Coking coal – Coal which are suitable for coke making and used in the production of metallurgical coke and steel.
Conveyor – A means of transporting coal consisting of an endless belt being driven by a motor drum system over a structure roller assembly (see belt conveyor).
Cored hole – A borehole put down by a drill that takes a sample of the rock.
Crusher – A machine for crushing rock or other materials.
CTI – Coaltrade Services International Pte. Ltd.
CV – Calorific Value basis either GAD, NAR, or GAR.
Demurrage – Financial compensation paid by charterer to the vessel for delays after the laytime has expired at the load/discharge port.
Despatch – Financial reward paid by the owner to the charterer if the load/discharge operations are completed in advance of expiry of laytime. Usually paid at half the demmurage rate.

Adaro Energy Annual Report 2011 www.adaro.com274
Dewater – To remove water.
Dip – The grade of the coal seam. It is usually expressed as I in X in a certain direction.
Dredging – Excavation activity or operation usually carried out at least partly underwater, in shallow seas or fresh water areas with the purpose of gathering up bottom sediments and disposing of them at a different location.
Drill – Any cutting tool or form of apparatus using energy in any one of several forms to produce a circular hole in rock, metal, wood, or other material.
Drilling rig – A steel structure mounted over a borehole to support the drill pipe and other equipment that is lowered and raised during drilling operations.
Dry coal – Coal which has no moisture associated with the sample.
EPC – Engineering, Procurement and Construction.
Envirocoal – Trademark of Adaro’s coal which is environmentally friendly, with low sulphur content of 0.1%, ash content between 1-2%, and a nitrogen level of 0.9%. Because of the ultra low levels of these pollutants, Envirocoal can be burned in power stations without any emissions control equipment and still meet stringent international emission standards.
Excavator/shovel/wheel Loader – Equipment used for loading soil/coal onto the hauling equipment.
Exploitation – The process of economic recovery or removal of the developed mineral body.
Exploration - The search for mineral deposits and the work done to prove or establish the extent of a mineral deposit.
Free On Board (FOB) – This is the price paid for coal at the mining operation site. It excludes freight or shipping and insurance costs.
Floating crane – A vessel that is specialized in lifting heavy loads. The floating crane transships coal from barges on to ships which then transport it to power stations or other customers.
Floating Loading Facility (FLF) – Also known as floating transhipper. It uses two cranes and a conveyor system to achieve a high loading rate.
Flue gas desulphurization – Technology used for removing sulphur dioxide (SO2) from the exhaust flue gases in power plants that burn coal or oil to produce steam for the steam turbines that drive their electricity generators.
Force majeure – Circumstances beyond reasonable control of the parties. Typically, force majeure clauses cover natural disasters or other ‘Act of God’, or war.
Formation – A large body of rock characterized by homogenity of its composition and texture.
Gad – Gross air dried.
Gar – Gross as received.
Geared vessel - A ship with on board cranes.
Gearless – A ship without means on board for the loading/unloading of cargo.
Geological – The science that deals with the earth’s physical structure and substance, its history, and the processes that act on it.
Geotechnical – The branch of civil engineering concerned with the study and modification of soil and rocks.
Geothermal energy – Energy generated by converting hot water or steam from deep beneath the Earth’s surface into electricity.
GlobalCOAL – A global marketplace facilitator for trading coal and coal related services, information and instruments. GlobalCOAL defined a range of standardised coal quality specifications, which was imbedded in its Standard Coal Trading Agreement. It developed an online trading platform which enables market participants to trade standardised coal contracts. It also created a methodology for coal price index calculation, which led to the establishment of the NEWC Index as the leading benchmark for coal price in Asia-Pacific.
Grabs – A mechanical device for clutching, lifting and moving things, esp. materials in bulk.
Greenfield – The development or exploration located outside the area of influence of existing mine operations/infrastructure.
Handymax – Inexact term, but normally taken to mean a vessel of about 40-60,000 dwt.
Handysize – Inexact term, but normally taken to mean a vessel of about 10-40,000 dwt.
Hard coking coal – Coals which make hard coke when carbonised in the coke oven.
Haulage – The carrying in trucks of supplies coal and waste.
HBI – PT. Harapan Bahtera Internusa.
Hydrological – The branch of science concerned with the properties of the earth’s water, esp. its movement in relation to land.
IBT – PT. Indonesia Bulk Terminal.
IFC – International Finance Corporation.
Indicated coal resources – Part of coal deposit for which quality and quantity can be estimated with a reasonable level of confidence, as defined in the JORC Code. Indicated Resources have a lower level of geological confidence than that applied to Measured Resources.
Inferred coal resources – Coal in unexplored extensions of the demonstrated resources for which estimates of the quality and size are based on geologic evidence and projection. Quantitative estimates are based largely on broad knowledge of the geologic character of the deposit and for which there are few, if any, samples or measurements. The estimates are based on an assumed continuity or repletion of which there is geologic evidence; this evidence may include comparison with deposits of similar type.
In-situ – Total reserves of coal in a seam. Term used by geologist for coal that exists but is not necessarily mineable.
In-Pit Crusher-Conveyor (IPCC) system – It is an in-pit conveyor and crushing system which transports overburden to the dumping area.
Jetty – A landing stage or small pier at which boats can dock or be moored.
JORC Code – Widely accepted standard for reporting mineral resources and ore reserves established by the Australasian Joint Ore Reserves Committee. This code sets out the principles and guidelines which should be followed in the preparation of an expert report concerning mineral resources and reserves.
JPI – PT. Jasapower Indonesia.
JPU – Japanese Power Utilities.
Adaro Energy Annual Report 2011www.adaro.com 275
Laytime – Refers to the period of time agreed between the parties in the charterparty, during which the owner will make and keep the ship available for loading/discharging without payment additional to the freight.
Lignite – A brownish-black coal in which the alteration of vegetal material has proceeded further than in peat but not so far as sub-bituminous coal.
Loader – A machine for loading coal and rock.
Low-rank coal: Coal that contains 70%-80% carbon, with high moisture content (>35%), and low calorific value (<5100 kcal/kg adb).
LTI – Lost Time Injury. It refers to a work injury disease where the injured party has at least one complete day or shift off work.
LTIFR – Loss Time Injury Frequency Rate. It refers to the number of lost time injuries multiplied by one million divided by the number of manhours worked in the reporting period.
MBP – PT. Maritime Barito Perkasa.
Measured coal resources – Part of the coal deposit for which quality and quantity can be estimated with a high level of confidence, as defined in the JORC Code.
Metallurgical Coal – Coking coal and pulverized coal consumed in making steel.
Methane (CH 4) – A gaseous compound of carbon and hydrogen naturally emitted from coal that can be explosive when mixed with air or oxygen between certain limits, it is the most common gas found in coal mines.
Metric ton – A unit of weight equal to 2,204.6 pounds.
Mine drainage – Refers to drainage from sources related to mining.
Mine-mouth power plant – A coal burning power-generating plant built near a coal mine.
Moisture content: Quantity of water/moisture in coals or other minerals.
MSW – PT. Makmur Sejahtera Wisesa.
Newcastle Coal Price – The price of coal which is coming from Newcastle, Australia. Nitrogen Oxides (NoX) – Formed when nitrogen (N2) combines with oxygen (O2) in the burning of fossil fuels, from the natural degradation of vegetation, and from the use of chemical fertilizers.
OLC – Overland conveyor.
OML – Orchard Maritime Logistics Pte. Ltd.
Open-cut / open-pit – Surface working in which the working area is kept open to the sky.
Open-cut / open-pit mining – A form of operation designed to extract minerals that lie near the surface. Waste, or overburden, is first removed, and the mineral is broken and loaded, as in a stone quarry.
Open hole – A borehole free of any obstructing object or material and from which no core is taken.
Out-Pit Crusher-Conveyor (OPCC) system – It is an out-pit conveyor and crushing system which transports overburden from the edge of the mine to the overburden dumping area.
Overburden – Any material (including layers of dirt and rock) that overlies a deposit of coal. Overburden is removed prior to surface mining and replaced after the coal is taken from the seam.
Overburden ratio – The amount of overburden that must be removed to excavate a given quantity of coal.
Panamax vessel – Vessel capable of carrying between 50,000 tonnes and 80,000 tonnes when fully loaded (technically the maximum size a vessel can transit the Panama Canal – a restriction of 32.2 M beam).
Peat – Peat is a dark brown or black deposit, formed in marshes and swamps from the dead, and partly decomposed remains of the marsh vegetation. It is one of the earliest stages of coal formation.
Pit – Any mine, quarry, or excavation area worked by the open-cut method to obtain material of value.
Proven reserves – As indicated by the JORC Code, it is the economically mine able part of an indicated, and in some circumstances, measured mineral resource demonstrated by at least a preliminary feasibility study. This study must include adequate information on mining, processing, metallurgical, economic, and other relevant factors that demonstrate, at the time of reporting, that economic extraction can be justified.
Probable reserves – Similar to proved reserves, but with lower level of confidence, as the number of intersections of the coal seams by pits trenches and boreholes in the sampling is less than that conducted in arriving at the proved reserves (as defined in the JORC Code).
Ramp – A slope or inclined plane for connecting two different levels, and used for haulage.
Reclamation – The restoration of land and environmental values to a surface mine site after the coal is extracted. Reclamation operations are usually underway as soon as the coal has been removed from a mine site. The process includes restoring the land to its approximate original appearance by restoring topsoil and planting native grasses and ground covers.
Recoverable reserves of coal – An estimate of the amount of coal that can be recovered (mined) from the accessible reserves of teh demonstrated reserve base.
Reserve – The portion of the identified coal resource that can be economically mined with the current technology at the time of determination. Reserve can be divided into Proven Reserve and Probable Reserve.

Adaro Energy Annual Report 2011 www.adaro.com276
Resource – Naturally occuring concentrations or deposits of coal in the Earth’s crust, in such forms and amounts that economic extraction is potentially feasible.
Richards Bay Coal Terminal (RCBT) – A large export coal terminal located in South Africa, with a design capacity of 96 million tonnes per year. Richards Bay coal price refers to the FOB price of coal from South Africa loaded at Richards Bay.
Royalty – The payment of a certain stipulated sum on the mineral produced to the Government / mineral owner under the mineral lease.
Run of Mine (ROM) – Usually the typical quality of coal that is extracted, prior to any act of benefication such as washing, crushing or screening. The term is used loosely and can be applied on a pit by pit basis and is typically also used to refer to the raw stockpile areas – the ROM area.
S – Sulphur can form sulphur dioxide during coal combustion.
Scrubbers – Air pollution control devices used to remove particulate and/or gaseous pollutants from exhaust streams.
SDM – PT. Sarana Daya Mandiri.
Seaborne coal: Coal that is marketed outside the mining area and is transported by sea to the customer.
Seam – Layer or bed (of coal).
Self-propelled barge – Powered waterway vessel which can be used to carry heavy bulk items such as coal.
Semi-soft coal – A type of coking coal that can be blended with a hard coking coal to produce an acceptable hard coke.
Silt – A fine-grained sediment having a particle size intermediate between that of fine sand and clay.
SIS – PT. Saptaindra Sejati.
Soft coking coal – Coals which make soft or weak coke when coked alone in a coke oven.
Steaming Coal – Coal used to provide heat for steam raising as part of the electricity generation or industrial process.
Strata / Stratum – A layer or a series of layers of rock in the ground.
Stratigraphy – The branch of geology concerned with the order and relative position of strata and their relationship to the geological time scale. It is also the analysis of the order and position of layers of archaeological remains.
Stripping – Removal of vegetation and topsoil.
Stripping Costs – Costs associated with overburden removal.
Stripping Ratio – The amount of overburden that must be removed to gain access to a unit amount of coal.
Sub-bituminous coal – A black coal that ranks between lignite and bituminous coal with moisture content between 20% and 40% of inherent moisture by weight, and heat content ranging between 4,000 and 5,500 kcal/kg.
Sulphur – One of the elements present in varying quantities in coal that contributes to environmental degradation when coal is burned. EIA classifies coal, in terms of pounds of sulphur per million Btu as low (less than or equal to 0.60 pounds of sulphur), medium (between 0.61 and 1.67 pounds of sulphur), and high (greater than or equal to 1.68 pounds of sulphur). When coal is sampled, sulphur content is measured as a percent by weight of coal on an “as received” or “dry” (moisture-free) basis.
Supercritical Power Plant – A supercritical power plant is a thermal electricity generating station that uses steam at extremely high temperature and pressure to generate electricity with improved efficiency. Above 374°C and 22.064 Mpa (the “critical” point of water), water simply exists as super-heated steam, which can be used to drive the turbines of a generator more efficiently than steam at a lower subcritical temperature.
Surface mine – A mine in which the coal lies near the surface and can be extracted by removing the covering layers of rock and soil.
Quarry – An open pit from which stones, rocks and other materials are excavated
Thermal Coal – Coal that is used for the generation of heat for steam raising in power stations and other general industry application. These coals generally do not exhibit any coking properties and therefore would not make coke in a conventional coke oven.
Transhipment – Transfer of coal from one ship to another.
Topographic - Relating to the arrangement or accurate representation of the physical features of an area.
Value Added Tax (VAT) – Tax levied on the difference between a commodity’s price before taxes and its cost of production.
Volatile Matter – Those products, exclusive of moisture, given off by a material as gas or vapour. It is the percentage of coal which is lost as volatile matter (gases) when coal is incinerated using standard conditions.

381 MEmpire StateBuilding, NY,USA
828 MBurj Khalifa,Dubai UAE
16,000 MAdaro’sTower OfSedimentation
10,668 MThe AverageAltitude OfA Mid-LongDistance Flight
8,848 MElevation OfMount Everest
51,000 MTop Of TheStratoshphere
60,465 MAdaro’s Tower OfOverburden
Volume of Adaro’s Overburden and Sedimentation Removal in 2011
Through careful planning, engineering and execution we have developed our mine to become the largest single coal mine in the southern hemisphere. This has all been done with careful consideration for the local communities and the environment in which we operate. With this comparison, you can see the huge amount of overburden we had to move in 2011.
With Base Area The Size of a Football Field

PT Adaro Energy, Tbk.Menara Karya 23rd FloorJl. H.R. Rasuna Said Blok X-Kav. 1-2 Jakarta 12950IndonesiaTel. +62-21 5211265Fax. +62-21 57944687www.adaro.comIDX: ADRO
Annual Report 2011
TOP NEWS With more than 20 years of uninterrupted production growth, we have become the largest single site coal mine in the southern hemisphere.
FINANCIAL HIGHLIGHT Adaro Energy’s net income increased 124% to US$552 million in 2011
EDITOR’S TOP READ Exclusive interviews with Adaro Energy’s Board of Directors
FACT Adaro Energy made a record contribution to nation building, incurring corporate income tax of US$450.5 million and royalties of US$405.4 million
UNBEATABLE INSIGHTS 12 reasons why you should consider investing in Adaro Energy