creating and using title i, part d, data report cards nicholas read, ndtac special thanks to natalia...
TRANSCRIPT

Creating and Using Title I, Part D, Data Report Cards
Nicholas Read, NDTACSpecial thanks to Natalia Pane and Patrick Kelly of AIR for their work on an earlier presentation on
Report Card development.

Why Use Report Cards?
• Accountability
• Program improvement
• Inform and advocate for program

• A report card is a concise presentation of data and other information about a school or program that assesses performance.
• The focus on evaluating performance is what makes
report cards a unique type of accountability report.
What Is a Report Card?

What Makes a Good Report Card?
• Focuses on outcomes (minimal demographics, etc.)
• Provides comparisons
– Across time (e.g., 3 years of data)
– Average of other sites (e.g., statewide average)
– Benchmark sites (e.g., model site)
– Average of comparison sites (e.g., large metro area average)
• Uses graphs that speak for themselves

Bad Report Cards
• Have no evaluative (good/bad) component
• Provide no comparisons or context
• Focus on counts and demographics
• Do not support program improvement

Five Steps to Creating a Report Card
1. Define purpose and audience
2. Select measures
3. Select evaluative criteria or rubric
4. Design and format
5. Disseminate and promote program improvement

Step 1. Define Purpose and Audience
• For whom will you be doing this report card?– Your State agency
– State legislature
– Governor
– Your facilities/programs
– You
• For what purpose(s)?– Accountability
– Program improvement
– Information and advocacy for program

Note About State vs. Program
• State level
– Statewide averages, but may highlight top programs
– Comparisons are to other states or national averages
• Program or facility level
– Program or facility averages, but may highlight classrooms
– Comparisons are to other programs/facilities or statewide averages

Step 2. Select Measures
• Select measures based on the questions from your target audience:– Legislature: Am I getting a return on investment?
– Program/facility: How are we doing relative to our peers?
– State program office: How are we doing compared to other States?
• Put the answers on the cover!

Education-Related Report Card Measures
• High school diploma
• GED
• Core credits earned
• Improvement of reading tests
• Improvement on math tests
• Entry into postsecondary education
• Employment

Other Possible Measures
• Student counts, length of stay
• Number of students receiving different types of support services (linked to numbers of need)
• Teacher qualifications
• Any measure you think is important to your audience!

If You Use Demographic Measures
Make more interesting…show ethnicity by:
– Outcome
Are some sites producing better outcomes for different groups of students than others?
– Length of stay and outcomes
Are certain populations staying longer and have a greater chance to attain outcomes? How do they do compare to similar students who go back home?
– Change in proportion and outcomes
Are sites with increased populations of girls showing more improvement in academic outcomes?
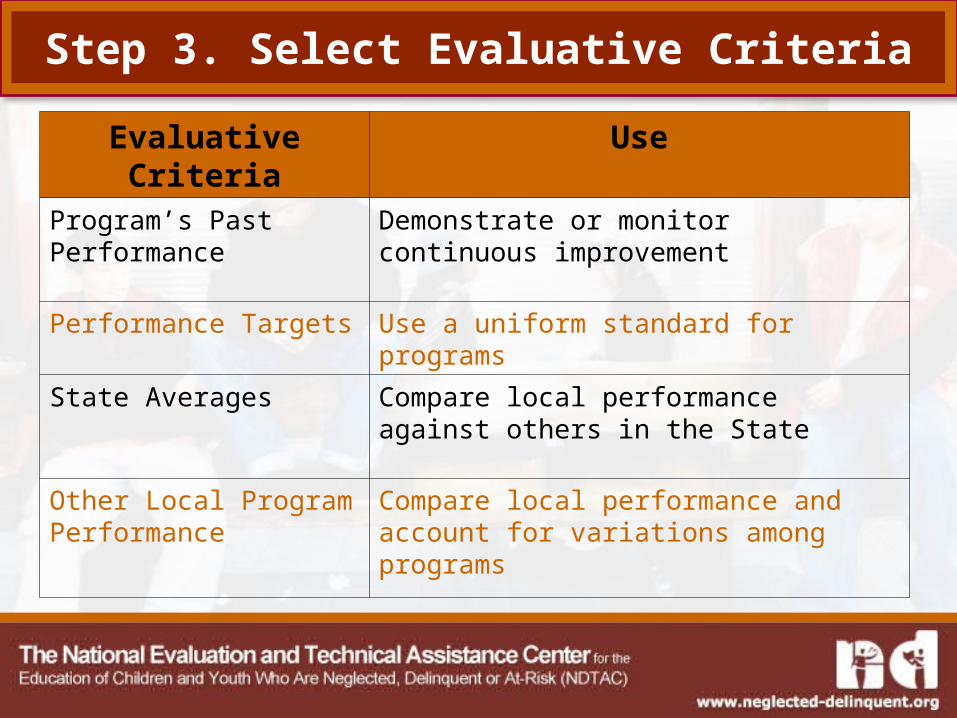
Step 3. Select Evaluative Criteria
Evaluative Criteria
Use
Program’s Past Performance
Demonstrate or monitor continuous improvement
Performance Targets Use a uniform standard for programs
State Averages Compare local performance against others in the State
Other Local Program Performance
Compare local performance and account for variations among programs

But What Is Good vs. Great?
To classify how good or bad something is, you may need a rubric. For example:
AExemplary
B Meets Standard
C Below Standard
FUnacceptable
Core Measures
% ↑ Reading >90% 80%–90% 70%–80 % <70%
% ↑ Math >90% 80%–90% 70%–80 % <70%
% GED/High School Diploma
>35% 30%–35% 20%–30% <20%

Step 4. Design the Card
• Use our templates
• Ask us for new templates
• Develop your own templates, but keep in mind…

10 Things To Remember About Data Displays
1. Compare; do not present just one group or one element.
2. Don’t exaggerate; you will lose the trust of your audience.
3. Use design elements that directly relate to your point; avoid using purely decorative elements.
4. Add only important details (e.g., exceptions to the data); exclude unnecessary details.
5. Avoid legends whenever possible; label data directly.

Step 5. Disseminate and Improve
• Use report cards as a snapshot of your facility, program, agency, or system to:
– Inform external community, State, and other stakeholders
– Inform the legislature
– Inform potential funders
– Instill accountability and provide training for internal staff
• Provide training to subgrantees and facilities on how to create and use report cards.