creating an early warning system: predictors of dropout in ... · their dropout early warning...
TRANSCRIPT

REL Mid-Atlantic Technical Assistance Brief REL MA 1.2.75-10
Creating an Early Warning System: Predictorsof Dropout in Delaware Prepared by
Kazuaki Uekawa Regional Educational Laboratory Mid-Atlantic
Stacey Merola Regional Educational Laboratory Mid-Atlantic
Felix Fernandez Regional Educational Laboratory Mid-Atlantic
Allan Porowski Regional Educational Laboratory Mid-Atlantic
January 2010

REL Mid-Atlantic Technical Assistance Brief Table of Contents
Table of Contents
Why This Brief? ............................................................................................................................ 1 What indicators are associated with dropping out in Delaware?.................................................. 2 What are the odds of students dropping out based on the key indicators?.................................. 5 What are the optimal cut points for the key indicators?................................................................ 6
High School Cut Points............................................................................................................ 7 Middle School Cut Points ........................................................................................................ 8
How to use the derived cut points...............................................................................................10 Limitations.......................................................................................................................................11 Appendix A: Detailed Description of Methodology ..........................................................................14 Appendix B: Descriptive Statistics...................................................................................................29 Appendix C: Detailed Logistic Regression Results .........................................................................34 Appendix D: Robustness of Cut Points ...........................................................................................37 Appendix E: State-Level Cut Points ................................................................................................38 Appendix F: District-Level Cut Points..............................................................................................43
i
Summary This Technical Brief presents an historical analysis of key indicators of dropout for Delaware students in grades 9-12. Cut points for key risk indicators of high school dropout for the State of Delaware are provided. Using data provided by the Delaware Department of Education (DDOE), relationships between student dropout and several student indicators were empirically evaluated. Three key indicators of dropout were identified:
1. students’ attendance, 2. students’ math course grades, and 3. students’ English language arts (ELA) course grades.
The derived cut points for high school students were: an attendance rate of 88 percent; a z-score (i.e., a transformed score with a mean of 0 and a standard deviation of 1) on math course grades of -0.47; and a z-score on ELA course grades of -0.63. A high school student who falls below any of the above noted cut points can be considered at-risk for dropout. Derived cut points predict current year dropout, therefore the derived cut points for a 9th grade student can be used to predict whether that student will drop out by the end of their ninth grade school year. One limitation of the derived cut points is that they may over identify students as being at-risk than those who will actually dropout, however given the nature of dropout this over-estimation is arguably more preferable than the alternative.
Some methods for developing an early warning system for students at-risk for dropout, and increasing the precision of the cut points, are presented. A brief exercise is also provided in which the three indicators are combined; the results support the general expectation that the greater the number of risk indicators among a group of students, the higher the rate of student dropout in that group. It should be noted that these results apply to students in Delaware and may not apply to other states.
REL Mid-Atlantic Technical Assistance Brief Summary
ii

REL Mid-Atlantic Technical Assistance Brief Why This Brief?
Technical Assistance Brief Why This Brief?
In September of 2009, the Regional Educational Laboratory Mid-Atlantic received a request from the Delaware Department of Education (DDOE) and Delaware’s P-20 Council for assistance in determining indicators of dropout for use in their Dropout Early Warning System. The state of Delaware has a long-standing P-20 Council comprised of multiple subcommittees. One of these, the Delaware Promise Dropout Prevention Sub-Committee, was charged with the development of an Early Warning System.
Early warning systems, which are becoming a popular tool in dropout prevention efforts, identify high-risk students, recognize student trends and patterns associated with high dropout rates, and predict potential dropouts (Heppen & Therriault, 2008). These systems can be used to identify individual students, student clusters, grade levels, and schools most in need of dropout prevention support. By identifying students at greatest risk of dropping out, DDOE, districts and schools can allocate resources in their dropout prevention efforts.
Efforts to create early warning systems have increased in recent years. Recent research has identified risk indicators as early as 9th grade (Heppen & Therriault, 2008). The National High School Center has recognized this trend by creating an early warning system tool that schools can use to organize their data and calculate some of the student risk indicators of dropout (Heppen, O’Cummings, & Therriault, 2008). The State of Colorado included a study of the behavioral warning signals of dropout as a part of the Colorado Statewide Dropout Initiative (MacIcer, Balfanz, & Byrnes, 2009). Other early warning systems are
currently being developed by the National Dropout Prevention Center and the State of Texas through its Texas Ninth Grade Transition and Intervention Program (Smink, 2009; Texas Education Agency, 2010).
The DDOE early warning system, which is under development, is intended to provide “flags” for risk indicators, so the end user can see what type and how many risk indicators are present for each student. The goals of these analyses are to:
� Identify key indicators of middle school and high school dropout in Delaware.
� Establish cut points1 to optimize the predictive capacity of DDOE’s Early Warning System.
� Identify district-specific cut points where possible.
Ultimately, these analyses will provide important student-level cut points for each risk indicator, as well as a deeper understanding of which combinations of risk indicators identify which students are at highest risk of dropping out. These results will then allow decision makers to determine which risk indicators to address with specific interventions. In recognition that risk indicators may differ by district, district specific cut points were also determined for districts with an adequate number of dropouts (i.e., equal to or greater than 30) for analysis. This restriction was imposed in order to ensure a measure of confidence in the results.
1 Cut points are thresholds for specific predictors above or below which individuals are more likely to experience an event or outcome, in this case dropping out of school.
1
REL Mid-Atlantic Technical Assistance Brief Findings
BOX 1
Study Methodology
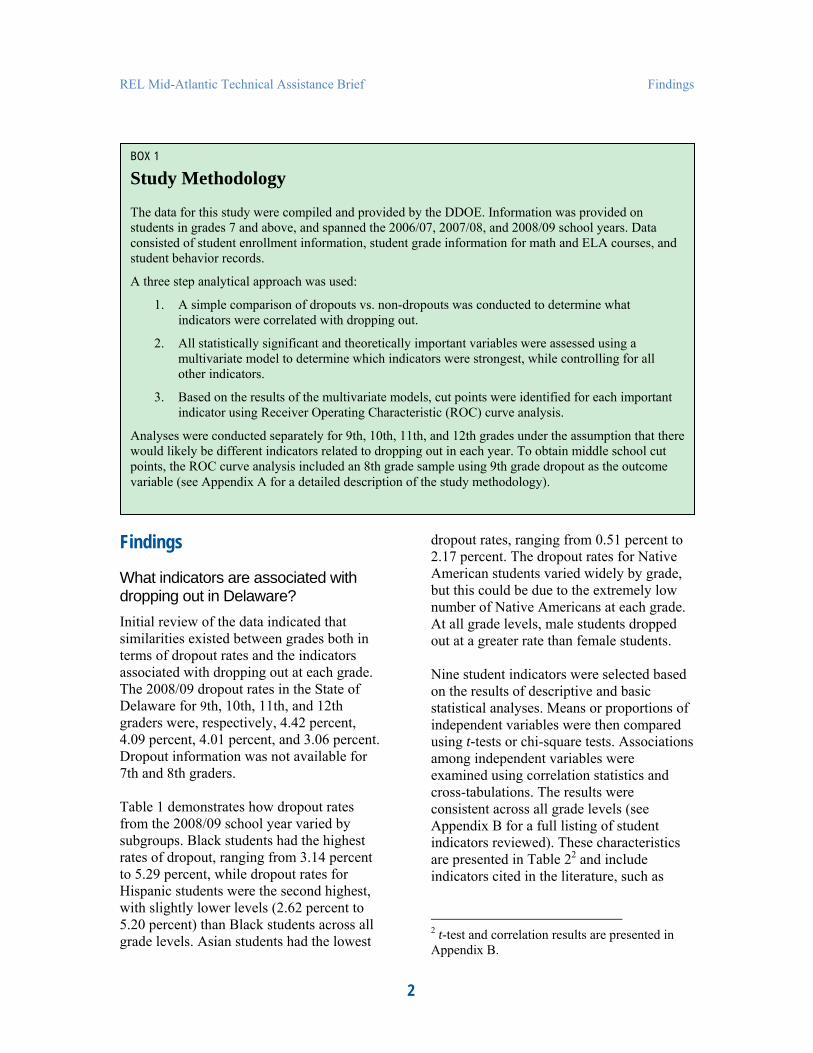
The data for this study were compiled and provided by the DDOE. Information was provided on students in grades 7 and above, and spanned the 2006/07, 2007/08, and 2008/09 school years. Data consisted of student enrollment information, student grade information for math and ELA courses, and student behavior records.
A three step analytical approach was used:
1. A simple comparison of dropouts vs. non-dropouts was conducted to determine what indicators were correlated with dropping out.
2. All statistically significant and theoretically important variables were assessed using a multivariate model to determine which indicators were strongest, while controlling for all other indicators.
3. Based on the results of the multivariate models, cut points were identified for each important indicator using Receiver Operating Characteristic (ROC) curve analysis.
Analyses were conducted separately for 9th, 10th, 11th, and 12th grades under the assumption that there would likely be different indicators related to dropping out in each year. To obtain middle school cut points, the ROC curve analysis included an 8th grade sample using 9th grade dropout as the outcome variable (see Appendix A for a detailed description of the study methodology).
Findings
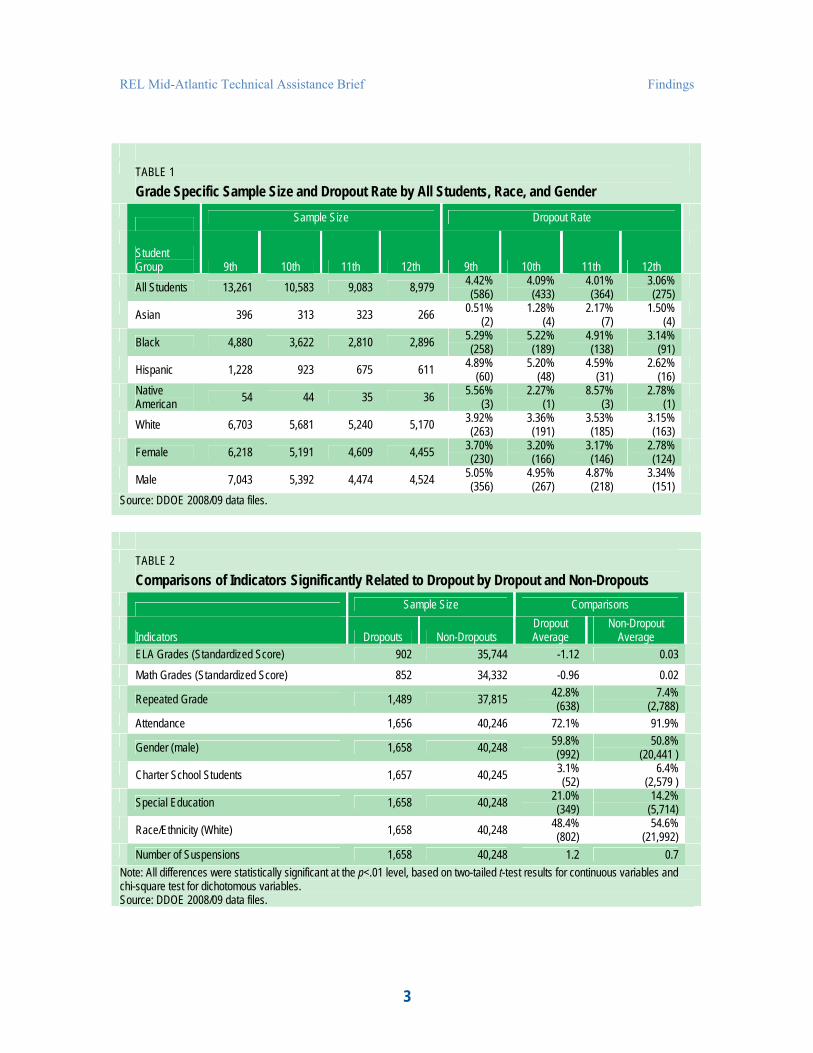
What indicators are associated with dropping out in Delaware? Initial review of the data indicated that similarities existed between grades both in terms of dropout rates and the indicators associated with dropping out at each grade. The 2008/09 dropout rates in the State of Delaware for 9th, 10th, 11th, and 12th graders were, respectively, 4.42 percent, 4.09 percent, 4.01 percent, and 3.06 percent. Dropout information was not available for 7th and 8th graders.
Table 1 demonstrates how dropout rates from the 2008/09 school year varied by subgroups. Black students had the highest rates of dropout, ranging from 3.14 percent to 5.29 percent, while dropout rates for Hispanic students were the second highest, with slightly lower levels (2.62 percent to 5.20 percent) than Black students across all grade levels. Asian students had the lowest
dropout rates, ranging from 0.51 percent to 2.17 percent. The dropout rates for Native American students varied widely by grade, but this could be due to the extremely low number of Native Americans at each grade. At all grade levels, male students dropped out at a greater rate than female students.
Nine student indicators were selected based on the results of descriptive and basic statistical analyses. Means or proportions of independent variables were then compared using t-tests or chi-square tests. Associations among independent variables were examined using correlation statistics and cross-tabulations. The results were consistent across all grade levels (see Appendix B for a full listing of student indicators reviewed). These characteristics are presented in Table 22 and include indicators cited in the literature, such as
2 t-test and correlation results are presented in Appendix B.
2
REL Mid-Atlantic Technical Assistance Brief Findings
TABLE 1 Grade Specific Sample Size and Dropout Rate by All Students, Race, and Gender
Sample Size Dropout Rate
Student Group 9th All Students 13,261
Asian 396
Black 4,880
Hispanic 1,228 Native 54 American White 6,703
Female 6,218
Male 7,043 Source: DDOE 2008/09 data files.
10th 10,583
313
3,622
923
44
5,681
5,191
5,392
11th 9,083
323
2,810
675
35
5,240
4,609
4,474
12th 8,979
266
2,896
611
36
5,170
4,455
4,524
9th 4.42% (586)
0.51% (2)
5.29% (258)
4.89% (60)
5.56% (3)
3.92% (263)
3.70% (230)
5.05% (356)
10th 4.09% (433)
1.28% (4)
5.22% (189)
5.20% (48)
2.27% (1)
3.36% (191)
3.20% (166)
4.95% (267)
11th 4.01% (364)
2.17% (7)
4.91% (138)
4.59% (31)
8.57% (3)
3.53% (185)
3.17% (146)
4.87% (218)
12th 3.06% (275)
1.50% (4)
3.14% (91)
2.62% (16)
2.78% (1)
3.15% (163)
2.78% (124)
3.34% (151)
TABLE 2 Comparisons of Indicators Significantly Related to Dropout by Dropout and Non-Dropouts
Sample Size Comparisons
Indicators Dropouts Non-Dropouts Dropout Non-Dropout Average Average
ELA Grades (Standardized Score) 902 35,744 -1.12 0.03 Math Grades (Standardized Score) 852 34,332 -0.96 0.02
Repeated Grade 1,489 37,815 42.8% (638)
7.4% (2,788)
Attendance 1,656 40,246 72.1% 91.9%
Gender (male)
Charter School Students
Special Education
Race/Ethnicity (White)
1,658
1,657
1,658
1,658
40,248
40,245
40,248
40,248
59.8% (992)3.1% (52)
21.0% (349)
48.4% (802)
50.8% (20,441 )
6.4% (2,579 )
14.2% (5,714) 54.6%
(21,992) Number of Suspensions 1,658 40,248 1.2 0.7
Note: All differences were statistically significant at the p<.01 level, based on two-tailed t-test results for continuous variables and chi-square test for dichotomous variables. Source: DDOE 2008/09 data files.
3

REL Mid-Atlantic Technical Assistance Brief
attendance rates, grades, and number of suspensions (Alexander, Entwisle, & Kabbani, 2001; Battin-Pearson, et. al, 2000; Bridgeland, Dilulio, & Morison, 2006; Ensminger & Slusarcick, 1992; Gleason & Dynarski, 2002; Goldschmidt & Wang, 1999; Kaufman, Bradbury, & Owings, 1992; Rumberger, 2001). Students who dropped out had lower standardized math and ELA course grades, lower attendance rates, and more suspensions than students who remained in school. Math and ELA grades were standardized to have a mean of 0 and a standard deviation of 1, so that letter grades and percentage grades could be comparable across students. Dropouts were also more likely to have repeated a grade and been enrolled in special education programs than non-dropouts.
None of the behavior-related variables demonstrated a consistent, statistically significant association with dropping out across all grade levels. The REL team found a statistically significant relationship between a student’s number of suspensions and dropping out in grades 9, 10, and 11. Number of offenses, state law reportable offenses, harassment, substance abuse, and other incidents that did not fit into one of the other categories demonstrated statistically significant associations with dropping out for 10th, 11th, and 12th graders. DOE reportable offenses were statistically significant only in the 9th grade sample. Violent behavior did not reveal any statistically significant relationship with student dropout. Of the behavior variables that had statistically significant results in three grade levels, number of suspensions had the greatest range of values. Table 2 shows the results for number of suspensions (see Appendix B for details on other variables).
Findings
What are the key indicators of dropping out in Delaware? Though a number of indicators that are independently associated with dropping out were identified, further analyses were needed to determine the strongest indicators when controlling for other indicators. Logistic regression models3 were fitted using the indicators in Table 2 and are presented in Appendix C. Unfortunately course grades could not be used to model dropping out of school in the 12th grade due to a large number of missing values.4
High levels of consistency were found in dropout indicators across grades 9-12. The strongest indicators were attendance rates, repeating a grade, and math and ELA course grades. Determinations of predictive strength were made based on the amount of variation in the probability of dropout that an indicator predicted and whether an
3 Students in the dataset were nested within schools and districts. To account for this correlation, the use of both Generalized Estimation Equations (GEE) and Hierarchical Linear Modeling (HLM) techniques were considered. Neither of the two models produced converged results. Dropout rates in Delaware were relatively low. This low frequency resulted in small amounts of variation for students dropping out, within or between schools and districts. The lack of convergence when estimating the GEE and HLM models confirm this empirically, as there was not substantial variation in students dropping out between or within schools. Thus, the use of logistic regression, without a correction for clustering of students in schools or districts, was most appropriate in this situation.4 Students’ grades may be missing from the educational database for a wide variety of reasons. For example, students may not be taking courses toward the end of high school, especially in mathematics; missing grades can be caused by data entry errors; and students may be missing grades because they did not stay in the school long enough.
4

REL Mid-Atlantic Technical Assistance Brief
individual indicator retained statistical significance when analyzed in the context of the other variables. Students who attended more of the required days of school during the school year were less likely to drop out. Students with higher math and ELA final course grades were also less likely to drop out than students with lower scores. Students who were in the process of repeating a grade were more likely to drop out than other students.
Student behavior measures such as the number of suspensions, number of offenses, and types of offenses were assessed in the context of the other indicators. Even though dropouts had a higher incidence of behavioral problems across all measures, none of the behavioral measures demonstrated statistically significant explanatory power relative to other indicators.
Type D Offenses5 were found to be a statistically significant indicator of dropout for Grade 11 students, but this finding did not hold for other grade levels.
For Grade 12, 66 percent of students who dropped out were missing math scores, and 13 percent were missing ELA scores, so the 12th grade models, presented in Appendix C, were conducted without math and ELA scores. Most findings remained consistent with other grades even though the model did not include these scores but took into account attendance, repeating grades, and number of offenses. The difference was that, for the 12th graders, the number of offenses was positively related to dropping out (i.e., as offenses increased so did dropout), and being in a charter school was negatively related to dropping out. Yet, when math and ELA scores were controlled for in the model, these relationships disappeared. This
5 Type D offenses are disciplinary offenses that schools are obliged to report to the DDOE.
Findings
could mean that the effect of charter school or number of offenses occurs through changes in student academic achievement; however, this conclusion cannot be definitively tested due to the substantial reductions in the analytical sample that occur when math and ELA are included in the models.
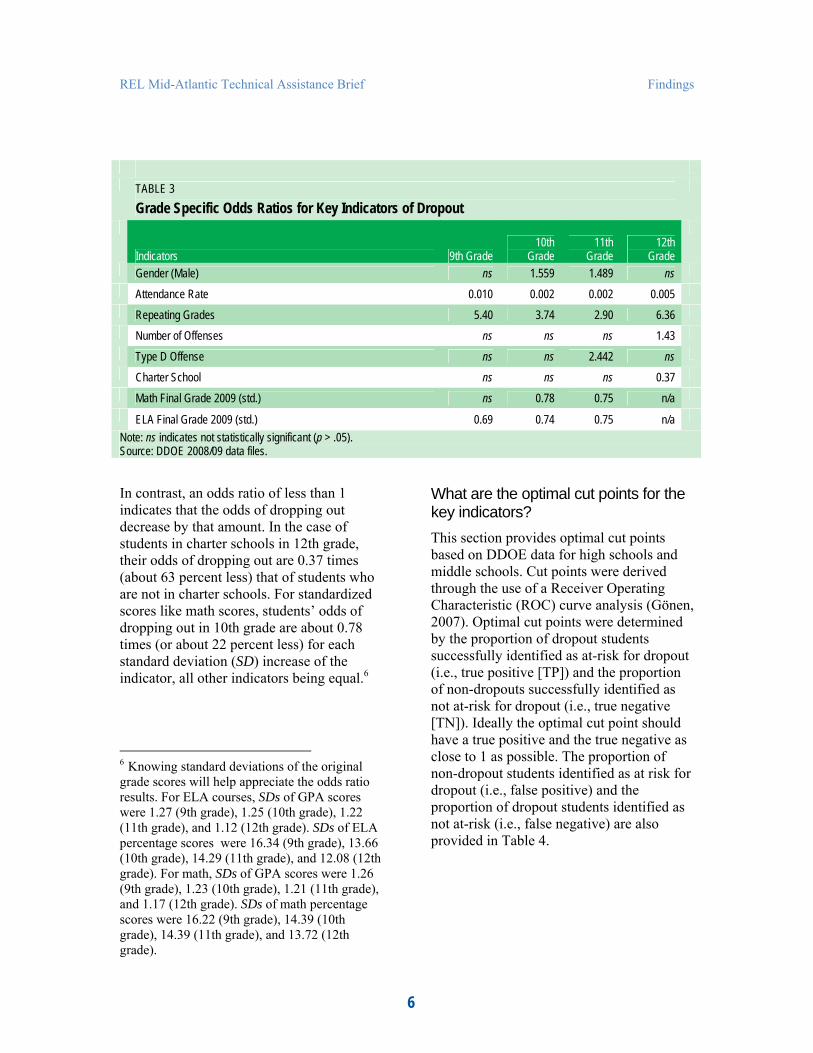
What are the odds of students dropping out based on the key indicators? The odds of students dropping out based on the results of the logistic regression models are presented in Table 3 and are described in this section. Moreover, specific examples have also been provided in an effort to inform the reader’s interpretation of Table 3. These odds may be particularly useful for fixed status, dichotomous variables such as gender, where no cut point can be determined.
The odds of a student dropping out are quantified using an odds ratio. A value of an odds ratio above 1 indicates that the odds of dropping out increase by that amount. So in the case of gender, in both 10th and 11th grades, if a student is male, his odds of dropping out are about 1.6 or 1.5 times that of females (i.e., a 60 percent or 50 percent increase in the odds even if the females and males have equal values on all other indicators). Students who are repeating a grade also have higher odds of dropping out relative to students who have advanced on to the next grade: the odds range from 2.90 in 11th grade to 6.36 in 12th grade (approximately 190 percent and 536 percent increase in the odds, respectively). This means that among 9th graders currently repeating 9th grade, with all else being equal, the odds of a student dropping out are 5.4 times higher (or about 440 percent greater) relative to 9th grade students not currently repeating a grade.
5
REL Mid-Atlantic Technical Assistance Brief Findings
TABLE 3 Grade Specific Odds Ratios for Key Indicators of Dropout
10th 11th 12th Indicators 9th Grade Grade Grade Grade Gender (Male) ns 1.559 1.489 ns
Attendance Rate 0.010 0.002 0.002 0.005 Repeating Grades 5.40 3.74 2.90 6.36 Number of Offenses ns ns ns 1.43 Type D Offense ns ns 2.442 ns
Charter School ns ns ns 0.37 Math Final Grade 2009 (std.) ns 0.78 0.75 n/a
ELA Final Grade 2009 (std.) 0.69 0.74 0.75 n/a Note: ns indicates not statistically significant (p > .05). Source: DDOE 2008/09 data files.
In contrast, an odds ratio of less than 1 indicates that the odds of dropping out decrease by that amount. In the case of students in charter schools in 12th grade, their odds of dropping out are 0.37 times (about 63 percent less) that of students who are not in charter schools. For standardized scores like math scores, students’ odds of dropping out in 10th grade are about 0.78 times (or about 22 percent less) for each standard deviation (SD) increase of the indicator, all other indicators being equal.6
6 Knowing standard deviations of the original grade scores will help appreciate the odds ratio results. For ELA courses, SDs of GPA scores were 1.27 (9th grade), 1.25 (10th grade), 1.22 (11th grade), and 1.12 (12th grade). SDs of ELA percentage scores were 16.34 (9th grade), 13.66 (10th grade), 14.29 (11th grade), and 12.08 (12th grade). For math, SDs of GPA scores were 1.26 (9th grade), 1.23 (10th grade), 1.21 (11th grade), and 1.17 (12th grade). SDs of math percentage scores were 16.22 (9th grade), 14.39 (10th grade), 14.39 (11th grade), and 13.72 (12th grade).
What are the optimal cut points for the key indicators? This section provides optimal cut points based on DDOE data for high schools and middle schools. Cut points were derived through the use of a Receiver Operating Characteristic (ROC) curve analysis (Gönen, 2007). Optimal cut points were determined by the proportion of dropout students successfully identified as at-risk for dropout (i.e., true positive [TP]) and the proportion of non-dropouts successfully identified as not at-risk for dropout (i.e., true negative [TN]). Ideally the optimal cut point should have a true positive and the true negative as close to 1 as possible. The proportion of non-dropout students identified as at risk for dropout (i.e., false positive) and the proportion of dropout students identified as not at-risk (i.e., false negative) are also provided in Table 4.
6
REL Mid-Atlantic Technical Assistance Brief Findings
TABLE 4 Specific State-Level Cut Points for High School Students’ Dropout Risk Indicators
Number of Number of Math ELA Suspensions
Incurred Offenses Incurred
Attendance Rate
Grade Score
Grade Score
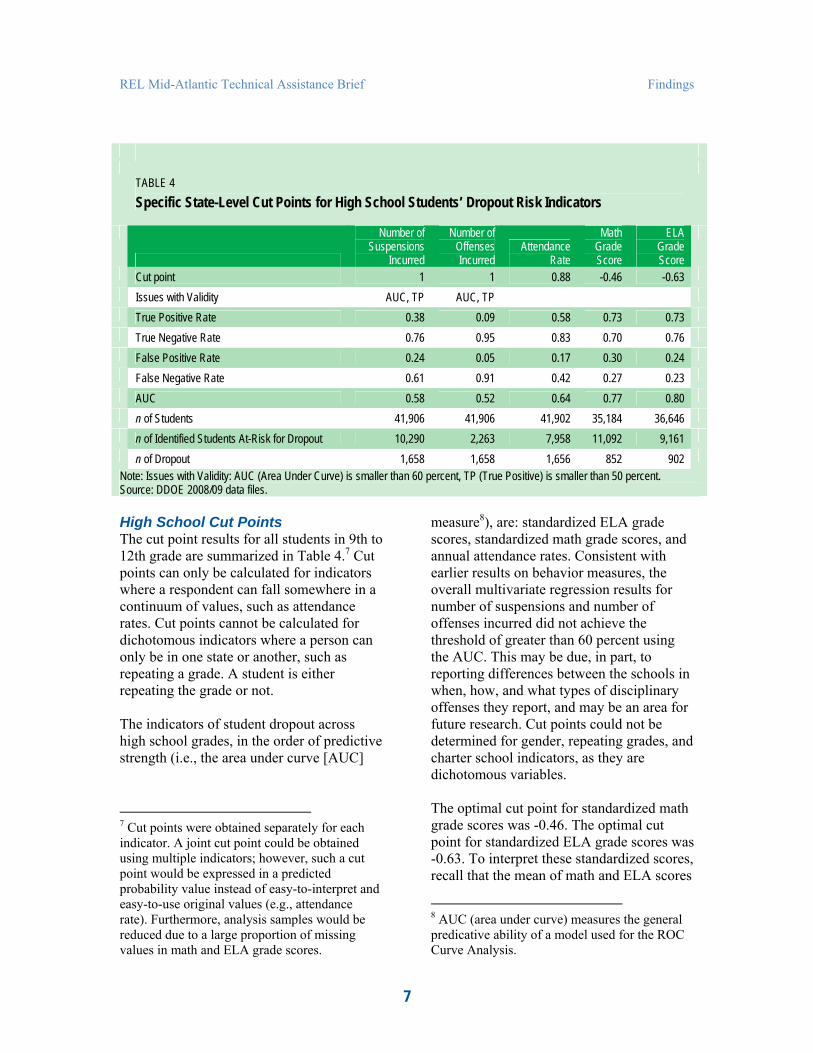
Cut point 1 1 0.88 -0.46 -0.63 Issues with Validity AUC, TP AUC, TP True Positive Rate 0.38 0.09 0.58 0.73 0.73 True Negative Rate 0.76 0.95 0.83 0.70 0.76 False Positive Rate 0.24 0.05 0.17 0.30 0.24 False Negative Rate 0.61 0.91 0.42 0.27 0.23 AUC 0.58 0.52 0.64 0.77 0.80 n of Students 41,906 41,906 41,902 35,184 36,646 n of Identified Students At-Risk for Dropout 10,290 2,263 7,958 11,092 9,161 n of Dropout 1,658 1,658 1,656 852 902
Note: Issues with Validity: AUC (Area Under Curve) is smaller than 60 percent, TP (True Positive) is smaller than 50 percent. Source: DDOE 2008/09 data files.
High School Cut Points The cut point results for all students in 9th to 12th grade are summarized in Table 4.7 Cut points can only be calculated for indicators where a respondent can fall somewhere in a continuum of values, such as attendance rates. Cut points cannot be calculated for dichotomous indicators where a person can only be in one state or another, such as repeating a grade. A student is either repeating the grade or not.
The indicators of student dropout across high school grades, in the order of predictive strength (i.e., the area under curve [AUC]
7 Cut points were obtained separately for each indicator. A joint cut point could be obtained using multiple indicators; however, such a cut point would be expressed in a predicted probability value instead of easy-to-interpret and easy-to-use original values (e.g., attendance rate). Furthermore, analysis samples would be reduced due to a large proportion of missing values in math and ELA grade scores.
measure8), are: standardized ELA grade scores, standardized math grade scores, and annual attendance rates. Consistent with earlier results on behavior measures, the overall multivariate regression results for number of suspensions and number of offenses incurred did not achieve the threshold of greater than 60 percent using the AUC. This may be due, in part, to reporting differences between the schools in when, how, and what types of disciplinary offenses they report, and may be an area for future research. Cut points could not be determined for gender, repeating grades, and charter school indicators, as they are dichotomous variables.
The optimal cut point for standardized math grade scores was -0.46. The optimal cut point for standardized ELA grade scores was -0.63. To interpret these standardized scores, recall that the mean of math and ELA scores
8 AUC (area under curve) measures the general predicative ability of a model used for the ROC Curve Analysis.
7
REL Mid-Atlantic Technical Assistance Brief
was set to 0 with a standard deviation of 1. Students whose performance level in terms of grades were equal to or lower than these cut points should be considered at-risk of dropping out. To provide an intuitive reference using the two types of grade scores used in the state of Delaware, the cut point for math grades was found to be 69.18 percent on a percentage grade scale or a 1.29 on a 4-point GPA scale; for ELA grades the cut points were 69.71 percent on a percentage grade scale and a 1.32 on a 4point GPA scale.9
True positives and true negatives using only transformed math grade scores were 73 percent and 70 percent, respectively. Using the cut point based only on course grades from ELA classes, 73 percent of 2008/09 dropout students were successfully identified as at-risk and 76 percent of non-dropouts were identified as not at-risk.
The optimal attendance cut point was 88 percent. Students who missed school at a rate below (or equal to) this cut point should be considered at-risk. The true positive and true negative rates using only attendance indicate that 58 percent of the students who dropped out in school year 2008/09 were successfully identified as at risk, while 83 percent of the students who did not dropout were successfully identified as not at risk.
When tested against the older dataset from 2007/08, math and ELA cut points were sufficiently robust and obtained similar results to those found in 2008/09 (see Appendix D). Separate analyses by grade showed that cut points were stable across
9 The conversion of the z-scores into the actual values was based on the following set of descriptive statistics: ELA course letter grades M=2.11 (SD=1.26), ELA course percentage score grade M=78.86 (SD=14.52), math course letter grades, M=1.86 (SD=1.24), and math course percentage score grade M=76.05 (SD=14.94).
Findings
grades, providing evidence that supports the use of cut points based on the combined sample reported above (see Appendix E). Cut points for districts with sufficient numbers of dropouts (i.e., equal to or greater than 30) and AUC’s, TP’s, and TN’s greater than 50 percent are presented in Appendix F.
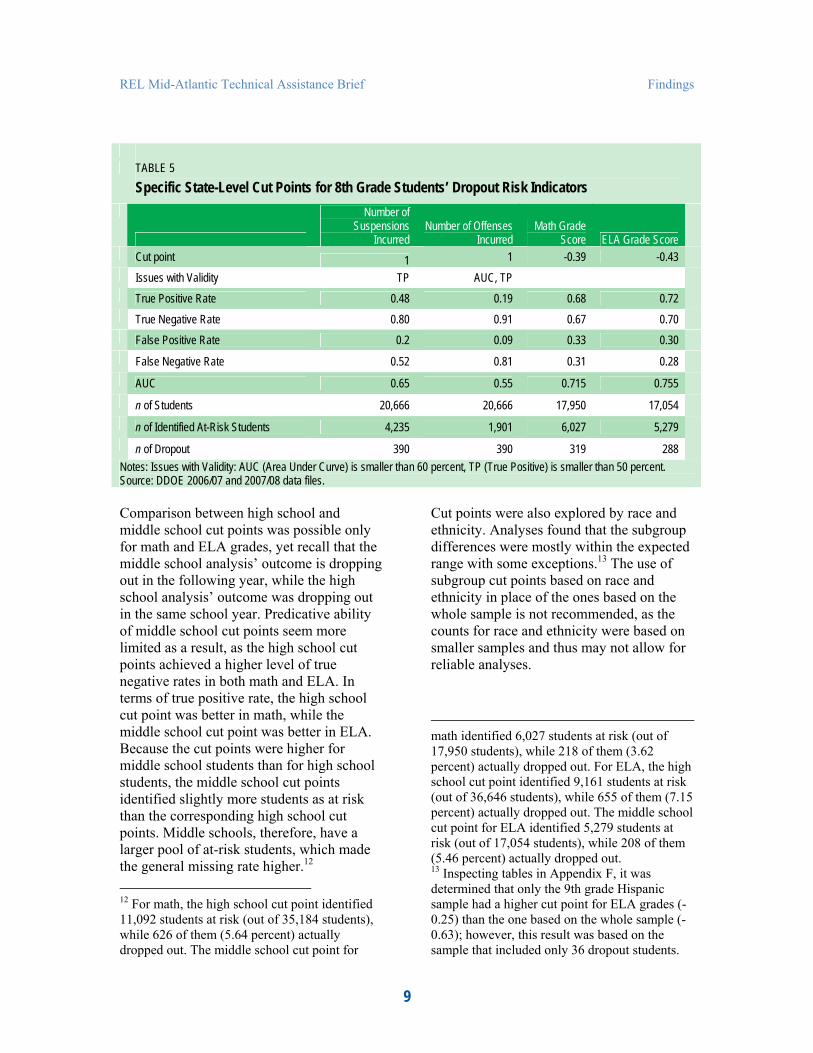
Middle School Cut Points Table 5 summarizes the results for middle school students.10 Recall that the DDOE does not collect dropout information on middle school students. A cohort database combining 8th graders from 2006/07 and 2007/08 along with corresponding 9th grade data from 2007/08 and 2008/09 was constructed with 9th grade dropout as the outcome variable. Attendance rates were not available in the 2006/07 databases. As with high school results on behavior measures, the number of suspensions (lower than 50 percent true positive rate) and number of offenses (lower than 50 percent AUC) did not meet true positive or AUC quality thresholds. Cut points for math and ELA courses were, respectively, standardized scores of -0.39 and -0.43. In percentage terms, math and ELA scores were 72.54 percent and 72.37 percent, respectively; and on a four-point GPA scale, 1.50 and 1.64 respectively. True positive rates and true negative rates using only math or ELA grade scores ranged from 67 percent to 73 percent.11
10 Exploratory analyses used 7th graders from 2007 and 8th graders from 2008 dropout information in all the following years, as the outcome returned almost identical results (not reported here but available upon request). 11 The conversion of the z-scores into the actual values was based on the following set of descriptive statistics: ELA course letter grades, M=2.16 (SD=1.22), ELA course percentage score grade, M=78.59 (SD=14.46), math course letter grades, M=1.98 (SD=1.23), and math course percentage score grade, M=77.85 (SD=13.62).
8
REL Mid-Atlantic Technical Assistance Brief Findings
TABLE 5 Specific State-Level Cut Points for 8th Grade Students’ Dropout Risk Indicators
Number of Suspensions
Incurred Number of Offenses
Incurred Math Grade
Score ELA Grade Score Cut point 1 1 -0.39 -0.43 Issues with Validity TP AUC, TP True Positive Rate 0.48 0.19 0.68 0.72 True Negative Rate 0.80 0.91 0.67 0.70 False Positive Rate 0.2 0.09 0.33 0.30
False Negative Rate 0.52 0.81 0.31 0.28
AUC 0.65 0.55 0.715 0.755
n of Students 20,666 20,666 17,950 17,054
n of Identified At-Risk Students 4,235 1,901 6,027 5,279
n of Dropout 390 390 319 288 Notes: Issues with Validity: AUC (Area Under Curve) is smaller than 60 percent, TP (True Positive) is smaller than 50 percent. Source: DDOE 2006/07 and 2007/08 data files.
Comparison between high school and middle school cut points was possible only for math and ELA grades, yet recall that the middle school analysis’ outcome is dropping out in the following year, while the high school analysis’ outcome was dropping out in the same school year. Predicative ability of middle school cut points seem more limited as a result, as the high school cut points achieved a higher level of true negative rates in both math and ELA. In terms of true positive rate, the high school cut point was better in math, while the middle school cut point was better in ELA. Because the cut points were higher for middle school students than for high school students, the middle school cut points identified slightly more students as at risk than the corresponding high school cut points. Middle schools, therefore, have a larger pool of at-risk students, which made the general missing rate higher.12
12 For math, the high school cut point identified 11,092 students at risk (out of 35,184 students), while 626 of them (5.64 percent) actually dropped out. The middle school cut point for
Cut points were also explored by race and ethnicity. Analyses found that the subgroup differences were mostly within the expected range with some exceptions.13 The use of subgroup cut points based on race and ethnicity in place of the ones based on the whole sample is not recommended, as the counts for race and ethnicity were based on smaller samples and thus may not allow for reliable analyses.
math identified 6,027 students at risk (out of 17,950 students), while 218 of them (3.62 percent) actually dropped out. For ELA, the high school cut point identified 9,161 students at risk (out of 36,646 students), while 655 of them (7.15 percent) actually dropped out. The middle school cut point for ELA identified 5,279 students at risk (out of 17,054 students), while 208 of them (5.46 percent) actually dropped out.13 Inspecting tables in Appendix F, it was determined that only the 9th grade Hispanic sample had a higher cut point for ELA grades (0.25) than the one based on the whole sample (0.63); however, this result was based on the sample that included only 36 dropout students.
9
REL Mid-Atlantic Technical Assistance Brief Findings
TABLE 6 DDOE Dropout Rate by the Number of Risk Indicators Assigned to Students
All Students Not Repeating Grade Repeating Grade % n of n of % n of n of % n Dropout Students Dropout Dropout Students Dropout Dropout 0.20% 0.13% 2.55% Not at Risk 17,247 16,776 22 471 12 (34) (22) (12)
At Risk with One 1.47% 0.99% 7.99% 8,658 8,070 80 588 47 Indicator (127) (80) (47) At Risk with Two 5.26% 3.72% 15.51% 4,541 3,948 147 593 92 Indicators (239) (147) (92) At Risk with Three 16.78% 12.79% 27.02% 2,032 1,462 187 570 154 Indicators (341) (187) (154)
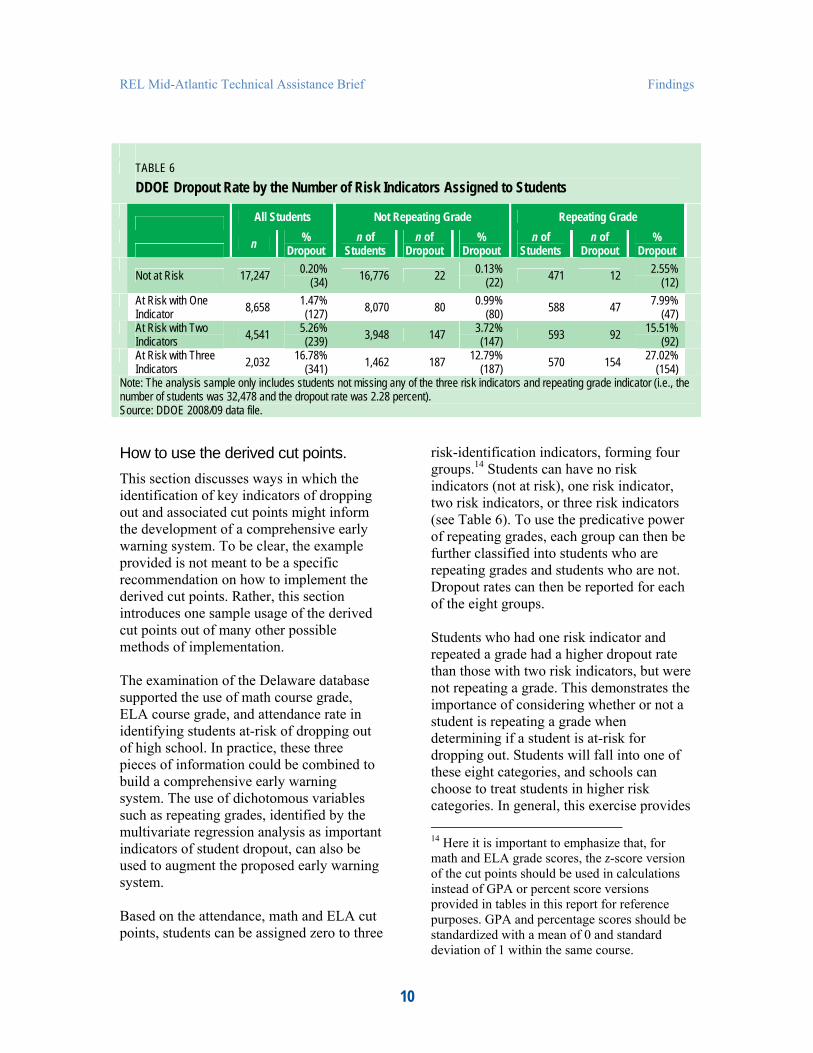
Note: The analysis sample only includes students not missing any of the three risk indicators and repeating grade indicator (i.e., the number of students was 32,478 and the dropout rate was 2.28 percent). Source: DDOE 2008/09 data file.
How to use the derived cut points. This section discusses ways in which the identification of key indicators of dropping out and associated cut points might inform the development of a comprehensive early warning system. To be clear, the example provided is not meant to be a specific recommendation on how to implement the derived cut points. Rather, this section introduces one sample usage of the derived cut points out of many other possible methods of implementation.
The examination of the Delaware database supported the use of math course grade, ELA course grade, and attendance rate in identifying students at-risk of dropping out of high school. In practice, these three pieces of information could be combined to build a comprehensive early warning system. The use of dichotomous variables such as repeating grades, identified by the multivariate regression analysis as important indicators of student dropout, can also be used to augment the proposed early warning system.
Based on the attendance, math and ELA cut points, students can be assigned zero to three
risk-identification indicators, forming four groups.14 Students can have no risk indicators (not at risk), one risk indicator, two risk indicators, or three risk indicators (see Table 6). To use the predicative power of repeating grades, each group can then be further classified into students who are repeating grades and students who are not. Dropout rates can then be reported for each of the eight groups.
Students who had one risk indicator and repeated a grade had a higher dropout rate than those with two risk indicators, but were not repeating a grade. This demonstrates the importance of considering whether or not a student is repeating a grade when determining if a student is at-risk for dropping out. Students will fall into one of these eight categories, and schools can choose to treat students in higher risk categories. In general, this exercise provides
14 Here it is important to emphasize that, for math and ELA grade scores, the z-score version of the cut points should be used in calculations instead of GPA or percent score versions provided in tables in this report for reference purposes. GPA and percentage scores should be standardized with a mean of 0 and standard deviation of 1 within the same course.
10
REL Mid-Atlantic Technical Assistance Brief Findings
support for the general expectation that the greater the number of risk indicators among a group of students, the higher the rate of student dropout in that group.
Limitations
These analyses cannot be used to determine what causes dropout, but rather to provide insights into what measures are associated with a greater likelihood of dropping out in Delaware. Moreover, the analyses were designed to meet DDOE’s needs, and will not necessarily be applicable to other states. Though these analyses may be used to inform future work, the focus of this study was to create the best models for Delaware’s student population, and thus caution must be exercised before applying these models to similar data sets on other student populations.
Similarly, a comprehensive analysis of all the student indicators associated with dropping out in the literature was beyond the scope of this project. Additional variables, such as information about students’ peer groups and family mobility that have been shown in the literature to be risk indicators for dropout, were not assessed (Cairns, Cairns, & Neckerman, 1989; Catalano & Hawkins, 1995; Ensminger, Lamkin, & Jacobson, 1996; Lehr et al., 2009). Also, it was not possible to conduct a longitudinal data analysis at this time because some of the key indicators, such as attendance rates, were only just starting to be collected by DDOE. Conducting a longitudinal data analysis may be one option for the next steps in this research.
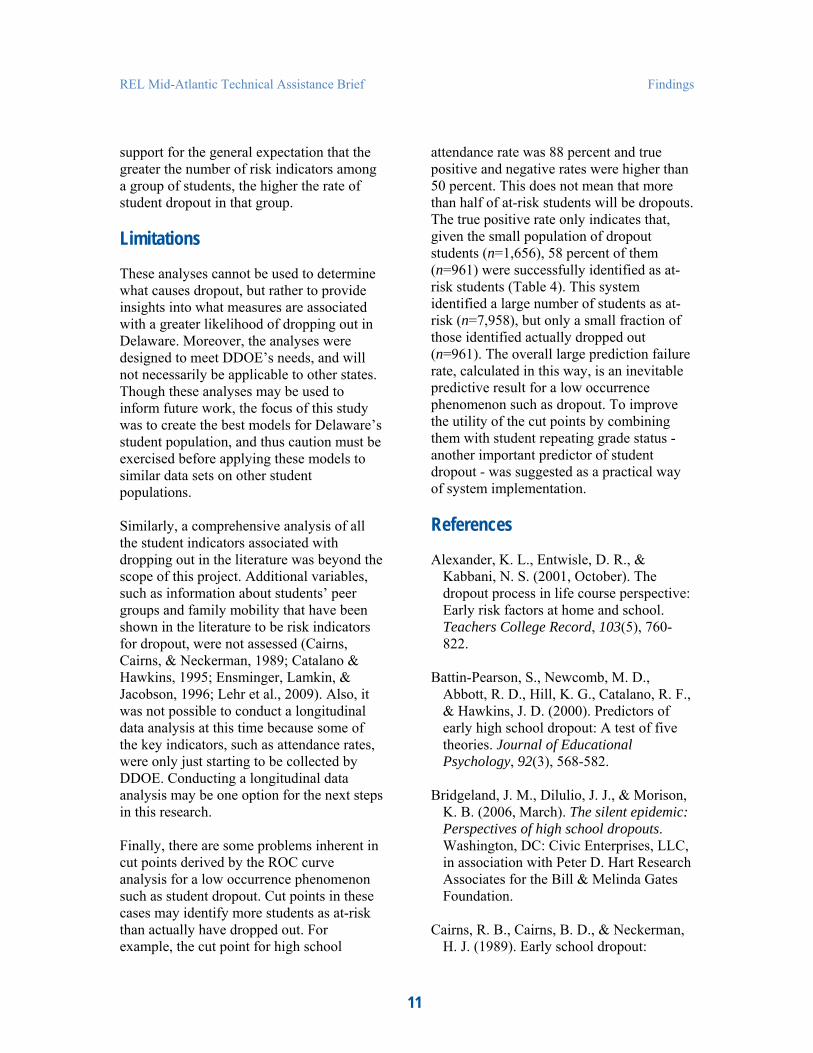
Finally, there are some problems inherent in cut points derived by the ROC curve analysis for a low occurrence phenomenon such as student dropout. Cut points in these cases may identify more students as at-risk than actually have dropped out. For example, the cut point for high school
attendance rate was 88 percent and true positive and negative rates were higher than 50 percent. This does not mean that more than half of at-risk students will be dropouts. The true positive rate only indicates that, given the small population of dropout students (n=1,656), 58 percent of them (n=961) were successfully identified as at-risk students (Table 4). This system identified a large number of students as at-risk (n=7,958), but only a small fraction of those identified actually dropped out (n=961). The overall large prediction failure rate, calculated in this way, is an inevitable predictive result for a low occurrence phenomenon such as dropout. To improve the utility of the cut points by combining them with student repeating grade status - another important predictor of student dropout - was suggested as a practical way of system implementation.
References
Alexander, K. L., Entwisle, D. R., & Kabbani, N. S. (2001, October). The dropout process in life course perspective: Early risk factors at home and school. Teachers College Record, 103(5), 760822.
Battin-Pearson, S., Newcomb, M. D., Abbott, R. D., Hill, K. G., Catalano, R. F., & Hawkins, J. D. (2000). Predictors of early high school dropout: A test of five theories. Journal of Educational Psychology, 92(3), 568-582.
Bridgeland, J. M., Dilulio, J. J., & Morison, K. B. (2006, March). The silent epidemic: Perspectives of high school dropouts. Washington, DC: Civic Enterprises, LLC, in association with Peter D. Hart Research Associates for the Bill & Melinda Gates Foundation.
Cairns, R. B., Cairns, B. D., & Neckerman, H. J. (1989). Early school dropout:
11

REL Mid-Atlantic Technical Assistance Brief
Configurations and determinants. Child Development, 60, 1437-1452.
Catalano, R., & Hawkins, J. D. (1995). Communities that care: Risk-focused prevention using the social development strategy. Seattle, WA: Developmental Research and Programs, Inc.
Ensminger, M. E., Lamkin, R. P., & Jacobson, N. (1996). School leaving: A longitudinal perspective including neighborhood effects. Child Development, 67, 2400-2416.
Ensminger, M. E., & Slusarcick, A. L. (1992). Paths to high school graduation or dropout: A longitudinal study of a first grade cohort. Sociology of Education, 65, 95-113.
Freund, R. J., & Wilson W. J. (1998). Regression Analysis: Statistical Modeling of a Response Variable. New York, NY: Academic Press.
Gleason, P., & Dynarski M. (2002). Do we know whom to serve? Issues in using risk factors to identify dropouts. Journal of Education for Students Placed at Risk, 7(1), 25-41.
Goldschmidt, P., & Wang, J. (1999). When can schools affect dropout behavior? A longitudinal multilevel analysis. American Educational Research Journal, 36(4), 715-738.
Gönen, M. (2007). Analyzing Receiver Operating Characteristic Curves with SAS. Cary, NC: SAS Press.
Heppen, J., & Therriault, S. (2008, July). Developing Early Warning Systems to Identify Potential High School Dropouts. National High School Center Issue Brief. Retrieved on August 10, 2009 from
Findings
http://www.betterhighschools.org/docs/Iss ueBrief_EarlyWarningSystemsGuide.pdf.
Heppen, J., O’Cummings, M., & Therriault, S. (2008). Early Warning System Tool [Online Tool]. National High School Center. Retrieved on August 10, 2009 from http://www.betterhighschools.org/docs/E WStool.xls
Kaufman, P., Bradbury, D., & Owings, J. (1992, August). Characteristics of at-risk students in the NELS:88. Washington, DC: National Center for Education Statistics, Office of Educational Research and Improvement, U.S. Department of Education.
Lehr, C. A., Johnson, D. R., Bremer, C. D., Cosio, S., & Thompson, M. (2004, May). Essential tools. Increasing rates of school completion: Moving from policy and research to practice. Minneapolis, MN: National Center on Secondary Education and Transition, College of Education and Human Development, University of Minnesota.
MacIver, M., Balfanz, R., & Byrnes, V. (2009, April) Dropouts in the Denver Public Schools: Early Warning Signals and Possibilities for Prevention and Recovery. Johns Hopkins University. Retrieved on August 10, 2009 from http://ednewscolorado.org/resources/1/Ho pkins-full%20study.pdf
Rumberger, R.W. (2001) Why students drop out of school and what can be done. Paper prepared for the forum of The Civil Rights Project of Harvard University and Achieve, Inc., entitled Dropouts in America: How Severe is the Problem? What Do We Know About Intervention and Prevention? Harvard University, Cambridge, MA (January 13).
12

REL Mid-Atlantic Technical Assistance Brief Findings
Smink, Jay. (2009, September) The PAR Advantage….A dropout early warning system with research-based solutions and a system for value-added assessment. Produced by National Dropout Prevention Center/ Network, Olympic Behavior Labs, Microsoft Corporation, IBM Corporation, Clemson Computing and Information Technology. Retrieved on January 19, 2010 from http://www.dropoutprevention.org/par_ad vantage/overview/PARADvantage44-full10-22-09.pdf.
Texas Education Agency. (2010) 9th Grade Transition and Intervention Program. Retrieved on January 19, 2010 from http://www.tea.state.tx.us/index3.aspx?id= 3629.
Wagner, M., Blackorby, J., Cameto, R., Hebbeler, K., & Newman, L. (1993, December). The transition experiences of young people with disabilities. A summary of findings from the National Longitudinal Transition Study of Special Education Students. Menlo Park, CA: SRI International for the Office of Special Education Programs, U.S. Department of Education. Available online at http://www.eric.ed.gov/ERICDocs/data/eri cdocs2/content_storage_01/0000000b/80/ 24/5a/ac.pdf.
13

REL Mid-Atlantic Technical Assistance Brief
Appendix A Detailed Description ofMethodology
This section provides a detailed description of the methods used in this study to determine risk indicators and associated cut points. To assist the reader a glossary of technical terms is provided at the end of this section.
The Delaware Department of Education Database The data for this study were compiled and provided by the DDOE and were delivered to the REL team in September of 2009. Information was provided on students in grades 7 and above, and spanned the 2006/07, 2007/08, and 2008/09 school years. Data consisted of student enrollment information, student grade information for math and ELA courses, and records of problem student behavior.
At the outset of the project, DDOE had identified three risk indicators for investigation: attendance, behavior, and course grades, all of which have been identified in the literature as being important indicators of dropping out (Alexander, Entwisle, & Kabbani, 2001; Battin-Pearson, et. al, 2000; Bridgeland, Dilulio, & Morison, 2006; Ensminger & Slusarcick, 1992; Gleason & Dynarski, 2002; Goldschmidt & Wang, 1999; Kaufman, Bradbury, & Owings,, 1992; Rumberger, 2001). Two of the limitations of the data were that attendance information, essential for the analysis of student dropout, was only available in the 2008/09 dataset and that the DDOE only collects dropout information for 9th graders and above. Subsequently, the research team focused primarily on the 2008/09 database, which allowed for an analysis of dropout for high school students (grade 9 to 12) as it included all three
Appendix A
important risk-indicators, i.e., course grades, attendance information, and behavior information. For middle school students’ ROC analysis, the team merged the 2006/07 and 2007/08 8th grade student databases to derive the cut points.
The analytical sample excluded the schools administered by the Department of Services for Children, Youth, and Their Families.15
These schools differed substantially from regular schools in their policies and students typically reside in these facilities, effectively producing a perfect attendance rate.
Analytic Approach The REL Team used a three step analytical approach:
1. Conduct simple comparisons of dropouts vs. non-dropouts to determine what indicators are correlated with dropping out;
2. Assess all statistically significant and theoretically important indicators using a multivariate model to determine which predictors were strongest, while controlling for all other indicators; and
3. Based on the results of the multivariate models, identify cut points for each important indicator using Receiver Operating Characteristic (ROC) curve analysis.
Analyses were conducted separately for 9th, 10th, 11th, and 12th grades under the assumption that there would likely be
15 The name of the special facilities were Camelot Non-Secure Detention, Ferris School for Boys, Grace and Snowden Cottages, NCC Detention Center, Northeast Treatment Center, Peoples Place Non-Secure Detention, Seaford House Day Treatment Center, Silver Lake Treatment Center, and Stevenson House Detention Center.
14

REL Mid-Atlantic Technical Assistance Brief
different indicators related to dropping out in each year. A ROC curve analysis was also conducted on a sample of 8th graders using 9th grade dropout as the outcome variable.
Simple univariate comparisons between dropouts and non-dropouts were conducted using t-tests, correlations and crosstabs. These comparisons were done separately by grade. Variables identified as having a statistically significant association with dropping out were analyzed further using multivariate logistic regression.
Raw Data Tables and Analysis Data sets The REL team received the ACCESS™ database (Data_for_REL070809C) from the DDOE in September of 2009. The database included Delaware’s 7th to 12th graders’ information from school years 2006/07, 2007/08, and the most recent 2008/09. The ACCESS™ database included the following data tables essential for analysis.
StudentEnrollment2: Student enrollment information, including school year, student ID, district ID, school ID, and demographic information. This table also included important key variables, such as dropout information, and risk indicators such as attendance and behavior information.
StudentCourseGrade: Student course grade information where each record represented each student’s test period information for math or ELA courses. That is, each subject has information on his/her mid-term and marking period grades, as well as final grades for courses he/she took. Grades were given either in letter grades (e.g., A, B, C) or numeric values that ranged from 0 to 100.
StudentBehavior: This data table includes all incidents of reported student behavior problems. Each incident is recorded with incidence ID, incident date, student ID, and
Appendix A
given a classification to indicate type of offense (e.g., D08, D11, etc). Note that the values were defined in another ACCESS™ database called OffenseCodes.
Based on the raw data tables, the REL team created analysis data tables specific to school year and grade. While this produces eighteen data tables (3, the number of school years * 6, the number of grade levels), the SAS datasets relevant for high school analysis were from the year 2008/09. � 9th graders’ data from 2008/09 � 10th graders’ data from 2008/09 � 11th graders’ data from 2008/09 � 12th graders’ data from 2008/09 � 9th to 12th graders’ data from
2008/09
Dropout information was only available from 9th graders and above. For the ROC analysis of middle graders, it was decided to use the 8th graders’ information from the 2006/07 and 2007/08 databases. These databases included course grade information, behavior information, and dropout information. Dropout information for these 8th grade students was then obtained from more recent 2007/08 or 2008/09 databases that included their 9th grade information. The name of the dataset for middle school student analyses was: � 8th graders’ data from 2006/07 and
2007/08.
All analysis data sets have identical formatting and variables. Each record represented a subject nested within schools and districts. A small percentage of subjects (3.4 percent: 1,388 out of 40,445 students when all high school grades were combined) appear more than once in the datasets, which indicates that they changed schools within the same school year. To avoid a loss of information specific to the schools they attended, their records were included in the analyses as if they were separate individuals. The results of logistic regression models
15

REL Mid-Atlantic Technical Assistance Brief
from the full analysis sample and the sample that included the same subjects only once were essentially identical.
Variable Descriptions The variables used for these analyses consisted of the outcome variable (student dropout) risk-indicators (predictor variables), academic grades, student behavior, and attendance, as well as covariates (control variables) used in regression models, such as demographic information and student record, such as grade and retention. A brief description of the variables follows below.
Dependent Variables Student Dropout: The outcome variable is student dropout as recorded in the DDOE Database. DDOE defines dropout as one of the following:
1) An individual who enrolled at the end of the previous school year and was expected to be enrolled in the current school year but did not attend any days of the current school year . Also, the individual does not meet any of the following exclusionary conditions:• Graduated from high school or
•
completed a state or district-approved educational program; or Transferred to another public school district, private school, or state- or
•
district-approved education program with official documentation on file; or
•
Moved out of state with official documentation on file; or Died.
2) An individual who was enrolled and attended at the beginning of the current school year and was withdrawn by parent, legal guardian or Relative Caregiver at age 16 or older, or was withdrawn by self after 18th birthday.
Appendix A
Predictor (Independent) VariablesAttendance Rate: The student attendance rate is derived by dividing (a) the number of days students attended schools (numerator) by (b) the number of days students were supposed to attend schools based on school requirement (denominator). For those who did not change schools during the school year 2008/09, the denominator was determined by official school calendars. For those who changed schools, the denominator was defined by the entry and exit date of students available in the student enrollment database.
Behavior of Student: The student behavior database included information on student suspension and offenses. The number of suspensions and the number of offenses are the most basic student behavior variables. The descriptions of the offenses were available for use in the offense type database. Thus, two new types of offense variables were constructed. One group consisted of count variables indicating how many times students committed “D-type” offenses and “C-type” offenses. D type are the offenses that schools are obliged to report to the DDOE (e.g., bullying, sexual harassment, use of profanity). C type offenses are more severe crimes that are reportable according to state laws (e.g., Rape, Arson, Assault). The other group consisted of several variables indicating whether the offenses were a) harassment, b) violence, c) substance abuse, and d) others.
Course Grade for Mathematics and ELA : Poor academic performance has been identified as a consistent predictor of student dropout (Alexander, Entwisle, & Kabbani, 2001; Battin-Pearson et al., 2000; Ensminger & Slusarcick, 1992; Rumberger, 2001; Wagner et al., 1993). The course database included titles of all math and ELA courses students registered for, as well as grades students received for all tests, including midterm tests and final tests.
16
REL Mid-Atlantic Technical Assistance Brief Appendix A
Analyses of math and reading course consisted of the “mathematics” (i.e., subject id 2012) and “English” (i.e., subject id 1000) categories. Middle school analyses also include the use of the “Language Arts” category (i.e., subject id 1099). To derive scores for mathematics and ELA courses for each subject, a set of standardization procedures were applied, so the derived scores are comparable by student and thus analyzable.
Covariates School-level and Student-level Variables: One school-level variable, which is the distinction of charter schools vis-à-vis regular schools (dummy-coded as 1 if charter school or 0), was used. Student-level variables were: race and ethnicity (Black, White, Hispanic), free/reduced lunch status, English language learner status, special education status, gender, and repeated grade status.
Variable Construction Dropout: An outcome variable Dropout was defined and constructed by the DDOE. The value of the variable is 1 if subjects were determined to have dropped out. If not, the value is 0. At the time of analysis and writing, the dropout information from the 2008/09 databases was a tentative one. It is possible that students who were believed to have dropped out by the end of the school year registered for the new school year 2009/10.
Academic Grades from Mathematics and ELA Courses: The purpose here was to derive standardized grade scores for ELA and mathematics based on student grade included in the course database. Course grades obviously are not standardized tests and the values were determined by teachers who may have had different grading policies. Several problems were addressed in the construction process of the grade scores.
First, the Delaware database included two types of grades. One was letter grades (e.g., A, B, C, D, and F) and the other was percent scores that ranged from 0 to 100. Second, teachers and courses varied by severity of grading and thus scores coming from different courses were not comparable.
The choice of the two types depended largely on school districts. REL Mid-Atlantic staff decided to convert letter grades into numeric values based on the conventional grade point average (GPA) system where A+, A, A-, B+, B, B-, C+, C,C, D+, D, D-, and F are considered, respectively, 4.3, 4, 3.7, 3.3, 3, 2.7, 2.3, 2, 1.7, 1.3, 1, 0.7, and 0. Other types of letter grades, such as I (Incomplete), E (Excellent), and W (Withdrawal), had different distribution shapes from the two major types of grades (e.g., bimodal); therefore, they were deleted from the dataset and treated as missing values. Percentage scores, the other type of grades used in Delaware, were already a numeric variable and thus did not need to be converted. Both original letter-grade scores and percentage scores were then standardized as z-scores with a course mean of 0 and a course SD of 1; thus, to the extent that the underlying distribution of the scores within each course is normal, the difference between the two types of grades were removed in the final scores.
To examine whether two types of grade scores were related to the outcome in a similar way, the results of multivariate logistic regression model were compared. The effect of academic grades in math and ELA courses was very similar for districts that used the letter grades or the percentage score grades. This was confirmed by running logistic regression models on the high school student sample, using the original letter grade sample and the original percentage score sample. To test whether the difference of effect sizes was statistically
17
REL Mid-Atlantic Technical Assistance Brief Appendix A
TABLE A-1 Number of Students Missing Final Grades
Final Grades Available
No Final Grades but Mid-term and Marking Period Grades Available
Grades were Missing from the Database
Math Dropout 214 638 877
Math Non-dropout 32,705 1,627 6,844
ELA Dropout 246 656 827
ELA Non-dropout Source: DDOE 2008/09 data files.
34,152 1,592 5,432
significant by original grade type, the model that included the interaction term was tested. The result indicated that the effect of math or ELA grade score did not depend on the original grade type. Note that this issue of grade type difference is not an issue with district-specific analysis because districts typically used one type of grade consistently.
The standardization within courses also addresses a second problem, specifically how final grades may vary by teacher and course. The standardized scores indicate the degree to which a subject is different from his/her classmates. For example, because the derived grade scores were z-scores, a subject with a score of 0 is a subject with a course-mean score. A subject with a score of 1 is a subject with a score that is 1 standard deviation above the course mean.
The difference among courses/teachers, therefore, is artificially suppressed. Thus, students in a high-ability class may be more able than students in a low-ability class, yet this difference may not reflect in the scores. Knowing this limitation, one should use the scores only to compare students in terms of how well or poorly they performed in the courses they took. Schools or districts should never be compared based on the standardized scores. To make this explicit, the derived scores were again standardized,
so all school-means of the scores were 0 and standard deviations were 1. If students took more than one course in math and ELA and had more than one final grade score, the average of the final grade scores were used.
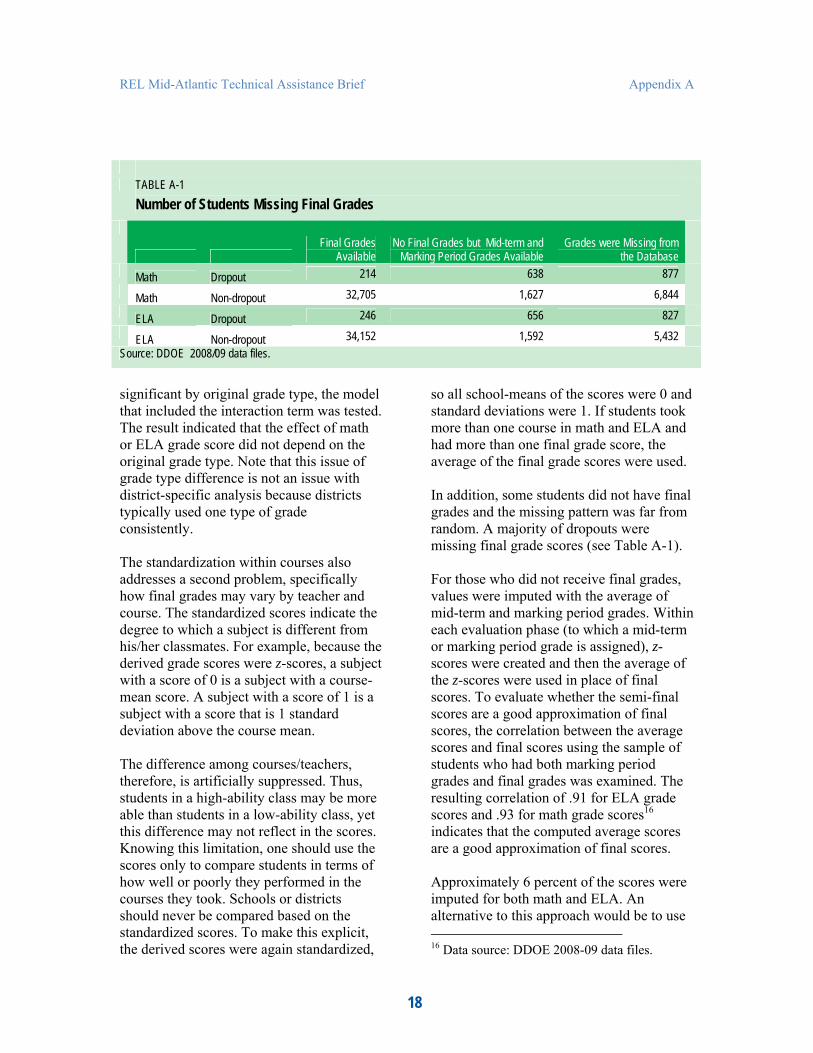
In addition, some students did not have final grades and the missing pattern was far from random. A majority of dropouts were missing final grade scores (see Table A-1).
For those who did not receive final grades, values were imputed with the average of mid-term and marking period grades. Within each evaluation phase (to which a mid-term or marking period grade is assigned), z-scores were created and then the average of the z-scores were used in place of final scores. To evaluate whether the semi-final scores are a good approximation of final scores, the correlation between the average scores and final scores using the sample of students who had both marking period grades and final grades was examined. The resulting correlation of .91 for ELA grade scores and .93 for math grade scores16
indicates that the computed average scores are a good approximation of final scores.
Approximately 6 percent of the scores were imputed for both math and ELA. An alternative to this approach would be to use
16 Data source: DDOE 2008-09 data files.
18
REL Mid-Atlantic Technical Assistance Brief Appendix A
the computed average scores for all subjects as it would not require any imputation. It was decided that final grades have better face validity than researcher-derived scores.
The overall distribution of standardized math grade scores and ELA grade scores were slightly skewed toward the negative end, as skewness of the distributions were, respectively, -.37 and -.59. The shape of the distributions was moderately peaked compared to the shape of normal distribution. Kurtosis (Kurtosis - 3) were, respectively, .08 and .45.
While the transformation and standardization of the values provided some solutions, the grade scores are still not strong measures. To summarize the limitations:
a) The scores only indicate whether subjects are higher achieving or lower achieving in comparison to classmates. Scores do not represent the absolute level of student competence. b) The meaning of the z-scores relies on the original distribution of the scores. When the distribution of the grade scores is skewed, the meaning of the same z-scores could differ. For example, imagine that in one course the score distribution is skewed toward the lower end, while in the other it is skewed toward the higher end. The meaning of scores could be very different in these two courses.
Attendance Rate: This is the rate of students being present at school. The student enrollment table provided NumbAbsences (number of days absent from school); the derived absence rates were based on what was available in the database and school calendars and then subtracted from 1 to calculate attendance rate. To derive absence rate, the numerator was the number of days students were absent from school and the denominator was the number of school days
students were supposed to be present at school. The denominator required some complex calculation as not only schools differed by the number of school days (excluding weekends, holidays, professional development days for teachers), but students who changed schools within the same school year differed by the number of days they were supposed to be at school.
To obtain school-specific school days, school calendars were coded and entered into the database. School calendars were provided by Dr. Judi Coffield to the REL Mid-Atlantic team by email. For students who stayed in the same school for the whole school calendar year, the number of school days was the count of non-holidays between the start date and end date of the school year. For students who stayed in the same school shorter than a whole school year, variables EntryDate (the date of entry into the school) and ExitDate were utilized to construct a duration of time (defined by the number of days) from which the count of holidays was subtracted. The “short stay” students were those who dropped out, those who changed schools, or those who moved out of the Delaware school system. When students moved to different Delaware public schools within the same school year, they appear as multiple records in the database each with a different attendance rate.
Number of Suspensions and Number of Offenses: As with dropout information, the number of suspensions and number of offenses were provided in the original database. They were simple counts of incidents.
Types of Offenses: The ACCESS™ database StudentBehavior included a variable that classifies all the behavior incidences reported to the DDOE. For example, a code C0101 indicates “Conspiracy 1st Degree” and C0102 indicates “Aggravated Menacing.” The REL
19
REL Mid-Atlantic Technical Assistance Brief
team created two sets of variables that grouped many available codes into broad categories. The first classification system consisted of five variables: harassment, violence, substance abuse, and other offenses. The values represented counts of incidents in these categories. The other classification system consisted of two types of offenses. Offense C was state law reportable offenses. Offense D was DOE reportable offenses. Again these variables are count variables, indicating the frequency of incidences for each subject.
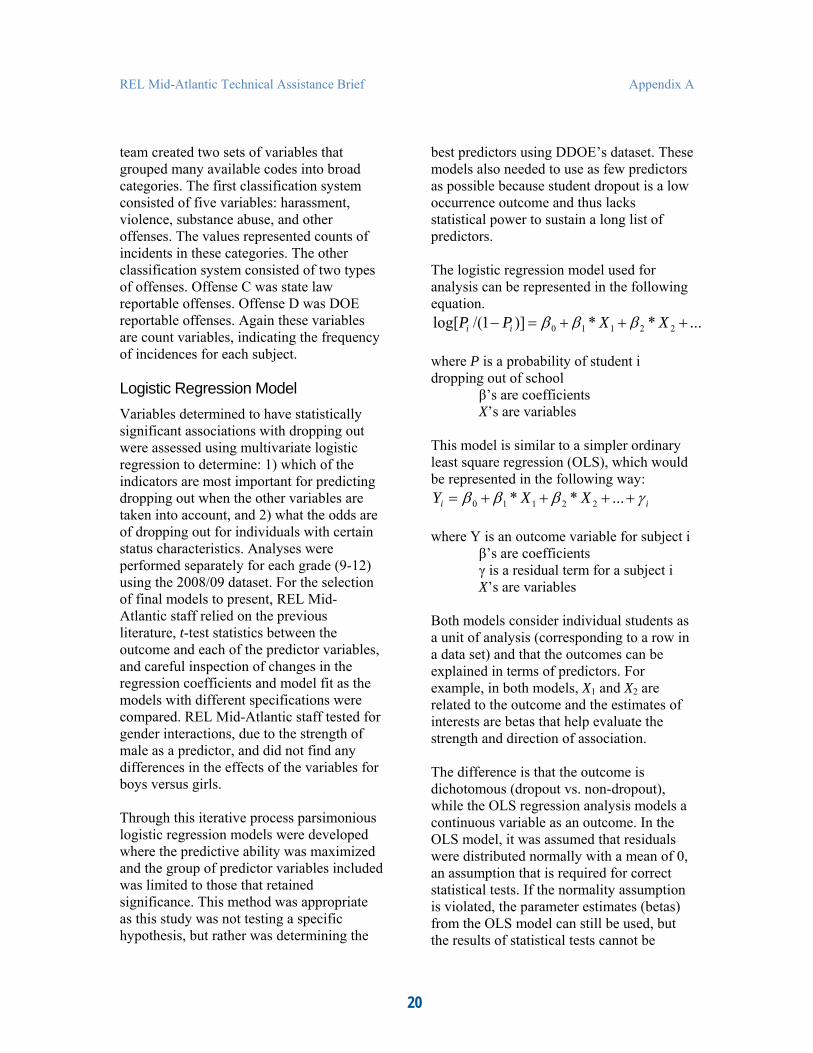
Logistic Regression Model Variables determined to have statistically significant associations with dropping out were assessed using multivariate logistic regression to determine: 1) which of the indicators are most important for predicting dropping out when the other variables are taken into account, and 2) what the odds are of dropping out for individuals with certain status characteristics. Analyses were performed separately for each grade (9-12) using the 2008/09 dataset. For the selection of final models to present, REL Mid-Atlantic staff relied on the previous literature, t-test statistics between the outcome and each of the predictor variables, and careful inspection of changes in the regression coefficients and model fit as the models with different specifications were compared. REL Mid-Atlantic staff tested for gender interactions, due to the strength of male as a predictor, and did not find any differences in the effects of the variables for boys versus girls.
Through this iterative process parsimonious logistic regression models were developed where the predictive ability was maximized and the group of predictor variables included was limited to those that retained significance. This method was appropriate as this study was not testing a specific hypothesis, but rather was determining the
Appendix A
best predictors using DDOE’s dataset. These models also needed to use as few predictors as possible because student dropout is a low occurrence outcome and thus lacks statistical power to sustain a long list of predictors.
The logistic regression model used for analysis can be represented in the following equation. log[P /(1− P )] = β + β * X + β * X + ...i i 0 1 1 2 2
where P is a probability of student i dropping out of school
β’s are coefficients X’s are variables
This model is similar to a simpler ordinary least square regression (OLS), which would be represented in the following way: Y = β + β * X + β * X + ... +γi 0 1 1 2 2 i
where Y is an outcome variable for subject i β’s are coefficients γ is a residual term for a subject i X’s are variables
Both models consider individual students as a unit of analysis (corresponding to a row in a data set) and that the outcomes can be explained in terms of predictors. For example, in both models, X1 and X2 are related to the outcome and the estimates of interests are betas that help evaluate the strength and direction of association.
The difference is that the outcome is dichotomous (dropout vs. non-dropout), while the OLS regression analysis models a continuous variable as an outcome. In the OLS model, it was assumed that residuals were distributed normally with a mean of 0, an assumption that is required for correct statistical tests. If the normality assumption is violated, the parameter estimates (betas) from the OLS model can still be used, but the results of statistical tests cannot be
20

REL Mid-Atlantic Technical Assistance Brief Appendix A
trusted (i.e., a statement like “X has a statistically significant effect” cannot be correct). Because the outcome is student dropout, which is a dichotomous variable (coded 0 or 1), the residuals will never be normal and thus a simple OLS model cannot be used to conduct correct statistical testing.
Logistic regression model was used where the outcome was a likelihood of subjects dropping out of school. In reality, each subject’s probability of dropping out cannot be directly measured, as it is only known whether subjects dropped out or not as a fact. Thus probability has to be calculated from the whole data. For this, betas or the coefficients of independent variables must be estimated such that correct prediction of student dropout is optimized (in other words, the right side of the equation must be set such that the value derived from it most closely explains the left side of the equation). Maximum Likelihood Estimation method is used for this purpose.
ROC Curve Analysis The ROC (Receiver Operation Characteristic) curve analysis identifies the optimal cut points for variables of interest, in this case variables related to dropping out (e.g., student attendance, grade, suspension), allowing us to identify students at risk for dropping out of school.
Determining the optimal cut point, indicating that a student is at risk, is a two step process;
1) identifying the proportion of dropout students successfully identified as at-risk (called “true positive”), and
2) identifying the proportion of non-dropout students successfully identified as not at-risk (called “true negative”).
In the case of student dropout, true positive rate is the percentage of students who are
identified as at-risk, given the sample of dropout students. True negative rate corresponds to the percentage of students identified as not-at-risk, given the sample of non-dropout students.
The ideal, though unrealistic, cut point is the one that identifies at-risk students perfectly, which would provide 100 percent, true positives and 100 percent, true negatives. The derived cut point will be based on the true positive and true negative rates that are most close to the ideal point in one kind of mathematical space the ROC curve analysis uses (to be discussed below).
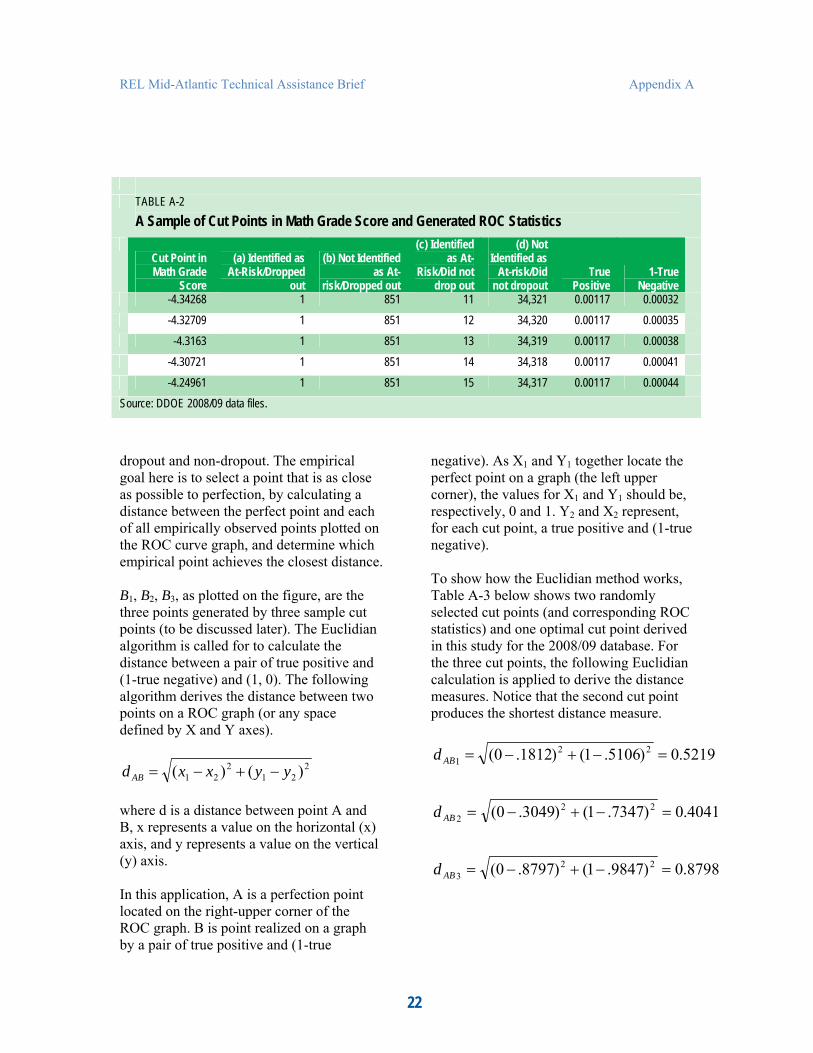
The analysis is first driven by a set of true positive rates and true negative rates for all possible cut points. For example, in the 2008/09 database, there were 25,103 possible values in the math grade scores, which would produce 25,101 possible cut points. To visualize this, Table A-2 includes a randomly selected block of five cut points and the cell counts for four groups of students. Notice that the choice of cut points affect cell counts in the four groups. This also affects true positive rates and true negative rates. A 1-true negative is used as it is slightly more intuitive when plugged into a mathematical algorithm later.
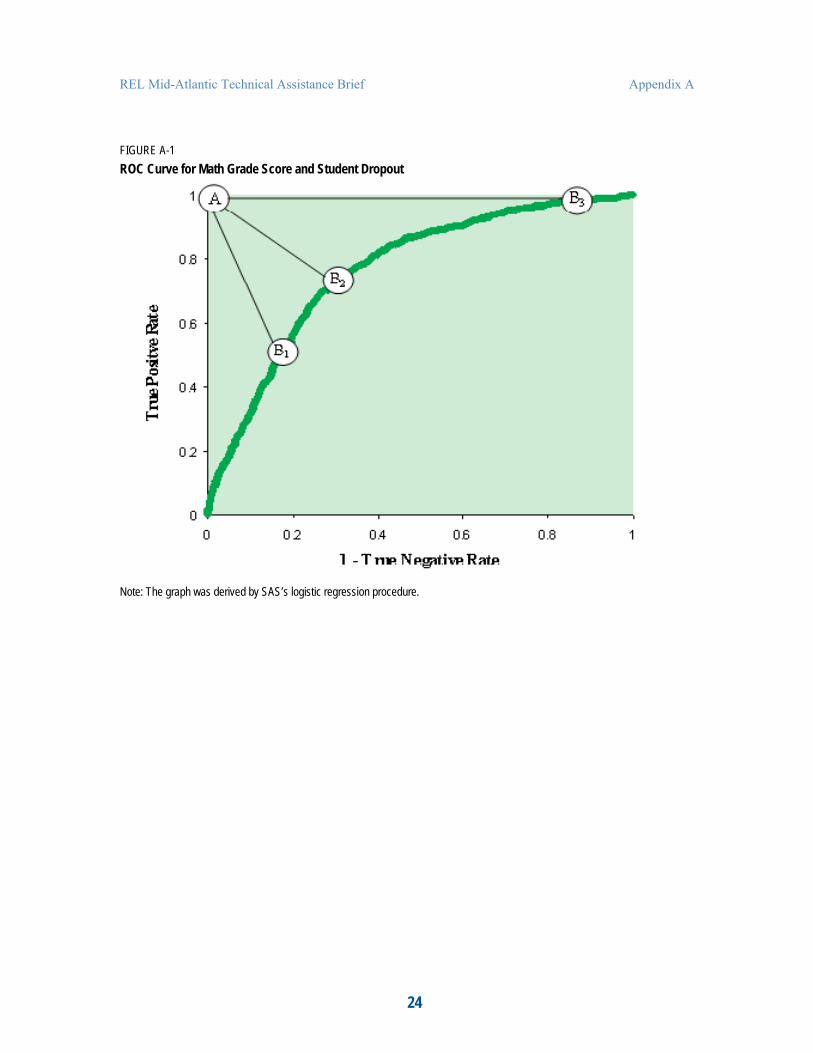
The optimal cut point is chosen by a technique that includes the Euclidian method. First, imagine all pairs of true positive and (1-true negative) are plotted in a space defined by an X-axis and a Y-axis. The ROC curve graph (Figure A-1) is constructed by using all 25,101 cut points for math grade scores. The optimal point on the ROC line is the point that is closest to the upper-left corner where true positive rate is 1 and (1-true negative rate) is 0 (noted as A in the figure). Conceptually, this upper-left corner would be the perfect point that signifies perfect prediction of student
21
(x − x )2 + (y − y )2d AB = 1 2 1 2
REL Mid-Atlantic Technical Assistance Brief Appendix A
TABLE A-2 A Sample of Cut Points in Math Grade Score and Generated ROC Statistics
Cut Point in Math Grade
Score -4.34268
(a) Identified as At-Risk/Dropped
out 1
(b) Not Identified as At-
risk/Dropped out 851
(c) Identified as At-
Risk/Did not drop out
11
(d) Not Identified as
At-risk/Did not dropout
34,321
True Positive 0.00117
1-True Negative
0.0003 2-4.32709 1 851 12 34,320 0.00117 0030.0 5
-4.3163 1 851 13 34,319 0117 0.0 0030.0 8-4.30721 1 851 14 34,318 01170.0 00410.0 -4.24961 1 851 15 34,317 0.00117 0040.0 4
ource: DDOE 2008/09 data files. S
dropout and non-dropout. The empirical goal here is to select a point that is as close as possible to perfection, by calculating a distance between the perfect point and each of all empirically observed points plotted on the ROC curve graph, and determine which empirical point achieves the closest distance.
B1, B2, B3, as plotted on the figure, are the three points generated by three sample cut points (to be discussed later). The Euclidian algorithm is called for to calculate the distance between a pair of true positive and (1-true negative) and (1, 0). The following algorithm derives the distance between two points on a ROC graph (or any space defined by X and Y axes).
where d is a distance between point A and B, x represents a value on the horizontal (x) axis, and y represents a value on the vertical (y) axis.
In this application, A is a perfection point located on the right-upper corner of the ROC graph. B is point realized on a graph by a pair of true positive and (1-true
negative). As X1 and Y1 together locate the perfect point on a graph (the left upper corner), the values for X1 and Y1 should be, respectively, 0 and 1. Y2 and X2 represent, for each cut point, a true positive and (1-true negative).
To show how the Euclidian method works, Table A-3 below shows two randomly selected cut points (and corresponding ROC statistics) and one optimal cut point derived in this study for the 2008/09 database. For the three cut points, the following Euclidian calculation is applied to derive the distance measures. Notice that the second cut point produces the shortest distance measure.
= (0 − .1812)2 + (1− .5106)2 = 0.5219d AB1
= (0 − .3049)2 + (1− .7347)2 = 0.4041d AB 2
= (0 − .8797)2 + (1− .9847)2 = 0.8798d AB 3
22

REL Mid-Atlantic Technical Assistance Brief
Quality Diagnostics of Generated Cut Points To diagnose the quality of cut points, it was decided to use the following three criteria.
1. The number of dropout students must be equal to or be greater than 30 to ensure confidence in the results. District specific or subgroup analyses encountered the problem of small n for student dropout.
2. True positive (TP) and true negative (TN) must be equal to or be greater than .50 to ensure the utility of the
results. In light of true positive, the team decided that the predictors should be strong enough to predict and help intervene for at least half of students who drop out.
3. AUC (Area Under Curve), which indicates the general predicative ability of the model, is greater than .60. AUC refers to the area under the ROC curve. (See a sample of the ROC curve graphic in Figure A-1). AUC could range from 0 to 1 and a random guessing of risk status would achieve .50.
Appendix A
TABLE A-3 Sample Cut Points and Derived ROC Statistics Cut Point in Math Grade
Score
-0.71494
(a) Identified as At-
Risk/Droppe d out
435
(b) Not Identified as At-
risk/Dropped out
417
(c) Identified
as At-Risk/Did not drop
out 6221
(d) Not Identified
as At-risk/Did
not dropout
28,111
True Positive
0.5106
1-True Negative
0.1812
Euclidian Distance
0.5219 -0.45661 626 226 10,466 23,866 0.7347 0.3049 0.4041 1.71658 839 13 30,201 4,131 0.9847 0.8797 0.8798
Source: DDOE 2008/09 data files.
23
REL Mid-Atlantic Technical Assistance Brief Appendix A
FIGURE A-1 ROC Curve for Math Grade Score and Student Dropout
Note: The graph was derived by SAS’s logistic regression procedure.
24
REL Mid-Atlantic Technical Assistance Brief
Glossary
Area Under Curve (AUC) This statistic has a 0-to-1 range. It measures the general predicative power of a continuous variable predicting a dichotomous outcome. Thus, typically, statistical software produces AUC values when executing logistic regression model, but it can be manually obtained through a calculation of the true positive rates and the true negative rates for all possible cut points of a continuous variable. In the ROC Curve Analysis, when all possible pairs of true negative rate and (1-true positive rate) are plotted on an X-Y graph, a curvy line emerges to create two areas in the square space. The larger the area under the curve, the better the predicative capability of the model. AUC has to be substantially larger than .50 because even a random guessing of an outcome can achieve an AUC of .50.
Chi-square test Chi-square tests are used to test whether the statistical pattern between two values on a dichotomous variable (e.g., dropping out of school) are the result of chance or most likely real. Chi-square test is used when both of the two variables are dichotomous (e.g., gender and dropping out of school). The cross tabulation of the two variables creates four counts each corresponding to male dropout, female dropout, male non-dropout, and female non-dropout. Chi-square tests assess whether dropout varies by gender by comparing what would be the expected cell counts if the association were random and what cell counts were obtained in reality.
Cut Point Cut point is a fixed point on a continuous scale that indicates the threshold for a predictor above or below which an outcome is likely to occur for members of a sample. In medical practices, cut points are used as a
Appendix A
way to identify patients at risk for (or already suffering from) certain diseases. For example, blood pressure over the cut point or threshold of 140/90 should be considered “high” and may indicate that a person is “at risk” for cardiovascular disease. Cut points can only be determined for continuous variables.
Euclidian Method The ROC Curve Analysis utilizes the Euclidian method in order to find an optimal cut point out of many other potential cut points. Each cut point produces two proportions, the true positive rate and (1-true negative rate). When the pairs of proportions are plotted in the X-Y space, they form a curve known as the ROC Curve. The best point in the curve is defined as the one that achieves the closest distance to the left-upper corner of the square (i.e., [X,Y]=[0, 1]). This perfection point, though it does not exist in reality, indicates perfect prediction. In order to calculate the distance between this point (0,1) and other points defined by X-values and Y-values , the Euclidian algorithm is utilized. The point on the curve that achieves the minimum distance is the optimal point defined by the best combination of the true positive rate and the true negative rate. The cut point in a predictor variable that produces the best combination is the optimal cut point.
False Negative Rate The false negative rate (FN) corresponds to the percentage of students identified not at-risk of dropping out in the sample of dropout students. FN rates are calculated as follows;
FN rate = # of dropout Students unsuccessfully identified not at risk / # of dropout students
or as, FN rate =1 - TP rate.
25
REL Mid-Atlantic Technical Assistance Brief Appendix A
False Positive Rate The false positive rate (FP) corresponds to the percentage of students identified at risk of dropping out in the sample of non-dropout students. FP rates are calculated as follows;
FP rate = # of non-dropout students unsuccessfully identified at risk / # of non-dropout students
or as, FP rate = 1 - TN rate.
Logistic Regression Model Logistic regression models are used when the outcome of interest is a variable with only two values (e.g., student dropout). Other models, such as ordinary least square models (OLS), are appropriate for use when the outcome is a continuous variable, or one that can have a wide range of values (e.g., student test score).
Maximum Likelihood Estimation This is one of the popular estimation methods that help obtain the estimates of parameters (i.e., coefficients of a statistical model). The purpose is essentially the same as the ordinary least square (OLS) method used in the most basic statistical model called OLS regression model. ML method is used particularly for solving computationally challenging models, such as logistic regression models. The ML method compares the predicted values of the model specified and the actual behavior of the outcome variable and chooses the optimal set of parameters.
Odds ratios Odds are a ratio of probabilities that are used in the context of logistic regression as a tool for interpretation. The formula for
calculating the odds is:
Odds = probabilit y /(1 − probabilit y)
An odds ratio is the ratio of the odds of an event occurring for one group to the odds of the same event occurring for another group. In the following, Odds1 is the odds of one group experiencing the event (e.g., of winning a prize) and Odds2 is the odds of the other group experiencing the event:
Odds _ ratio = Odds1 / Odds2
In this study, the odds ratio of a 9th grader repeating a grade to drop out of school by the end of the school year was 5.4. This means that among 9th graders currently repeating 9th grade, the odds of a student dropping out are 5.4 times higher (or about 440 percent greater) relative to 9th grade students not currently repeating a grade.
OLS (Ordinary Least Square) Regression Model OLS regression model is the most basic form of regression. OLS regression is used to assess the relationship between predictor variables and an outcome variable (that is a continuous variable). It calculates the magnitude of contribution that a predictor variable makes to an increase or decrease of value in the outcome variable. Using a dataset and a multiple set of variables, this modeling framework allows a complex calculation of such estimates (called “coefficients” or “effects”). Based on the source of imprecision inherent in the analyzed information, the framework also conducts a statistical test of derived estimates (to decide whether the estimates are precise enough to be real or a result of chance).
26
REL Mid-Atlantic Technical Assistance Brief Appendix A
Optimal Cut Point Optimal cut point is a cut point in a continuous variable that optimizes the true positive rate and the true negative rate (i.e., closest to 1 on both). What is “the best” combination is determined by a mathematical algorithm called the Euclidian distance algorithm.
ROC Curve Analysis The ROC (Receiver Operation Characteristic) Curve Analysis determines a cut point for a continuous variable that optimizes the predictive power of that variable on a certain outcome. Medical test results are reported in continuous variables, such as blood pressure or sugar level; however, doctors use certain cut points to determine whether patients are at risk for developing certain diseases. Likewise, a meteorologist can predict whether or not an area will experience frost the next morning (dichotomous prediction) based on road surface temperature (a continuous variable).
R-square Regression models, such as Ordinary Least Square (OLS) regression models, produce a static called R-square, which indicates “the proportion of variance explained by the model” (Freund & Wilson, 1998, p.55) and the statistic ranges from 0 (0 percent of variance explained) to 1 (100 percent of variance explained). The goal of such a technique is to find predictors that can explain the variation in an outcome variable and R-square is an indicator of how well a predictor or predictors are explaining the outcome. Logistic regression models produce a similar statistic called Pseudo R-square. Because the model processes a dichotomous outcome, to which the notion of “variance” is different from OLS regression models, it utilizes an algorithm based on maximum likelihood estimation method. The concepts are still comparable.
Standard Deviation (SD) Standard deviation is a measure of score dispersion or variance. Like the mean (i.e., average), standard deviation helps describes a sample. If subjects receive more or less similar scores, say, from an achievement test, the standard deviation would be small. If the scores differ greatly by individual, standard deviation will be large. Conceptually, the standard deviation is the average deviation of each score from the mean.
True Negative Rate The true negative rate (TN) corresponds to the percentage of students identified not at risk of dropping out in the sample of non-dropout students. TN rates are calculated as follows:
TN Rate = # of non-dropout Students successfully identified as not at risk / # of non-dropout students
True Positive Rate The true positive rate (TP) corresponds to the percentage of students identified at risk of dropping out in the sample of dropout students. TP rates are calculated as follows:
TP rate = # of dropout Students successfully identified at risk / # of dropout students
T-test T-test are used to test whether the statistical pattern between two variables, where at least one is a continuous variable (e.g., attendance rate), are the result of chance or most likely real. Using the example of attendance rate and school dropout, one is most likely see that dropout students have a lower level of attendance rate than non-dropout students. To assess whether the difference in attendance rate is statistically significant from 0, a t-test is utilized.
27

REL Mid-Atlantic Technical Assistance Brief Appendix A
Z-score or Standardized Score Scores, such as grade scores in this study, can be converted into standardized scores, using a z-score transformation. Z-scores are useful because, if some assumptions are met, they convey a sense about the position/ranking of a subject in the distribution of all scores. For example, a score of 0 is the average score. A score of 3 is found near the top of the distribution, while a score of -3 is found near the negative end of the distribution. To calculate an individual’s z-scores, the individual score should be subtracted from the mean of the scores and then be divided by the standard deviation of the scores.
28
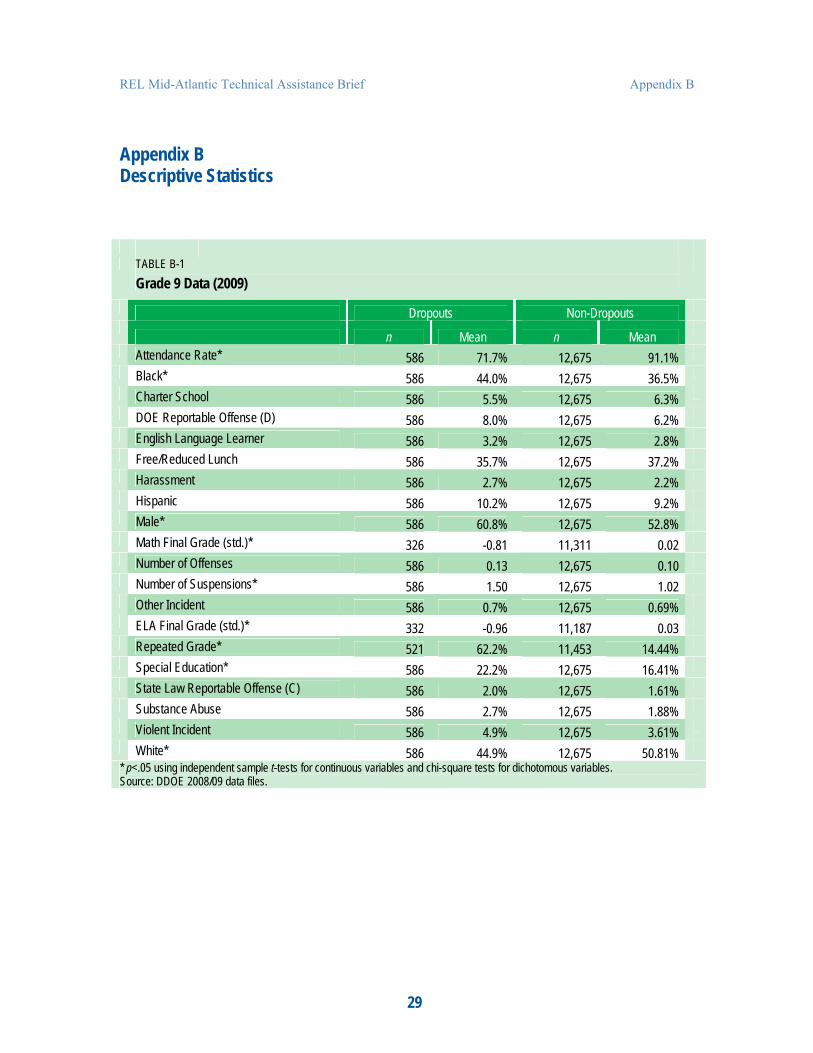
REL Mid-Atlantic Technical Assistance Brief Appendix B
Appendix B Descriptive Statistics
TABLE B-1 Grade 9 Data (2009)
Dropouts Non-Dropouts
n Mean n Mean Attendance Rate* 586 71.7% 12,675 91.1% Black* 586 44.0% 12,675 36.5% Charter School 586 5.5% 12,675 6.3% DOE Reportable Offense (D) 586 8.0% 12,675 6.2% English Language Learner 586 3.2% 12,675 2.8% Free/Reduced Lunch 586 35.7% 12,675 37.2% Harassment 586 2.7% 12,675 2.2% Hispanic 586 10.2% 12,675 9.2% Male* 586 60.8% 12,675 52.8% Math Final Grade (std.)* 326 -0.81 11,311 0.02 Number of Offenses 586 0.13 12,675 0.10 Number of Suspensions* 586 1.50 12,675 1.02 Other Incident 586 0.7% 12,675 0.69% ELA Final Grade (std.)* 332 -0.96 11,187 0.03 Repeated Grade* 521 62.2% 11,453 14.44% Special Education* 586 22.2% 12,675 16.41% State Law Reportable Offense (C) 586 2.0% 12,675 1.61% Substance Abuse 586 2.7% 12,675 1.88% Violent Incident 586 4.9% 12,675 3.61% White* 586 44.9% 12,675 50.81%
* p<.05 using independent sample t-tests for continuous variables and chi-square tests for dichotomous variables. Source: DDOE 2008/09 data files.
29

REL Mid-Atlantic Technical Assistance Brief Appendix B
TABLE B-2 Grade 10 Data (2009)
Dropouts Non-Dropouts
n Mean n Mean Attendance Rate* 364 69.8% 8,719 92.3% Black* 364 37.9% 8,719 30.6%Charter School* 364 2.5% 8,719 7.2% DOE Reportable Offense (D)* 364 8.5% 8,719 3.4%English Language Learner 364 2.5% 8,719 2.0% Free/Reduced Lunch 364 28.6% 8,719 27.3%Harassment* 364 1.9% 8,719 0.9% Hispanic 364 8.5% 8,719 7.4%Male* 364 59.9% 8,719 48.8% Math Final Grade (std.)* 194 -1.12 7,768 0.03Number of Offenses* 364 0.13 8,719 0.05 Number of Suspensions* 364 1.15 8,719 0.53Other Incident* 364 1.4% 8,719 0.4% ELA Final Grade (std.)* 199 -1.18 7,829 0.03Repeated Grade* 329 25.2% 8,320 2.3% Special Education* 364 22.3% 8,719 12.8%State Law Reportable Offense (C)* 364 2.5% 8,719 1.0% Substance Abuse* 364 4.9% 8,719 1.3%Violent Incident 364 2.5% 8,719 1.9% White* 364 50.8% 8,719 58.0%
* p<.05 using independent sample t-tests for continuous variables and chi-square tests for dichotomous variables Source: DDOE 2008/09 data files.
30
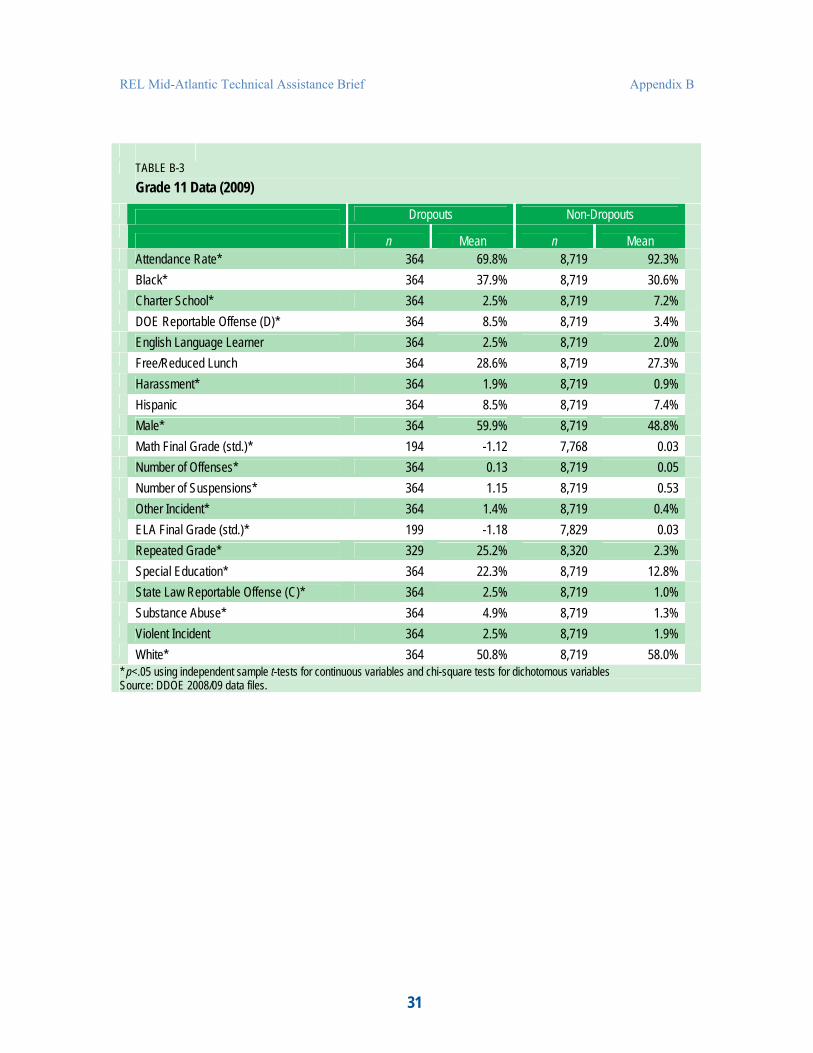
REL Mid-Atlantic Technical Assistance Brief Appendix B
TABLE B-3 Grade 11 Data (2009)
Dropouts Non-Dropouts
n Mean n Mean Attendance Rate* 364 69.8% 8,719 92.3% Black* 364 37.9% 8,719 30.6%Charter School* 364 2.5% 8,719 7.2% DOE Reportable Offense (D)* 364 8.5% 8,719 3.4% English Language Learner 364 2.5% 8,719 2.0% Free/Reduced Lunch 364 28.6% 8,719 27.3% Harassment* 364 1.9% 8,719 0.9% Hispanic 364 8.5% 8,719 7.4%Male* 364 59.9% 8,719 48.8% Math Final Grade (std.)* 194 -1.12 7,768 0.03 Number of Offenses* 364 0.13 8,719 0.05 Number of Suspensions* 364 1.15 8,719 0.53 Other Incident* 364 1.4% 8,719 0.4% ELA Final Grade (std.)* 199 -1.18 7,829 0.03 Repeated Grade* 329 25.2% 8,320 2.3% Special Education* 364 22.3% 8,719 12.8% State Law Reportable Offense (C)* 364 2.5% 8,719 1.0% Substance Abuse* 364 4.9% 8,719 1.3% Violent Incident 364 2.5% 8,719 1.9% White* 364 50.8% 8,719 58.0%
* p<.05 using independent sample t-tests for continuous variables and chi-square tests for dichotomous variables Source: DDOE 2008/09 data files.
31

REL Mid-Atlantic Technical Assistance Brief Appendix B
TABLE B-4 Grade 12 Data (2009)
Dropouts Non-Dropouts
n Mean n Mean Attendance Rate* 274 74.5% 8,704 91.7% Black 275 33.1% 8,704 32.2%Charter School* 275 1.5% 8,704 5.4% DOE Reportable Offense (D) 275 3.6% 8,704 2.6%English Language Learner 275 1.5% 8,704 1.8% Free/Reduced Lunch 275 24.0% 8,704 26.7%Harassment 275 0.7% 8,704 0.6% Hispanic 275 5.8% 8,704 6.8%Male 275 54.9% 8,704 50.2% Math Final Grade (std.)* 95 -1.13 6,073 0.02Number of Offenses* 275 0.08 8,704 0.04 Number of Suspensions 275 0.60 8,704 0.46Other Incident* 275 1.5% 8,704 0.2% ELA Final Grade (std.)* 135 -1.53 7,679 0.03Repeated Grade* 249 26.5% 8,436 4.3% Special Education* 275 21.1% 8,704 13.8%State Law Reportable Offense (C)* 275 1.8% 8,704 0.5% Substance Abuse* 275 2.9% 8,704 1.2%Violent Incident 275 1.8% 8,704 1.2% White 275 59.3% 8,704 57.5%
* p<.05 using independent sample t-tests for continuous variables and chi-square tests for dichotomous variables Source: DDOE 2008/09 data files.
32
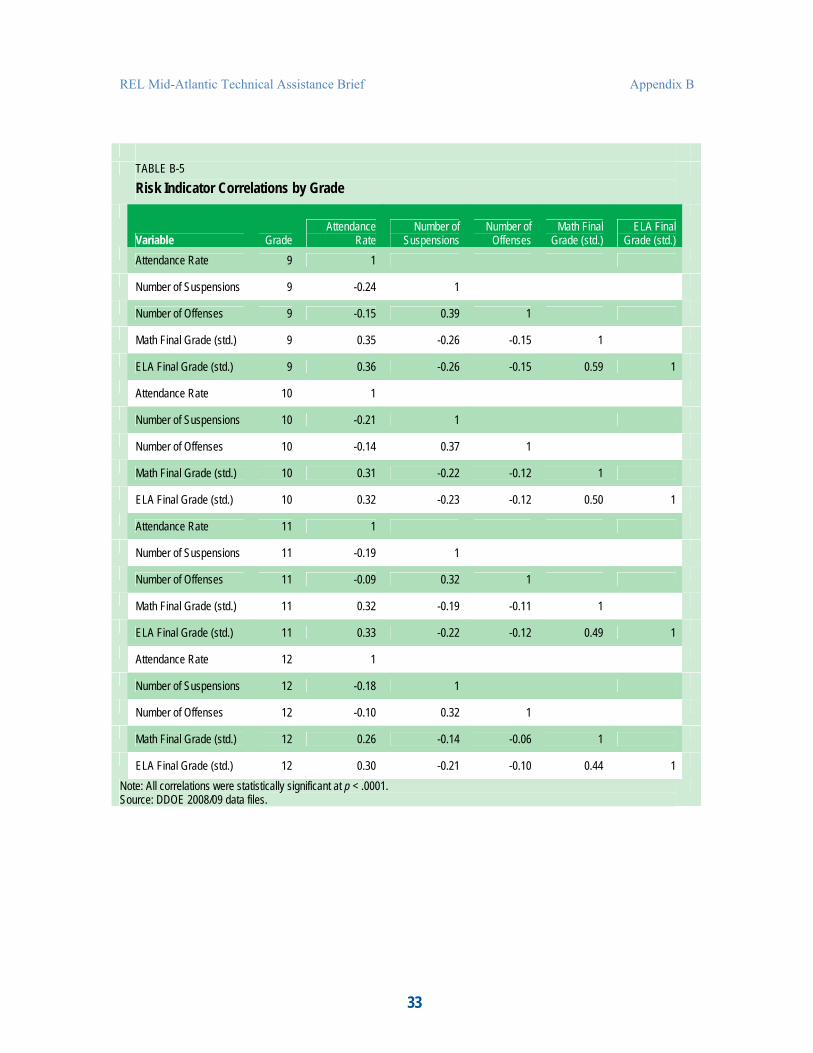
REL Mid-Atlantic Technical Assistance Brief Appendix B
TABLE B-5 Risk Indicator Correlations by Grade
Variable Attendance Rate
Grade 9
Attendance Rate
1
Number of Suspensions
Number of Offenses
Math Final Grade (std.)
ELA Final Grade (std.)
Number of Suspensions 9 -0.24 1
Number of Offenses 9 -0.15 0.39 1
Math Final Grade (std.) 9 0.35 -0.26 -0.15 1
ELA Final Grade (std.) 9 0.36 -0.26 -0.15 0.59 1
Attendance Rate 10 1
Number of Suspensions 10 -0.21 1
Number of Offenses 10 -0.14 0.37 1
Math Final Grade (std.) 10 0.31 -0.22 -0.12 1
ELA Final Grade (std.) 10 0.32 -0.23 -0.12 0.50 1
Attendance Rate 11 1
Number of Suspensions 11 -0.19 1
Number of Offenses 11 -0.09 0.32 1
Math Final Grade (std.) 11 0.32 -0.19 -0.11 1
ELA Final Grade (std.) 11 0.33 -0.22 -0.12 0.49 1
Attendance Rate 12 1
Number of Suspensions 12 -0.18 1
Number of Offenses 12 -0.10 0.32 1
Math Final Grade (std.) 12 0.26 -0.14 -0.06 1
ELA Final Grade (std.) 12 0.30 -0.21 -0.10 0.44 1 Note: All correlations were statistically significant at p < .0001. Source: DDOE 2008/09 data files.
33
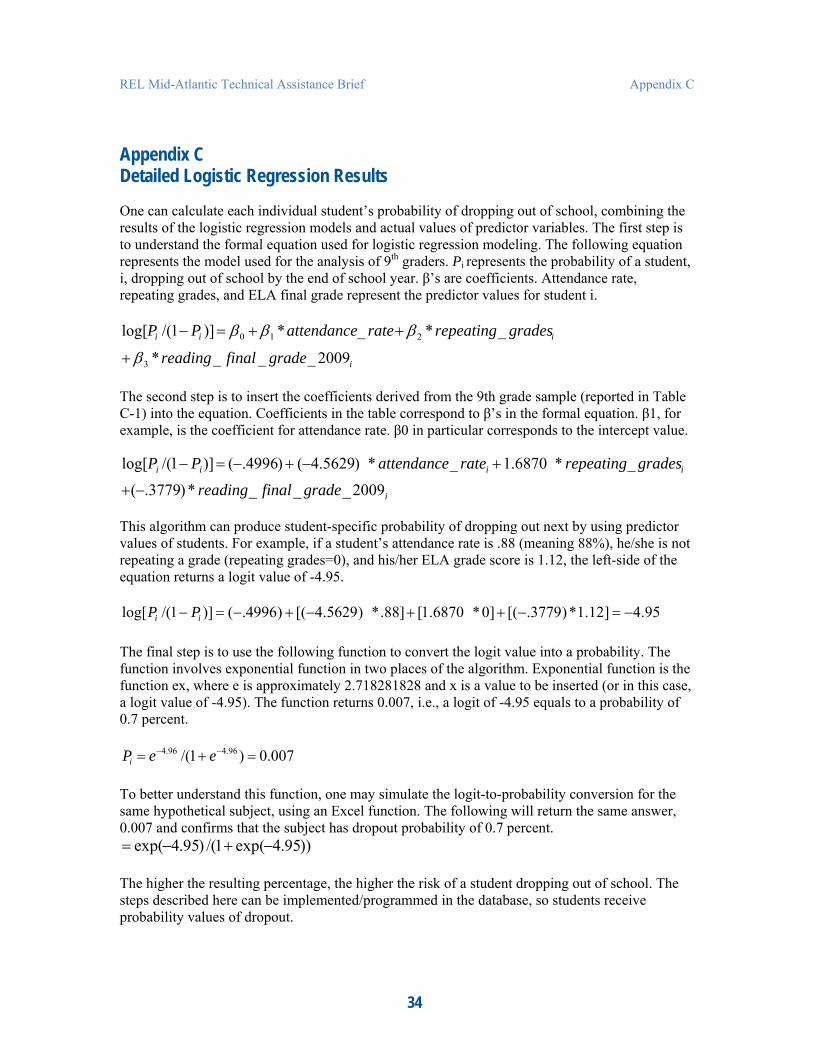
REL Mid-Atlantic Technical Assistance Brief Appendix C
Appendix C Detailed Logistic Regression Results
One can calculate each individual student’s probability of dropping out of school, combining the results of the logistic regression models and actual values of predictor variables. The first step is to understand the formal equation used for logistic regression modeling. The following equation represents the model used for the analysis of 9th graders. Pi represents the probability of a student, i, dropping out of school by the end of school year. β’s are coefficients. Attendance rate, repeating grades, and ELA final grade represent the predictor values for student i.
log[P i /(1− P i )] = β 0 + β 1 *attendance_ rate+ β 2 *repeating_ gradesi
+ β3 *reading_ final _ grade_ 2009i
The second step is to insert the coefficients derived from the 9th grade sample (reported in Table C-1) into the equation. Coefficients in the table correspond to β’s in the formal equation. β1, for example, is the coefficient for attendance rate. β0 in particular corresponds to the intercept value.
log[Pi /(1− Pi )] = (−.4996) + (−4.5629) * attendance_ ratei +1.6870 * repeating_ gradesi
+(−.3779)* reading_ final_ grade_2009i
This algorithm can produce student-specific probability of dropping out next by using predictor values of students. For example, if a student’s attendance rate is .88 (meaning 88%), he/she is not repeating a grade (repeating grades=0), and his/her ELA grade score is 1.12, the left-side of the equation returns a logit value of -4.95.
log[Pi /(1− Pi )] = (−.4996) + [(−4.5629) *.88] + [1.6870 * 0] + [(−.3779) *1.12] = −4.95
The final step is to use the following function to convert the logit value into a probability. The function involves exponential function in two places of the algorithm. Exponential function is the function ex, where e is approximately 2.718281828 and x is a value to be inserted (or in this case, a logit value of -4.95). The function returns 0.007, i.e., a logit of -4.95 equals to a probability of 0.7 percent.
P −4.96 i = e /(1+ e −4.96 ) = 0.007
To better understand this function, one may simulate the logit-to-probability conversion for the same hypothetical subject, using an Excel function. The following will return the same answer, 0.007 and confirms that the subject has dropout probability of 0.7 percent. = exp(−4.95) /(1+ exp(−4.95))
The higher the resulting percentage, the higher the risk of a student dropping out of school. The steps described here can be implemented/programmed in the database, so students receive probability values of dropout.
34
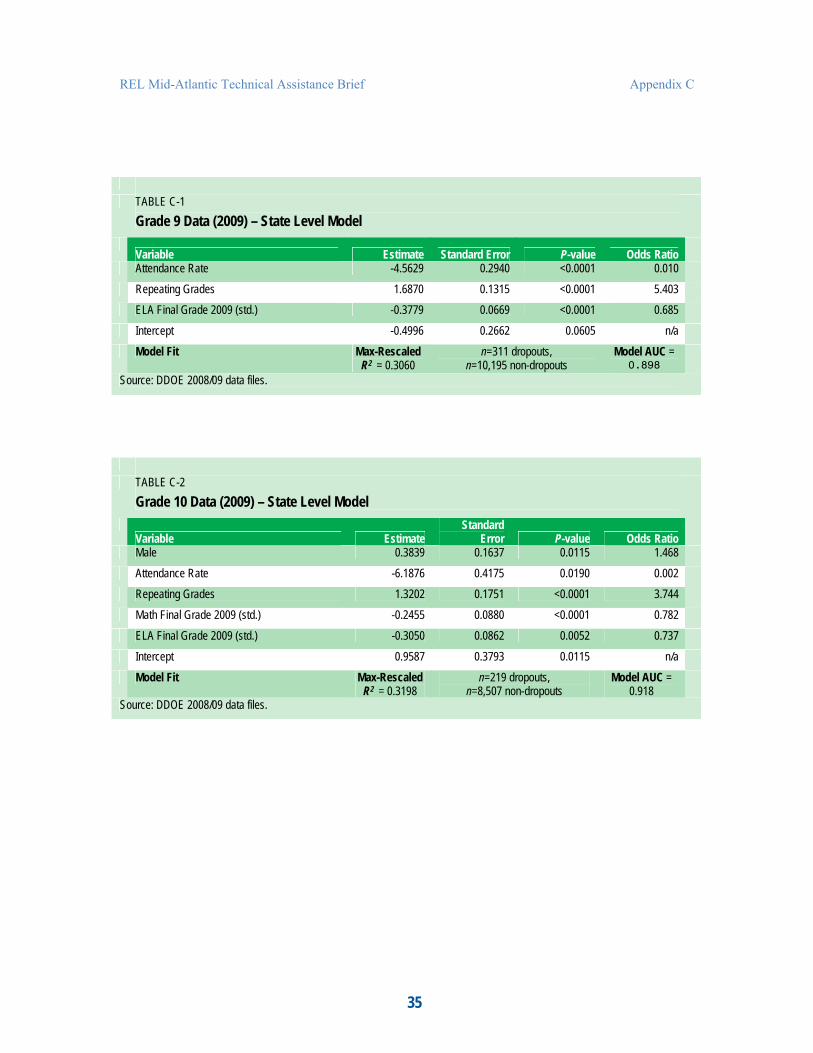
REL Mid-Atlantic Technical Assistance Brief Appendix C
TABLE C-1 Grade 9 Data (2009) – State Level Model
Variable Estimate Standard Error P-value Odds Ratio Attendance Rate -4.5629 0.2940 <0.0001 0.010 Repeating Grades 1.6870 0.1315 <0.0001 5.403 ELA Final Grade 2009 (std.) -0.3779 0.0669 <0.0001 0.685 Intercept -0.4996 0.2662 0.0605 n/a Model Fit Max-Rescaled
R2 = 0.3060 n=311 dropouts,
n=10,195 non-dropouts Model AUC =
0.898
Source: DDOE 2008/09 data files.
TABLE C-2 Grade 10 Data (2009) – State Level Model
Variable Estimate Standard
Error P-value Odds Ratio Male 0.3839 0.1637 0.0115 1.468 Attendance Rate -6.1876 0.4175 0.0190 0.002 Repeating Grades 1.3202 0.1751 <0.0001 3.744 Math Final Grade 2009 (std.) -0.2455 0.0880 <0.0001 0.782 ELA Final Grade 2009 (std.) -0.3050 0.0862 0.0052 0.737 Intercept 0.9587 0.3793 0.0115 n/a Model Fit Max-Rescaled
R2 = 0.3198 n=219 dropouts,
n=8,507 non-dropouts Model AUC =
0.918 Source: DDOE 2008/09 data files.
35
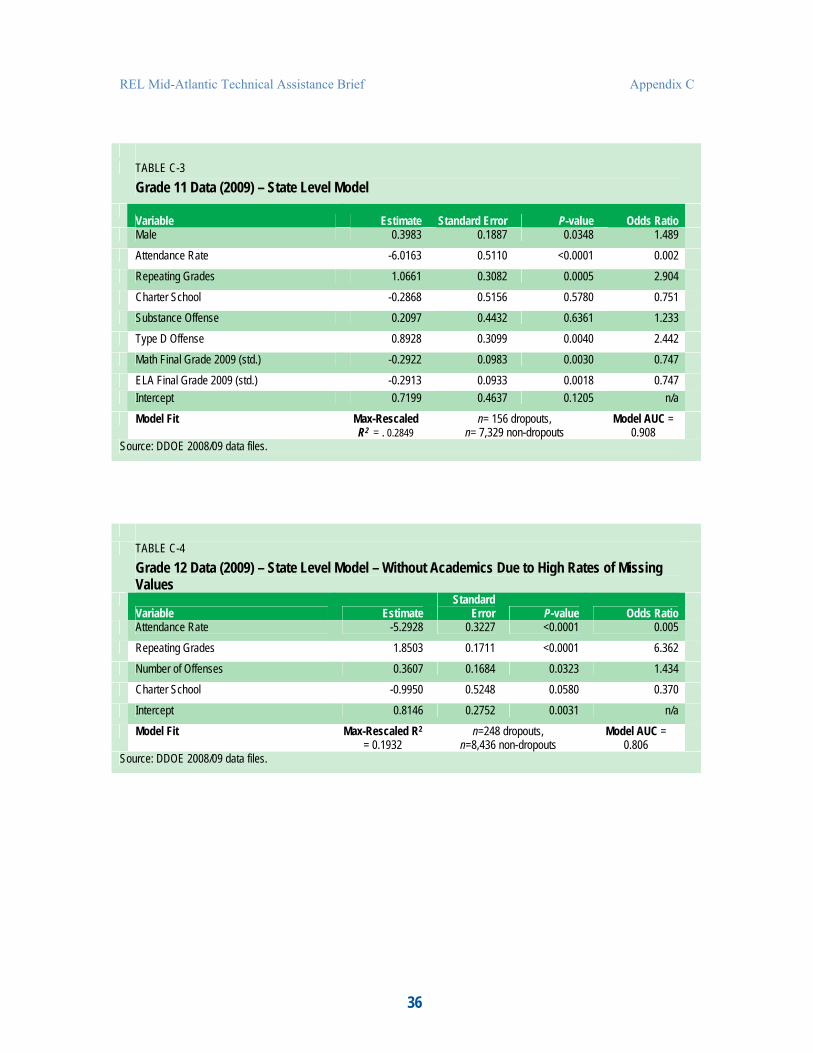
REL Mid-Atlantic Technical Assistance Brief Appendix C
TABLE C-3 Grade 11 Data (2009) – State Level Model
Variable Male
Estimate 0.3983
Standard Error 0.1887
P-value 0.0348
Odds Ratio 1.489
Attendance Rate -6.0163 0.5110 <0.0001 0.002 Repeating Grades 1.0661 0.3082 0.0005 2.904 Charter School -0.2868 0.5156 0.5780 0.751 Substance Offense 0.2097 0.4432 0.6361 1.233 Type D Offense 0.8928 0.3099 0.0040 2.442 Math Final Grade 2009 (std.) -0.2922 0.0983 0.0030 0.747 ELA Final Grade 2009 (std.) Intercept
-0.2913 0.7199
0.0933 0.4637
0.0018 0.1205
0.747 n/a
Model Fit
Source: DDOE 2008/09 data files.
Max-Rescaled R2 = . 0.2849
n= 156 dropouts, n= 7,329 non-dropouts
Model AUC = 0.908
TABLE C-4 Grade 12 Data (2009) – State Level Model – Without Academics Due to High Rates of Missing Values
Variable Estimate Standard
Error P-value Odds Ratio Attendance Rate -5.2928 0.3227 <0.0001 0.005 Repeating Grades 1.8503 0.1711 <0.0001 6.362 Number of Offenses 0.3607 0.1684 0.0323 1.434 Charter School -0.9950 0.5248 0.0580 0.370 Intercept 0.8146 0.2752 0.0031 n/a Model Fit Max-Rescaled R2
= 0.1932 n=248 dropouts,
n=8,436 non-dropouts Model AUC =
0.806 Source: DDOE 2008/09 data files.
36

REL Mid-Atlantic Technical Assistance Brief Appendix D
Appendix D Robustness of Cut Points
To evaluate the robustness of the ROC curve results, cut points derived from the 2009 data set were tested by using them with the older data sets from 2008. Only the robustness of math and ELA grade scores were tested because absence rate was available only for the 2008/09 database. The earlier analysis also showed that student behavior information was not a strong predictor of student dropout.
The 2008/09 cut points were -0.46 for ELA grade score and -0.63 for math grade score. Applying these thresholds values to the 2007/08 data set, the number of subjects for the following four groups were derived:
a) Students at risk and dropped out
b) Students not at risk and dropped out
c) Students at risk and did not dropout
d) Students not at risk and did not dropout
Based on the counts of subjects in these four groups, true positive and true negative values were derived. The results were very similar to the ROC curve results obtained. This shows that the derived cut points are robust.
TABLE D-1 Evaluating the Robustness of the 2008/09 Cut Point Based on the 2007/08 Database
ELA
(a) At-risk & Dropped out
717
(b) Not-at-risk & Dropped out
245
(c) At-risk & Did not dropout
8,474
(d) Not at-risk & Did not
dropout 27,121
True Positive [a/(a+b)] 74.53%
True Negative [d/(c+d)] 76.19%
Math 657 200 10,288 23,499 76.66% 69.55%Source: DDOE 2008/09 data files.
37
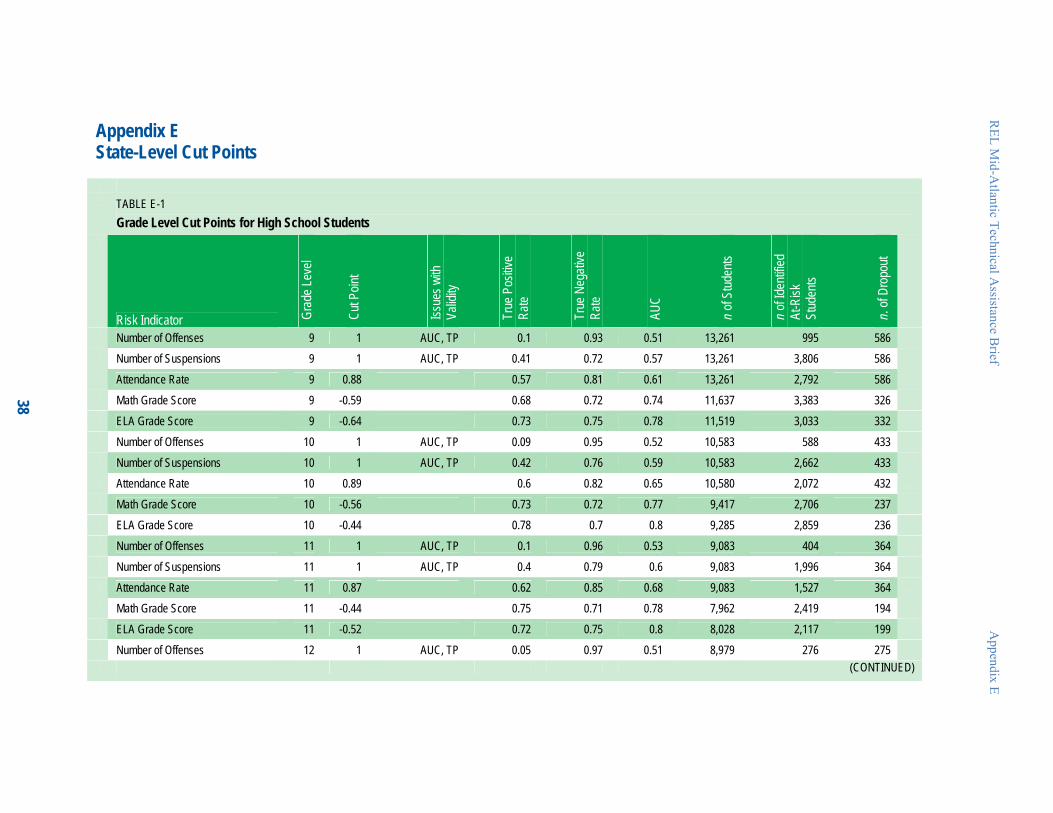
Appendix E State-Level Cut Points
TABLE E-1 Grade Level Cut Points for High School Students
Grad
e Lev
el
Issue
s with
True
Pos
itive
True
Neg
ative
nts
fied
out
Risk Indicator Cut P
oint
Valid
ity
Rate
Rate
AUC
n of S
tude
n of Id
enti
At-R
iskSt
uden
ts
. of D
rop
n
Number of Offenses 9 1 AUC, TP 0.1 0.93 0.51 13,261 995 586 Number of Suspensions 9 1 AUC, TP 0.41 0.72 0.57 13,261 3,806 586 Attendance Rate 9 0.88 0.57 0.81 0.61 13,261 2,792 586 Math Grade Score 9 -0.59 0.68 0.72 0.74 11,637 3,383 326ELA Grade Score 9 -0.64 0.73 0.75 0.78 11,519 3,033 332 Number of Offenses 10 1 AUC, TP 0.09 0.95 0.52 10,583 588 433 Number of Suspensions 10 1 AUC, TP 0.42 0.76 0.59 10,583 2,662 433 Attendance Rate 10 0.89 0.6 0.82 0.65 10,580 2,072 432 Math Grade Score 10 -0.56 0.73 0.72 0.77 9,417 2,706 237 ELA Grade Score 10 -0.44 0.78 0.7 0.8 9,285 2,859 236 Number of Offenses 11 1 AUC, TP 0.1 0.96 0.53 9,083 404 364 Number of Suspensions 11 1 AUC, TP 0.4 0.79 0.6 9,083 1,996 364 Attendance Rate 11 0.87 0.62 0.85 0.68 9,083 1,527 364 Math Grade Score 11 -0.44 0.75 0.71 0.78 7,962 2,419 194 ELA Grade Score 11 -0.52 0.72 0.75 0.8 8,028 2,117 199 Number of Offenses 12 1 AUC, TP 0.05 0.97 0.51 8,979 276 275
(CONTINUED)
38
REL M
id-Atlantic Technical A
ssistance Brief
Appendix E
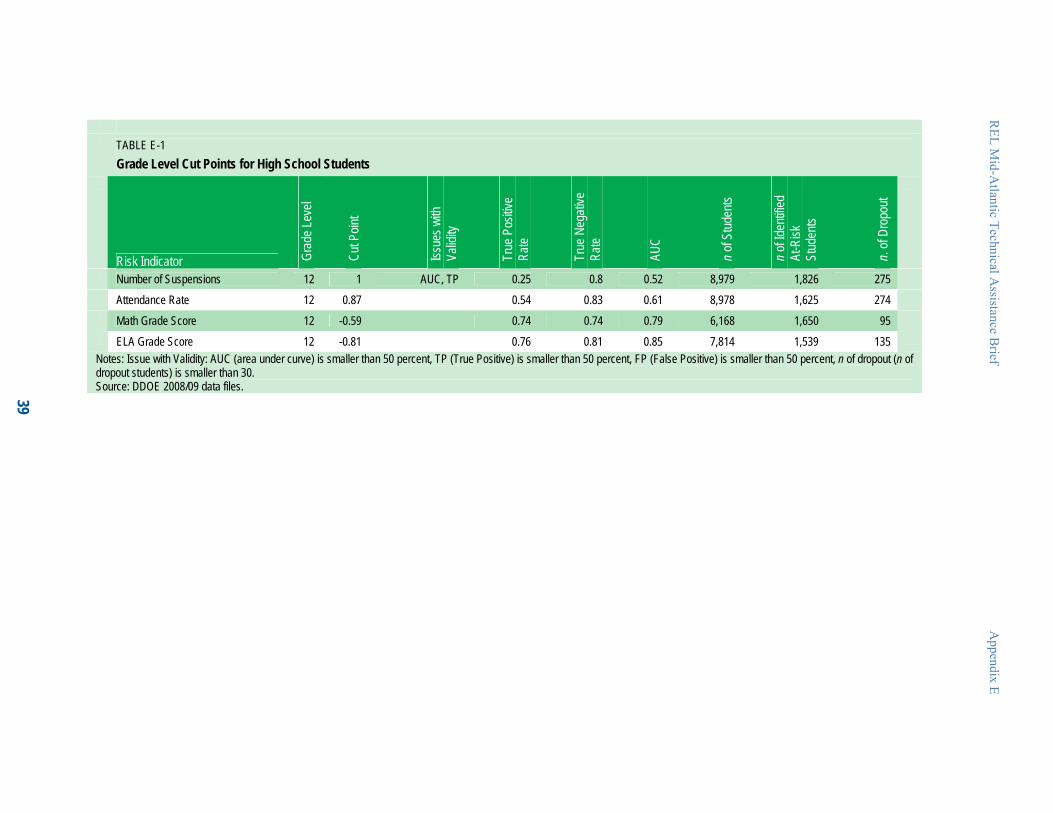
REL M
id-Atlantic Technical A
ssistance Brief
Appendix E
TABLE E-1 Grade Level Cut Points for High School Students
Grad
e Lev
el
Issue
s with
True
Pos
itive
True
Neg
ative
nts
fied
out
Risk Indicator Cut P
oint
Valid
ity
Rate
Rate
AUC
n of S
tude
n of Id
enti
At-R
iskSt
uden
ts
. of D
rop
n
Number of Suspensions 12 1 AUC, TP 0.25 0.8 0.52 8,979 1,826 275 Attendance Rate 12 0.87 0.54 0.83 0.61 8,978 1,625 274 Math Grade Score 12 -0.59 0.74 0.74 0.79 6,168 1,650 95 ELA Grade Score 12 -0.81 0.76 0.81 0.85 7,814 1,539 135
Notes: Issue with Validity: AUC (area under curve) is smaller than 50 percent, TP (True Positive) is smaller than 50 percent, FP (False Positive) is smaller than 50 percent, n of dropout (n of dropout students) is smaller than 30. Source: DDOE 2008/09 data files. 39
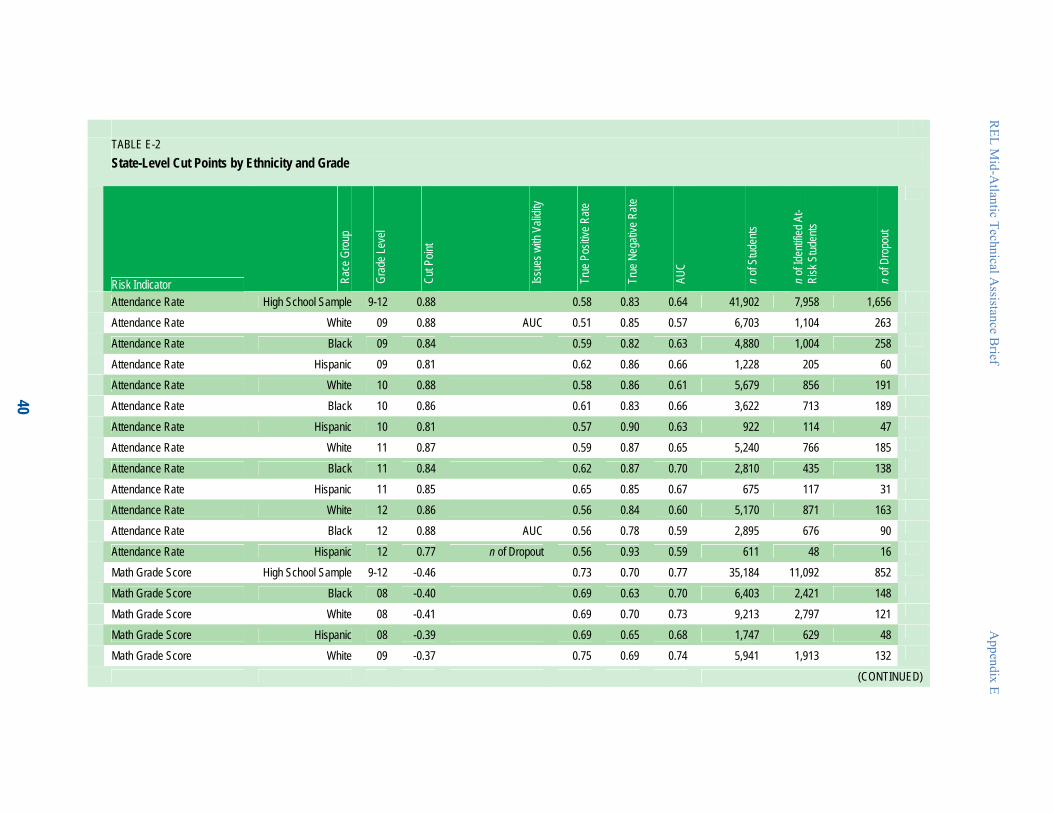
REL M
id-Atlantic Technical A
ssistance Brief
Appendix E
40
TABLE E-2 State-Level Cut Points by Ethnicity and Grade
idity
Rate
e
d At-
Risk Indicator Race
Gro
up
Grad
e Lev
el
Cut P
oint
Issue
s with
Val
True
Pos
itive
True
Neg
ative
Rat
AUC
n of S
tuden
ts
n of Id
entifi
eRi
sk S
tuden
ts
n of D
ropo
ut
Attendance Rate High School Sample 9-12 0.88 0.58 0.83 0.64 41,902 7,958 1,656 Attendance Rate White 09 0.88 AUC 0.51 0.85 0.57 6,703 1,104 263 Attendance Rate Black 09 0.84 0.59 0.82 0.63 4,880 1,004 258 Attendance Rate Hispanic 09 0.81 0.62 0.86 0.66 1,228 205 60 Attendance Rate White 10 0.88 0.58 0.86 0.61 5,679 856 191 Attendance Rate Black 10 0.86 0.61 0.83 0.66 3,622 713 189 Attendance Rate Hispanic 10 0.81 0.57 0.90 0.63 922 114 47 Attendance Rate White 11 0.87 0.59 0.87 0.65 5,240 766 185 Attendance Rate Black 11 0.84 0.62 0.87 0.70 2,810 435 138 Attendance Rate Hispanic 11 0.85 0.65 0.85 0.67 675 117 31 Attendance Rate White 12 0.86 0.56 0.84 0.60 5,170 871 163 Attendance Rate Black 12 0.88 AUC 0.56 0.78 0.59 2,895 676 90 Attendance Rate Hispanic 12 0.77 n of Dropout 0.56 0.93 0.59 611 48 16 Math Grade Score High School Sample 9-12 -0.46 0.73 0.70 0.77 35,184 11,092 852Math Grade Score Black 08 -0.40 0.69 0.63 0.70 6,403 2,421 148 Math Grade Score White 08 -0.41 0.69 0.70 0.73 9,213 2,797 121 Math Grade Score Hispanic 08 -0.39 0.69 0.65 0.68 1,747 629 48 Math Grade Score White 09 -0.37 0.75 0.69 0.74 5,941 1,913 132
(CONTINUED)

REL M
id-Atlantic Technical A
ssistance Brief
Appendix E
41
TABLE E-2 STATE-LEVEL CUT POINTS BY ETHNICITY AND GRADE
Race
Gro
up
Grad
e Lev
el
Issue
s with
True
Pos
itive
True
Neg
ative
ents
tified
opo u
t
Risk Indicator Cut P
oint
Valid
ity
Rate
Rate
AUC
n of S
tud
n of Id
enAt
-Risk
St
uden
ts
n of D
r
Math Grade Score Black 09 -0.59 0.70 0.68 0.73 4,229 1,427 149 Math Grade Score Hispanic 09 -0.35 0.76 0.62 0.70 1,098 431 41 Math Grade Score White 10 -0.57 0.73 0.75 0.80 5,125 1,322 108 Math Grade Score Black 10 -0.56 0.74 0.68 0.75 3,169 1,041 100 Math Grade Score Hispanic 10 -0.60 n of Dropout 0.69 0.69 0.71 827 266 26 Math Grade Score White 11 -0.42 0.76 0.72 0.79 4,685 1,381 102 Math Grade Score Black 11 -0.47 0.75 0.68 0.77 2,424 809 72 Math Grade Score Hispanic 11 -0.84 n of Dropout 0.79 0.82 0.80 586 116 14 Math Grade Score White 12 -0.63 0.65 0.76 0.76 3,508 856 54 Math Grade Score Black 12 -0.78 0.79 0.79 0.83 2,035 445 33 Math Grade Score Hispanic 12 n of Dropout 0.80 0.83 0.80 411 71 5 ELA Grade Score High School Sample 9-12 -0.63 0.73 0.76 0.80 36,646 9,161 902ELA Grade Score Black 08 -0.44 0.74 0.65 0.72 5,996 2,171 135 ELA Grade Score White 08 -0.46 0.69 0.74 0.77 8,854 2361 107 ELA Grade Score Hispanic 08 -0.48 0.73 0.67 0.74 1,638 563 45 ELA Grade Score White 09 -0.44 0.78 0.72 0.80 5,900 1,694 132 ELA Grade Score Black 09 -0.64 0.78 0.71 0.76 4,210 1,294 158 ELA Grade Score Hispanic 09 -0.25 0.82 0.59 0.73 1,076 453 38 ELA Grade Score White 10 -0.47 0.79 0.74 0.81 5,101 1,400 107 ELA Grade Score Black 10 -0.37 0.83 0.65 0.78 3,161 1,168 103
(CONTINUED)
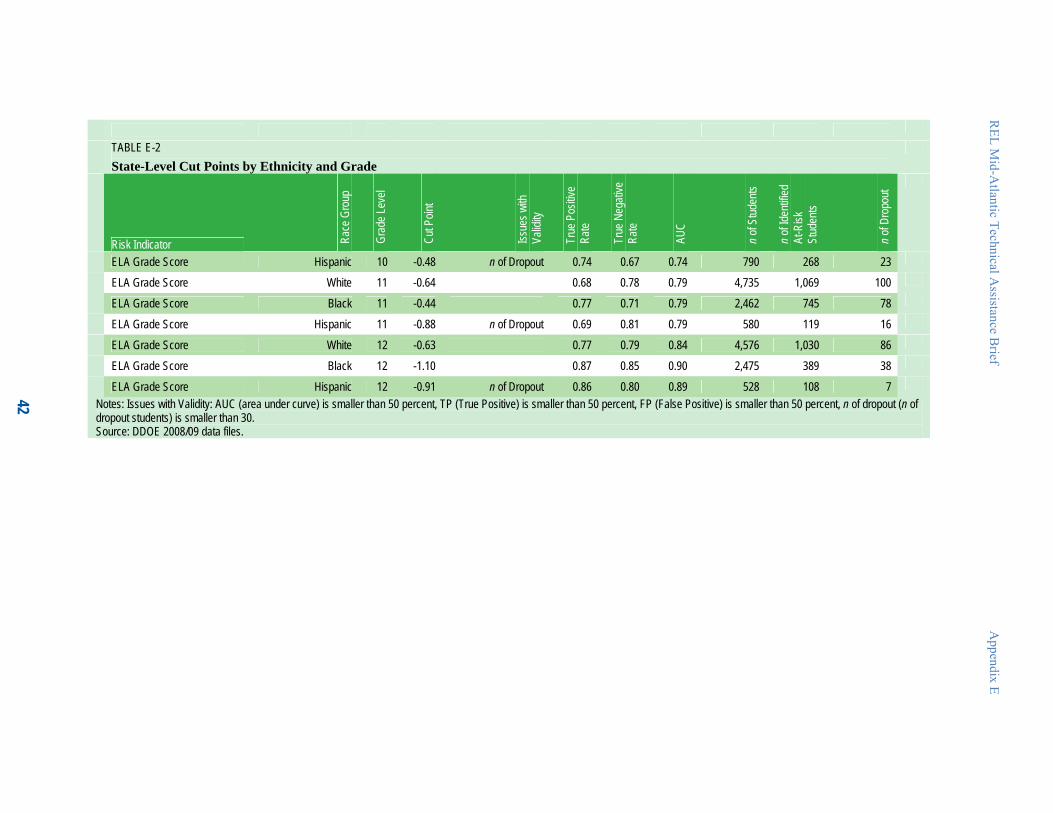
REL M
id-Atlantic Technical A
ssistance Brief
Appendix E
42
TABLE E-2 State-Level Cut Points by Ethnicity and Grade
Race
Gro
up
Grad
e Lev
el
Cut P
oint
Issue
s with
True
Pos
itive
True
Neg
ative
uden
ts
ntifie
d
Stud
ents
ut
Risk Indicator Valid
ity
Rate
Rate
AUC
n of S
t
n of Id
eAt
-Risk
on o
f Dr
po
ELA Grade Score Hispanic 10 -0.48 n of Dropout 0.74 0.67 0.74 790 268 23 ELA Grade Score White 11 -0.64 0.68 0.78 0.79 4,735 1,069 100 ELA Grade Score Black 11 -0.44 0.77 0.71 0.79 2,462 745 78 ELA Grade Score Hispanic 11 -0.88 n of Dropout 0.69 0.81 0.79 580 119 16 ELA Grade Score White 12 -0.63 0.77 0.79 0.84 4,576 1,030 86 ELA Grade Score Black 12 -1.10 0.87 0.85 0.90 2,475 389 38 ELA Grade Score Hispanic 12 -0.91 n of Dropout 0.86 0.80 0.89 528 108 7
Notes: Issues with Validity: AUC (area under curve) is smaller than 50 percent, TP (True Positive) is smaller than 50 percent, FP (False Positive) is smaller than 50 percent, n of dropout (n of dropout students) is smaller than 30. Source: DDOE 2008/09 data files.
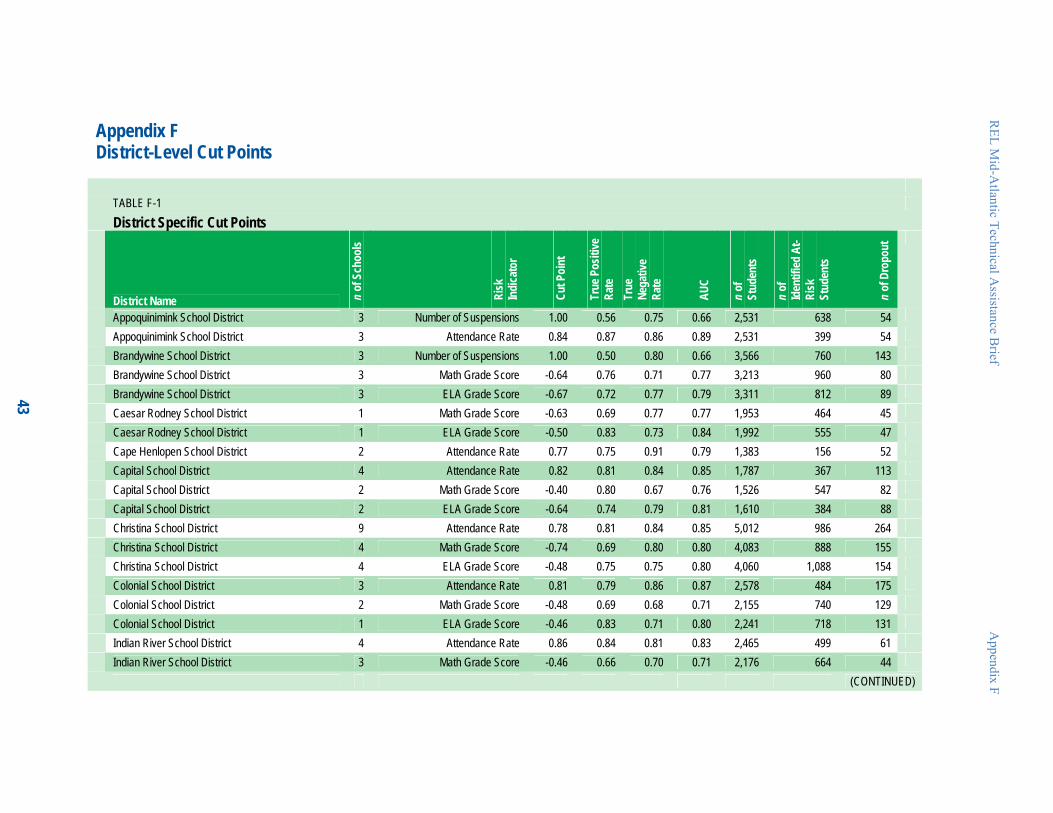
Appendix F District-Level Cut Points
TABLE F-1 District Specific Cut Points
oo r
Cut P
oint
True
Pos
itive
Iden
tified
At-
pout
District Name n of
Sch
ls
Risk
Indi
cato
Rate
True
Nega
tive
Rate
AUC
n of
Stud
ents
n of
Risk
Stud
ents
n of
Dro
Appoquinimink School District 3 Number of Suspensions 1.00 0.56 0.75 0.66 2,531 638 54 Appoquinimink School District 3 Attendance Rate 0.84 0.87 0.86 0.89 2,531 399 54 Brandywine School District 3 Number of Suspensions 1.00 0.50 0.80 0.66 3,566 760 143 Brandywine School District 3 Math Grade Score -0.64 0.76 0.71 0.77 3,213 960 80 Brandywine School District 3 ELA Grade Score -0.67 0.72 0.77 0.79 3,311 812 89 Caesar Rodney School District 1 Math Grade Score -0.63 0.69 0.77 0.77 1,953 464 45 Caesar Rodney School District 1 ELA Grade Score -0.50 0.83 0.73 0.84 1,992 555 47 Cape Henlopen School District 2 Attendance Rate 0.77 0.75 0.91 0.79 1,383 156 52 Capital School District 4 Attendance Rate 0.82 0.81 0.84 0.85 1,787 367 113 Capital School District 2 Math Grade Score -0.40 0.80 0.67 0.76 1,526 547 82 Capital School District 2 ELA Grade Score -0.64 0.74 0.79 0.81 1,610 384 88 Christina School District 9 Attendance Rate 0.78 0.81 0.84 0.85 5,012 986 264 Christina School District 4 Math Grade Score -0.74 0.69 0.80 0.80 4,083 888 155 Christina School District 4 ELA Grade Score -0.48 0.75 0.75 0.80 4,060 1,088 154 Colonial School District 3 Attendance Rate 0.81 0.79 0.86 0.87 2,578 484 175 Colonial School District 2 Math Grade Score -0.48 0.69 0.68 0.71 2,155 740 129 Colonial School District 1 ELA Grade Score -0.46 0.83 0.71 0.80 2,241 718 131 Indian River School District 4 Attendance Rate 0.86 0.84 0.81 0.83 2,465 499 61 Indian River School District 3 Math Grade Score -0.46 0.66 0.70 0.71 2,176 664 44
(CONTINUED)
REL M
id-Atlantic Technical A
ssistance Brief
Appendix F
43
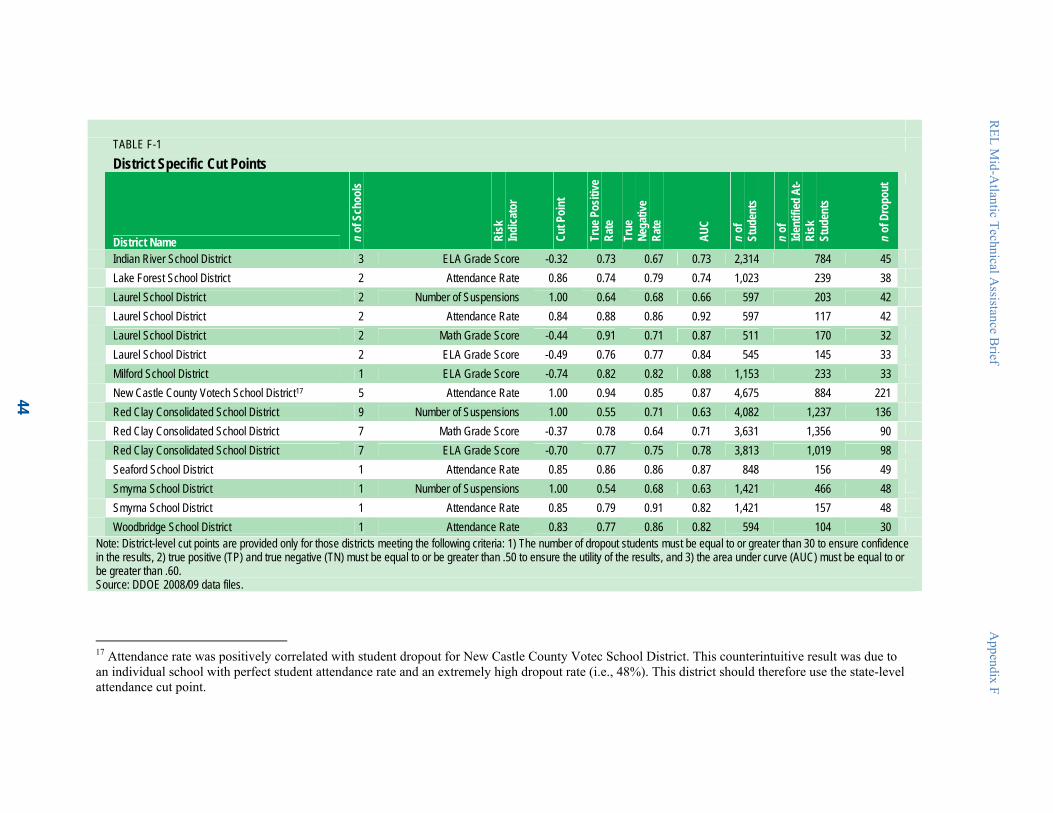
REL M
id-Atlantic Technical A
ssistance Brief
Appendix F
44
TABLE F-1 District Specific Cut Points
ools
r
Cut P
oint
True
Pos
itive
Iden
tified
At-
pout
District Name n of
Sch
Risk
Indi
cato
Rate
True
Nega
tive
Rate
AUC
n of
Stud
ents
n of
Risk
Stud
ents
n of
Dro
Indian River School District 3 ELA Grade Score -0.32 0.73 0.67 0.73 2,314 784 45 Lake Forest School District 2 Attendance Rate 0.86 0.74 0.79 0.74 1,023 239 38 Laurel School District 2 Number of Suspensions 1.00 0.64 0.68 0.66 597 203 42 Laurel School District 2 Attendance Rate 0.84 0.88 0.86 0.92 597 117 42 Laurel School District 2 Math Grade Score -0.44 0.91 0.71 0.87 511 170 32 Laurel School District 2 ELA Grade Score -0.49 0.76 0.77 0.84 545 145 33 Milford School District 1 ELA Grade Score -0.74 0.82 0.82 0.88 1,153 233 33 New Castle County Votech School District17 5 Attendance Rate 1.00 0.94 0.85 0.87 4,675 884 221 Red Clay Consolidated School District 9 Number of Suspensions 1.00 0.55 0.71 0.63 4,082 1,237 136 Red Clay Consolidated School District 7 Math Grade Score -0.37 0.78 0.64 0.71 3,631 1,356 90 Red Clay Consolidated School District 7 ELA Grade Score -0.70 0.77 0.75 0.78 3,813 1,019 98 Seaford School District 1 Attendance Rate 0.85 0.86 0.86 0.87 848 156 49 Smyrna School District 1 Number of Suspensions 1.00 0.54 0.68 0.63 1,421 466 48 Smyrna School District 1 Attendance Rate 0.85 0.79 0.91 0.82 1,421 157 48 Woodbridge School District 1 Attendance Rate 0.83 0.77 0.86 0.82 594 104 30
ote: District-level cut points are provided only for thoN se districts meeting the following criteria: 1) The number of dropout students must be equal to or greater than 30 to ensur e e confidencn the results, 2) true positive (TP) and true negative (Ti N) must be equal to or be greater than .50 to ensure the utility of the results, and 3) the area under curve (AUC) must be equal to ore greater than .60. bource: DDOE 2008/09 data files. S
17 Attendance rate was positively correlated with student dropout for New Castle County Votec School District. This counterintuitive result was due to an individual school with perfect student attendance rate and an extremely high dropout rate (i.e., 48%). This district should therefore use the state-level attendance cut point.
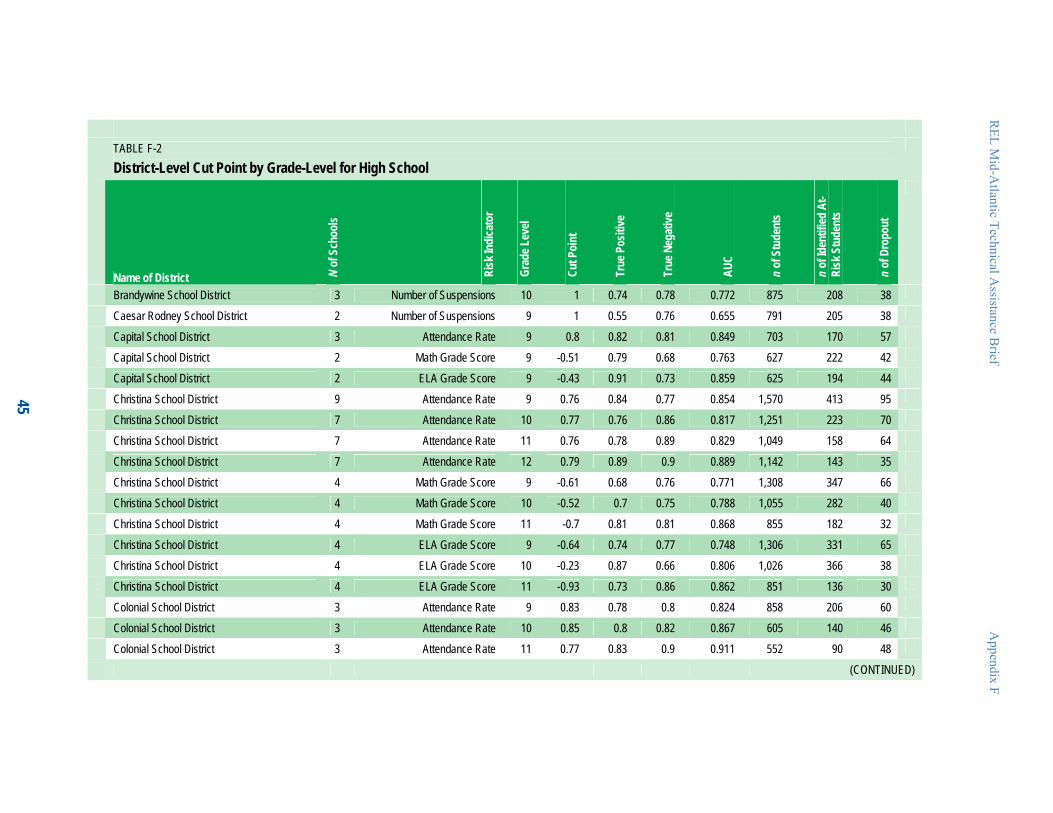
REL M
id-Atlantic Technical A
ssistance Brief
Appendix F
45
TABLE F-2 District-Level Cut Point by Grade-Level for High School
s
icato
r ve
t
ntifi
ed A
t-
t
Name of District N of
l
Scho
o
Risk
Ind
Grad
e ve
Lel
Cut P
oint
True
Pos
itive
True
Neg
ati
AUC
n of
Stu
den
s
n of
Ide
Risk
e
Stud
nts
n of
Dro
pou
Brandywine School District 3 Number of Suspensions 10 1 0.74 0.78 0.772 875 208 38 Caesar Rodney School District 2 Number of Suspensions 9 1 0.55 0.76 0.655 791 205 38 Capital School District 3 Attendance Rate 9 0.8 0.82 0.81 0.849 703 170 57 Capital School District 2 Math Grade Score 9 -0.51 0.79 0.68 0.763 627 222 42 Capital School District 2 ELA Grade Score 9 -0.43 0.91 0.73 0.859 625 194 44 Christina School District 9 Attendance Rate 9 0.76 0.84 0.77 0.854 1,570 413 95 Christina School District 7 Attendance Rate 10 0.77 0.76 0.86 0.817 1,251 223 70 Christina School District 7 Attendance Rate 11 0.76 0.78 0.89 0.829 1,049 158 64 Christina School District 7 Attendance Rate 12 0.79 0.89 0.9 0.889 1,142 143 35 Christina School District 4 Math Grade Score 9 -0.61 0.68 0.76 0.771 1,308 347 66 Christina School District 4 Math Grade Score 10 -0.52 0.7 0.75 0.788 1,055 282 40 Christina School District 4 Math Grade Score 11 -0.7 0.81 0.81 0.868 855 182 32 Christina School District 4 ELA Grade Score 9 -0.64 0.74 0.77 0.748 1,306 331 65 Christina School District 4 ELA Grade Score 10 -0.23 0.87 0.66 0.806 1,026 366 38 Christina School District 4 ELA Grade Score 11 -0.93 0.73 0.86 0.862 851 136 30 Colonial School District 3 Attendance Rate 9 0.83 0.78 0.8 0.824 858 206 60 Colonial School District 3 Attendance Rate 10 0.85 0.8 0.82 0.867 605 140 46 Colonial School District 3 Attendance Rate 11 0.77 0.83 0.9 0.911 552 90 48
(CONTINUED)

REL M
id-Atlantic Technical A
ssistance Brief
Appendix F
46
TABLE F-2 District-Level Cut Point by Grade-Level for High School
s
icato
r l ve
t
ntifi
ed A
t-
t
Name of District N of
Sch
ool
Risk
Ind
Grad
e ve
Le
Cut P
oint
True
Pos
itive
True
Neg
ati
AUC
n of
Stu
den
s
n of
Ide
Risk
Stu
dent
s
n of
Dro
pou
Colonial School District 2 Math Grade Score 9 -0.34 0.78 0.62 0.693 757 310 50 Colonial School District 2 Math Grade Score 10 -0.51 0.74 0.69 0.737 539 181 34 Colonial School District 2 Math Grade Score 11 -0.46 0.62 0.7 0.667 474 153 34 Colonial School District 1 ELA Grade Score 9 -0.72 0.73 0.75 0.768 735 209 48 Colonial School District 1 ELA Grade Score 10 -0.59 0.84 0.78 0.792 531 138 32 Colonial School District 1 ELA Grade Score 11 -0.39 0.79 0.76 0.769 467 128 33 New Castle County Votech School District 5 Attendance Rate 9 1 0.96 0.82 0.883 1,413 303 69 Red Clay Consolidated School District 8 Number of Suspensions 10 1 0.5 0.71 0.611 1,062 315 38 Red Clay Consolidated School District 7 Math Grade Score 9 -0.2 0.82 0.59 0.661 1,236 521 45 Red Clay Consolidated School District 7 ELA Grade Score 9 -0.7 0.67 0.75 0.723 1,243 333 48
Note: District-level cut points are provided only for those districts meeting the following criteria: 1) The number of dropout students must be equal to or greater than 30 to ensure confidence in the results, 2) true positive (TP) and true negative (TN) must be equal to or be greater than .50 to ensure the utility of the results, and 3) the area under curve (AUC) must be equal to or be greater than .60. Source: DDOE 2008/09 data files.
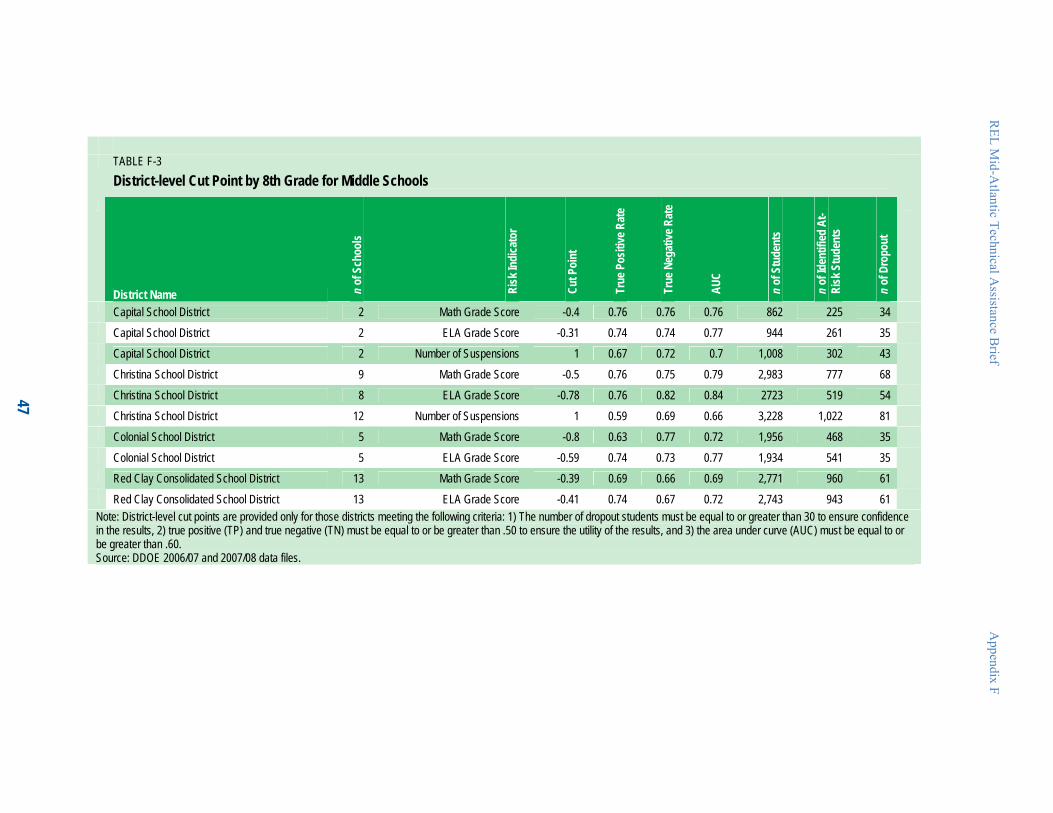
REL M
id-Atlantic Technical A
ssistance Brief
Appendix F
47
TABLE F-3 District-level Cut Point by 8th Grade for Middle Schools
e Rat
e
s ed A
t-ts
t
District Name
ln
of S
choo
s
Risk
Indi
cato
r
Cut P
oint
True
Pos
itiv
True
Neg
ative
Rat
e
AUC
n of
t
Stud
en ntifi
n of
Ide
Risk
en
Stud
n of
Dro
pou
Capital School District 2 Math Grade Score -0.4 0.76 0.76 0.76 862 225 34 Capital School District 2 ELA Grade Score -0.31 0.74 0.74 0.77 944 261 35 Capital School District 2 Number of Suspensions 1 0.67 0.72 0.7 1,008 302 43 Christina School District 9 Math Grade Score -0.5 0.76 0.75 0.79 2,983 777 68 Christina School District 8 ELA Grade Score -0.78 0.76 0.82 0.84 2723 519 54 Christina School District 12 Number of Suspensions 1 0.59 0.69 0.66 3,228 1,022 81 Colonial School District 5 Math Grade Score -0.8 0.63 0.77 0.72 1,956 468 35 Colonial School District 5 ELA Grade Score -0.59 0.74 0.73 0.77 1,934 541 35 Red Clay Consolidated School District 13 Math Grade Score -0.39 0.69 0.66 0.69 2,771 960 61 Red Clay Consolidated School District 13 ELA Grade Score -0.41 0.74 0.67 0.72 2,743 943 61
ote: District-level cut points are provided only for those districts meeting the following criteria: 1) The number of dropout students must be equal to or greater than 30 to ensure confidence the results, 2) true positive (TP) and true negative (TN) must be equal to or be greater than .50 to ensure the utility of the results, and 3) the area under curve (AUC) must be equal to or e greater than .60. ource: DDOE 2006/07 and 2007/08 data files.
NinbS