creating a market-based compensation structure · the three compensation philosophies •market...
TRANSCRIPT

Creating a Market-Based Compensation Structure
Lara Salazar, SPHR

Learning Objectives
• Understanding that compensation is both an art and a science
• Understanding salary ranges, placement and movement on a grid
• Understand and communicate about pay systems to work more effectively with:
– Compensation Consultant
– Staff
– Managers
– Board members
“Compensation is partly art and partly science.”From SHRM article “Building a Market-Based Pay Structure from Scratch”, Rajiv Burman (principle author), SPHR, CHRP, CCP, CEB, VP HR Griffith Labs, USA, July, 2010

Overview
Disclaimer!
The CHAMPS survey – a
beautiful tool
Market based compensation
method
Getting started
Design your compensation
grid
Updating your grid between
surveys

Disclaimer
• Senior Professional of Human Resources (SPHR) certified.
• I am not a compensation specialist
• Studied and practiced designing simple compensation structures.
• Worked with a compensation specialist.

Market-Based Compensation
Structure Introduction
Steps:
1. Gather Background Information
2. Selecting data from relevant market
3. Conducting market data analysis
4. Developing the pay structures
5. Calculating the costs of pay structures
6. Implementation and evaluation
Gather BackgroundInformation
Selecting and Preparing Data
ConductingMarket Data Analysis
Developing Pay Structures
Calculating Cost of Pay Structures
Implementation and Evaluation

Gather BackgroundInformation
Selecting and Preparing Data
ConductingMarket Data Analysis
Developing Pay Structures
Calculating Cost of Pay Structures
Implementation and Evaluation
1. Start by Gathering
Background Information
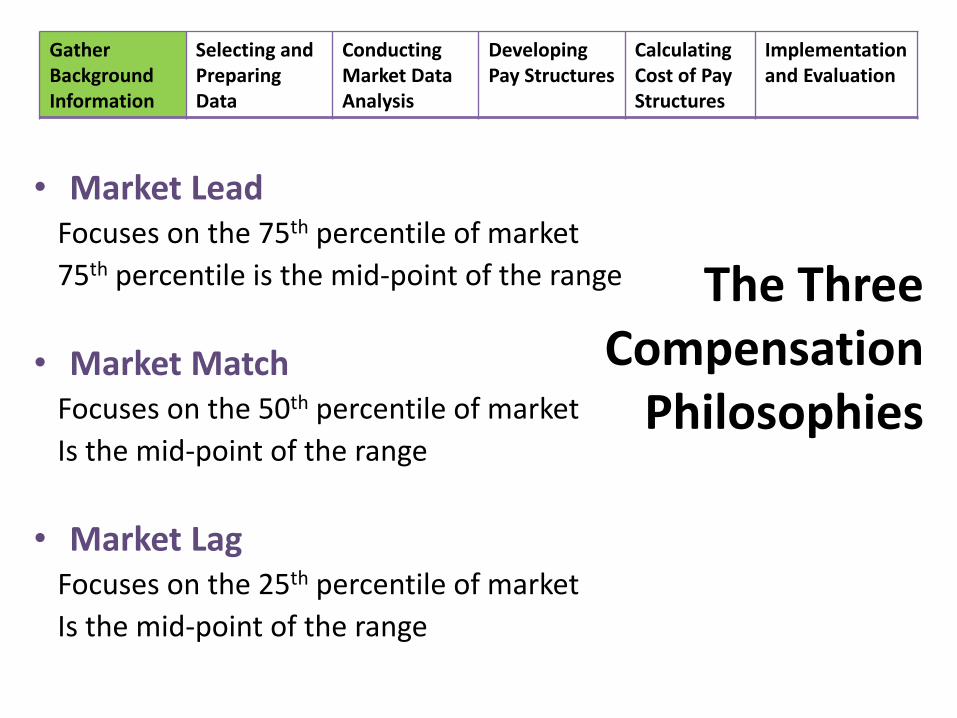
The Three Compensation
Philosophies
• Market LeadFocuses on the 75th percentile of market
75th percentile is the mid-point of the range
• Market MatchFocuses on the 50th percentile of market
Is the mid-point of the range
• Market LagFocuses on the 25th percentile of market
Is the mid-point of the range
Gather BackgroundInformation
Selecting and Preparing Data
ConductingMarket Data Analysis
Developing Pay Structures
Calculating Cost of Pay Structures
Implementation and Evaluation

2. Selecting Sources of
External Market Data & Preparing
the Data
• Determine your relevant market.– Industry– Budget– Geography– Most position matches
• Collect a survey or surveys.
• Salary survey examples: – CHAMPS Regional– CHAMPS State (additional purchase)– Bureau of Labor Standards (free)– MGMA– SHRM
Gather BackgroundInformation
Selecting and Preparing Data
ConductingMarket Data Analysis
Developing Pay Structures
Calculating Cost of Pay Structures
Implementation and Evaluation
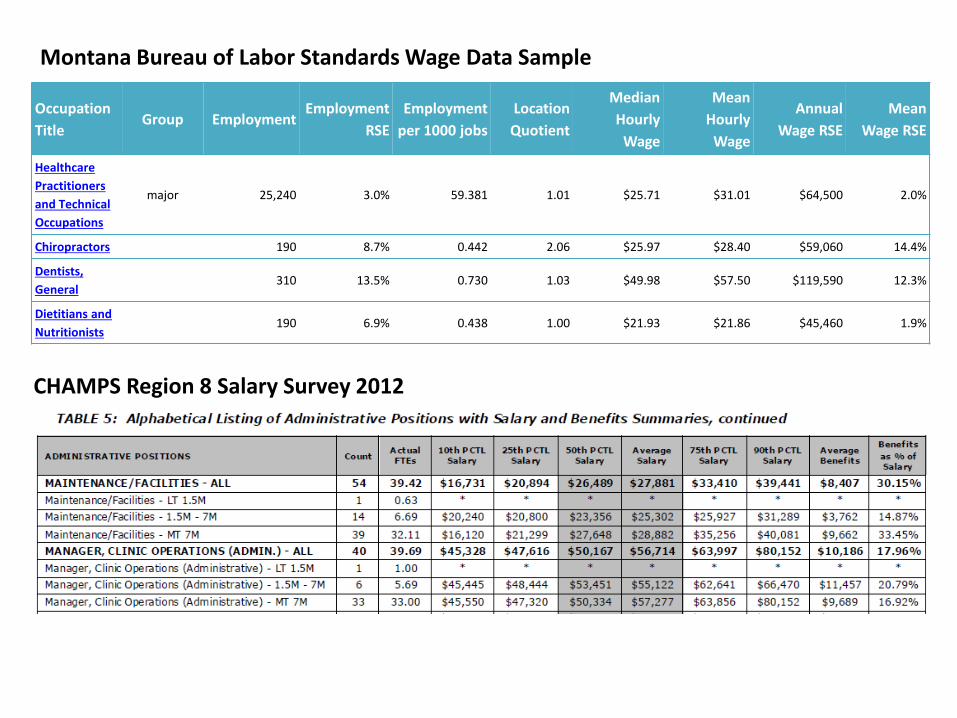
Montana Bureau of Labor Standards Wage Data Sample
Occupation
TitleGroup Employment
Employment
RSE
Employment
per 1000 jobs
Location
Quotient
Median
Hourly
Wage
Mean
Hourly
Wage
Annual
Wage RSE
Mean
Wage RSE
Healthcare
Practitioners
and Technical
Occupations
major 25,240 3.0% 59.381 1.01 $25.71 $31.01 $64,500 2.0%
Chiropractors 190 8.7% 0.442 2.06 $25.97 $28.40 $59,060 14.4%
Dentists,
General310 13.5% 0.730 1.03 $49.98 $57.50 $119,590 12.3%
Dietitians and
Nutritionists190 6.9% 0.438 1.00 $21.93 $21.86 $45,460 1.9%
CHAMPS Region 8 Salary Survey 2012
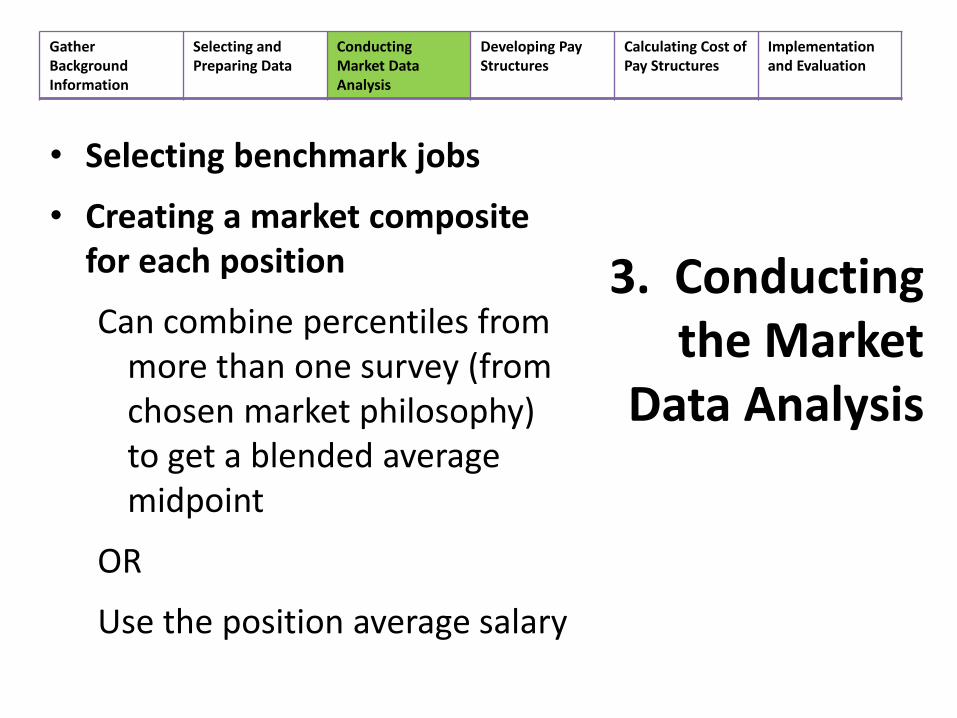
3. Conducting the Market
Data Analysis
• Selecting benchmark jobs
• Creating a market composite for each position
Can combine percentiles from more than one survey (from chosen market philosophy) to get a blended average midpoint
OR
Use the position average salary
Gather BackgroundInformation
Selecting and Preparing Data
ConductingMarket Data Analysis
Developing Pay Structures
Calculating Cost of Pay Structures
Implementation and Evaluation

Benchmarking Jobs Example
Using CHAMPS Salary Surveys
Job Title
Surveys for
Appropriate
Market
(BLS for
comparison only,
not included in
aging or
averages)
Percentiles
CHAMPS Regional
2012
MT Trim Mean
Aged 2010 6%
(Budgets 1-7 Mil or
average if not
enough data
available)
25the
Percentile
Mid-point
(lag)
50th Percentile
Midpoint
(match/meet)
75th
Percentile
Midpoint
(lead)
Average Salary
for Budget
Category
Living Wage for
Flathead County
http://livingwage.mit.edu
/
One Adult, One Child =
$17.16 per hour
One Adult = $7.49
MA
CHAMPS Regional 24241 28059 31533 27,011 35,713
CHAMPS MT 28044 15,579
BLS Montana 29140
Receptionists
CHAMPS Regional 23920 26100 28080 26,075
35,71
3
CHAMPS MT 26834 15,579
BLS Montana 28240
Admin. Assist. 25328 27148 30711 28,084
CHAMPS Regional 35,713
CHAMPS MT 25270 15,579
BLS Montana 26020
You can use the percentiles, the average salary, or a blend of
survey salaries
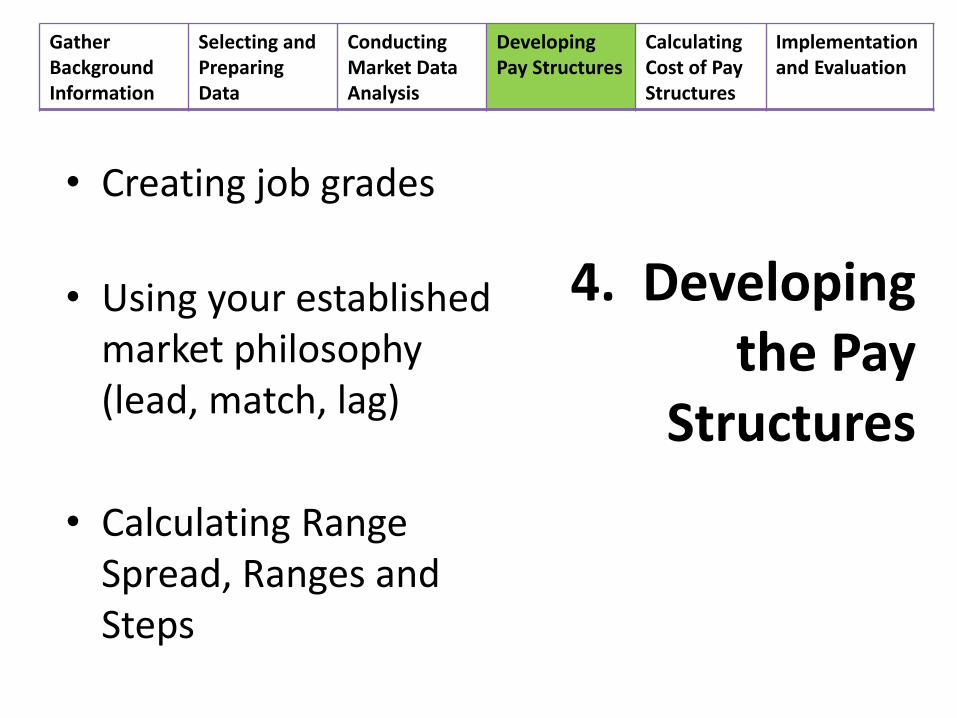
4. Developing the Pay
Structures
• Creating job grades
• Using your established market philosophy (lead, match, lag)
• Calculating Range Spread, Ranges and Steps
Gather BackgroundInformation
Selecting and Preparing Data
ConductingMarket Data Analysis
Developing Pay Structures
Calculating Cost of Pay Structures
Implementation and Evaluation

After Evaluating Jobs and Job Descriptions,
Establish Grade Structure
Receptionist Admin AssistantMedical Assistant (non-certified)
Receptionist/Scheduler 2Billing ClerkEnrollment ClerkData entryMedical Assistant (certified)
Billing SpecialistPatient Account Rep.Medical Records SpecialistPatient Visit Specialist
Billing CoordinatorFront Office CoordinatorMedical Records CoordinatorOutreach Coordinator
Gather BackgroundInformation
Selecting and Preparing Data
ConductingMarket Data Analysis
Developing Pay Structures
Calculating Cost of Pay Structures
Implementation and Evaluation
Grade A =
Grade B =
Grade C =
Grade D =

Benchmarking Jobs Example
Using CHAMPS Salary Surveys
Job Title
Surveys for
Appropriate
Market
(BLS for
comparison only,
not included in
aging or averages)
Percentiles
CHAMPS Regional
2012
MT Trim Mean Aged
2010 6% (Budgets
1-7 Mil or average if
not enough data
available)
25th
Percentile
Mid-point
(lag)
50th Percentile
Midpoint
(match/meet)
75th
Percentile
Midpoint
(lead)
Average Salary
for Budget
Category
Living Wage for Flathead
County
http://livingwage.mit.edu/
One Adult, One Child =
$17.16 per hour
One Adult = $7.49
MA
CHAMPS Regional 24241 28059 31533 27,011 35,713
CHAMPS MT 28044 15,579
BLS Montana 29140
Receptionists
CHAMPS Regional 23920 26100 28080 26,075 35,713
CHAMPS MT 26834 15,579
BLS Montana 28240
Admin. Assist. 25328 27148 30711 28,084
CHAMPS Regional 35,713
CHAMPS MT 25270 15,579
BLS Montana 26020
Recall that we benchmarked salaries for several
positions………

Establishing Pay Grades and
Wage Steps Salary Ranges
Grade Jobs in Grade
25th
Percentile
Mid-point
(lag)
50th
Percentile
Midpoint
(match/meet)
75th
Percentile
Midpoint
(lead)
Average
Salary for
Budget
Category
Living Wage for
Flathead County
http://livingwage.mi
t.edu/
One Adult, One
Child = $17.16 per
hour
One Adult = $7.49
Market
Philosophy Entry Midpoint
High/
Cap
Range
Spread
Grade
A Receptionist
Administrative
Assistant 24496 27102 30108 27,057 35,713 Lag 20,405 24,496 28,587 40%
Medical
Assistant 15,579 Meet 22,576 27,102 31,628 40%
Lead 25,080 30,108 35,136 40%
Living Wage
Adj. 35,713 42,213 49,895 40%
Grade
B
Coder 30923 34545 38067 34,741 35,713 Lag 25,759 30,923 36,087 40%
Eligibility
Coordinator 15,579 Meet 28,776 34,545 40,314 40%
Licensed
Practical Nurse Lead 31,710 38,067 44,424 40%
Living Wage
Adj. 35,713 42,213 49,895 40%
Now we can “bundle” positions we have
evaluated for similarity in salary into Grades……
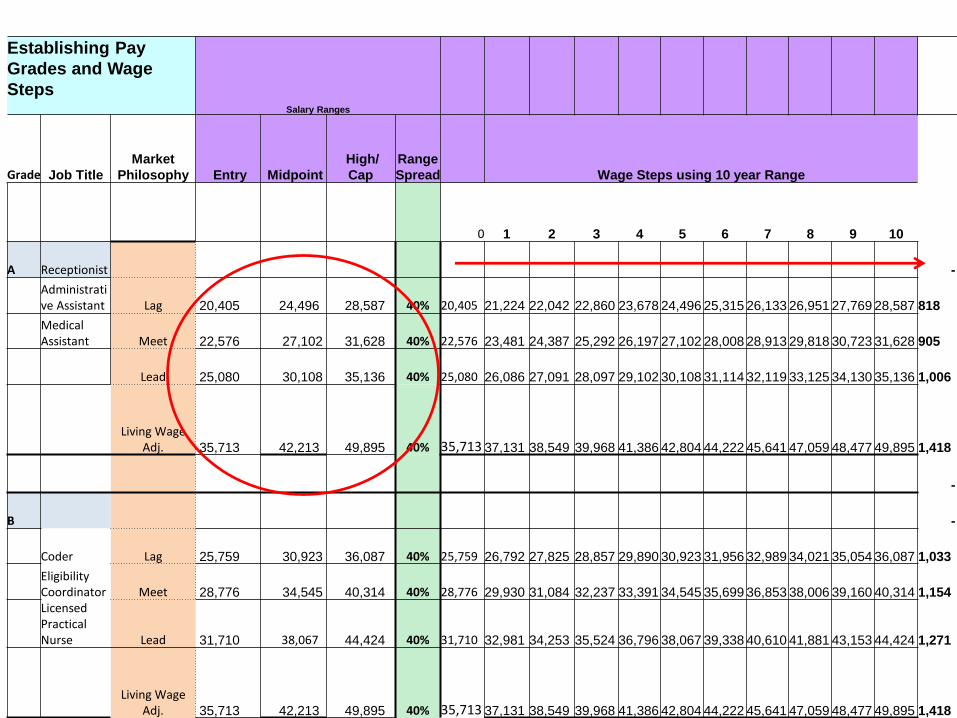
Establishing Pay
Grades and Wage
StepsSalary Ranges
Grade Job Title
Market
Philosophy Entry Midpoint
High/
Cap
Range
Spread Wage Steps using 10 year Range
0 1 2 3 4 5 6 7 8 9 10
A Receptionist -
Administrative Assistant Lag 20,405 24,496 28,587 40% 20,405 21,224 22,042 22,860 23,678 24,496 25,315 26,133 26,951 27,769 28,587 818
Medical Assistant Meet 22,576 27,102 31,628 40% 22,576 23,481 24,387 25,292 26,197 27,102 28,008 28,913 29,818 30,723 31,628 905
Lead 25,080 30,108 35,136 40% 25,080 26,086 27,091 28,097 29,102 30,108 31,114 32,119 33,125 34,130 35,136 1,006
Living Wage Adj. 35,713 42,213 49,895 40% 35,713 37,131 38,549 39,968 41,386 42,804 44,222 45,641 47,059 48,477 49,895 1,418
-
B -
Coder Lag 25,759 30,923 36,087 40% 25,759 26,792 27,825 28,857 29,890 30,923 31,956 32,989 34,021 35,054 36,087 1,033
Eligibility Coordinator Meet 28,776 34,545 40,314 40% 28,776 29,930 31,084 32,237 33,391 34,545 35,699 36,853 38,006 39,160 40,314 1,154 Licensed Practical Nurse Lead 31,710 38,067 44,424 40% 31,710 32,981 34,253 35,524 36,796 38,067 39,338 40,610 41,881 43,153 44,424 1,271
Living Wage Adj. 35,713 42,213 49,895 40% 35,713 37,131 38,549 39,968 41,386 42,804 44,222 45,641 47,059 48,477 49,895 1,418

Calculating Range Spreads
Appropriate for Position
Type
• 40% = Support, service, labor = Non-exempt/hourly positions, the job descriptions of which do not require significant or specialized education or experience
• 50% = Executive and management= typically Exempt/salary positions requiring specific education levels and experience
• 60% = Professional = Licensed, Exempt/salary position requiring minimum of Masters or Doctorate level education
Gather BackgroundInformation
Selecting and Preparing Data
ConductingMarket Data Analysis
Developing Pay Structures
Calculating Cost of Pay Structures
Implementation and Evaluation

Gather BackgroundInformation
Selecting and Preparing Data
ConductingMarket Data Analysis
Developing Pay Structures
Calculating Cost of Pay Structures
Implementation and Evaluation
Employee Position Current Wage Minimum of Range Bring to Minimum
Astrud Bingham Medical Asst. $10.05 $10.85 $.80
Alistair Crumbucket Coder $12.95 $13.83 $.88
Balthazar Sodababy Coder $14.50 $13.83 $0
Employee Position Current Wage Midpoint of Range Compa-Ratio
Astrud Bingham Medical Asst. $10.05 $13.02 79%
Alistair Crumbucket Coder $12.95 $14.87 87%
Balthazar Sodababy Coder $14.50 $13.83 105%
Bring to minimum: Amount to bring employee from current to minimum of pay range
Compa-Ratios: Percentage from the mid-point
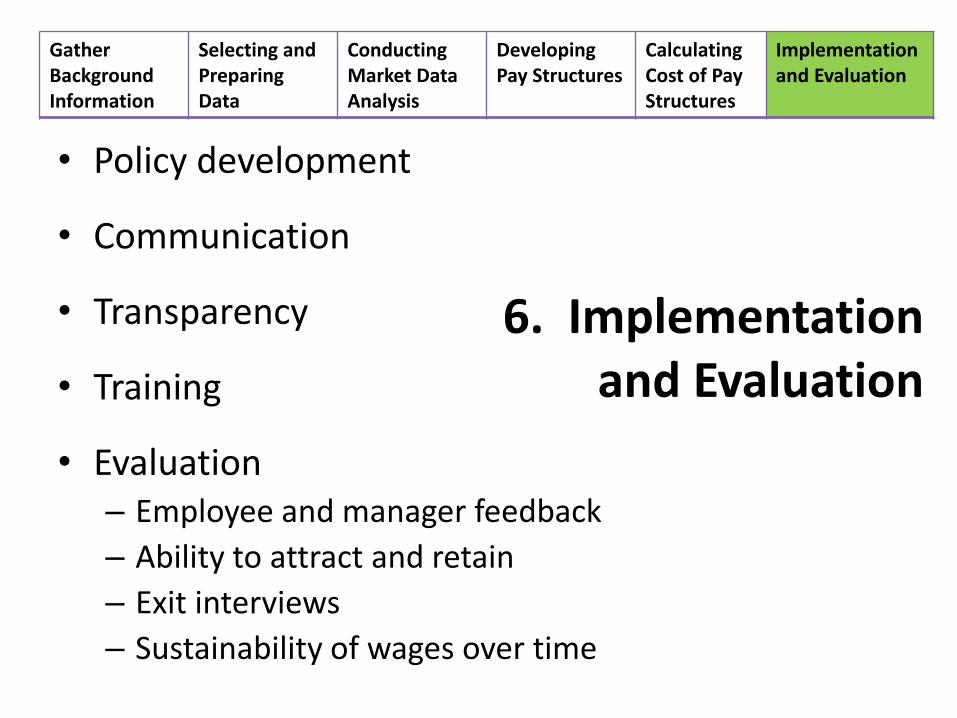
6. Implementation and Evaluation
• Policy development
• Communication
• Transparency
• Training
• Evaluation– Employee and manager feedback
– Ability to attract and retain
– Exit interviews
– Sustainability of wages over time
Gather BackgroundInformation
Selecting and Preparing Data
ConductingMarket Data Analysis
Developing Pay Structures
Calculating Cost of Pay Structures
Implementation and Evaluation

Placement versus
Movement
• Placement: 2.5% “credit” for each year of additional education and years of experience after minimum qualifications
• Movement along your grid depends on your policy.
– Flat
– Performance or merit based

Aging Survey
Data
• No more than 2 years old
• Healthcare salaries projected to grow
• Economic factors arose in 2008, so can gauge by COLA and market data

Summary
• Compensation Philosophy
• Relevant Market
• Salary Surveys in Relevant Market (CHAMPS)
• Benchmarking
• Constructing Pay Ranges and Grades
• Implementing, Communicating and Evaluating

Resources
• CHAMPS• Bureau of Labor Statistics (include
example of state data)• Medical Group Management
Association• American Society of Healthcare
Human Resources Administration• Society for Human Resource
Management• www.salary.com• "How to Build a Market-Based
Compensation Structure from Scratch“ SHRM Article, July, 2010

Questions?