creating a cash flow analysis tool for private long-term
TRANSCRIPT

Creating a cash flow analysis tool for private long-term
real estate investment
Meri Leponen
Bachelor’s Thesis
Degree Programme in
International Business
2015

Abstract May 6, 2015
Author(s) Meri Leponen
Degree programme International Business
Report/thesis title Creating a cash flow analysis tool for private long-term real estate investment
Number of pages and appendix pages 44 + 2
This study looks at the profitability through cash flow analysis of long-term real estate investment from the private investor’s perspective. The focus of the project is on annual cash flow and refurbishment costs during a 20-year outlook period. The scope of the project is defined together with the commissioning private investor who has invested in apartments since 2011 and wants to discover whether the time, effort, and money used in the investments have been worthwhile and if the outlook of the investments are positive or negative in the long-term. The before-mentioned refurbishment costs refer to the lifetime costs of the apartment. Refurbishment costs are estimated based on different materials that define their useful lifetime. With this knowledge, the cash flow analysis tool created in this project determines the timing and estimated costs of each repair and show the effect on annual cash flows and evidently overall success of the investment. The main focus of this thesis in terms of theoretical framework is the basic real estate investment theories including formation of rental income and the lifecycle costs. Different investment methods such as return on equity are utilized in order to test, measure, and analyze the results of 3 different case apartments. In order to create the long-term cash flow analysis tool using Microsoft Office Excel, it is necessary to understand cash flow investment as an investment strategy. In addition, it is crucial to understand the different renovation types and to estimate the timing and estimated costs based on material knowledge. These concepts contribute to annual cash flow calculations through analysis and evaluation of the data using the tool designed for this purpose. The research methods used in the project are desktop research and qualitative interviews with the private investor. The expertise of the private investor will provide the necessary data in the creation of the components for the tool as well as in the phase of inputting data to test the tool and analyze the profitability results. The tool is created using agile methods, which means that the tool is tested and validated after each modification. The process requires extensive desktop research in order to have the expertise to design the tool, test its validity, and give analytical outcome that will benefit the private investor as he will be able to make further decisions on findings with the tool in the future.
Keywords Real estate investment, cash flow, rental income, renovation costs, life cycle cost, return on equity
Table of contents
1 Introduction ................................................................................................................... 1
1.1 Background ........................................................................................................... 1
1.2 Thesis topic ........................................................................................................... 2
1.3 Project objective and tasks ................................................................................... 3
1.4 Project scope ........................................................................................................ 4
1.5 Key concepts ........................................................................................................ 5
1.6 Private investor introduction .................................................................................. 6
2 Theoretical framework ................................................................................................... 8
2.1 Investment analysis methods ................................................................................ 9
2.1.1 ROI and ROE ........................................................................................... 11
2.1.2 Cash flow investment ............................................................................... 12
2.1.3 WACC and Financial Leverage ................................................................ 13
2.2 Life cycle costs.................................................................................................... 15
2.3 Refurbishment costs ........................................................................................... 17
2.4 Apartment investment ......................................................................................... 22
2.4.1 Investment process in general.................................................................. 23
2.4.2 Rental income & increase in apartment’s value ........................................ 24
2.4.3 Risk management .................................................................................... 30
3 Designing and Testing the Tool ................................................................................... 33
4 Results ........................................................................................................................ 37
4.1 Application and cash flow analysis of 3 case apartments .................................... 37
4.2 Discussion and suggestions ................................................................................ 41
5 Project evaluation ........................................................................................................ 43
References ...................................................................................................................... 45
Appendices ...................................................................................................................... 48
Appendix 1. Tool’s form sheet. .................................................................................... 48
Appendix 2. Interview Questions ................................................................................. 49
1
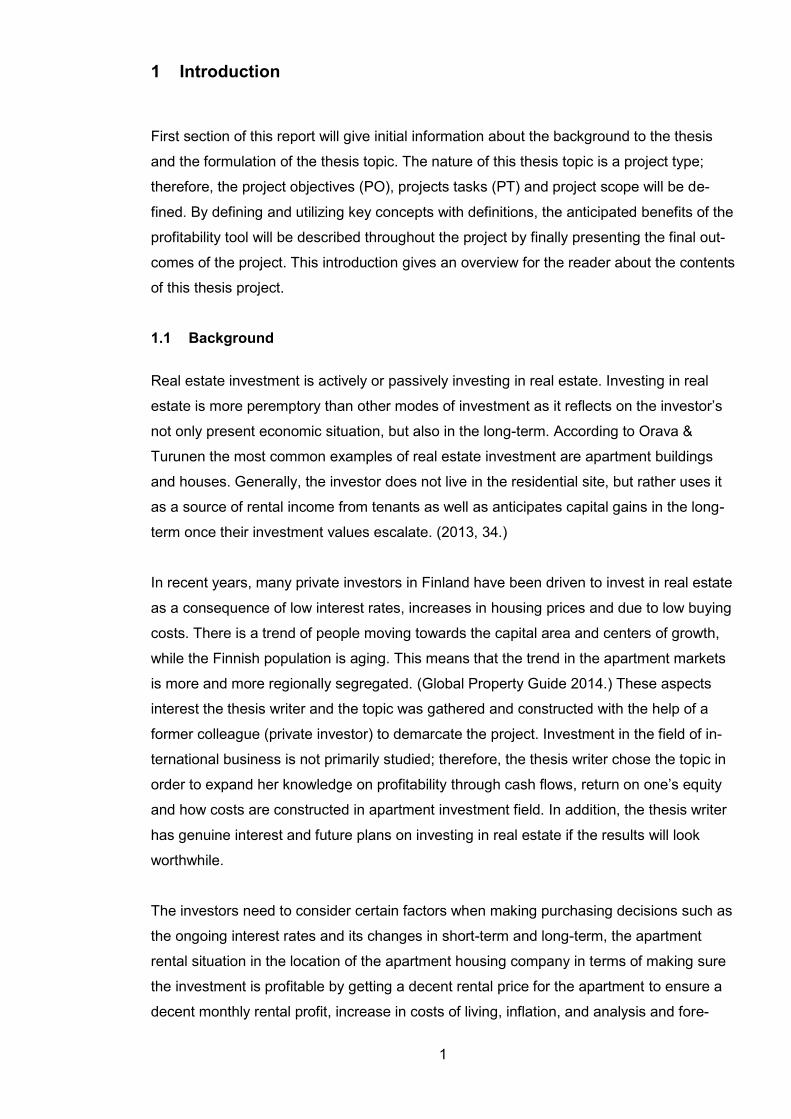
1 Introduction
First section of this report will give initial information about the background to the thesis
and the formulation of the thesis topic. The nature of this thesis topic is a project type;
therefore, the project objectives (PO), projects tasks (PT) and project scope will be de-
fined. By defining and utilizing key concepts with definitions, the anticipated benefits of the
profitability tool will be described throughout the project by finally presenting the final out-
comes of the project. This introduction gives an overview for the reader about the contents
of this thesis project.
1.1 Background
Real estate investment is actively or passively investing in real estate. Investing in real
estate is more peremptory than other modes of investment as it reflects on the investor’s
not only present economic situation, but also in the long-term. According to Orava &
Turunen the most common examples of real estate investment are apartment buildings
and houses. Generally, the investor does not live in the residential site, but rather uses it
as a source of rental income from tenants as well as anticipates capital gains in the long-
term once their investment values escalate. (2013, 34.)
In recent years, many private investors in Finland have been driven to invest in real estate
as a consequence of low interest rates, increases in housing prices and due to low buying
costs. There is a trend of people moving towards the capital area and centers of growth,
while the Finnish population is aging. This means that the trend in the apartment markets
is more and more regionally segregated. (Global Property Guide 2014.) These aspects
interest the thesis writer and the topic was gathered and constructed with the help of a
former colleague (private investor) to demarcate the project. Investment in the field of in-
ternational business is not primarily studied; therefore, the thesis writer chose the topic in
order to expand her knowledge on profitability through cash flows, return on one’s equity
and how costs are constructed in apartment investment field. In addition, the thesis writer
has genuine interest and future plans on investing in real estate if the results will look
worthwhile.
The investors need to consider certain factors when making purchasing decisions such as
the ongoing interest rates and its changes in short-term and long-term, the apartment
rental situation in the location of the apartment housing company in terms of making sure
the investment is profitable by getting a decent rental price for the apartment to ensure a
decent monthly rental profit, increase in costs of living, inflation, and analysis and fore-

2
casts of the likelihood of increases or decreases in housing prices in the future. In addi-
tion, the private investor explained during the 2-hour preliminary interview in December
that before the purchase, the investor must carefully analyze the renovations and repairs
that have been done prior to purchase as well as upcoming repairs and their costs. An-
other emphasized point was raised around cash flows as he knows from experience that
monthly and annual cash flows that bring rental profits are the key to profitability in apart-
ment investment. (Private investor 29 December 2014.)
The most concern for these private investors in real estate is the profitability of their in-
vestment in terms of not only making a profit, but analysing if they benefit enough in com-
parison to the amount of time and effort they have used to make it worthwhile. Hence, this
thesis project aims to make the process of evaluating long-term profitability through cash
flow analysis for private investors more convenient through the development of a cash
flow analysis tool that will make the profitability analysis easy and quick when either calcu-
lating new prospective apartment investments or existing investments.
In the beginning this tool is created with and to a specific Finnish private investor; howev-
er, the end-product can be used by a handful of other private investors as well who have
similar goals in their investments. For example another former colleague an American
private investor has researched the available tools concerning investing in real estate in
Finland and the information in English is very limited and focused on monthly or annual
results, which do not give coherent results in the long-term. Therefore, this tool can have a
huge benefit to foreign investors in Finland as well. In addition, there are apartment build-
ings that can be an object of investment all over the world, this tool can work as a bench-
mark for private investors in other similar countries to Finland as well and can help the
private investors make their own analysis related to cash flow profitability and refurbish-
ment cost estimations.
1.2 Thesis topic
As briefed and introduced in the Background section, the topic of this project-oriented the-
sis developed into “Creating a cash flow analysis tool for private long-term real
estate investment”. The idea is to create a tool with which it is convenient to investigate
and analyze the long-term cash flow focused profitability results of mainly one-bedroom
apartments with an emphasis on life cycle costs related to lifetime repair costs by using
the tool created for this purpose.
3
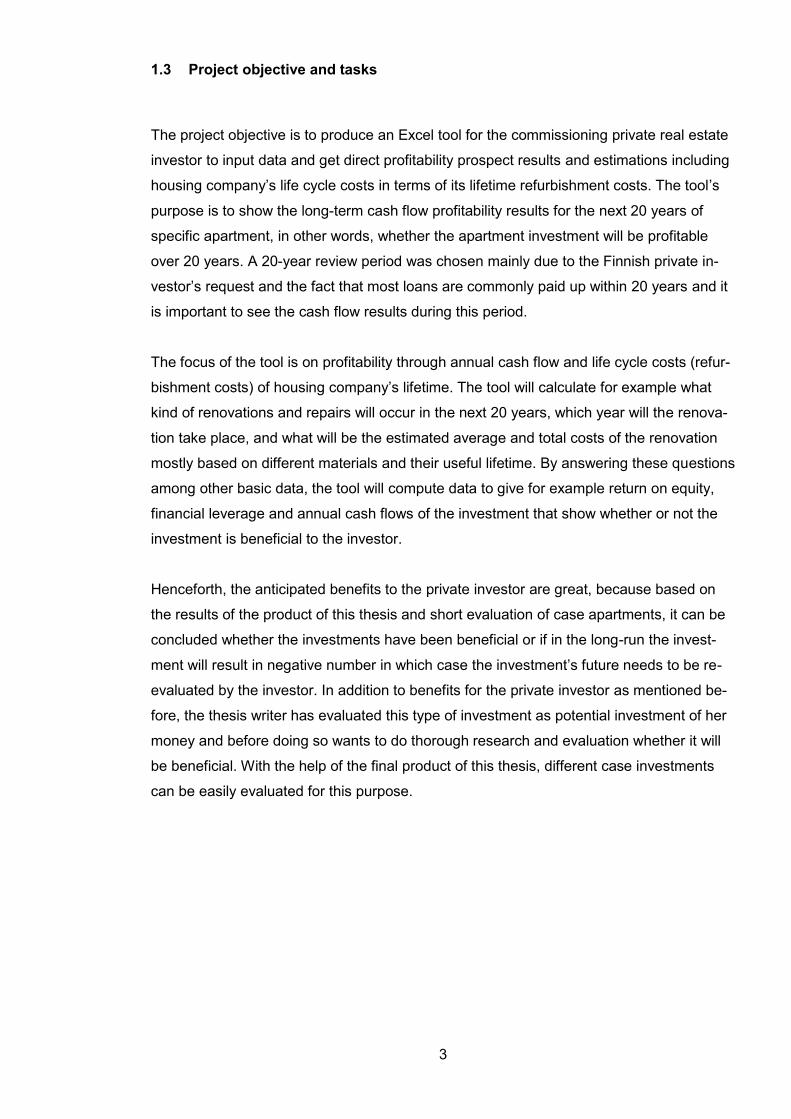
1.3 Project objective and tasks
The project objective is to produce an Excel tool for the commissioning private real estate
investor to input data and get direct profitability prospect results and estimations including
housing company’s life cycle costs in terms of its lifetime refurbishment costs. The tool’s
purpose is to show the long-term cash flow profitability results for the next 20 years of
specific apartment, in other words, whether the apartment investment will be profitable
over 20 years. A 20-year review period was chosen mainly due to the Finnish private in-
vestor’s request and the fact that most loans are commonly paid up within 20 years and it
is important to see the cash flow results during this period.
The focus of the tool is on profitability through annual cash flow and life cycle costs (refur-
bishment costs) of housing company’s lifetime. The tool will calculate for example what
kind of renovations and repairs will occur in the next 20 years, which year will the renova-
tion take place, and what will be the estimated average and total costs of the renovation
mostly based on different materials and their useful lifetime. By answering these questions
among other basic data, the tool will compute data to give for example return on equity,
financial leverage and annual cash flows of the investment that show whether or not the
investment is beneficial to the investor.
Henceforth, the anticipated benefits to the private investor are great, because based on
the results of the product of this thesis and short evaluation of case apartments, it can be
concluded whether the investments have been beneficial or if in the long-run the invest-
ment will result in negative number in which case the investment’s future needs to be re-
evaluated by the investor. In addition to benefits for the private investor as mentioned be-
fore, the thesis writer has evaluated this type of investment as potential investment of her
money and before doing so wants to do thorough research and evaluation whether it will
be beneficial. With the help of the final product of this thesis, different case investments
can be easily evaluated for this purpose.
4
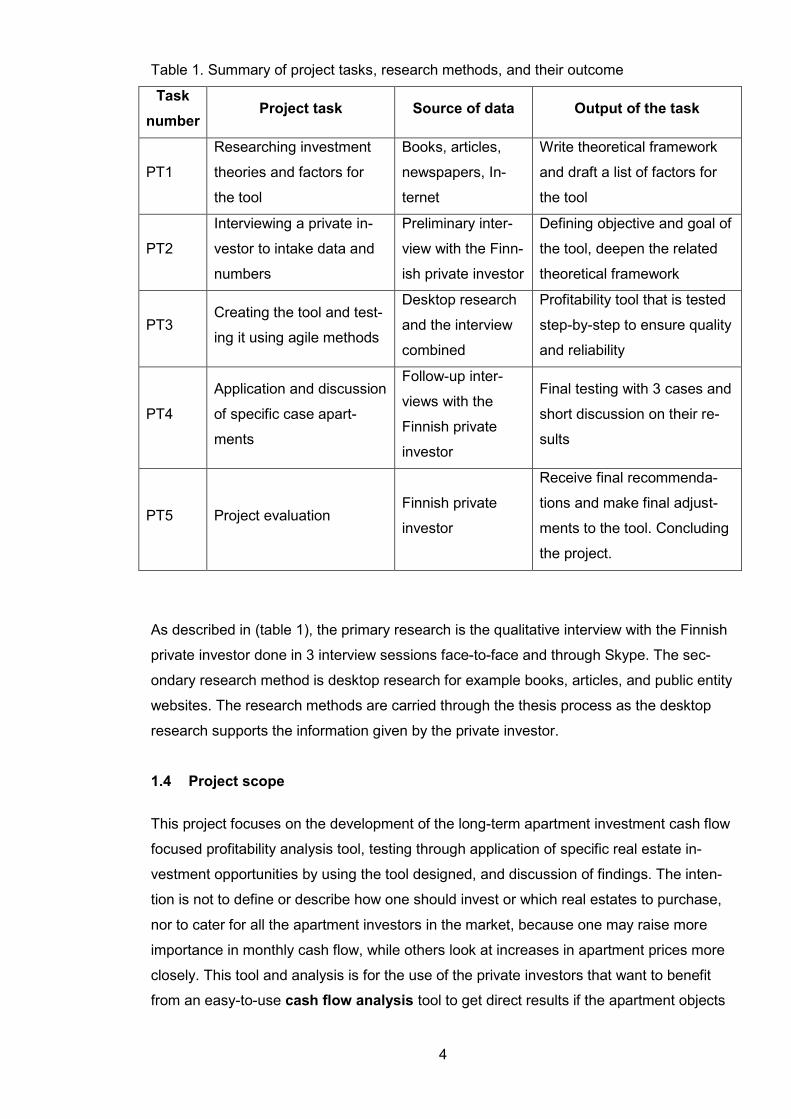
Table 1. Summary of project tasks, research methods, and their outcome
Task
number Project task Source of data Output of the task
PT1
Researching investment
theories and factors for
the tool
Books, articles,
newspapers, In-
ternet
Write theoretical framework
and draft a list of factors for
the tool
PT2
Interviewing a private in-
vestor to intake data and
numbers
Preliminary inter-
view with the Finn-
ish private investor
Defining objective and goal of
the tool, deepen the related
theoretical framework
PT3 Creating the tool and test-
ing it using agile methods
Desktop research
and the interview
combined
Profitability tool that is tested
step-by-step to ensure quality
and reliability
PT4
Application and discussion
of specific case apart-
ments
Follow-up inter-
views with the
Finnish private
investor
Final testing with 3 cases and
short discussion on their re-
sults
PT5 Project evaluation Finnish private
investor
Receive final recommenda-
tions and make final adjust-
ments to the tool. Concluding
the project.
As described in (table 1), the primary research is the qualitative interview with the Finnish
private investor done in 3 interview sessions face-to-face and through Skype. The sec-
ondary research method is desktop research for example books, articles, and public entity
websites. The research methods are carried through the thesis process as the desktop
research supports the information given by the private investor.
1.4 Project scope
This project focuses on the development of the long-term apartment investment cash flow
focused profitability analysis tool, testing through application of specific real estate in-
vestment opportunities by using the tool designed, and discussion of findings. The inten-
tion is not to define or describe how one should invest or which real estates to purchase,
nor to cater for all the apartment investors in the market, because one may raise more
importance in monthly cash flow, while others look at increases in apartment prices more
closely. This tool and analysis is for the use of the private investors that want to benefit
from an easy-to-use cash flow analysis tool to get direct results if the apartment objects

5
will benefit them in the long-run (20 years of the purchase year) in terms of making a
decent or desirable overall profit in addition to generous enough annual cash flows.
Actual information of the specific case apartments and input data will be given by the pri-
vate investor during the qualitative interviews. More specifically the focus is not to do thor-
ough analysis of the three one-bedroom case apartments located in a growing suburb in
Tampere, but rather prove and test the tool’s reliability and accuracy. Based on research
and qualitative interview in December, it was raised that one-bedroom apartments in
housing companies are the most profitable investments; therefore, the tool caters best for
small or one-bedroom apartments (Private investor 29 December 2014).
The tool’s focus is on rental income gained over the years and renovation expenses. In-
crease in apartment’s value is not the focus of this project, but will be simply calculated by
determining the apartment’s future value in accordance with researched figures about
annual increases in the housing market prices and inflation in order to evaluate the esti-
mated selling price in 20 years. In order to demarcate the project, time value of money is
not considered in the calculations as the estimations would suffer from vast variation and
variable factors and such hypothetical results would not satisfy the Finnish private inves-
tor. The idea is also not to give thorough investment analysis, but base the results with a
focus on cash flows and refurbishment costs and calculate the results with these in mind.
1.5 Key concepts
Most companies do business in order to gain profits; similarly, people go to work in order
to get a salary to spend, save or invest. One way to cleverly use one’s income is to invest
it for example in real estate investment in order to gain profit through annual cash flows
and benefit from capital gains.
Investments are resources or assets that can be used in order to generate profits (Horn-
gren & Datar & Foster 2006, 830). While there are many different targets of investing
one’s money, this thesis focuses on real estate investment with an emphasis on renova-
tion costs and annual cash flows in particular.
Real estate investment analysis covers the following factors such as rental profit, reno-
vation costs, renting costs, management of real estate, related taxation, and cash flow
profitability calculation (Orava & Turunen 2013, 46).

6
Capital gains term is commonly used to denote a profit that is made on an investment.
Generally it is “the difference between the sales price and the cost of purchase and im-
provements”. (Gallagher 2014.) Short-term capital gains are profits from investments that
are made or sold within a year of the date of purchase, whereas in real estate investments
profits are commonly made after one year of the purchase, which defines long-term capi-
tal gains. That is why the focus in this thesis will be the long-term profitability as mention-
able profits in real estate investments occur in long-term.
Profit from an investment is constructed by the sum of price or property’s value increases
and cash inflows (Martikainen & Martikainen 2009, 180). Profitability is the difference
between revenues earned and expenses incurred.
Life cycle cost is the sum of all recurring and one-time (non-recurring) costs over the full
life span or a specified period of a good, service, system, or investment. It consists of pur-
chase price, installation cost, operating costs, maintenance and upgrade costs, and re-
maining value at the end of ownership or its useful life (Barringer 2003, 2) In apartment
investment, refurbishment costs are considered and calculated to determine the real
profitability. Most common types of repairs are thorough pipe repair, façade repair, roof
repair, window repair, and elevator construction or modernization.
Cash flows in real estate business means receiving regular cash distributions from the
investment that generate income at a given interval, monthly, quarterly, or annually. In
small apartment investment, commonly cash flows are obtained as monthly rental income
from the tenant in rent payments. (Realty Mogul 2014.)
1.6 Private investor introduction
The commissioning private investor is currently in work life. He has been investing in real
estate in Tampere, Finland since 2011. His work itself is not in the field of real estate in-
vesting; but it finances his investments in this “side-business”. Through this thesis project,
the investor expects to gain new perspectives, but more importantly wants to know if he
should use the next 20 years’ time in investing in real estate in contrast to its profitability.
For the sake of the private investor’s privacy he is referred to as a private investor.
Investing requires time and effort to research as well as making profitability calculations
on the prospects; therefore, the private investor wants to learn if the time and effort con-
sumed is worthwhile in comparison to the level of profit he will make of a specific apart-

7
ment investment in the next 20 years. During a 2-hour preliminary interview in December
2014, the private investor raised most focus from experience in refurbishment and renova-
tion costs to be taken into close consideration in order to generate the long-term cash flow
profitability tool and calculations.
This Finnish private investor is a valuable source in the project; while other private inves-
tors with similar goals can utilize the tool as well. For example an American private inves-
tor who has been investing in real estate in the US since 2007. He has great experience in
the US apartment investment market; however, after moving to Finland these skills are not
enough, because the Finnish market is different and there is limited information available
in English. The American investor is simply an added-value to the project, but the product
itself will be designed for the needs and requirements of the Finnish private investor and
applied with the given strategies.
8
2 Theoretical framework
This section will describe the theoretical frame of reference in order to develop the theo-
retical framework for the thesis process. The project objective is to produce a clear and
effortlessly usable Excel tool for private real estate investors investing in the Finnish real
estate market in order to get direct results of the long-term cash flow and profitability of a
specific investment opportunity by conveniently inputting data figures into the tool.
The tool best caters for investors investing in suburbs in one-bedroom apartments and to
those who have similar strategic goals as the private investor in this case study: Renova-
tion costs and their impact on annual cash flows. The theoretical framework is divided into
four sub-chapters. This section discusses the key theories required to understand the ba-
sis for the tool. The theory supports the creation of a fully functioning tool.
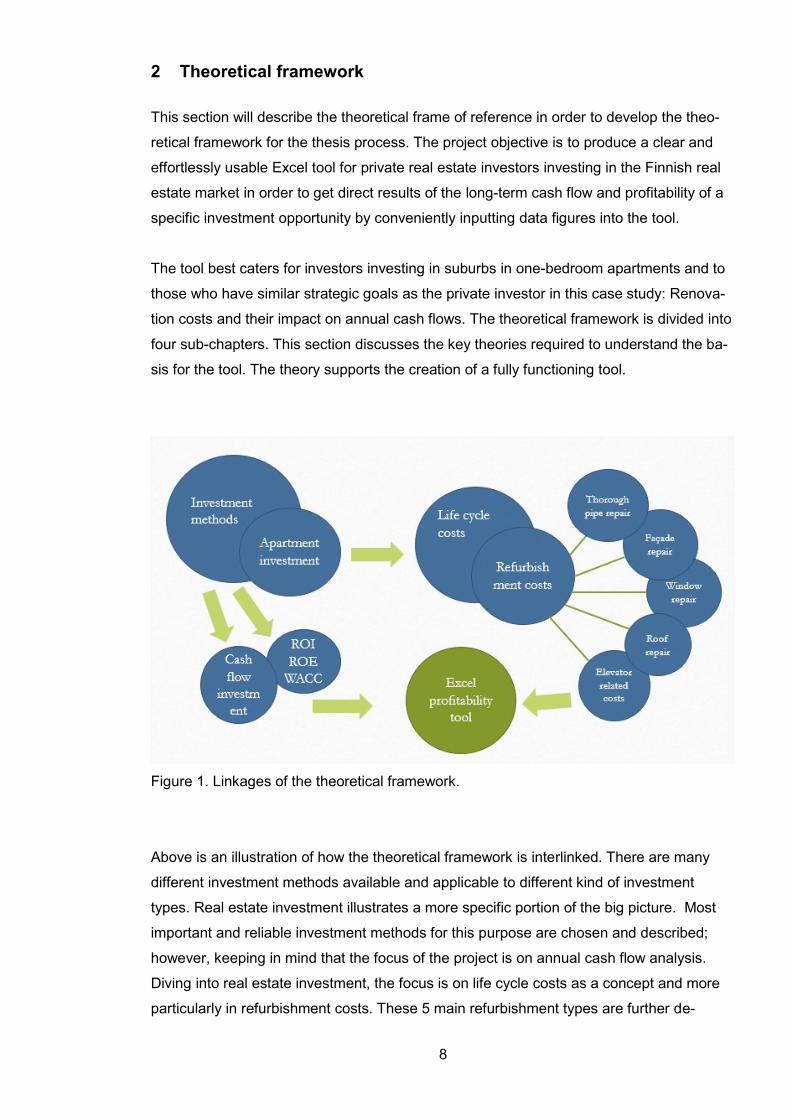
Figure 1. Linkages of the theoretical framework.
Above is an illustration of how the theoretical framework is interlinked. There are many
different investment methods available and applicable to different kind of investment
types. Real estate investment illustrates a more specific portion of the big picture. Most
important and reliable investment methods for this purpose are chosen and described;
however, keeping in mind that the focus of the project is on annual cash flow analysis.
Diving into real estate investment, the focus is on life cycle costs as a concept and more
particularly in refurbishment costs. These 5 main refurbishment types are further de-

9
scribed in theory and estimations based on research and interview results are formulated
into the tool.
2.1 Investment analysis methods
Owner’s equity can be divided into external and internal equity. External means obtaining
through issue of shares; whereas, internal refers to internal financing through trading prof-
its. In real estate, investor’s own equity is commonly 30%, while liabilities (usually a bank
loan) make up the rest of the purchase price. Next some commonly used investment
methods are described and the chosen investment methods are explained.
Net present value (NPV) is commonly used to analyze the profitability of a project or in-
vestment. Net present value is one method used to measure the value of future cash
flows. The idea behind the concept is the time value of money, a euro earned in the future
will not be worth the same as it is today. If the profit of the investment is greater than the
required rate of return of the investor, then the net present value of the investment is posi-
tive. Similarly, if an investment is worth less than the required return, the net present value
of the investment is negative. From this it can be concluded that an investment should be
accepted where NPV≥0 and rejected where NPV < 0. (Knupfer & Puttonen 2012, 103.)
The formula for calculating NPV is as follows:
Where:
Ct = net cash inflow during the period
Co= initial investment
r = discount rate, and
t = number of time periods
Because the focus of the project is not on investment methods, but rather on cash flow
analysis and refurbishment costs, net present value calculations would bring such varia-
tion and rough results that are not satisfactory to the private investor and hence were de-
marcated. Increase in apartment’s value is calculated by an annual increase percentage
and selling of the apartment is included is last year’s cash flow. Because all other calcula-
tions are at present time as rent amount and maintenance fee are kept fixed throughout
20 years, and time value of money is not noted (mainly due to research of how rent

10
amount and maintenance fee increase at the same relation), only the capital gain/loss
needs to be discounted to present time to ensure consistency in calculations.
Internal rate of return (IRR) is used generally in capital budgeting in order to measure
and compare the profitability of investments. It can also be called economic rate of return
(ERR) or discounted cash flow rate of return (DCFROR). Unlike many other investment
theories, internal rate of return does not take into account environmental factors such as
the interest rate or inflation, hence the word internal. (Hartman & Schafrick 2004, 140.)
Next, we will take a look at the formula for Internal Rate of Return:
Where
is a positive integer,
is the total number of periods,
is the net present value,
evidently r is the internal rate of return.
The internal rate of return is the rate of return that affects the net present value of all cash
flows from a specific investment to equal zero. By all cash flows, both negative and posi-
tive cash flows are included. IRR can also be defined as the discount rate at which the
present value of all future cash flow is equal to the initial investment, in other words it is
the break-even point of the investment. Generally if the IRR is greater than the cost of
capital, then the investment should be accepted. In other words, if the IRR is less than the
cost of capital then the investment should be rejected. (Pogue 2004, 565-567.)
In this thesis, cash flows are technically already at present time and cannot be further dis-
counted, because rent amount and maintenance fee among other figures are kept fixed
over the 20-year-period and time value of money is not considered as it requires many
different variables to be taken into account and the results are too hypothetical. The pri-
vate investor requested the calculations to be kept fixed, hence the simplification.

11
During the 2-hour preliminary interview with the private investor he raised focus on return
on equity and annual cash flow (Private investor 29 December 2014). Evidently, these are
noted in the tool more precisely and require closer consideration.
2.1.1 ROI and ROE
Return on investment (ROI) can be formulated by dividing average annual net income
by invested capital (Knupfer & Puttonen 2012, 106). Return on investment calculation is a
mandatory tool for investors in order to evaluate the efficiency and profitability of an in-
vestment. The formula mentioned below does not take into account the time value of
money, because the assumption in the model is that the annual net income of each year
remains constant. A high return on investment value shows the investor that the invest-
ment is favorable in comparison to its investment costs. (Martikainen & Martikainen 2009,
36.)
Return on equity is a basic tool to be used in investment objects. In this thesis, the writer
has included the model and has formulated it into the tool measuring return on investment
after the first year. It is counted as:
ROI =
Generally, every investor has a desired or expected rate of return in mind for example
return on investment to be 6% is common according to the private investor.
Return on equity (ROE) is another useful tool for investors. It measures the rate of return
for shareholder’s equity. It is generally utilized to measure how efficiently a company gen-
erates profits from each unit produced in order to generate growth. Return on equity is
mostly determined by the owner’s required rate of return. Because return on equity is
risky, ROE should be higher than the equivalent available riskless investment in the mar-
ket. Generally a ROE between 15 and 20% is considered good, while below 15 is satisfac-
tory and above 20% is excellent. (Balance consulting 2015.)
Return on equity is formulated by dividing annual net income by total equity. The thesis
writer has included return on equity calculation into the tool by utilizing the following for-
mula:
(Rent amount – maintenance fee – interest share) x 12
Purchase price

12
First year ROE =
This formula calculates the investment’s return on equity after 1st year. As equity increas-
es every year, return on equity is calculated annually in the tool by the following formula:
Annual ROE =
In order to obtain the formula for each year evidently the amount of own capital increases each
year once previous year’s loan installment share is added to it. Therefore, the formula is counted
with Excel the denominator to be last year’s own capital amount + loan installment share.
2.1.2 Cash flow investment
Every private investor is different, and each one’s investment strategy can be shaped by
their life situation and goals. These strategies can for example be focused on maximizing
profit, minimizing risk, obtaining constant cash flows or looking at increases in value over
time. This thesis focuses on constant cash flow strategy. According to Vuokria Online,
cash flow investment’s basic idea is to try to maximize the money in hand after costs
are deducted from rental income. Related equity is minimized in order to maximize cash
inflow. In this way, the investor is in charge of making the decision how they want to han-
dle the monthly profit from cash flow. (Vuokria Online 2013.)
According to U.S. Small Business Administration, cash flow can be defined as the move-
ment of money in and out of the invested business. This includes inflow of cash that
comes from operations related to sale of goods or services, loans, and asset sales while
outflow of cash refers to expenditures such as loan payments and business purchases.
(U.S. Small Business Administration.) In apartment investment inflow of cash is monthly
rent payments from tenant, while outflow of cash relates to costs such as maintenance
fee, loan interest, and apartment specific purchases such as a new refrigerator.
Generally cash flow analysis statements are divided into three parts that are operating
activities, investment activities, and financing activities. Operating activities relate to net
income and losses. Investment activities refer to purchases either bought or sold. Financ-
(Rent amount – maintenance fee – interest share) x 12
Own capital
(Rent amount – maintenance fee – interest share)
(Own capital + previous year’s loan installment share)

13
ing activities relate to the financing side of the business in terms of noting cash flow trends
and for example a loan is considered to be an inflow of cash while loan payments are an
outflow of cash.
In apartment investment, as mentioned before cash flow comes from monthly rent pay-
ments from the tenant. Whether the monthly cash flow is positive or negative is deter-
mined by maintenance fee payments, taxes, refurbishment costs, proportion of equity and
loan and the monthly installment share of the loan. The investor can influence the propor-
tion of equity and loan (commonly 70% loan, 30% equity), amount of rent, and monthly
loan installment share. Taxes are set by authorities and cannot be influenced, mainte-
nance fee is also set by the housing company, and necessary refurbishment costs cannot
be avoided. In order to maximize cash flow (cash flow investment strategy), a private in-
vestor should minimize amount of own equity, obtain a high rental income, and negotiate
a low interest for the loan from the bank. (Vuokria Online 2013.)
2.1.3 WACC and Financial Leverage
According to Wall Street Oasis, Weighted Average Cost of Capital (WACC) is a finan-
cial method that is used to measure the cost of capital to a company or investor. The two
main components in order to make a profit are equity and debt. This model gives the av-
erage of these two components and evidently gives an investor the exact costs required to
finance the investment. (Wall Street Oasis.) WACC at its simplest can be calculated by
multiplying the cost of each component of finance by their relevant weight and summing
the products up as follows:
WACC = Weight of Equity x Cost of Equity + Weight of Debt x Cost of Debt
In order to receive more precise results, the formula can also be counted by the following:
Figure 2. WACC. The Motley Fool 2014.

14
As mentioned above, the entire cost of capital is based on the value of debt and equity
return requirements. Because the private investors have different return requirements on
different investments, the entire cost of capital is calculated as a weighted average of the
total equity and debt return requirements (Martikainen & Martikainen 2009, 98).
Taxation needs to be taken into account when determining the required return of capital.
In Finland, companies and private investors can deduct interest payments related to debt
for tax purposes. In practice, this means that the tax authorities of Finland will pay the
amount of tax rate of the company's or private investor’s interest payments. Because in-
terest expenses can be deducted in taxation, cost of debt is hence smaller than payable
interest share. (Martikainen & Martikainen 2009, 99.)
Financial leverage refers to the use of debt to finance an activity (Scott 2003). This is
usually applied in the apartment investment market when an investor borrows money from
the bank in order to purchase the apartment. As mentioned before the ratio is usually 30
% own capital and 70 % debt. Commonly companies that have a high leverage are called
highly-leveraged and are considered to be risky if they end up not being able to pay back
the loan amount with interests; however, one can also benefit from a financial leverage if it
is done right it can lead to an increased shareholders’ return on investment and be used
to expand operations. (Private investor 22 January 2014). With different proportion of fi-
nancial leveraging the results can differ quite much, this can be tested in the tool on “fi-
nancial leverage” sheet.
Investment apartments are financed either by own capital or borrowed capital or with the
combination of these two. Borrowing money/taking a debt with an intention to increase
return on equity is called a financial leverage. Financial leverage is beneficial when the
costs incurred from investing are covered with the net rental income. Similarly, if the costs
of equity are greater than the net rental income, financial leverage is not beneficial. For
example when interest rate is low, the cost of borrowed capital is also low in relation to the
total return on investment. (Knüpfer & Puttonen, 2009, 179-180.) With different proportion
of financial leveraging the results can differ quite much, this can be tested in the tool on
“financial leverage” sheet.
An important part of obtaining a loan is the type of interest rate applied. There are three
different interest rate options available. Euribor, Prime rate, and customer-specific interest
rate margin. Euribor market rate (European Interbank Offered Rate) is an interbank cost
given to other euro-denominated loans. Euribor interest rate is determined by the interest
information of banks in the Eurozone that have the best credit rating. Commonly a 3, 6, or

15
12-month Euribor reference rate is applied in apartment investment loans. At the moment,
a bank loan is relatively easy to obtain and it is desirable to utilize a financial leverage,
because Euribor rates are historically low due to the European Central Bank’s actions to
keep the rates low in order to stimulate the economy. (Leppiniemi 2009, 92.)
Prime rate is set by the bank for an indefinite time period. Prime interest rates are affected
by the ongoing global financial market and the bank’s own decisions and views. The goal
of the prime rate is to offer a more stable rate in the long term compared to more sensitive
short-term Euribor rates. The prime interest rates are not comparative to other bank’s
rates as the charges as well as payment periods can differ. The interest rate for an apart-
ment rate is a combination of a chosen reference rate and a customer specific interest
rate marginal. Margin of the loan is charged by the bank in order to cover their own activi-
ties. The marginal contains the bank’s required rate of return, processing costs, and relat-
ed risks of credit loss. Different factors such as relations with the bank, age, savings, work
relations, and the economic situation influence and determine the customer specific inter-
est rate marginal. If reference rate in the market decrease, evidently banks tend to in-
crease their customer specific rate margins in order to improve the bank’s profitability pro-
spects. (Leppiniemi 2009, 93-94; Taloussanomat 2012.)
2.2 Life cycle costs
Life cycle costs consist of investment expenses, annual maintenance costs, typical build-
ing block repairs, renovation costs, demolition costs, and potential selling costs of the
apartment. Life cycle costs begin at the point of purchase either by building real estate or
buying a complete real estate object. In this thesis evidently the costs for the investor start
at the point of purchase. When the purchase is being made, financial factors such as ob-
taining a loan and its interest expenses enter the life cycle calculations. Once the real es-
tate is purchased, maintenance fees begin to occur. Most common maintenance fees are
energy consumption, maintenance, cleaning and repair expenses. The idea of investing in
a real estate rather than living in the purchased apartment is the rental income received
from the tenant. The rental income should cover the real estate’s costs for the most part in
order for the investment to be profitable. (Estola 2013, 16.)
Apartment house company law in Finland requires every housing company to provide a
five-year estimation of all upcoming refurbishments including renovation and repair esti-
mates that may affect the amount of maintenance fee in an increasing manner. This five-
year estimation takes into account the age and building material of the apartment house
16
as well as all renovations and repairs occurred to this day. Commonly the repairs are split
up by the tenants on a square meter based method. (Orava & Turunen 2013, 106-108.)
Even though commonly the square meter method is utilized, the costs can also be split up
by the number of shareholders. For example in a case of balcony renovation, the Finnish
apartment housing company law accepts the costs to be split up evenly as everybody
might have the exact same balcony and it seems unreasonable to pay for the repair by
area of the apartment. In addition, elevator construction or modernization costs are anoth-
er exemption from the square meter method, Apartment housing company law has set a
ruling regarding elevator construction that the costs can be divided based on the level of
the apartment. This means that apartments located higher will pay more of the construc-
tion costs, because their relative need is higher as well. (Private investor 22 January
2015.)
Long-term plan is a more comprehensive plan to keep up the condition of the apartment
building than a condition survey or even a more thorough condition investigation. Long-
term plan evaluates residential real estate’s present condition and repair needs by ex-
perts. It also gives an estimation of refurbishment costs with a planned schedule to im-
plement them. Long-term plan usually costs some 10 000 euros depending on the magni-
tude of the condition inspection; therefore, simply relying on the 5-year condition survey
estimate is not thorough enough and an investor should also create his own estimate for
at least 10 to 15 years of potential upcoming refurbishment. (Orava & Turunen 2013, 109.)
The profitability tool will help private investors to estimate these repair and renovation
costs in the long-run to give a more precise and realistic estimation of the investment’s
annual cash flow.
Life cycle costing is generally used in real estate field in various profitability calculations.
Life cycle cost calculation is the core in order to determine whether one’s choice of in-
vestment is economically profitable. Life cycle costing is a broad term as it covers the as-
set’s entire life cycle from the point of purchase either by building an apartment house or
buying a complete real estate object. In this thesis, the focus is on the purchase of the
apartment and the life cycle costs for the investor do not only start at the purchase, but the
investor also has to take into account the life cycle costs prior to the purchase to estimate
the costs that will occur for owning the apartment in the next 20 years. Commonly the life
cycle of a housing apartment building is longer than the estimated financial period, be-
cause the finance side focuses on the next 20 years; whereas, the life cycle of the building
is much longer at least 100 years depending on the building. (Private investor 29 Decem-
ber 2014.)
17
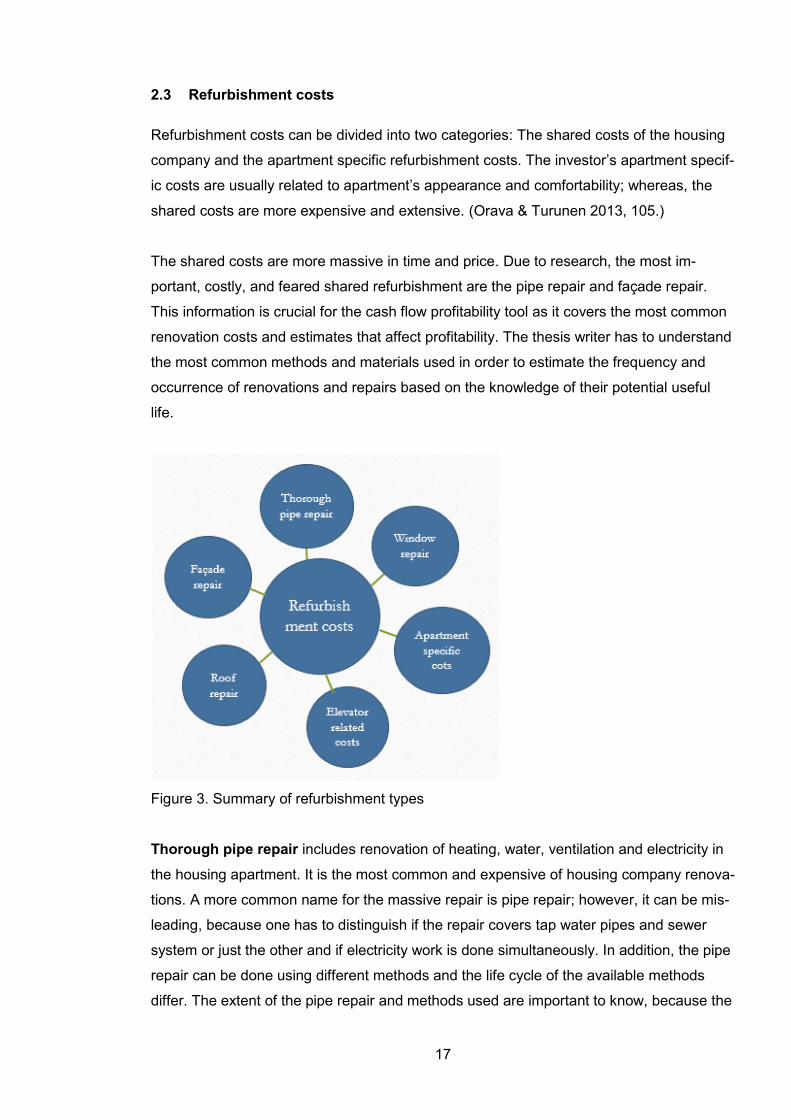
2.3 Refurbishment costs
Refurbishment costs can be divided into two categories: The shared costs of the housing
company and the apartment specific refurbishment costs. The investor’s apartment specif-
ic costs are usually related to apartment’s appearance and comfortability; whereas, the
shared costs are more expensive and extensive. (Orava & Turunen 2013, 105.)
The shared costs are more massive in time and price. Due to research, the most im-
portant, costly, and feared shared refurbishment are the pipe repair and façade repair.
This information is crucial for the cash flow profitability tool as it covers the most common
renovation costs and estimates that affect profitability. The thesis writer has to understand
the most common methods and materials used in order to estimate the frequency and
occurrence of renovations and repairs based on the knowledge of their potential useful
life.
Figure 3. Summary of refurbishment types
Thorough pipe repair includes renovation of heating, water, ventilation and electricity in
the housing apartment. It is the most common and expensive of housing company renova-
tions. A more common name for the massive repair is pipe repair; however, it can be mis-
leading, because one has to distinguish if the repair covers tap water pipes and sewer
system or just the other and if electricity work is done simultaneously. In addition, the pipe
repair can be done using different methods and the life cycle of the available methods
differ. The extent of the pipe repair and methods used are important to know, because the
18
costs can vary from 100 euros to 1000 euros per square meter. (Orava & Turunen 2013,
112.)
According to Finnish Hosting Association, the most common reasons for pipe repairs are
leaks in the pipes. This means that the need for pipe repair cannot always be anticipated
and may come as a surprise if an investor has not estimated the costs. Commonly pipe
repair project preparation requires 2 to 3 years, project planning takes 5 to 10 months and
an additional 6 to 12 months, repair preparations take 2 to 5 months and implementation
of the repair can vary from 6 to 18 months for the entire housing company, not specific to
residence. The frequency of a thorough pipe repair is approximately 47 years. (Orava &
Turunen 2013, 114-115.)
Thorough pipe repair may also include renewal or renovation of bathrooms and/or kitch-
ens depending on the method used to renew tap water pipes and sewer pipes. Evidently
this massive renovations cost even more money and will affect the rent amount. During a
thorough pipe repair, the apartment may be in such a condition that it cannot be lived in or
there are massive disturbances to the tenant; therefore, there probably are losses in rental
income to the investor.
Generally a thorough pipe repair costs vary roughly from 500 euros to 900 euros per
square meter. In the capital area of Finland, the costs are higher; whereas, in the rest of
Finland the costs are commonly at the lower range. The costs can also vary based on the
building year of the apartment housing company. A 1940-built house generally requires a
more expensive repair than a newer built housing company. (Orava & Turunen 2013,
113.) The thesis writer has set a default average cost for a pipe repair to be 700 euros,
which can be edited by the end-user if the costs are estimated to be of lower or higher
cost per square meter.
Even though there are many negative factors when facing a thorough pipe repair, there
are also many positive aspects. For example, the bathrooms are upgraded and standard-
ized waterproofing is done and potential moisture damages are then controlled. In addi-
tion, according to the private investor interview especially in smaller apartments thorough
pipe repair can increase the value even by the amount used in the repair. The potential
costs of a thorough pipe repair are split for 15 years in order to obtain more realistic annu-
al estimations.
Second type is façade renovation. Apartment houses’ façade materials can be divided
into different type categories; concrete, brick walls, plastered, and plated. It is common

19
that the façade material consist of two or more of the before mentioned materials. Differ-
ent façade materials affect the useful life and repair costs drastically. The useful life of
plated walls is in comparison the shortest: 30 years, although they do not require any en-
hancements during this time. Plastered walls’ useful life is about 50 years and repair fre-
quency is about 20 years. Entire renewal is relatively expensive about 160-200 euros per
square meter. (Orava & Turunen 2013, 117.)
Concrete and cleaning concrete walls are typical in apartment houses that were built in
1970’s and till recently in Finland. The mentality during that time was to build the house to
last 30 years, which after it would have been demolished and a new house built to replace
it; however, this has not happened. Corrosion is an issue is this type of façade material,
and a relative repair fund should be anticipated. Joonas Orava recommends the investor
to be cautious if the façade material is concrete, because buildings they were built to last
30 years as mentioned and henceforth may not be of great quality. (2013, 118.)
Brick walls are expected to last as long as the apartment house’s useful life; therefore, it is
the most desired material for an investor. The variation between materials’ useful life and
costs is massive; therefore, this type of repair is more difficult to estimate, and an estima-
tion should be generously planned. While plaster renewal costs from 160 to 200 euros,
demolition of the old and implementing a new thermal plaster costs from 280 to 300 euros
per square meter. Façade repair is not extremely inconvenient, which means that the ten-
ant can continue to live in the apartment. Inconveniences come from “hooding up” mean-
ing plastic covering of the entire apartment house with white tarps; moreover, it bothers
visibility out of the apartment and in most cases the balconies are out of use during a fa-
çade repair. In addition, getting fresh air through the balcony or windows is impossible due
to plastic covering. (Orava & Turunen 2013, 118.)
Balcony renovation is commonly undertaken during façade renovation, which is why the
thesis writer has included it in the façade renovation calculations. Balconies are built to
last the same time as the apartment building; however, they require upkeep and painting
over the years. Depending on how well the balcony has been built in the first place deter-
mines if there is a need to rebuild them entirely one day. The waterproofing of balconies’
useful life is 30 years; however, whether the balcony is indented or on a limb affects the
useful life of the balcony. Indented balcony last longer as it is less likely to suffer from cor-
rosion. (Orava & Turunen 2013, 119.)
Basic balcony renovation costs from 50 to 80 euros per square meter, while entire renew-
al process costs vary from 160 to 200 euros. (Orava & Turunen 2013, 119.) If a balcony

20
renovation takes place simultaneously with the façade material, the average cost for fa-
çade renovation is increased by the amount of the average estimated cost of the balcony
repair. Façade and balcony renovation costs are split for 15 years in the tool in order to
obtain more realistic annual estimations.
Third type is roof repair. Roof repair is a relatively inexpensive repair as it usually does
not require much attention and the tenant can continue to live in the apartment; therefore,
there are no additional costs from empty months to the investor, in other words the land-
lord.
The useful life of a roof depends on the building material of it. It can be divided into 3 cat-
egories: Tiled roof, bitumen roof, and tin roof. Tile and tin roofs’ useful life is about 50
years, while bitumen roof needs repair after 20 to 30 years. Depending on the material of
the roof, the profitability tool can give an estimate of the cost and year of the repair. The
costs are approximately 40 to 80 euros per square meter. In other words, a 30-square-
meter one-bedroom apartment owner’s portion varies from 1200 to 1800 euros. These
costs are split for 5 years in the tool in order to obtain more realistic annual estimations.
(Orava & Turunen 2013, 116-117.)
Fourth type is window renovation. According to Joonas Orava, (2013, 120) the useful life
of windows is 50 years, unless the window sash is made of wooden material in which
case the useful life diminishes to 30 years. This is because wooden window sash requires
repair painting every now and then. In old apartment houses, this process is commonly
undertaken in regular annual housing company repairs.
Window renovation is not very inconvenient to the tenant, because commonly this kind of
repair only last about a day per apartment. As a negative side, this renovation creates
dust, which can mean difficulties in breathing and it is necessary to cover furniture in the
apartment.
Costs of window repair are relatively low, approximately 80 to 120 euros per square me-
ter. This means that in a 30-square-meter apartment the costs are on average 3,000 eu-
ros. These costs are moderately low compared to for example before-mentioned thorough
pipe repair that bring costs of 21,000 euros for the same size 30-square-meter apartment.
(Orava & Turunen 2013, 120.) Similarly to roof repair, he potential window renovation
costs in the tool are split for 5 years.

21
Fifth type is elevator construction or modernization. There are two typical types related
to elevators in a housing company. First type is if there is no elevator in the building and
the housing company is contemplating on construction of an elevator. The costs of build-
ing an elevator shaft can vary drastically depending on the housing company and how
many stories it has. Evidently it is more costly to build an elevator to a 10-story housing
company compared to a 3-story housing company. The total costs of elevator construction
vary approximately from 125,000 to 200,000 euros. While in most cases the housing
company repairs are divided between the apartments on a square meter basis, elevator
construction can be an exemption. Finnish housing company law has set a ruling regard-
ing elevator construction that the costs can be divided based on the level of the apart-
ment. This means that apartments located higher will pay more of the construction costs
compared to those living below. (Orava & Turunen 2013, 121.)
The second type is modernization of a current elevator. Based on the two-hour preliminary
interview with the private investor in December 2014, the costs are generally divided be-
tween the apartments by their size in square meters. In Finland, housing companies can
sometimes get a subsidy from the government to ease the cost burden. Similar to elevator
construction, elevator modernization costs depend on the size of the housing company
and especially how many apartments there are. If modernization costs usually vary from
60,000 to 90,000 euros, this means that if there are for example 24 apartments in the
housing company, the costs per apartment vary between 2,500 and 3,750 euros. These
cost examples are just for illustration, because the costs can also be square meter based
and differ depending on the level of the apartment. (Private investor 29 December 2014.)
For simplicity, the tool will calculate potential elevator costs based on the number of
apartments, because it is impossible to estimate the costs per square-meter without thor-
ough research on other apartments and their sizes in the housing company. Based on
research and interview, the average repair span for elevators is approximately 35 years,
which has been implemented into the tool to give an estimation of required repairs in the
future. Costs incurred from elevator construction or modernization are split for 10 years in
the tool in order to obtain more realistic annual estimations.
Additionally, the private investor explained that also apartment specific costs occur.
These cost include any repairs or renewals within the apartment that the private investor
himself decides to do. Some investors like to paint the walls of the apartment after every
tenant to keep the look clean. Moreover, obtaining a new tenant often requires the inves-
tor to pay for an apartment ad, credit information checks and broker fees.

22
Additionally any related literature can be counted into annual apartment-specific costs. For
apartment-specific repairs wall painting (approximately 50 euros) was already mentioned,
but in addition the investor can decide on floor renewal, which is approximately 150 euros.
Every now and then basic equipment such as refrigerator breaks and requires a purchase
of a new one. The thesis writer has set default annual apartment-specific costs to be 150
euros based on interviews, this default can however be changed in the tool.
Table 2. Summary of refurbishment costs
Refurbishment type Average approximate price
per square meter
Estimated costs for
30 m2 apartment
Thorough pipe repair 500 to 900 euros 15,000 – 27,000 eu-
ros
Façade renovation
- including balcony repair
Total
150 to 300 euros
50 to 200 euros
4500 – 6000 euros
1500 – 6000 euros
6000 – 12,000 euros
Roof repair 40 to 80 euros 1200 – 2400 euros
Window renovation 80 to 120 euros 2400 – 3600 euros
Elevator construction/
Modernization
125,000 – 200,000 per elevator
60,000 – 90,000 per elevator
6250 – 10,000 euros
3000 – 4500 euros
Apartment specific repairs 150 euros annually 3000 euros over 20
years
Above is a conclusion of the refurbishment costs by their average approximate prices per
square meter. These are further illustrated by measuring estimated costs for 30-square-
meter apartment. These are only rough estimates and the extensiveness of the repair can
change the costs massively. Elevator construction and modernization examples are
counted by assuming that a housing company has 20 apartments and that these costs are
evenly divided between the apartments.
2.4 Apartment investment
For the time being, interest rates are exceptionally low and therefore beneficial to the
apartment investor. Also, it is easier to obtain a loan from banks for an apartment loan
rather than share investment at the moment, because with investing in shares there can
be rapid fluctuations and profits are more risky. The bank generally gives apartment buy-
ers a 70 to 80% loan of the full purchase price resulting commonly in 30% of own capital.

23
To simplify the tool, as a result of a request from the private investor, the thesis writer has
set loan amount to be 70% and own capital 30% of the debt-free purchase price. (Orava
& Turunen 2013, 37.)
According to Statistics Finland and PPT the easiest apartments to rent are one-bedroom
apartments, which give the investor the highest rental profits. Just to name a few loca-
tions, the most desirable rental profits can be obtained from Jyväskylä, Lappeenranta, and
Oulu, whereas Helsinki gives moderately lower rental profits for investors. (Orava &
Turunen 2013, 153-155.)
According to Taxpayers Association of Finland, corporate taxation for 2015 is as follows:
The tax rate is 30% for income up to 30,000 euros down from last year’s 40,000 euro limit.
For income exceeding 30,000 euros the rate is 33%, increased from last year’s 32%. For
the sake of keeping the tool simple, the thesis writer has set a fixed tax rate of 30% as the
percentages change on an annual basis. (Taxpayers Association of Finland 2015)
The development of real estate market prices, amount of rent, location of the housing
company, potential refurbishment costs, and the current interest rates are the most
important aspects to the private investor to follow in the market in order to be successful in
their investments.
2.4.1 Investment process in general
During the 2-hour preliminary interview with the private investor in December 2014; the
thesis writer inquired him about the general investment process required when contem-
plating on investing in an apartment. These comments are in the following paragraphs. It
is important to understand the steps in an apartment investment process in order to de-
velop a comprehensive profitability analysis tool. (Private investor 29 December 2014.)
Generally a private investor analyzes and reads about the real estate market situation and
its development in terms of apartment price changes, inflation rate in terms of contrasting
whether inflation is greater than amount of loan interest, rent amount statistics, finance
news, market in general and especially the ongoing interest rates in terms of making loan
decisions. The private investor raised focus on what is the most important to notice when
making investment decisions: “More important than simply choosing an apartment based
on the house price is the amount of rent, the attainability and perpetuity of tenants, and
renovation costs.” Based on the desktop research and qualitative interview, location also

24
seems to be an important aspect in terms of getting a desired rental income and tenant.
(Private investor 29 December 2014.)
After basic research is done and a potential object is found, the negotiation with the bank
takes place. Most commonly bank gives a loan of 70% of the purchase price of the apart-
ment, while the investor has to come up with the 30% on his own, either cash or other
warranty. Before making a purchasing decision, all necessary information and documents
of the apartment should be carefully studied: Hosting certificate, apartment housing com-
pany’s financial statement and related attachments. With the help of these documents, an
investor should measure and evaluate the potential rental income and time value of mon-
ey in terms of upcoming refurbishment. (Private investor 29 December 2014.)
It is important to personally go see the apartment in order to get a real look at the potential
investment. Prior to the housing display, the investor should already have a price in mind,
the price is often negotiated and the investor encouraged to stay firm with the purchase
price one has previously evaluated. Once the purchase takes place, there might be
apartment specific renovations such as painting the apartment or changing old hardware
into newer ones. Nevertheless, next step is the selection process of a tenant. It is crucial
to choose a good tenant that pays on time and keeps the apartment in good condition. A
rent deposit should always be claimed in addition to a thorough written rent lease defining
the terms of the lease. (Private investor 29 December 2014.)
There are very few companies professionally investing in real estate in Finland. Profes-
sional companies such as Sato and VVO buy entire apartment house companies, but not
single apartments; therefore, there is less competition as they do not operate in the same
market as private investors. ( Orava & Turunen 2013, 39.)
2.4.2 Rental income & increase in apartment’s value
Income earned from a real estate investment can be divided into two groups: Rental in-
come and appreciation of the real estate’s price. Income gained from appreciation can be
only gained through selling the apartment or getting another residential loan towards the
apartment. Because appreciation is more questionable and more difficult to forecast, the
tool will focus on income that comes from rental income and appreciation in apartment
price is treated as a plus to the investor. Generally rental income is between 3 and 6 %.
(Orava & Turunen 2013, 41.)

25
Generally rental income should cover the maintenance fee and other expenses in order
for the investment to be profitable in the long-run. Obviously when renovation takes place,
the costs are higher than monthly rental income. The thesis writer has developed a formu-
la into the tool that evaluates the first year rental income percentage. It is formulated as
follows:
First year rental income % =
While the gross annual rental income may look high, it does not always show the real truth
of the profitability. From this basic rental income calculation, the thesis writer developed
the calculations further by adding cash flow calculations that include monthly loan pay-
ment, amount of interest, total of loan repayment monthly, cash flow before loan payment,
after loan payment and finally after taxes. In simple rental income calculations renovation
costs are included into the denominator; however, this thesis counts them more precisely
than simply applying a lump sum. It is important to notice that gross annual rental income
calculated in the tool shows a more positive figure than in reality.
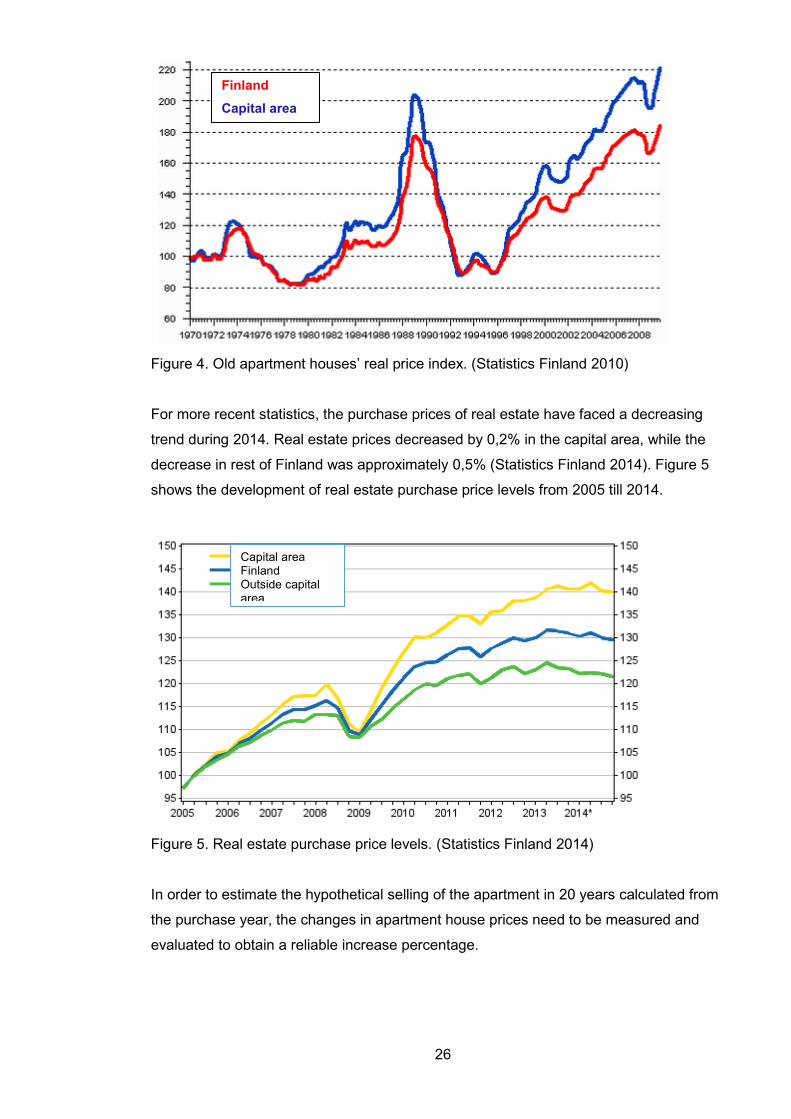
Fluctuation in housing prices have changed moderately over the years. From Figure 4
below we can see the changes from 1970 till recession started in 2008. As we can see
from the graph however, the trend of real estate prices is moderately stable when com-
pared to for example share market fluctuations that are more difficult to estimate and con-
trol. Lower real estate prices, low interest rates, and easiness of obtaining a loan benefit
the private investors especially if they can purchase a real estate at a lower price and sell
it later for a higher price.
( Rent amount - maintenance fee) x 12
( Purchase price + transfer tax )
26
Figure 4. Old apartment houses’ real price index. (Statistics Finland 2010)
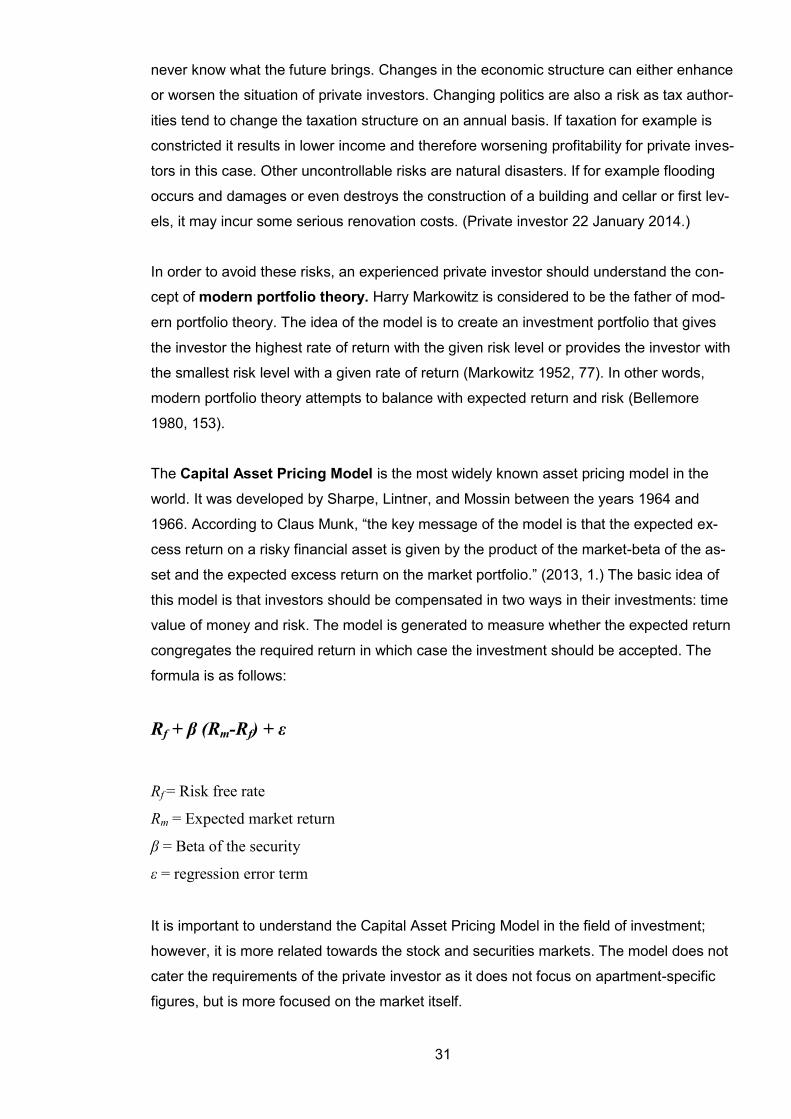
For more recent statistics, the purchase prices of real estate have faced a decreasing
trend during 2014. Real estate prices decreased by 0,2% in the capital area, while the
decrease in rest of Finland was approximately 0,5% (Statistics Finland 2014). Figure 5
shows the development of real estate purchase price levels from 2005 till 2014.
Figure 5. Real estate purchase price levels. (Statistics Finland 2014)
In order to estimate the hypothetical selling of the apartment in 20 years calculated from
the purchase year, the changes in apartment house prices need to be measured and
evaluated to obtain a reliable increase percentage.
Capital area Finland Outside capital area
Finland
Capital area

27
Table 3. Quarterly increases in square meter prices. (Statistics Finland 2015)
1985 1991 1997 2003 2009 1st quar-ter 742 1165 1058 1442 1849 2nd quar-ter 745 1150 1090 1477 1913 3rd quar-ter 734 1097 1107 1506 1956 4th quar-ter 744 1031 1133 1530 2019
1986 1992 1998 2004 2010
766 996 1166 1565 2083
762 936 1196 1606 2133
770 867 1224 1605 2127
792 819 1239 1610 2134
1987 1993 1999 2005 2011
815 816 1254 1634 2173
843 829 1290 1695 2198
873 839 1338 1722 2186
937 868 1370 1767 2158
1988 1994 2000 2006 2012
1067 896 1396 1804 2208
1112 917 1415 1844 2220
1217 905 1381 1869 2233
1338 893 1364 1896 2229
1989 1995 2001 2007 2013
1419 883 1363 1942 2255
1441 868 1374 1972 2275
1423 860 1371 1993 2280
1378 855 1375 1990 2264
1990 1996 2002 2008 2014
1336 872 1354 2033 2279
1344 909 1409 2055 2305
1316 942 1415 2032 2284
1261 984 1421 1943 2262
By studying the quarterly changes in square meter prices in Finland between 1985 and
2014, the thesis writer has calculated an average increase percentage for the period. The
figures were calculated by Excel’s Rate-function:
Periods 30
Original value -742.00 €
Future value 2,262.00 €
Interest rate 3.785%

28
While measuring the future value of the apartment in 20 years, evidently inflation needs to
be considered as the value of the apartment is not fixed unlike rental income and
maintenance fee costs. In order to obtain a realistic estimation of the selling price in 20
years, also consumer price index needs to be studied and an average increase
percentage will be measured based on the annual figures from Statistics Finland for the
years between 1985 and 2014.
Table 4. Consumer Price Index. 1985=100. (Statistics Finland 2015)
1985 100.0 2000 153.1
1986 102.9 2001 157.0
1987 107.1 2002 159.5
1988 112.6 2003 160.9
1989 120.0 2004 161.2
1990 127.3 2005 162.6
1991 132.6 2006 165.4
1992 136.0 2007 169.6
1993 138.9 2008 176.5
1994 140.4 2009 176.5
1995 141.8 2010 178.6
1996 142.6 2011 184.8
1997 144.4 2012 190.0
1998 146.4 2013 192.8
1999 148.1 2014 194.8
Similarly to the average increase interest rate for square meter prices, the consumer price
index is calculated by using Excel’s rate-function:
Periods 30
Original value -100.00 €
Future value 194.80 €
Interest rate 2.248%
In order to obtain the average net increase in apartment prices between the years of 1985
and 2014, the average interest rate for square meter prices is subtracted by the average
consumer price index interest rate. (3.785% - 2.248%=1.538%) 1.538% is the net
increase interest rate of apartment’s value that is applied in calculations in order to
estimate the future value of the apartment. For example if a purchase price is 69,000
euros in 20 years the selling price is by estimation 93,628 euros. Once capital gain is
counted by subtracting the purchase price from the future value, capital gain is obtained.

29
This capital gain is then discounted to present time in order to make the components in
the tool comparable abd consistent.
According to PTT the average estimated annual income for one-bedroom apartments be-
tween 2013 and 2017 will be about 4,2 % in gross rental income, while average increase
in value will be approximately 2,6 %. (Pellervon Taloustutkimus 2013) Below is an illustra-
tion of gross rental income and increase in value percentages from different Finnish cities.
Figure 6. Average annual profit for one-bedroom apartments between 2013 and 2017.
(PTT 2013)
From the picture above, it can be seen that housing apartments located in Kotka, Kajaani,
and Kouvola are are estimated to give investors a gross rental income of over 5%, while
the lowest percentage can be gained in Helsinki, Espoo-Kauniainen, and Vantaa. Highest
increase in value can be gained in Porvoo, Lahti, and Helsinki, while the lowest expected
increases in apartments’ value are in Oulu, Lappeenranta, and Kouvola.
From the calculations between the years of 1985 and 2014 compared to estimations for
2013 and 2017 it can be concluded that the increase in apartment prices is estimated to
be lower than historically. Between the years 1985 and 2014 the inflation excluded rate
was 3.785% as calculated and the estimated rate is only approximately 2.6%.
Kajaani
Average
Gross rental income Increase in value

30
2.4.3 Risk management
In this section, the thesis writer will shortly define and present the common risks in real
estate investment. In is crucial for private investors investing in real estate to understand
and acknowledge the market risks. These risks have been gathered by desktop research
and as a result of interviews with the Finnish private investor.
Some of the risks have already been mentioned in this thesis such as price risk. Price risk
refers to apartment price fluctuations especially if an apartment is purchased and the eco-
nomic outlook affects the apartment prices to decrease. This is why Joonas Orava in his
book encourages private investors to invest in apartments for cash flow returns and not
base their investment on apartment value appreciation (2013, 197). Low interest rates
attract investors and increases in interest rates for a loan are a risk as well. To avoid this
risk, the investor can negotiate a fixed interest rate with the bank to ensure safety from
high fluctuations. Moreover, another banking risk involves difficulty in obtaining a loan due
to lack of own financing or other factors. (Private investor 22 January 2014.)
According to the interview with the private investor, risks concerning renting the apartment
are tenant related risks, maintenance fee risk, rent amount risk, and renovation risks.
Tenant related risks refer to choosing the right and reliable tenant. A poorly chosen tenant
may not pay rent to the landlord (investor) or breaks the apartment or its equipment
somehow, which can become costly to the landlord. Maintenance fees can be increased
as a result of different factors such as upcoming and ongoing housing company renova-
tions.
Commonly when maintenance fee increases, the landlord increases the rent amount. In
some cases, the landlord may lose the tenant or is not able to raise the amount of rent by
the same percentage as the maintenance fee. Additionally if rent amounts fluctuate and
the landlord is forced to lower the rent, he may receive relatively less or make a loss from
the investment. During for example a thorough pipe repair, the apartment cannot be lived
in, which results in rental income losses for some months. These are called empty
months. Renovation risks create huge risks especially if the estimations are much lower
than the actualized costs or the renovation lasts longer than expected. (Private investor 22
January 2014.)
More vague and unpredictable risks relate to the economy and uncontrollable events.
Even though predictions of the economy are continuously made and updated, one can
31
never know what the future brings. Changes in the economic structure can either enhance
or worsen the situation of private investors. Changing politics are also a risk as tax author-
ities tend to change the taxation structure on an annual basis. If taxation for example is
constricted it results in lower income and therefore worsening profitability for private inves-
tors in this case. Other uncontrollable risks are natural disasters. If for example flooding
occurs and damages or even destroys the construction of a building and cellar or first lev-
els, it may incur some serious renovation costs. (Private investor 22 January 2014.)
In order to avoid these risks, an experienced private investor should understand the con-
cept of modern portfolio theory. Harry Markowitz is considered to be the father of mod-
ern portfolio theory. The idea of the model is to create an investment portfolio that gives
the investor the highest rate of return with the given risk level or provides the investor with
the smallest risk level with a given rate of return (Markowitz 1952, 77). In other words,
modern portfolio theory attempts to balance with expected return and risk (Bellemore
1980, 153).
The Capital Asset Pricing Model is the most widely known asset pricing model in the
world. It was developed by Sharpe, Lintner, and Mossin between the years 1964 and
1966. According to Claus Munk, “the key message of the model is that the expected ex-
cess return on a risky financial asset is given by the product of the market-beta of the as-
set and the expected excess return on the market portfolio.” (2013, 1.) The basic idea of
this model is that investors should be compensated in two ways in their investments: time
value of money and risk. The model is generated to measure whether the expected return
congregates the required return in which case the investment should be accepted. The
formula is as follows:
Rf + β (Rm-Rf) + ε
Rf = Risk free rate
Rm = Expected market return
β = Beta of the security
ε = regression error term
It is important to understand the Capital Asset Pricing Model in the field of investment;
however, it is more related towards the stock and securities markets. The model does not
cater the requirements of the private investor as it does not focus on apartment-specific
figures, but is more focused on the market itself.

32
Investing is all about gaining a profit, an expected rate of return while minimizing risks so
to say. Evidently every investor has an expected rate of return they hope or require from
an investment. In apartment investment, this is usually gross rental income requirement.
The private investor in this thesis for example expects at least 6 % gross rental income
excluding refurbishment costs. Below is a simple illustration of how return and risk work
together.
Figure 7. Relation between risk and return.
As seen from above, the higher the expected return or actualized return, the higher the
risk as well. Similarly, the smaller the risk the smaller the return as well. (Private investor
22 January 2014.)
Return
Big risk Small risk
While risk diminishes,
return diminishes

33
3 Designing and Testing the Tool
This chapter discusses the process of designing the final product. The product is designed
using Microsoft Office Excel. It is important to notice that the product is produced using
Excel 2013 macro-enabled version. There may be some minor data lost when using earli-
er versions of Microsoft Office Excel. First stage of the process includes extensive desk-
top research in order to identify the necessary components for the cash flow profitability
tool. Once the required basic real estate investment theories are adopted, the process
moves on to task two: interviewing the primary private investor for comprehensive data
intake on components for a successful tool and features the private investor wants to be
included into the tool.
Through the qualitative face-to-face interview, the thesis process advances to the creation
of the tool phase. Creation of the tool will take place using agile methods; the tool is tested
at every step of the way to ensure it is developing towards the desired outcome. The pri-
vate investor will be contacted through the entire project also by phone conferences and
the tool will be regularly evaluated by him.
As a result of the 2-hour preliminary interview with the private investor, the following points
were raised and emphasized: “User-friendly tool, long-term profitability of a fixed time (20
years), emphasis on refurbishments and life cycle costs through the apartment house’s
lifetime and their impact on annual cash flow” (Private investor 29 December 2014). Most
cash flow and profitability calculators available measure annual or first-year cash flows
and profitability estimations. While these calculations give a basic understanding of the
potential income; they do not take into account the life cycle costs such as refurbishment
costs that will occur in the next 20 years.
The tool is first developed to count rental income calculation. A form sheet is designed to
enable the end user to input data such as building year, year of purchase, purchase price,
apartment size, and monthly rent amount and maintenance fee. By inputting above-
mentioned basic data, first year gross rental income, return on equity (ROE), and return
on investment (ROI) are automatically computed to give a first year percentage. In addi-
tion, the tool counts loan requirement on a 70% base, and computes own capital as 30%
of purchase price + transfer tax. By filling in “loan period” and “fixed interest rate”, cash
flow is automatically computed to first give amount of loan payment, which has been set to
be fixed in this thesis to ensure simplicity, for the given loan period.

34
The before-mentioned features of the draft were shown to the private investor for first
feedback. As a result of the 1st feedback Skype session in January, the private investor
advised to exclude the loan instalment deduction calculation from profitability calculations
because “it is not relevant to profitability calculation as loan instalment share amount is
basically money moved from the tenant’s pocket through the investor to the bank, but is
rather relevant to cash flow calculations” (Private investor 22 January 2015). Additionally,
cash flow shows cash flow after maintenance fee and interest share deduction as well as
cash flow after taxes. The loan instalment payment was included into a net cash flow cell
that simply shows if taking a loan has been beneficial where the net cash flow is above
zero. Another request was to keep the interest share fixed for simplicity; therefore, the
share of interest is calculated as (loan amount x fixed bank interest rate / 12) and this for-
mula is further divided by 2 in order to count the average interest throughout the loan pe-
riod.
After the basic form sheet is designed meaning the annual cash flow is measured, the
thesis writer further develops the tool by adding refurbishment information into the basic
form sheet. In December 2014 interview, the private investor put emphasis on refurbish-
ment costs and their effect on annual cash flow. At this stage the thesis writer made thor-
ough research on different materials and their useful lifetime, which then determines if and
when it needs to be repaired or renewed. It was first tested with thorough pipe repair. As
mentioned in theoretical framework, the base year for thorough pipe repair renovation is
every 47 years. The tool already includes the construction year of the apartment/building,
now the thesis writer adds the following components: The end-user tells whether or not
thorough pipe repair renovation has already been made and the year of the renovation
and can edit the average cost per square meter (default 700€). This info will calculate the
total renovation costs and the year the renovation will take place.
The thesis writer contacted the private investor to show the adjustments and draft of how
the refurbishment costs will be calculated with the example of thorough pipe repair. This
was approved in January and the thesis writer applied similar characteristics to count all
the other renovations (façade renovation including balcony renovation, roof repair, window
repair, and elevator construction or modernization). It is important to remember that the
material defines the time span for when the next repair occurs or if it even needs to be
upgraded in its lifetime. After this stage, an annual sheet called “20 years” is created to
horizontally show the annual based income and expenses, including annual cash flow
calculation and the estimated costs for repairs in the year they occur. Note that if the ren-
ovation is not included in the 20 years counted from the purchase year, the costs are not

35
in the estimations. In order to manipulate the estimation, the purchase year can be
changed to see the costs.
After the first draft and follow-up interview, the thesis writer designed a data sheet for for-
mula purposes. By adding new components to the basic form sheet such as the refur-
bishment costs, the private investor’s request was to split the refurbishment costs, be-
cause it is not realistic that the repair is paid at once especially when the costs are high
such as thorough pipe repair and façade renovation that can be over 20,000 euros. At first
only thorough pipe repair and façade renovation costs were split for 10 years, but later on
they were changed to 15 years. Simultaneously roof repair and window renovation costs
were split for 5 years, and elevator construction or modernization costs for 10 years in
order to obtain more realistic annual cash flow figures.
Because there are many variables of the time span based on material, purchase year,
construction year and prior renovations, the Excel function formulas were quite tricky to
develop in order to compute automation between the sheets. For example depending on
the loan period in years, the loan payments need to stop after a certain year. Another
tricky example is to share the renovation costs for 5, 10, or 15 years, but after hectic effort
the cells function correctly.
Even though the focus of the thesis is on cash flow calculations rather than on increases
in apartment’s value, the theoretical selling of the apartment is included in the last year’s
cash flow for overall profitability estimation purposes. Through thorough research on Sta-
tistics Finland figures, and as described in rental income & increase in apartment’s value –
section the average increase adjusted for inflation is approximately 1.538%. With this per-
centage, the future value of the apartment was counted. A percentage increase is showed
and by subtracting the value in 20 years by the original purchase price + transfer tax, the
capital gain/loss number is obtained. This is then discounted to present time as it is 20
years in the future and all other components in the thesis are at present time due to fixed
figures. Because refurbishment costs are split for different time periods, the remaining
refurbishment costs are considered as future debt and therefore deducted from the dis-
counted capital gain number. Cumulative net income including selling after 20 years is the
significant figure to the private investor that shows the overall success before and after
taxes.
While polishing “20 years” sheet, the thesis writer added “Costs Breakdown” sheet. As the
main focus is on refurbishment costs and their effect on annual cash flows, a pie chart
was created to illustrate the cost structure and a column chart illustrates the annual total
36
income before taxes. Next step was to figure out the most useful methods to show the
results. There was difficulty demarcating what results to show that would bring added val-
ue to the private investor. Finally during a skype conference call in February, it was decid-
ed that cumulative figures on the “20 years” sheet were most useful in addition to annual
ROE percentage, annual increase in apartment’s value, average annual cash flow, and
average ROE. Furthermore, a sheet called “financial leverage” was added to give further
analysis of the effects with and without financial leveraging as well as the opportunity to
compare required return with shares. Financial leverage calculations are for further devel-
opment and advanced calculations and personal preferences of the private investor. The
percentages can be tested in the tool based on personal requirements; therefore, the re-
sults are not analyzed in the project as a request of the private investor (Private investor
28 February 2015).
Before publishing, a compatibility check was implemented in order to ensure validity. The
tool was designed using Microsoft Office Excel 2013 version. It was examined that Excel
2010 fully functions as well apart from one minor lack in the version that is explained on
the “Costs breakdown” sheet as the pie chart requires 2013 version. In addition, it should
be noted that the tool is designed with U.S. settings, which means that it accepts a deci-
mal point to separate and a Finnish comma usage will give an error.
37
4 Results
Application and discussion will include the analysis of specific case apartments and dis-
cussion on the findings: does the time and effort used to invest in real estate investment
bring the private investor the desired profits? What is the cumulative cash flow for the in-
vestment? Is it negative or positive? The private investor will use the tool in the future in
order to evaluate the profitability of his current and potential investments. For project task
five, the results will be presented to the private investor first. After feedback, modifications,
and acceptance by the private investor it will be presented to the thesis advisors and fel-
low students in order to get evaluated. The thesis writer evaluates the learning objectives
throughout the project.
4.1 Application and cash flow analysis of 3 case apartments
This chapter will apply three different case apartments’ information into the tool in order to
test its validity and reliability. With the application of basic data, the tool will compute for
example first year gross rental income %, return on equity, return on investment, monthly
and annual cash flow, cumulative costs, estimated increase in apartment’s value and es-
timated timing and costs of different renovations and repairs. For risk perspective purpos-
es, the form sheet also calculates a risk scenario if the interest for a loan would be 2 per-
centile higher and a financial leverage sheet for advanced users to do a simple compari-
son with a different investment option/portfolio.
Refurbishment costs are constructed by the following information: If thorough pipe repair,
façade renovation, roof repair and window repair have been done and the year of the re-
pair where necessary. In addition, façade, roof, and windows require material knowledge
to estimate the repair time span and costs based on the specific material used. For eleva-
tor cost estimation, it is required to firstly answer if there is an elevator in the building, if
not and one is not going to be built then other fields can be left empty. If building or mod-
ernization is upcoming, required fields is the number of apartments in the apartment hous-
ing company, average total costs default is 70,000, which can be changed depending on
the type of renovation.
Once refurbishment information is input, the tool will give an estimation of the year that
next repair takes place as well as an estimation of potential costs if they occur in the next
20 years counted from the purchase year. As mentioned before, in order to obtain more

38
realistic annual cash flow figures, thorough pipe repair and façade renovation costs have
been split for 15 years, window and roof repair for 5 years, and elevator construction or
modernization for 10 years. If all the costs are not covered in the 20-year outlook, the re-
maining liabilities are noticed in the overall calculations on the form sheet deducted from
the present value of capital gain.
Case 1 apartment was built in 1977 and a purchase was made in 2015 for 69,000 euros.
Its area is 38 square meters. Rent amount is 540, while maintenance fee equals to 136.6
euros per month. The negotiated loan period is 15 years and the fixed interest rate is
1.403% including marginal and 3-month Euribor rate. Similarly to the two previous cases,
the tool automatically calculates the first year gross rental income %, return on investment
and return on equity as well as monthly and annual cash flows both excluding and later on
including the refurbishment costs.
Next, thorough pipe repair nor façade repair have been done. Wall material is concrete
element. Roof repair has been finished in 2000 and the roof material is bitumen. Windows
however have not been upgraded and the sash material is wooden. From this information
it can be estimated that there will be mentionable refurbishment costs in the next 20 years
for this apartment housing company.
Figure 8. Costs breakdown pie chart and an annual breakdown of cash flows column chart
for Case 1.
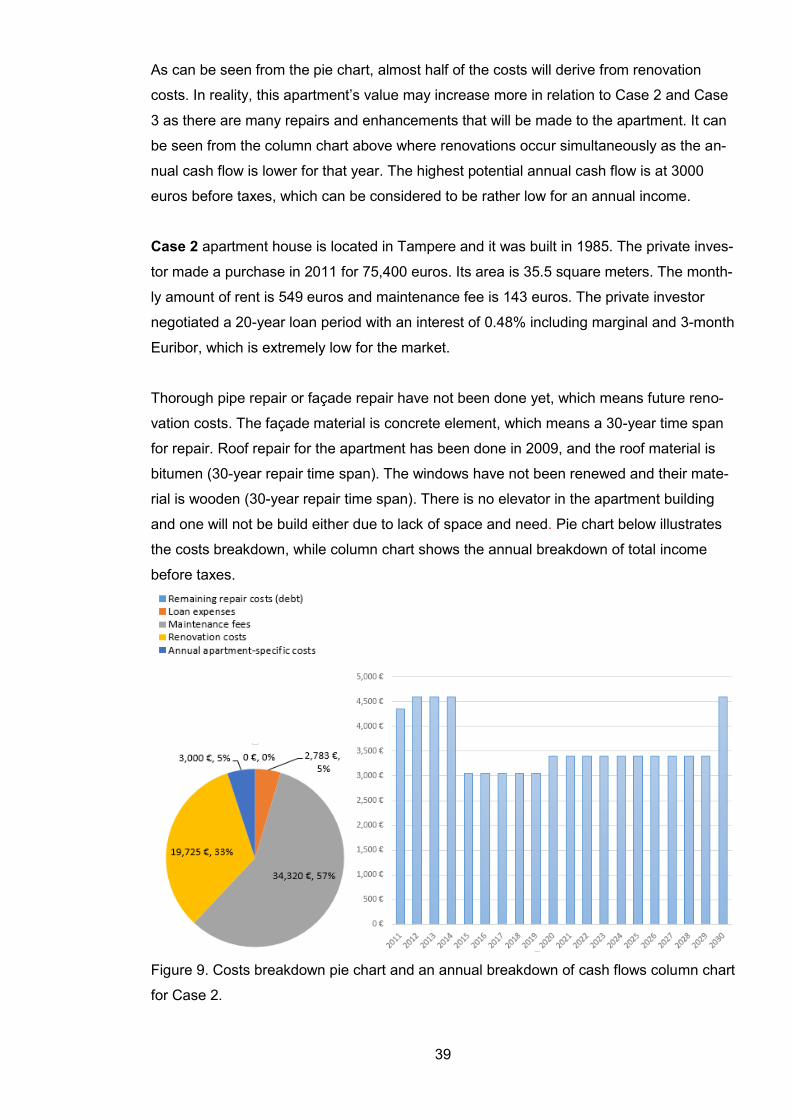
39
As can be seen from the pie chart, almost half of the costs will derive from renovation
costs. In reality, this apartment’s value may increase more in relation to Case 2 and Case
3 as there are many repairs and enhancements that will be made to the apartment. It can
be seen from the column chart above where renovations occur simultaneously as the an-
nual cash flow is lower for that year. The highest potential annual cash flow is at 3000
euros before taxes, which can be considered to be rather low for an annual income.
Case 2 apartment house is located in Tampere and it was built in 1985. The private inves-
tor made a purchase in 2011 for 75,400 euros. Its area is 35.5 square meters. The month-
ly amount of rent is 549 euros and maintenance fee is 143 euros. The private investor
negotiated a 20-year loan period with an interest of 0.48% including marginal and 3-month
Euribor, which is extremely low for the market.
Thorough pipe repair or façade repair have not been done yet, which means future reno-
vation costs. The façade material is concrete element, which means a 30-year time span
for repair. Roof repair for the apartment has been done in 2009, and the roof material is
bitumen (30-year repair time span). The windows have not been renewed and their mate-
rial is wooden (30-year repair time span). There is no elevator in the apartment building
and one will not be build either due to lack of space and need. Pie chart below illustrates
the costs breakdown, while column chart shows the annual breakdown of total income
before taxes.
Figure 9. Costs breakdown pie chart and an annual breakdown of cash flows column chart
for Case 2.

40
The costs breakdown shows the highest expenses to be derived from maintenance fees;
while renovation costs are relatively less compared to Case 1. However, as can be seen
in the tool, thorough pipe repair will take place in 2032 and the repair will cost approxi-
mately 24,850 euros. This should be considered by the private investor perhaps in terms
of selling the apartment before the costly repair. The renovation occurrences can be seen
from the column chart where the cash flow is lower. The highest potential annual cash
flow is about 4,600 euros.
Case 3 apartment was built in 1948 and the private investor purchased it in 2014 for
57,000 euros. Its area is 32 square meters. The amount of rent asked is 485 while month-
ly maintenance fee equals to 115.2 euros. Loan period is 17 years with a loan interest of
1.569 % including marginal and 3-month Euribor. The tool automatically calculates the
amount of loan (70% of purchase price) and own invested capital (30% of purchase price
+ transfer tax).
Thorough pipe repair has been done in 2003, while façade repair has not been done. Fa-
çade material is equivalent to the lifetime of brick wall; therefore, it is expected to last as
long as the apartment building and no façade renovation is required. Roof repair has also
been done in 1988 at the same time as windows. Roof material is tin (50-year repair time
span) and window sash material is wooden (30-year repair time span). Below is an illus-
tration of the costs breakdown and an annual breakdown of total income before taxes.
Costs breakdown pie chart and an annual breakdown of cash flows column chart for Case
3.

41
For Case 3, the annual cash flow seems to be reasonable stable and at a higher level
compared to Case 1 and Case 2. The greatest costs for the apartment come from mainte-
nance fees with 70% share of the total costs. Renovation costs are extremely low with
only 3,200 euros that will be covered for a window renovation in 2018 as is seen from the
lower annual cash flow in the column chart above.
4.2 Discussion and suggestions
This section shows the results of the 3 different case apartments in table figures. Below is
an illustration of the results on form-sheet that includes cumulative cash flow calculations
and apartment’s value increase anticipation. Once the net income and present value of
capital gain after debt are added, the overall result is obtained.
Table 5. Summary of cash flow profitability results.
Cumulative cash flow Case 1. Case 2. Case 3.
Revenue from rental income 129,600 € 131,760 € 116,400 €
Expenses
Maintenance fees 32,832 € 34,320 € 27,648 €
Refurbishment costs 42,637 € 19,725 € 3,200 €
Loan interest costs 5,804 € 2,783 € 7,289 €
Apartment specific 3,000 € 3,000 € 3,000 €
Total expenses 84,272 € 59,828 € 41,137 €
Gross income 45,328 € 71,932 € 75,263 €
Average annual cash flow 2,266 € 3,597 € 3,763 €
As can be seen from Table 5, Case apartment 1 has the lowest gross income after ex-
penses are deducted from the revenue. The greatest difference can be seen in refurbish-
ment costs. The variance between apartments is noticeable and gives validity to the
statement of the private investor that refurbishment costs are the deal-breaker in apart-
ment investment. By looking at loan interest costs, it can be seen that for Case 2 apart-
ment the private investor has negotiated the lowest margin. The most cost effective case
apartment from the cash flow investment perspective is Case 3 apartment with 75,263
euros in 20 years. These numbers are gross figures and a fixed tax of 30% is deducted
from the gross income.

42
Table 6. Increase in apartment’s value over a 20-year period.
Apartment’s value increase Case 1. Case 2. Case 3.
Estimated value in 20 years 93,628 € 102,313 € 77,345 €
Percentage increase 36% 36% 36 %
Purchase price + transfer tax 70,380 € 76,908 € 58,140 €
Capital gain 23,248 € 25,405 € 19,205 €
PV of capital gain 7,249 € 7,921 € 5,988 €
Remaining repair costs (debt) 7,093 € - -
PV of capital gain after debt 156 € 7,921 € 5,988 €
Cumulative gross income in-
cluding selling in 20 years 45,483 € 79,853 € 81,251 €
Average ROE 9.72 % 10.76 % 10.14 %
The interest rate for average annual increase in square meter prices was counted in sec-
tion rental income & increase in apartment’s value to be 1.538%. Because the same rate
is used for all the cases, the percentage increase is 36% of the selling price compared to
the purchase price. First the capital gain is discounted to present time and the remaining
repair costs (debt) are deducted from this to obtain present value of capital gain after debt.
As seen above, the results differ between the cases: Case 1 has 156 euros, Case 2
equals 7,921 euros, and Case 3 equals 5,988 euros. Case 1’s lower figure is derived from
remaining repair costs that means there are repairs to pay for after 20 years as the costs
are split between 5, 10, or 15 years depending on the renovation.
If looking at the return on equity average, the most successful case for the private investor
is Case 2 with 10.76%; however, in terms of cumulative gross income including selling in
20 years Case 3 is the best investment. The main reason for the success of Case 3 is that
most expensive repairs have already been done to the apartment and they are not
upcoming unlike with Case 1 and Case 2. Even though the difference between Case 2
and Case 3 seem little, as mentioned before a thorough pipe repair worth 24,850 euros is
upcoming to Case 2 apartment in 2032 and the annual cash flows will diminish drastically.
The advice would be to consider selling Case 2 apartment before the thorough pipe repair
takes place. As the private investor valued annual cash flows, the highest profitability
through cash flows comes from Case 3, while the lowest is obtained from Case 1
apartment.
43
5 Project evaluation
In this section, the thesis writer will evaluate the process and results of the thesis process
and end-product. It contains feedback from the private investor on usability and extent of
the tool, feedback from advisors, and self-evaluation on the thesis process. The goal of
this thesis was to create a cash flow analysis tool for private long-term real estate invest-
ment with an emphasis on annual cash flow and refurbishment costs over the apartment’s
lifetime. There was a commissioning private investor to whom the tool was designed, evi-
dently being of benefit to the thesis writer and other investors investing in apartments with
a similar cash flow investment based strategy. The profitability through cash flow of three
different case apartments were shortly analyzed by using the tool created for this purpose.
The tool was created using Microsoft Office Excel. Thorough desktop research enabled
the creation of the form sheet with functioning and automatic formulas. The idea was to
have as little to input for the private investor as possible; however, including a thorough
analysis and estimations of refurbishment costs, because they were the focus for the pri-
vate investor. Most valuable information about refurbishment costs, materials, and
timespans were learned from a Finnish book called Osta, vuokraa, vaurastu written by
Joonas Orava and Olli Turunen as well as information, case examples, and scope given
by the interview with the private investor.
From the beginning it was clear that the topic was going to be challenging as it is not cov-
ered in the GloBBA curriculum. There was an ongoing difficulty attempting to demarcate
the project as there was so much information available and investment methods that could
be used in theory; however, towards the end more and more of them were realized not to
be applicable in this thesis project and a better focus gave better results. The original plan
was too wide and it was limited to the extent that is currently sufficient. Further additions
or developments can take place in the future if errors are detected, usability can be made
even more convenient, or if more investment analysis methods are added to give even
more precise results; however, for the time being and resources available the tool is suffi-
cient and fully functioning to give the private investor the estimations and figures he needs
in order to determine the future of his investments.
The idea of the project was to describe how and why the tool was designed. Components
were explained shortly and to the point, because the purpose was not to define them in-
depth, but to provide background information for the functionality of the tool. More thor-
ough explanations would have required a much larger project in terms of time and re-
sources. For example time value of money calculations require very close consideration,

44
in-depth research, experience of the field and time especially because the estimations are
rough and future cannot be anticipated. For the time being, the tool does not cover infla-
tion and time value of money for this reason, because the variations are too wide and
would not satisfy the needs of the private investor. For future developments, inflation and
time value of money could be researched if they are found to be useful for the purpose. In
addition, if in the future the private investor or the thesis writer want to see results after 20
years of purchase year, the tool could be further developed to calculate a longer time pe-
riod.

45
References
Balance Consulting 2015. Oman pääoman tuotto-% (ROE) URL:
http://www.balanceconsulting.fi/tunnusluvut/oman_paaoman_tuotto. Accessed: 13 Janu-
ary 2015.
Barringer, P. 2003. A Life Cycle Cost Summary. Conference proceedings of the Interna-
tional Conference of Maintenance Societies. Conducted by the Maintenance Engineering
Society of Australia. Perth.
Bellemore, D. 1980. Investment analysis and portfolio selection an integrated approach.
South-Western Publication. Cincinnati.
Estola, M. 2013. Kiinteistön elinkaarikustannukset korjausrakentamisessa. URL:
https://www.theseus.fi/bitstream/handle/10024/57287/Estola_Markku.pdf?sequence=1.
Accessed: 13 February 2015.
Gallagher, M. 2014. Capital gains rules for investment property. Home Guides. URL:
http://homeguides.sfgate.com/capital-gains-rules-investment-property-1966.html. Ac-
cessed: 2 January 2015.
Global Property Guide 2014. House prices in Finland stable, but slow economic growth is
hurting sentiment. URL: http://www.globalpropertyguide.com/Europe/Finland/Price-History
Accessed: 13 January 2015.
Hartman, J. & Schafrick, I. 2004. The Engineering Economist. Journal. University of Flori-
da. Florida.
Knupfer, S. & Puttonen, V. 2012. Moderni rahoitus. 6th edition. Sanoma Pro Oy. Helsinki. Leppiniemi, J. 2009. Rahoitus. 5th Edition. WSOY. Helsinki.
Markowitz, H. 1952. Portfolio selection. The journal of finance. Vol. 7. URL:
https://www.math.ust.hk/~maykwok/courses/ma362/07F/markowitz_JF.pdf. Accessed: 13
February 2015.
Martikainen, T. & Martikainen, M. 2009. 7th edition. Rahoituksen perusteet. WSOY pro.

46
Munk, C. 2013. Financial Asset Pricing Theory. 1st Edition. Oxford University Press. Ox-
ford.
Niu, E. 2014. Apple Inc. Stock: How much has debt helped shareholders. URL:
http://www.fool.com/investing/general/2014/07/11/apple-inc-stock-how-much-has-debt-
helped-sharehold.aspx. Accessed: 12 March 2015.
Orava, J. & Turunen, O. 2013. Osta, vuokraa, vaurastu. 2nd edition. Talentum. Lithuania.
Pellervon Taloustutkimus 2013. Asuntosijoittamisen alueelliset tuotot vuosina 2013-2017.
URL: http://www.vuokranantajat.fi/attachements/2013-07-03T09-05-3023412.pdf. Ac-
cessed: 12 March 2015.
Pogue, M. 2004. Investment Appraisal: A New Approach. Managerial Auditing Journal.
Vol. 19 No. 4.
Private investor. 29 December 2014. Master of Science. Interview. Tampere.
Private investor. 28 February 2015. Master of Science. Interview. Tampere.
Private investor. 22 January 2015. Master of Science. Interview. Helsinki.
Realty Mogul 2014. Real estate crowdfunding with a cash flow focus. URL:
https://www.realtymogul.com/blog/real-estate-crowdfunding-with-a-cash-flow-focus. Ac-
cessed: 7 January 2015.
Scott, D. 2003. Wall Street Words: An A to Z guide to investment terms for today’s inves-
tor. URL: http://financial-dictionary.thefreedictionary.com/Financial+Leverage. Accessed:
15 March 2015.
Statistics Finland 2015. Kuluttajahintaideksi. URL: http://tilastokeskus.fi/til/khi/kay.html.
Accessed: 14 February 2015.
Statistics Finland 2015. Osakeasuntojen hinnat. URL:
http://tilastokeskus.fi/til/ashi/index.html. Accessed: 14 February 2015.

47
Taloussanomat. 2012. Taloussanakirja: kriittinen piste. URL:
http://www.taloussanomat.fi/porssi/sanakirja/termi/kriittinen+piste/0. Accessed: 15 March
2015.
Taxpayers Association of Finland 2015. Investment. URL:
https://www.veronmaksajat.fi/Sijoittaminen/. Accessed: 19 March 2015.
U.S. Small Business Administration. Developing a cash flow analysis. URL:
https://www.sba.gov/content/develop-cash-flow-analysis-your-business. Accessed: 19
March 2015.
Vuokria Online 2013. Asuntosijoittajan vinkki 17: Kassavirtasijoittaminen. URL:
http://www.vuokria.com/kassavirtasijoittaminen/. Accessed: 19 March 2015.
Wall Street Oasis. What is “WACC” or the weighted average cost of capital? URL:
http://www.wallstreetoasis.com/faqs/what-is-wacc-or-the-weighted-average-cost-of-
capital. Accessed: 12 March 2015.
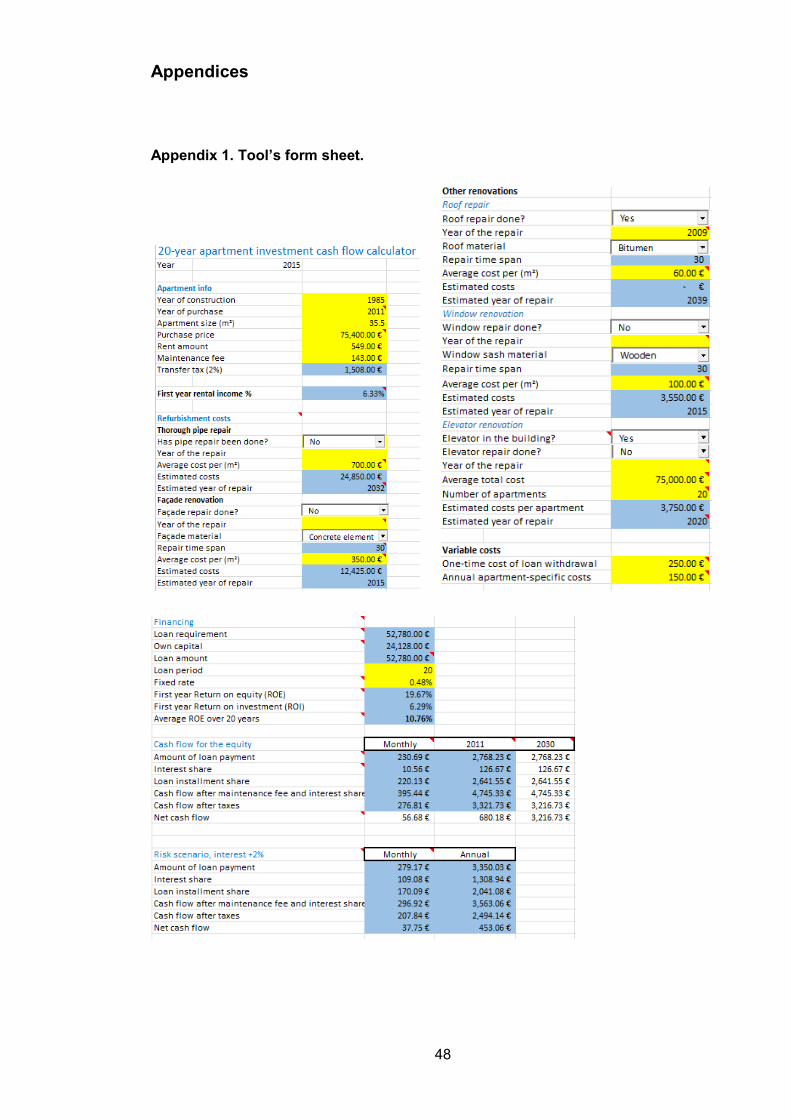
48
Appendices
Appendix 1. Tool’s form sheet.

49
Appendix 2. Interview Questions
December 29th, 2014. Face-to-face interview in Tampere, Finland
- What is your main focus in apartment investment? - What components do you want to be included in the tool? - What would be the appropriate time frame? - What is your investment strategy? - What do you want to gain from this thesis project? - Can you describe the general investment process undergone when purchasing an
apartment? - Based on the desktop research do you underline the average costs for repairs? - Do you agree with the time spans for different repairs according to research? - From your experience, how often approximately is elevator repair span? - What factors should be kept fixed for simplicity? -
January 22nd, 2014. 2-hour Skype feedback session.
- What is your emphasis on appreciation in apartment’s value? - What are the 3 case examples you want to be shortly evaluated? - Please provide me with the basic data, loan information, and refurbishment history
of the 3 case apartments - What are the most common risks in apartment investment? - Why do you raise most focus on annual cash flow and life cycle costs? - Should time value of money be considered?
February 28th, 2015. 1-hour Skype session.
- I have developed cumulative and average figures, are they of benefit to your needs?
- What is your expected rate of return for the investment? - What is your expected return on equity? - Is the usability of the tool convenient? - What are the points of improvement for the tool for future developments? - Inflation is only noted for appreciation in value, because all other factors are kept
fixed, is this sufficient?