create a simple guide gui
TRANSCRIPT

11/10/2014 Create a Simple GUIDE GUI - MATLAB & Simulink
http://www.mathworks.com/help/matlab/creating_guis/about-the-simple-guide-gui-example.html 1/14
Create a Simple GUIDE GUI
This example shows how to create a simple GUIDE graphical user interface (GUI), such as shown in thefollowing figure.
Subsequent topics guide you through the process of creating this GUI.
If you prefer to view and run the code that created this GUI without creating it, set your current folder to oneto which you have write access. Copy the example code and open it in the Editor by issuing the followingMATLAB® commands:
copyfile(fullfile(docroot, 'techdoc','creating_guis',... 'examples','simple_gui*.*')),fileattrib('simple_gui*.*', '+w');guide simple_gui.fig;edit simple_gui.m
To run the GUI, on the Editor tab, in the Run section, click Run .
Open a New GUI in the GUIDE Layout Editor1. Start GUIDE by typing guide at the MATLAB prompt.

11/10/2014 Create a Simple GUIDE GUI - MATLAB & Simulink
http://www.mathworks.com/help/matlab/creating_guis/about-the-simple-guide-gui-example.html 2/14
2. In the GUIDE Quick Start dialog box, select the Blank GUI (Default) template, and then click OK.
3. Display the names of the GUI components in the component palette:
a. Select File > Preferences > GUIDE.
b. Select Show names in component palette.
c. Click OK.

11/10/2014 Create a Simple GUIDE GUI - MATLAB & Simulink
http://www.mathworks.com/help/matlab/creating_guis/about-the-simple-guide-gui-example.html 3/14
Set the GUI Figure Size in GUIDESet the size of the GUI by resizing the grid area in the Layout Editor. Click the lower-right corner and drag ituntil the GUI is approximately 3 in. high and 4 in. wide. If necessary, make the window larger.
Layout the Simple GUIDE GUIAdd, align, and label the components in the GUI.
1. Add the three push buttons to the GUI. Select the push button tool from the component palette at the

11/10/2014 Create a Simple GUIDE GUI - MATLAB & Simulink
http://www.mathworks.com/help/matlab/creating_guis/about-the-simple-guide-gui-example.html 4/14
left side of the Layout Editor and drag it into the layout area. Create three buttons, positioning themapproximately as shown in the following figure.
2. Add the remaining components to the GUI.
A static text area
A pop-up menu
An axes
Arrange the components as shown in the following figure. Resize the axes component to approximately2-by-2 inches.
Align the Components
If several components have the same parent, you can use the Alignment Tool to align them to one another.

11/10/2014 Create a Simple GUIDE GUI - MATLAB & Simulink
http://www.mathworks.com/help/matlab/creating_guis/about-the-simple-guide-gui-example.html 5/14
To align the three push buttons:
1. Select all three push buttons by pressing Ctrl and clicking them.
2. Select Tools > Align Objects.
3. Make these settings in the Alignment Tool:
Left-aligned in the horizontal direction.
20 pixels spacing between push buttons in the vertical direction.
4. Click OK.
Label the Push Buttons
Each of the three push buttons specifies a plot type: surf, mesh, and contour. This topic shows you how to

11/10/2014 Create a Simple GUIDE GUI - MATLAB & Simulink
http://www.mathworks.com/help/matlab/creating_guis/about-the-simple-guide-gui-example.html 6/14
label the buttons with those options.
1. Select View > Property Inspector.
2. In the layout area, click the top push button.
3. In the Property Inspector, select the String property, and then replace the existing value with the wordSurf.
4. Click outside the String field. The push button label changes to Surf.
5. Click each of the remaining push buttons in turn and repeat steps 3 and 4. Label the middle push buttonMesh, and the bottom button Contour.
List Pop-Up Menu Items
The pop-up menu provides a choice of three data sets: peaks, membrane, and sinc. These data setscorrespond to MATLAB functions of the same name. This topic shows you how to list those data sets aschoices in the pop-menu.

11/10/2014 Create a Simple GUIDE GUI - MATLAB & Simulink
http://www.mathworks.com/help/matlab/creating_guis/about-the-simple-guide-gui-example.html 7/14
1. In the layout area, click the pop-up menu.
2. In the Property Inspector, click the button next to String. The String dialog box displays.
3. Replace the existing text with the names of the three data sets: Peaks, Membrane, and Sinc. PressEnter to move to the next line.
4. When you finish editing the items, click OK.
The first item in your list, Peaks, appears in the pop-up menu in the layout area.
Modify the Static Text
In this GUI, the static text serves as a label for the pop-up menu. This topic shows you how to change thestatic text to read Select Data.
1. In the layout area, click the static text.
2. In the Property Inspector, click the button next to String. In the String dialog box that displays, replacethe existing text with the phrase Select Data.

11/10/2014 Create a Simple GUIDE GUI - MATLAB & Simulink
http://www.mathworks.com/help/matlab/creating_guis/about-the-simple-guide-gui-example.html 8/14
3. Click OK.
The phrase Select Data appears in the static text component above the pop-up menu.
Save the GUI Layout
When you save a GUI, GUIDE creates two files, a FIG-file and a code file. The FIG-file, with extension.fig, is a binary file that contains a description of the layout. The code file, with extension .m, containsMATLAB functions that control the GUI behavior.
1. Save and activate your GUI by selecting Tools > Run.
2. GUIDE displays a dialog box displaying: "Activating will save changes to your figure file and MATLABcode. Do you wish to continue?
Click Yes.
3. GUIDE opens a Save As dialog box in your current folder and prompts you for a FIG-file name.
4. Browse to any folder for which you have write privileges, and then enter the file name simple_gui for theFIG-file. GUIDE saves both the FIG-file and the code file using this name.
5. If the folder in which you save the GUI is not on the MATLAB path, GUIDE opens a dialog box, givingyou the option of changing the current folder to the folder containing the GUI files, or adding that folderto the top or bottom of the MATLAB path.
6. GUIDE saves the files simple_gui.fig and simple_gui.m, and then activates the GUI. It also opensthe GUI code file in your default editor.
The GUI opens in a new window. Notice that the GUI lacks the standard menu bar and toolbar thatMATLAB figure windows display. You can add your own menus and toolbar buttons with GUIDE, but bydefault a GUIDE GUI includes none of these components.
When you run simple_gui, you can select a data set in the pop-up menu and click the push buttons, butnothing happens. This is because the code file contains no statements to service the pop-up menu andthe buttons.
11/10/2014 Create a Simple GUIDE GUI - MATLAB & Simulink
http://www.mathworks.com/help/matlab/creating_guis/about-the-simple-guide-gui-example.html 9/14
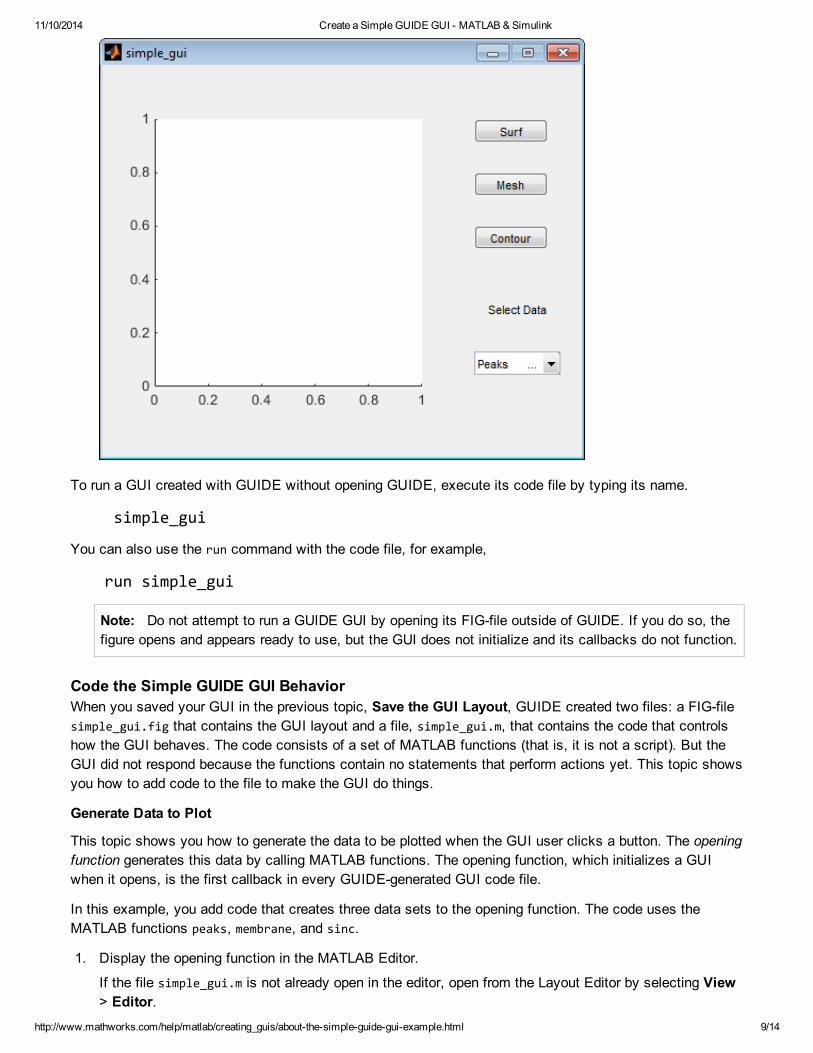
To run a GUI created with GUIDE without opening GUIDE, execute its code file by typing its name.
simple_gui
You can also use the run command with the code file, for example,
run simple_gui
Note: Do not attempt to run a GUIDE GUI by opening its FIG-file outside of GUIDE. If you do so, thefigure opens and appears ready to use, but the GUI does not initialize and its callbacks do not function.
Code the Simple GUIDE GUI BehaviorWhen you saved your GUI in the previous topic, Save the GUI Layout, GUIDE created two files: a FIG-filesimple_gui.fig that contains the GUI layout and a file, simple_gui.m, that contains the code that controlshow the GUI behaves. The code consists of a set of MATLAB functions (that is, it is not a script). But theGUI did not respond because the functions contain no statements that perform actions yet. This topic showsyou how to add code to the file to make the GUI do things.
Generate Data to Plot
This topic shows you how to generate the data to be plotted when the GUI user clicks a button. The openingfunction generates this data by calling MATLAB functions. The opening function, which initializes a GUIwhen it opens, is the first callback in every GUIDE-generated GUI code file.
In this example, you add code that creates three data sets to the opening function. The code uses theMATLAB functions peaks, membrane, and sinc.
1. Display the opening function in the MATLAB Editor.
If the file simple_gui.m is not already open in the editor, open from the Layout Editor by selecting View> Editor.
11/10/2014 Create a Simple GUIDE GUI - MATLAB & Simulink
http://www.mathworks.com/help/matlab/creating_guis/about-the-simple-guide-gui-example.html 10/14
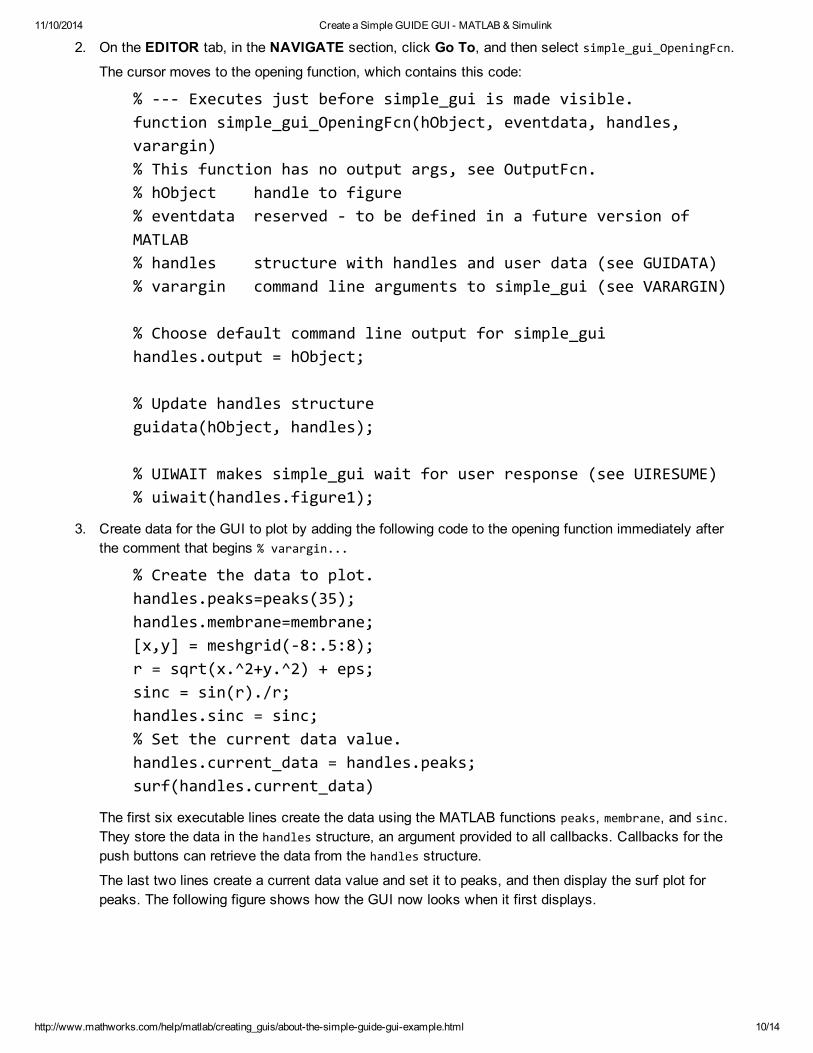
2. On the EDITOR tab, in the NAVIGATE section, click Go To, and then select simple_gui_OpeningFcn.
The cursor moves to the opening function, which contains this code:
% --- Executes just before simple_gui is made visible.function simple_gui_OpeningFcn(hObject, eventdata, handles, varargin)% This function has no output args, see OutputFcn.% hObject handle to figure% eventdata reserved - to be defined in a future version of MATLAB% handles structure with handles and user data (see GUIDATA)% varargin command line arguments to simple_gui (see VARARGIN)
% Choose default command line output for simple_guihandles.output = hObject; % Update handles structureguidata(hObject, handles); % UIWAIT makes simple_gui wait for user response (see UIRESUME)% uiwait(handles.figure1);
3. Create data for the GUI to plot by adding the following code to the opening function immediately afterthe comment that begins % varargin...
% Create the data to plot.handles.peaks=peaks(35);handles.membrane=membrane;[x,y] = meshgrid(-8:.5:8);r = sqrt(x.^2+y.^2) + eps;sinc = sin(r)./r;handles.sinc = sinc;% Set the current data value.handles.current_data = handles.peaks;surf(handles.current_data)
The first six executable lines create the data using the MATLAB functions peaks, membrane, and sinc.They store the data in the handles structure, an argument provided to all callbacks. Callbacks for thepush buttons can retrieve the data from the handles structure.
The last two lines create a current data value and set it to peaks, and then display the surf plot forpeaks. The following figure shows how the GUI now looks when it first displays.

11/10/2014 Create a Simple GUIDE GUI - MATLAB & Simulink
http://www.mathworks.com/help/matlab/creating_guis/about-the-simple-guide-gui-example.html 11/14
Code Pop-Up Menu Behavior
The pop-up menu presents options for plotting the data. When the GUI user selects one of the three plots,MATLAB software sets the pop-up menu Value property to the index of the selected string. The pop-up menucallback reads the pop-up menu Value property to determine the item that the menu currently displays , andsets handles.current_data accordingly.
1. Display the pop-up menu callback in the MATLAB Editor. In the GUIDE Layout Editor, right-click thepop-up menu component, and then select View Callbacks > Callback.

11/10/2014 Create a Simple GUIDE GUI - MATLAB & Simulink
http://www.mathworks.com/help/matlab/creating_guis/about-the-simple-guide-gui-example.html 12/14
GUIDE displays the GUI code file in the Editor, and moves the cursor to the pop-menu callback, whichcontains this code:
% --- Executes on selection change in popupmenu1.function popupmenu1_Callback(hObject, eventdata, handles)% hObject handle to popupmenu1 (see GCBO)% eventdata reserved - to be defined in a future version of MATLAB% handles structure with handles and user data (see GUIDATA)
2. Add the following code to the popupmenu1_Callback after the comment that begins % handles...
This code first retrieves two pop-up menu properties:
String — a cell array that contains the menu contents
Value — the index into the menu contents of the selected data set
The code then uses a switch statement to make the selected data set the current data. The laststatement saves the changes to the handles structure.
% Determine the selected data set.str = get(hObject, 'String');val = get(hObject,'Value');% Set current data to the selected data set.switch str{val};case 'Peaks' % User selects peaks. handles.current_data = handles.peaks;

11/10/2014 Create a Simple GUIDE GUI - MATLAB & Simulink
http://www.mathworks.com/help/matlab/creating_guis/about-the-simple-guide-gui-example.html 13/14
case 'Membrane' % User selects membrane. handles.current_data = handles.membrane;case 'Sinc' % User selects sinc. handles.current_data = handles.sinc;end% Save the handles structure.guidata(hObject,handles)
Code Push Button Behavior
Each of the push buttons creates a different type of plot using the data specified by the current selection inthe pop-up menu. The push button callbacks get data from the handles structure and then plot it.
1. Display the Surf push button callback in the MATLAB Editor. In the Layout Editor, right-click the Surfpush button, and then select View Callbacks > Callback.
In the Editor, the cursor moves to the Surf push button callback in the GUI code file, which containsthis code:
% --- Executes on button press in pushbutton1.function pushbutton1_Callback(hObject, eventdata, handles)% hObject handle to pushbutton1 (see GCBO)% eventdata reserved - to be defined in a future version of MATLAB% handles structure with handles and user data (see GUIDATA)
2. Add the following code to the callback immediately after the comment that begins % handles...
% Display surf plot of the currently selected data.

11/10/2014 Create a Simple GUIDE GUI - MATLAB & Simulink
http://www.mathworks.com/help/matlab/creating_guis/about-the-simple-guide-gui-example.html 14/14
surf(handles.current_data);
3. Repeat steps 1 and 2 to add similar code to the Mesh and Contour push button callbacks.
Add this code to the Mesh push button callback, pushbutton2_Callback:
% Display mesh plot of the currently selected data. mesh(handles.current_data);
Add this code to the Contour push button callback, pushbutton3_Callback:
% Display contour plot of the currently selected data. contour(handles.current_data);
4. Save your code by selecting File > Save.
Open and Run the Simple GUIDE GUIIn Code the Simple GUIDE GUI Behavior, you programmed the pop-up menu and the push buttons. Youalso created data for them to use and initialized the display. Now you can run your GUI and see how itworks.
1. Run your GUI from the Layout Editor by selecting Tools > Run.
2. In the pop-up menu, select Membrane, and then click the Mesh button. The GUI displays a mesh plotof the MathWorks® L-shaped Membrane logo.
3. Try other combinations before closing the GUI.