crc barclay's ceo energy-power conference
TRANSCRIPT

“Charting a new course”
Barclay’s CEO Energy-Power Conference Presentation
September 2021

Francisco LeonEVP & CFO
Mac McFarlandPresident & CEO

The information included herein contains forward-looking statements that involve risks and uncertainties that could materially affect our expected results of operations, liquidity, cash flows and business prospects. Such
statements include those regarding our expectations as to our future:
Actual results may differ from anticipated results, sometimes materially, and reported results should not be considered an indication of future performance. While we believe assumptions or bases underlying our expectations
are reasonable and make them in good faith, they almost always vary from actual results, sometimes materially. We also believe third-party statements we cite are accurate but have not independently verified them and do not
warrant their accuracy or completeness. Factors (but not necessarily all the factors) that could cause results to differ include:
Words such as "anticipate," "believe," "continue," "could," "estimate," "expect," "goal," "intend," "likely," "may," "might," "plan," "potential," "project," "seek," "should," "target, "will" or "would" and similar words that reflect the
prospective nature of events or outcomes typically identify forward-looking statements. Any forward-looking statement speaks only as of the date on which such statement is made, and we undertake no obligation to correct or
update any forward-looking statement, whether as a result of new information, future events or otherwise, except as required by applicable law.
See the Investor Relations page at www.crc.com for additional information about 3P reserves and other hydrocarbon resource quantities, PV-10 and standardized measure, finding and development (F&D) costs, recycle ratio
calculations, reserve replacement ratios, debt-adjusted shares calculations, drilling locations and reconciliations of non-GAAP measures to the closest GAAP equivalent.
• financial position, liquidity, cash flows and results of operations
• business prospects
• transactions and projects
• operating costs
• operations and operational results including production, hedging and capital investment
• budgets and maintenance capital requirements
• reserves and reservoir characteristics
• type curves
• expected synergies from acquisitions and joint ventures
• energy transition initiatives
Forward Looking / Cautionary Statements – Certain Terms
• our ability to execute our business plan post-emergence
• the volatility of commodity prices and the potential for sustained low oil, natural gas and natural gas
liquids prices
• impact of our recent emergence from bankruptcy on our business and relationships
• debt limitations on our financial flexibility
• insufficient cash flow to fund planned investments, interest payments on our debt, debt repurchases or
changes to our capital plan
• insufficient capital or liquidity, including as a result of lender restrictions, unavailability of capital markets
or inability to attract potential investors
• limitations on transportation or storage capacity and the need to shut-in wells
• inability to enter into desirable transactions including acquisitions, asset sales and joint ventures
• our ability to utilize our net operating loss carryforwards to reduce our income tax obligations
• legislative or regulatory changes, including those related to (i) drilling, completion, well stimulation,
operation, maintenance or abandonment of wells or facilities, (ii) managing energy, water, land,
greenhouse gases (GHGs) or other emissions, (iii) protection of health, safety and the environment, (iv) tax
credits, carbon credits or other incentives or (v) transportation, marketing and sale of our products
• joint ventures and acquisitions and our ability to achieve expected synergies
• the recoverability of resources and unexpected geologic conditions
• incorrect estimates of reserves and related future cash flows and the inability to replace reserves
• changes in business strategy
• production-sharing contracts' effects on production and unit operating costs
• the effect of our stock price on costs associated with incentive compensation
• effects of hedging transactions
• equipment, service or labor price inflation or unavailability
• availability or timing of, or conditions imposed on, permits and approvals
• lower-than-expected production, reserves or resources from development projects, joint ventures or
acquisitions, or higher-than-expected decline rates
• disruptions due to accidents, mechanical failures, power outages, transportation or storage constraints,
natural disasters, labor difficulties, cyber attacks or other catastrophic events
• pandemics, epidemics, outbreaks, or other public health events, such as the COVID-19
• our ability to recognize the benefits of business strategies and initiatives related to energy transition,
including carbon capture and storage projects and other renewable energy efforts
• factors discussed in Item 1A, Risk Factors in CRC's Annual Report on Form 10-K available at www.crc.com.
3

0%
5%
10%
15%
20%
25%
30%
35%
0.0x 1.0x 2.0x 3.0x 4.0x
20
21
FC
F Y
ield
2(%
)
Consensus 2021 Net Debt/EBITDA1,2
CRC : Strong Foundation and Quality Investment Opportunity
▪ Drive operational excellence with lower, resilient cost structure
▪ Follow disciplined, returns-focused capital approach
▪ Responsibly manage core portfolio with dynamic capital allocation
▪ Strong safety and environmental record with commitment to ESG leadership
▪ CDP rating of A-
▪ Actively pursuing decarbonization projects to support energy transition
▪ Lowest carbon intensity of the top 100 producers in the US5
SOUND STRATEGY
COMMITTED TO ESG
STRONG FINANCIAL FOUNDATION
SUSTAINABLE CASH FLOW BUSINESS MODEL
▪ 0.3x leverage ratio1,2 for 2021E among lowest in E&P group
▪ Ended 2Q21 with ample liquidity of $518MM3
▪ $197MM 1H21 Free Cash Flow2
PV-10 of 2020
Proved Reserves
@ $60/bbl4$5.7B
September 2021 4
MULTIPLES COMPARED TO PEERS SHOW STRONG
INVESTMENT OPPORTUNITY
High FCF /
Low Leverage
High FCF /
High Leverage
Low FCF /
Low Leverage
Low FCF /
High Leverage
CRC
0.0x
1.0x
2.0x
3.0x
4.0x
5.0x
6.0x
7.0x
8.0x
1 2 3 4 5 6 7
CR
C
Avg. 8 9
10
11
12
13
14
15C
on
se
nsu
s 2
02
1 E
V /
EB
ITD
A2
,4
▪ Conventional, low to mid-teens decline assets, reinvest <50% of discretionary cash flow
▪ High margins: oil weighted with favorable Brent-based pricing
▪ Stable foundation of 1P reserves even more geared to oil, 86% developed
▪ Integrated midstream and power plant provide reliable power and lower costs
Note: Peer group consists of AR, BRY, COG, CPE, CRK, KOS, MGY, MTDR, MUR, PDCE, RRC, SM, SWN, VET, XEC. Source: FactSet for peers as of September 7, 2021 and internal estimates for CRC. (1) Leverage Ratio using
estimated Net Debt and Adj. EBITDAX as of and for the year ended 12/31/2021. CRC’s Net Debt does not reflect cash used for share repurchases in 2H21. (2) Reflects non-GAAP measures. See the Investor Relations page
at www.crc.com for a reconciliation of historical non-GAAP measures to their closest GAAP equivalent and slides 24 to 25 for a reconciliation of estimated measures for 2021. Free Cash Flow Yield is calculated as 2021E Free
Cash Flow over market capitalization as of September 7, 2021 (CRC assumes 81,879,000 shares outstanding). (3) Liquidity is calculated as $151 million of cash plus $492 million of capacity under CRC's Revolving Credit
Facility less $125 million in outstanding letters of credit (4) CRC’s current Enterprise Value calculated using market capitalization as of September 7, 2021 (assuming 81,879,000 shares outstanding) and $449 million of
Net Debt as of the quarter ended June 30, 2021. (5) Source: Clean Air Task Force and Ceres June 2021 report: Benchmarking Methane and Other GHG Emissions of Oil & Natural Gas Production in the US; EPA; EIA.

STEWARDING OUR RETURNS-FOCUSED BUSINESS MODEL

Strong 1H21 Results Drive Significant Shareholder Returns
6
Return Cash to Shareholders
Robust Business Fundamentals
• Strategic Bolt-Ons
• Asset Acquisitions & Divestitures
• M&A
• $250 MM Share Repurchase Program4
• Special Dividend
• Dividend (Variable / Fixed)
Resource Capture Near Core
• Strong Free Cash Flow Generation
• Lower, resilient cost structure
• Reinvestment opportunities meeting
economic thresholds
CONTINOUSLY EVALUATING BEST METHODS TO INCREASE SHAREHOLDER RETURNS
Note: BTM reflects behind the meter and FTM reflects front of the meter. (1) Average production for the three months ended June 30, 2021. (2) Source: internal estimates. (3) Subject to customary closing conditions,
including satisfaction of land and environmental due diligence and third-party consents. See 2Q21 10Q for additional details. (4) As of June 30, 2021, executed $45 MM.
San Joaquin Basin~74,500 BOE per day
+ Acquired 1,600 BOE per day
(~100% Oil)1
Sacramento Basin~3,300 BOE per day1
Los Angeles Basin~19,200 BOE per day1
SolarEst. Up to 45 MW BTM & 300 to
1,000 MW FTM2
CCSEst. Up to 1B MT Storage Capacity2
Ventura Basin~3,600 BOE per day
PSAs signed – Planned Divestitures
(~65% oil)1,3
60% 13% 27%
Oil NGLs Gas
September 2021

$37.79
$31.66 $30.85
$68.65
$43.53
$53.91
$0
$10
$20
$30
$40
$50
$60
$70
$0
$10
$20
$30
$40
$50
$60
$70
2019
(Predecessor)
2020
Combined
(Non-GAAP)
1H21
Sucessor
Re
alize
d O
il P
rice
w H
ed
ge
($
/b
bl)
Co
sts
($
/b
oe
)
Full OPS Cost G&A Interest Realized
20191
Predecessor
20201
Combined
(Non-GAAP)
1H211
Successor
Energy operating costs2 ($/Boe) $3.71 $3.95 $4.70
Gas processing costs ($/Boe) $0.63 $0.55 $0.60
Non-energy operating costs2 ($/Boe) $14.82 $10.95 $13.10
Operating costs ($/Boe) $19.16 $15.45 $18.40
Energy operating costs, excluding effects of
PSC-type contracts2,3 ($/Boe)$3.65 $3.63 $4.10
Gas processing costs ($/Boe) $0.63 $0.55 $0.60
Non-energy operating costs, excluding effects
of PSC-type contracts2,3 ($/Boe)$13.42 $10.38 $12.04
Operating costs, excluding effects of PSC-type
contracts3 ($/Boe)$17.70 $14.56 $16.74
G&A ($/boe) $6.21 $6.23 $5.31
Taxes other than on income ($/boe) $3.36 $3.56 $4.26
Interest expense, net ($/boe) $8.20 $5.36 $1.44
Transportation costs ($/boe) $0.86 $1.06 $1.44
Cost Control Enabling Margin Expansion
7
(1) Periods subsequent to October 31, 2020 (Successor period) and ending on or prior to October 31, 2020 (Predecessor period) are distinct reporting periods as a result of the adoption of fresh start accounting upon emergence from Chapter 11 bankruptcy and as such, 1H21 is not comparable to prior periods. For further information, consult the 2020 10K, Part II, Item 8 – Financial Statements and Supplementary Data, Note 3 Fresh Start Accounting. (2) Energy operating costs consist of purchases of fuel gas used to generate electricity, purchased electricity and internal costs to produce electricity used in our operations. Non-energy operating costs equal total operating costs less energy operating costs and gas processing costs. Purchases of fuel gas to generate steam which is then used in our steamfloods is included in non-energy operating costs. (3) Represent non-GAAP measures. For all historical non-GAAP financial measures, please see the Investor Relations page at www.crc.com for a reconciliation to the closest GAAP measure and other additional information. (4) Full OPS cost includes operating costs plus transportation costs, plus taxes other than on income.
1
4
11
~20% COST REDUCTION
SINCE 2019
LIMITED CAPITAL SPEND IN
2020
September 2021

Full Year Outlook Remains Strong
8
CURRENT GUIDANCE
FY 2021E1
Total Production (Mboepd)2 97 - 100
Oil Production (Mbopd)2 60 - 62
Operating Costs ($MM)$670 - 695
$18.36 - $19.63 $/boe
Capital Spend ($MM)$170 - $190
$4.66 - $5.37 $/boe
Operating and Capital Needs ($MM) $840 - $885
G&A ($MM) $180 - $190
Adjusted EBITDAX3 ($MM)$725 - $825
$19.86 – $23.30 $/boe
Free Cash Flow3 ($MM) $400 - $500
Free Cash Flow Yield3,4 13% - 16%
0%
5%
10%
15%
20%
$0
$100
$200
$300
$400
$500
$600
$60 Brent $70 Brent $80 Brent
FR
EE
CA
SH
FL
OW
YIE
LD
3,5
(%)
FR
EE
CA
SH
FLO
W3
($M
M)
Free Cash Flow Yield
(1) Current guidance assumes strip pricing as of June 30, 2021. (2) 2021E Production range subject to PSC effects. (3) Represent non-GAAP figures. Adj. EBITDAX and Free Cash Flow are non-GAAP measures. For all historical non-GAAP financial
measures please see the Investor Relations page at www.crc.com for a reconciliation to the closest GAAP measure and other additional information. Reconciliations of 2021E Adj. EBITDAX and Free Cash Flow to their nearest GAAP equivalent can
be found on slides 24 to 25. (4) FCF Yield reflects FY 2021E Free Cash Flow divided by market capitalization as of September 7, 2021, calculated using 81.879 million shares. (5) IRR calculated using actual prices YTD, $70 Brent for the
remainder of 2021, $65 Brent for 2022 onward and $4.00 NYMEX.
3,4
Maintaining Operational Excellence
▪ 3rd drilling rig operating in Long Beach with expected IRRs5 of ~60%
▪ Adding 4th Rig in 4Q21 at BV Shale with expected IRRs5 of ~ 58%
▪ Remaining focused on high margin oil projects
▪ Prioritizing safe and responsible production
September 2021

9
New Chapter : Low Carbon Opportunities

Positioning for the Future
10
Up to 1 BMT of Potential CO2
Permanent Storage Capacity for CRCStrategically Placed Infrastructure Across CA
Opportunity to Participate in Full CCS Value Chain
Carbon TerraVault I: New ~40 MMT of Total
Est. CO2 Permanent Storage Project1
Filed for up to 10 MMT Class VI EPA Well Permit for Storage in A1 & A2
Reservoir | Preparing to File for up to 30 MMT Class VI EPA Well Permit for
Storage in 26R Reservoir | Started 45Q and LCFS3 Certification
300 to 1,000 MW Solar Opportunity
Front-of-the-Meter Solar for Grid Supply
3 Projects Identified | 5,000 Acres Suitable for Utility Scale Development
Interconnection Request Submitted for 3 Sites to CAISO
CARBON OPPORTUNITIES SOLAR OPPORTUNITIES
Source: Internal estimates Note: BMT represents billion metric tons and MMT represents million metric tons. (1) Injects 1 MMT of CO2/yr. storage for 40 years, assumes LCFS eligible
emissions. (2) Represents identified opportunities with SunPower. (3) The “Low Carbon Fuel Standard” LCFS is designed to decrease the carbon intensity of California's transportation fuel pool.
CO2
Up to 45 MW Solar Photovoltaic2
Behind-the-Meter Solar
Potential at Five Fields Located in San Joaquin and LA Basins
Qualifying LCFS Pathway3 | SunPower as a Development Partner
September 2021

~2 – 5 Billion Metric Tons CO21
CRC Has Up to 1 BMT2 of Est. CO2 Storage Capacity
0 1 2 3 4 5 6
Total CA Storage (High Estimate)
Total CA Storage (Low Estimate)
Billion Metric Tons
CRC Potential: A Promising CCS Environment in California
11
CALIFORNIA HAS THE MOST SUPPORTIVE REGULATORY ENVIRONMENT
FOR DECARBONIZATION, INCLUDING FINANCIAL CCS INCENTIVES
Note: BMT represents billion metric tons and MMT represents million metric tons. (1) Source: An Action Plan for Carbon Capture and Storage in California: Opportunities, Challenges, and Solutions, a joint study by Energy Future Initiatives and the Stanford Center for Carbon Storage; Natcarb; CARB – Achieving Carbon Neutrality in California page 80; internal estimates (2) Internal estimates (3) LCFS - The California Air Resources Board –average pricing as of August 15, 2021; 45Q based on 2026 pricing per fas.org; Cap & Trade – Internal estimate, Cap and Trade program currently doesn’t cover CCS and could not materialize.
“California should pursue key enablers for CCUS to contribute towards the state’s 2045 carbon neutrality goal ...
California CCUS projects can have immediate and long lasting environmental, economic, and jobs benefits to nearby communities…”
- “ An Action Plan for Carbon Capture and Storage in California: Opportunities, Challenges and Solutions” : Energy Futures Initiatives, Stanford Precourt Institute for Energy, October 2020
Total Potential
Incentive3
Potential
Cap and Trade
program
California Low Carbon
Fuel Standard (LCFS)
45Q Tax
Credit
~$185/MT ~$50/MT ~$0 - $40/MT ~$235 - $275/MT
TOTAL ESTIMATED CO2 STORAGE CAPACITY IN O&G RESERVOIRS1
September 2021

Geologic Containment
CRC Advantage
Stakeholder Management
and Relationships
Operating Experience
Positioned across Carbon Management Value Chain
CRC Is Well Positioned to Help California Reach a Low Carbon Future
12September 2021
▪ CRC has up to 60%1 of all available O&G storage reservoirs in CA
▪ Identified an est. ~1BMT1 of CO2 storage capacity
▪ Large, deep, well-understood reservoirs with thick caprock
containment
▪ Leadership provides valuable oversight and knowledge through years
of working on CO2 projects
▪ Engineers understand reservoir pressure maintenance in waterfloods
(secondary recovery) and CO2 injection (tertiary)
▪ Team has managed midstream infrastructure assets in core O&G
business (in particular gathering systems at Elk Hills)
▪ One of the largest mineral and surface owners in California with
significant seismic coverage and technical data
▪ Have substantial “right of way” rights due to the integrated nature of
our operated and owned midstream infrastructure
▪ Started process of filing required regulatory and operational permits
▪ Constructive regulatory and community engagement
▪ Strong relationships with large scale emitters in the state
▪ Experience working with Federal and State agencies
(EPA/DOE/CalGem) and raising “green” capital
Development of projects that cover CO2
Capture, Transport & Storage
Note: BMT represents billion metric tons and MMT represents million metric tons. (1) Internal estimates.

A Pipeline of Projects Through Carbon TerraVault
13
ACCOMPLISHED
▪ Filed for up to 10 MMT Class VI EPA well permit for storage
in A1 & A2 reservoir
▪ Filed conditional use permit (CUP) with Kern County covering
both reservoirs
▪ Initiated conversations with emitters in close proximity to the
project
▪ Began engaging with regulatory agencies and other important
stakeholders
IN PROGRESS
▪ Planning to submit up to 30 MMT Class VI EPA well permit for
storage in 26R reservoir by November 1st, 2021
▪ Preparing 45Q and LCFS certification process
▪ Concurrent live discussions with investors and other sources
of capital
Note: BMT represents billion metric tons and MMT represents million metric tons. Source: Internal estimates (1) MMTPA million metric tons per annum.
02
00
40
06
00
80
01
,00
0
MM
T o
f CO
2
Pe
rmittin
g &
Ne
ar-T
erm
Fo
cu
sP
ossib
leP
rob
ab
le
CRC’s Est. CO2 STORAGE CAPACITY
September 2021
FUTURE EXPECTATIONS
▪ Utilizing CTV as a model to grow and develop and permit
subsequent CCS projects
ELK HILLS: VALIDATED GEOLOGICAL PROPERTIES & FULL SURFACE RIGHTS
Est. Targeted Development Schedule:
200 MMT permitted by 2025 and ~ 5 MMTPA1 injection by 2027
“The Elk Hills Field is “one of the premier CO2 sequestration sites in the
U.S.… an optimal site for the safe and secure sequestration of CO2”
- California Energy Commission
20272021 2022 2023 2024 2025 2026
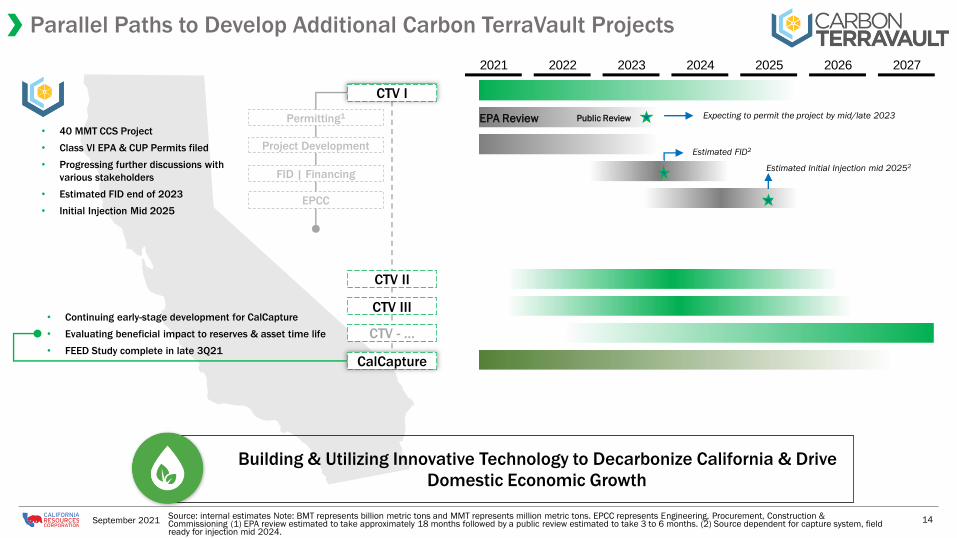
Parallel Paths to Develop Additional Carbon TerraVault Projects
14September 2021
CTV II
CTV III
CTV - …
CalCapture
CTV I
Permitting1
FID | Financing
EPCC
Project Development
EPA Review Public Review Expecting to permit the project by mid/late 2023
Estimated FID2
Estimated Initial Injection mid 20252
• 40 MMT CCS Project
• Class VI EPA & CUP Permits filed
• Progressing further discussions with
various stakeholders
• Estimated FID end of 2023
• Initial Injection Mid 2025
Building & Utilizing Innovative Technology to Decarbonize California & Drive
Domestic Economic Growth
• Continuing early-stage development for CalCapture
• Evaluating beneficial impact to reserves & asset time life
• FEED Study complete in late 3Q21
Source: internal estimates Note: BMT represents billion metric tons and MMT represents million metric tons. EPCC represents Engineering, Procurement, Construction & Commissioning (1) EPA review estimated to take approximately 18 months followed by a public review estimated to take 3 to 6 months. (2) Source dependent for capture system, field ready for injection mid 2024.

Strengthening Solar Capability
15
SELF SUPPLY | BEHIND THE METER:
▪ Advancing an agreement with SunPower for a 12 MW behind-the-meter solar project at Mt. Poso
▪ Est. ~10,470 MT of CO2 annual LCFS credit generation1 and reduction of $1.41/BOE in field OPEX2
▪ Targeting up to 45 MW Solar PV installations in five fields located in San Joaquin and LA Basin
with construction planned in 2022, all online estimated by 1Q-2023
▪ Estimated cash power cost reduction by >35% at the five fields further driving margin
enhancements
GRID SUPPLY | FRONT OF THE METER:
▪ CRC has identified over 5,000 acres suitable for utility scale development presents
future value for CRC and investors
▪ Potential for 300 to 1,000 MW with core 3 projects identified
▪ Potential to further reduce CO2 emissions while adding further commercial opportunity
Carbon
Footprint
Reduction
Robust
PPA, solar
financing
market
Additional Cash Flow
Stream
Lower power costs
Land & Ops
Control
Reliability+ vs grid
Significant Cost
Savings
Source: Internal estimates (1) Estimated 10,470 MT of annual CO2 of LCFS credit generation reflects the average over 20 years. (2) OPEX savings estimated on Mount Poso 2Q21 net production
of approximately 3.5 MBOE per day; assumes $165/MT LCFS credit price; cost savings of $1.41/BOE reflects ~13,255 MT of CO2 of LCFS credit generation for the first year of the project.
Expecting to successfully surpass CRC’s 2030 renewables goal upon BTM project commission
September 2021

New Chapter: Decarbonizing California through Carbon Capture
16
Carbon Storage UpdateOctober 6th, 2021
1 – 2 PM EDT
Committed to ESG Advancement
CRC’s assets are well suited for CCS and uniquely positioned to aid California in its energy transition
CO2
September 2021

Closing Remarks

0x
1x
2x
3x
4x
5x
6x
7x
8x
9x
1 2 3 4 5 6
Avg. 7 8 9
10
11
CR
C
12
13
14
15
EV
/ S
MO
G3
STRONG FCF YIELD
18
CRC’s Low Valuation Provides Equity Upside
0x
1x
2x
3x
4x
5x
6x
7x
8x
1 2 3 4 5 6 7
CR
C
Avg. 8 9
10
11
12
13
14
15
Co
nse
nsu
s 2
02
1 E
V /
EB
ITD
A1
,3
0%
5%
10%
15%
20%
25%
30%
35%
1 2 3 4 5 6
Avg. 7
CR
C 8 9
10
11
12
13
14
15
20
21
Fre
e C
ash
Flo
w Y
ield
1
0x
1x
2x
3x
4x
1 2 3 4 5 6 7 8 9
Avg.
10
11
12
13
14
CR
C
15
Co
nse
nsu
s 2
02
1 N
et
De
bt
/
EB
ITD
A1
,2
TOP QUARTILE LEVERAGE
UNDERVALUED RELATIVE TO PEERS
September 2021
Note: Peer group consists of AR, BRY, COG, CPE, CRK, KOS, MGY, MTDR, MUR, PDCE, RRC, SM, SWN, VET, XEC. Source: FactSet for peers as of September 7, 2021 and internal estimates for CRC. (1) Reflects non-GAAP
measures. See the Investor Relations page at www.crc.com for a reconciliation of historical non-GAAP measures to their closest GAAP equivalent and slides 24 to 25 for a reconciliation of estimated measures for 2021.
Free Cash Flow Yield is calculated as 2021E Free Cash Flow over market capitalization as of September 7, 2021 (CRC assumes 81,879,000 shares outstanding). (2) Leverage Ratio using Net Debt and Adj. EBITDAX as
of and for the year ended 12/31/2021. CRC’s Net Debt does not reflect cash used for share repurchases in 2H21. (3) CRC’s current Enterprise Value calculated using market capitalization as of September 7, 2021
(assuming 81,879,000 shares outstanding) and $449 million of Net Debt as of the quarter ended June 30, 2021. SMOG as of December 31, 2020.

SUPPLEMENTAL MATERIALS

CRC is a Net Water Supplier to California
20September 2021
▪ Create long-term value from produced water
▪ Help farmers and communities solve a key challenge
▪ Minimize CRC’s fresh water use in operations
▪ Reduce operating expenses
Supplied 4.63 billion gallons of reclaimed water to
agriculture in 2020, almost triple our 2013 volume,
preserving farmland operations and jobs
For every gallon of freshwater the company purchased
in 2020, CRC delivered approximatively three gallons
of reclaimed water to agriculture.
Increased recycled or reclaimed produced water volume by almost
Increased reclaimed water delivery to agriculture by
WATER STRATEGY OBJECTIVES
CRC is helping local agriculture businesses during this
challenging draught period in California
15%
174%
CRC CONTINUES TO DELIVER VAST AMOUNTS OF WATER TO AGRICULTURESINCE 20131
0
2,000
4,000
6,000
8,000
10,000
12,000
14,000
16,000
18,000
2013 2014 2015 2016 2017 2018 2019 2020 2021E(a
cre
-fe
et
pe
r yt
ea
r)
Source: Internal data (1) Comparison for produced water is from 2013 to 2020. 2020 data for recycled or reclaimed produced water is currently unavailable and the comparison is from 2013 to 2019.

Mount Poso
Wells Drilled & Completed 22
TMD (ft.) 2,630
Peak IP1(boepd) 90
Estimated IRR2 (%) 146%
▪ 2 rigs running in San Joaquin basin during Q2
▪ Focused on shallow, high margin oil projects in the Mt. Poso, Elk Hills, and Buena Vista fields.
6-Month Program Highlights (avg. per well)
Elk Hills (ESOZ)
Wells Drilled & Completed 1
TMD (ft.) 4,790
Peak IP1 (boepd) 128
Estimated IRR2 (%) 122%
Buena Vista
Wells Drilled & Completed 13
TMD (ft.) 5,895
Peak IP1 (boepd) 47
Estimated IRR2 (%) 97%
▪ CRC has invested in 88 capital workovers across multiple fields at an average cost of
~$180k per job, resulting in an average rate of ~20 boepd per workover and
estimated returns >200%
Note: TMD represents total measured depth (1): Peak IP rate defined as highest production achieved during first 90 days of production. (2): IRR calculated using actual prices YTD, $70 Brent for the
remainder of 2021, $65 Brent for 2022 onward and $3.00 NYMEX. (3): Drilling rig expected to start sometime in the fall of 2021.
2021 YTD DEVELOPMENT PERFORMANCE:
21
Long Beach
Wells to be Drilled 9
TMD (ft.) 5,000
Peak IP1 (boepd) 72
Estimated IRR2 (%) 60%
Third Rig Program Forecast (avg. per well)3
Emphasizing CRC’s Asset Quality

Hedging Program Protects Cash Flow
(1) Hedges are based on weighted-average Brent prices per barrel. (2) Represents estimated net cash settlement payments for derivative contracts as of 6/30/2021, except 1Q21 & 2Q21 which are actuals for the three months ended
March 31, 2021 and June 30, 2021, respectively.
3Q21 4Q21 1Q22 2Q22 2H22 FY23
SOLD CALLS
Barrels per
Day36,688 37,037 35,347 35,343 28,773 14,790
Weighted-
Average Price
per Barrel
$50.47 $60.75 $60.37 $60.63 $59.07 $58.01
PURCHASED
PUTS
Barrels per
Day36,943 35,820 35,347 35,343 28,773 14,790
Weighted-
Average Price
per Barrel
$40.18 $40.19 $40.57 $41.13 $40.70 $40.00
SOLD PUTS
Barrels per
Day14,647 14,193 6,869 - 2,674 -
Weighted-
Average Price
per Barrel
$30.00 $32.00 $32.00 - $32.00 -
SWAPS
Barrels per
Day11,063 11,922 10,869 8,669 8,386 6,930
Weighted-
Average Price
per Barrel
$51.02 $52.61 $52.62 $51.31 $51.22 $52.15
STRATEGY
▪ CRC hedging strategy typically utilizes a mixture of Puts, Collars and
Swaps to protect cash flow and to ensure CRC’s ability to live within
cash flow, and is also aligned with CRC’s RBL requirements
22
1Q21 2Q21 3Q21E 4Q21E 2021E 1H22E 2H22E 2022E 2023E
Hedge
Contract
Settlements2
($MM)
($39) ($82) ($105) ($64) ($290) ($96) ($75) ($171) ($72)
HEDGE CONTRACT SETTLEMENTS EXPECTED TO SIGNIFICANTLY
DECREASE IN 2022 & 2023
OIL HEDGE PROTECTION1 as of June 30, 2021
September 2021

Maintaining Balance Sheet Strength, Liquidity, and Financial Flexibility
(1) Prior to share repurchases. Liquidity at 6/30/21 calculated as cash of $151 million and $492 million capacity on CRC’s Revolving Credit Facility less $125 million in outstanding letters of credit. Estimated YE 2021 liquidity is calculated using cash as of 6/30/21 plus the midpoint of Free Cash Flow guidance less 1H21 free cash flow of ~$200 million and $492 million capacity on CRC’s Revolving Credit Facility less $125 million in outstanding letters of credit. 3Q21 to 4Q21 estimated increase in available cash reflects revised Free Cash Flow guidance less 1H21 free cash flow of ~$200 million. (2) Adj. EBITDAX, Net Debt and Free Cash Flow are non-GAAP measures. For all historical non-GAAP financial measures please see the Investor Relations page at www.crc.com for a reconciliation to the closest GAAP measure and other additional information. Reconciliations of 2021E Adj. EBITDAX, Net Debt and Free Cash Flow to their nearest GAAP equivalent can be found on slides 24 to 25. (3) Undrawn revolver as of June 30, 2021.
$518 MM
$0
$200
$400
$600
$800
$1,000
6/30/21 Liquidity 3Q21-4Q21E Increase in Available Cash
12/31/2021 Estimated YE Liquidity
$ M
illio
ns
~$770 MM($ in millions)
Revolving Credit Facility (RCF) $ 0
7.125% Senior Notes 600
Face Value of Debt $ 600
Less Available Cash (151)
Net Debt $ 449
($ in millions)
RCF Borrowing Base $ 1,200
2021E Free Cash Flow2 $400 – $500
YE 2021E Net Debt1,2 / 2021E Adjusted EBITDAX2 0.2x – 0.3x
2021E Adjusted EBITDAX2 / 2021E Interest Expense 13.2x – 16.5x$0
$200
$400
$600
$800
6/30/21 Liquidity
2022 2023 2024 2025 2026
$ M
illio
ns
6/30/2021 Revolver Availability Cash Revolver Availability at Maturity Senior Notes
ESTIMATED LIQUIDITY ROLL FORWARD1
NO SIGNIFICANT MATURITIES UNTIL 2026
Undrawn3
6/30/21 DEBT SNAPSHOT
MULTIPLES DEMONSTRATE FLEXIBILITY
23
~$250 MM
September 2021

Adjusted EBITDAX Reconciliation
We define adjusted EBITDAX as earnings before interest expense; income taxes; depreciation, depletion and amortization; exploration expense; other unusual,
infrequent and out-of-period items; and other non-cash items. We believe this measure provides useful information in assessing our financial condition, results
of operations and cash flows and is widely used by the industry, the investment community and our lenders. Although this is a non-GAAP measure, the
amounts included in the calculation were computed in accordance with GAAP. Certain items excluded from this non-GAAP measure are significant components
in understanding and assessing our financial performance, such as our cost of capital and tax structure, as well as depreciation, depletion and amortization of
our assets. This measure should be read in conjunction with the information contained in our financial statements prepared in accordance with GAAP. A
version of Adjusted EBITDAX is a material component of certain of our financial covenants under our Revolving Credit Facility and is provided in addition to, and
not as an alternative for, income and liquidity measures calculated in accordance with GAAP. The following table represents a reconciliation of the GAAP
financial measures of net income and net cash provided by operating activities to the non-GAAP financial measure of adjusted EBITDAX.
Note: Management is not providing guidance on income taxes, acquisitions or divestitures or any other unusual or infrequent events at this time.
FY 2021
Estimated
($ millions) Low High
Net income $195 $240
Interest and debt expense, net 50 55
Depreciation, depletion and amortization 190 225
Exploration expense 5 10
Other non-cash items 285 295
Estimated Adjusted EBITDAX $725 $825
24
FY 2021
Estimated
($ millions) Low High
Net cash provided by operating activities $590 $670
Cash Interest 30 35
Exploration expenditures 5 10
Working capital changes 100 110
Estimated Adjusted EBITDAX $725 $825
September 2021

We calculate the leverage ratio by dividing net debt by adjusted EBITDAX forthe applicable period. We define net debt as the face value of our debt lessavailable cash. We believe the leverage ratio is an important metric of theoperational and financial health of our Company and is useful to investorsas an indicator of our ability to incur additional debt and to service ourexisting debt. The following table presents a reconciliation of our leverageratio. The leverage ratio is a supplemental measure of our performancethat is not required by or presented in accordance with U.S. generallyaccepted accounting principles (“GAAP”).
Leverage & Free Cash Flow Reconciliation
Leverage and Net Debt
25
2Q 2021E
($ in millions) Low High
Face value of debt $600 $600
Available cash (151) (151)
Net Debt as of June 30, 2021 $449 $449
2021E Adjusted EBITDAX $825 $725
2Q21E Leverage Ratio 0.5x 0.6x
Note: Adj. EBITDAX and Net Debt are non-GAAP measures. For all historical non-GAAP financial measures please see the Investor Relations page at www.crc.com for a reconciliation to the closest GAAP measure and other additional information. (1) Prior to share repurchases in 2H 2021. Calculated as cash as of 6/30/21 plus revised Free Cash Flow guidance of $400 to $500 million less 1H21 Free Cash Flow of ~$200 million.
Management uses free cash flow, which is defined by us as net cashprovided by operating activities after our internal capital investment, asa measure of liquidity. The table at right presents a reconciliation of netcash provided by operating activities to free cash flow.
FY 2021E
($ in millions) Low High
Net cash provided by operating activities $590 $670
Capital Investment (190) (170)
Estimated Free Cash Flow $400 $500
Free Cash Flow
FY 2021E
($ in millions) Low High
Face value of debt $600 $600
Estimated available cash1 (450) (350)
Estimated Net Debt as of December 31, 2021 $150 $250
2021E Adjusted EBITDAX $825 $725
2021E Leverage Ratio 0.2x 0.3x
September 2021

Joanna Park (Investor Relations)
818-661-3731
Richard Venn (Media)
818-661-6014