crashworthiness evaluation offset barrier crash test
TRANSCRIPT
Crashworthiness Evaluation Offset Barrier Crash Test Protocol (Version X)
April 2004
2004 Insurance Institute for Highway Safety Offset Barrier Crash Test Protocol (Version X) 1005 N. Glebe Road, Arlington, VA 22201. All rights reserved. April 2004 ó 1
Insurance Institute for Highway Safety Offset Barrier Crash Test Protocol (Version X)
Document Revision History
Version X of the Insurance Institute for Highway Safety Offset Barrier Crash Test Protocol differs from Version IX in that the driver dummy seat positioning follows the Guidelines for Using the UMTRI ATD Positioning Procedure for ATD and Seat Positioning (Version IV) instead of placing the driver seat in the midtrack full-down position.
Version IX differs from Version VIII in two ways:
Underbody photography, underbody deformation measurements, and rotating the test vehicle onto its passenger side to check for postcrash fuel spillage and to photograph the overhead view are all eliminated; and
Prior to the offset barrier crash test, test vehicles are subject to a frontal impact at 5 mi/h (8 km/h) into either a flat barrier or an angle barrier (formerly angle barrier only).
Version VIII, in turn, is a minor revision of Version VII. Version VIII includes:
A procedure for adjusting the test weight of the vehicle to fall within specific limits relative to its measured curb weight;
An explanation of the conditions under which passenger doors are locked or unlocked prior to the test;
A description of the backup impact speed measurement device;
A procedure for measuring intrusion when the steering column completely separates from the instrument panel during a crash, or when the lower instrument panel or brake pedal loosens or breaks away;
Mathematical adjustments of the upper and lower tibia A-P moments to account for the bent shape of the Hybrid III dummyís lower legs;
The addition of Nij as a calculated neck injury measure;
Specifying the digital filter used in foot acceleration measurements; and
The addition of sternum deflection rate as a calculated injury measure and specifying the filter used in this calculation.
Version VII, in turn, differs from Version VI to include a specific definition of the footrest intrusion measurement point and to provide specific procedures for positioning the driverís left foot on the footrest. Version VII also specifies adjustable driver pedal positions and changes the position of the driverís right side armrest from the stowed position to the down position.
Version VI differs from the earlier versions (IV and V) in three ways. The description of intrusion measurements provides methods for establishing the reference coordinate systems for intrusion
2004 Insurance Institute for Highway Safety Offset Barrier Crash Test Protocol (Version X) 1005 N. Glebe Road, Arlington, VA 22201. All rights reserved. April 2004 ó 2
measurements in cars, passenger vans, and utility vehicles (previously version IV) as well as for pickup trucks and vehicles with removable or convertible roofs (previously version V). Also, the calculation by which intrusion measurements are adjusted to reflect movement of the steering wheel, instrument panel, and toepan relative to the driver has been added. Finally, the sign convention and digital filtering for electronically recorded measurements has been changed to comply with the Society of Automotive Engineers (SAE) recommendations for impact testing.
Test Conditions
Impact Speed and Overlap
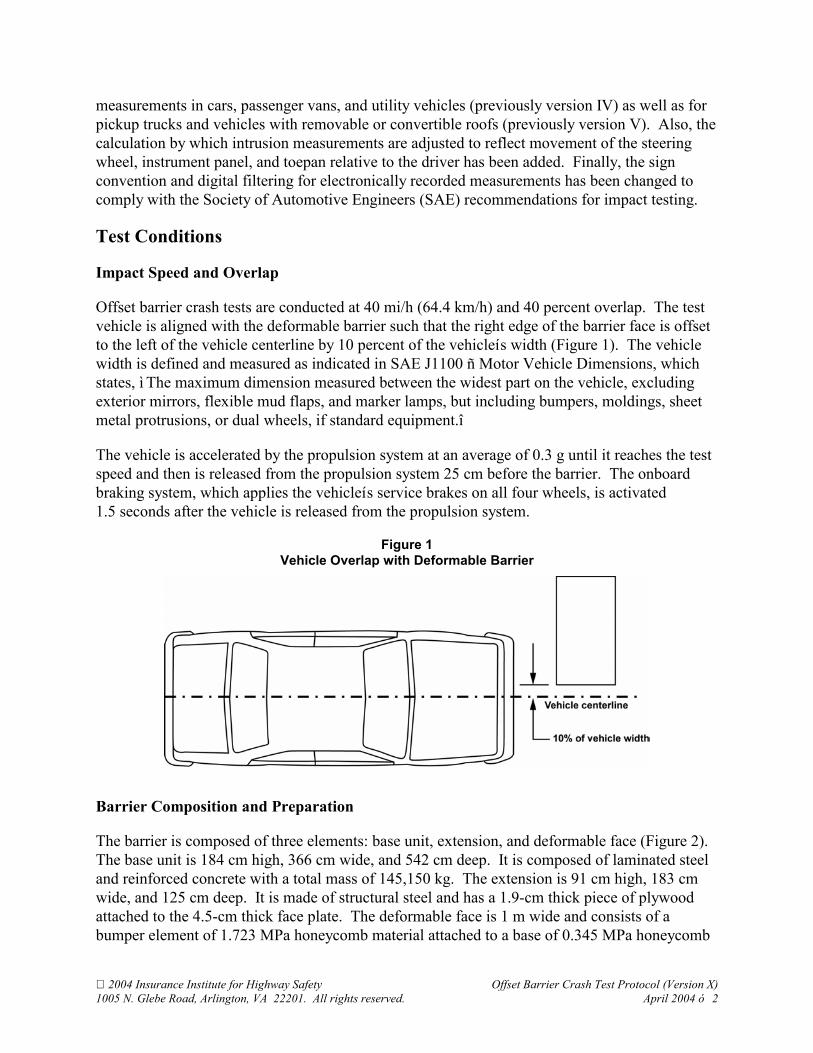
Offset barrier crash tests are conducted at 40 mi/h (64.4 km/h) and 40 percent overlap. The test vehicle is aligned with the deformable barrier such that the right edge of the barrier face is offset to the left of the vehicle centerline by 10 percent of the vehicleís width (Figure 1). The vehicle width is defined and measured as indicated in SAE J1100 ñ Motor Vehicle Dimensions, which states, ì The maximum dimension measured between the widest part on the vehicle, excluding exterior mirrors, flexible mud flaps, and marker lamps, but including bumpers, moldings, sheet metal protrusions, or dual wheels, if standard equipment.î
The vehicle is accelerated by the propulsion system at an average of 0.3 g until it reaches the test speed and then is released from the propulsion system 25 cm before the barrier. The onboard braking system, which applies the vehicleís service brakes on all four wheels, is activated 1.5 seconds after the vehicle is released from the propulsion system.
Figure 1 Vehicle Overlap with Deformable Barrier
Barrier Composition and Preparation
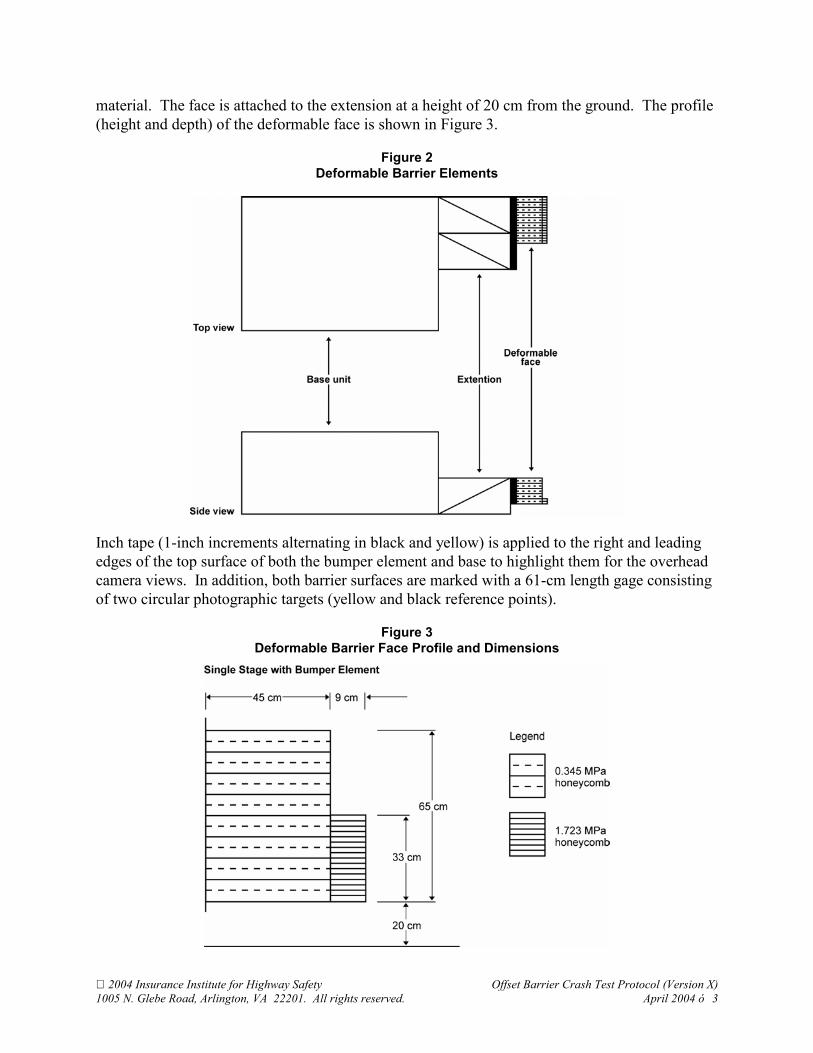
The barrier is composed of three elements: base unit, extension, and deformable face (Figure 2). The base unit is 184 cm high, 366 cm wide, and 542 cm deep. It is composed of laminated steel and reinforced concrete with a total mass of 145,150 kg. The extension is 91 cm high, 183 cm wide, and 125 cm deep. It is made of structural steel and has a 1.9-cm thick piece of plywood attached to the 4.5-cm thick face plate. The deformable face is 1 m wide and consists of a bumper element of 1.723 MPa honeycomb material attached to a base of 0.345 MPa honeycomb
2004 Insurance Institute for Highway Safety Offset Barrier Crash Test Protocol (Version X) 1005 N. Glebe Road, Arlington, VA 22201. All rights reserved. April 2004 ó 3
material. The face is attached to the extension at a height of 20 cm from the ground. The profile (height and depth) of the deformable face is shown in Figure 3.
Figure 2 Deformable Barrier Elements
Inch tape (1-inch increments alternating in black and yellow) is applied to the right and leading edges of the top surface of both the bumper element and base to highlight them for the overhead camera views. In addition, both barrier surfaces are marked with a 61-cm length gage consisting of two circular photographic targets (yellow and black reference points).
Figure 3 Deformable Barrier Face Profile and Dimensions
2004 Insurance Institute for Highway Safety Offset Barrier Crash Test Protocol (Version X) 1005 N. Glebe Road, Arlington, VA 22201. All rights reserved. April 2004 ó 4
Test Vehicle Preparation
Each vehicle is inspected upon arrival at the research center. Vehicles are checked for evidence of prior collision damage or repair. Each vehicle is further examined to verify that it is in satisfactory operating condition and to note defects such as missing parts, maladjustment, or fluid leaks. If directly relevant to testing, such deficiencies are corrected or a replacement vehicle is procured.
Many of the vehicles evaluated in the offset test have been used in the Instituteís Low-Speed Crash Test Program. Such vehicles have been subjected to either a front impact at 5 mi/h (8 km/h) into a full-width flat barrier or an impact on the front corner of the passenger side at 5 mi/h (8 km/h) into a 30-degree angle barrier. The vehicles also have been subjected to a rear impact at the same speed into a full-width flat barrier (see the Instituteís Low-Speed Crash Test Protocol). All structural damage on the front of the vehicle is repaired before the 64 km/h offset test. Cosmetic damage is repaired at the Instituteís discretion. Parts are replaced or repaired as appropriate based on the judgment of two professional insurance appraisers.
All engine and transmission fluids are drained from the vehicle prior to the test. The gasoline is removed from the fuel tank and fuel lines and replaced with Stoddard solvent to 90-95 percent of useable capacity within 48 hours of the test. The engine is started for short period to ensure the Stoddard solvent has filled the fuel lines. The electrolyte is drained from the battery. The air conditioning systemís refrigerant is recovered by a means that complies with applicable environmental regulations.
The front of the vehicle is attached to the propulsion system via chains attached to steel hooks, which are welded to the left and right sides of the front suspension. The rear of the vehicle is attached to the propulsion system with a nylon strap and ratchet strap assembly. The vehicle is detached from the propulsion system 25 cm prior to impact with the barrier. The front and rear attachment hardware weighs 11 kg.
An aluminum instrumentation rack, which supports the test equipment, is installed in the cargo area of the vehicle with four bolts through the floor of the cargo area. The carpeting in this area is removed to allow access to the floor. If necessary, the spare tire and accessory jack may be removed to permit installation of the instrumentation rack. The following test equipment is installed on the instrumentation rack located in the cargo area:
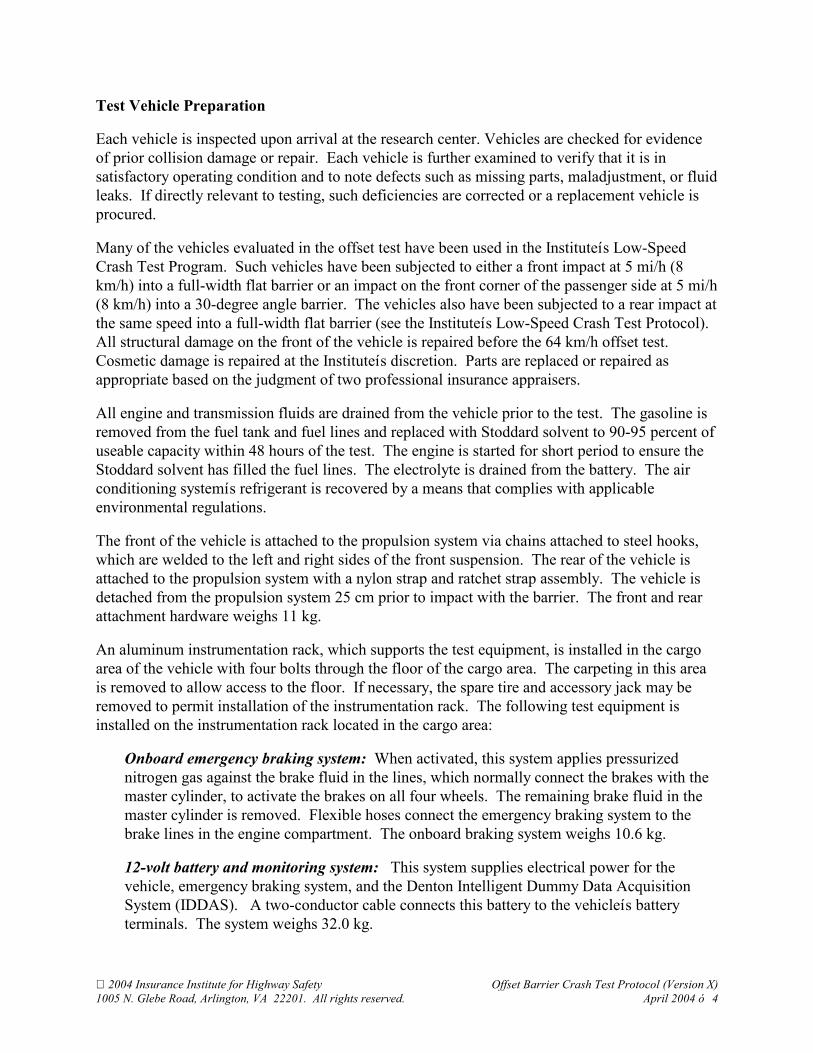
Onboard emergency braking system: When activated, this system applies pressurized nitrogen gas against the brake fluid in the lines, which normally connect the brakes with the master cylinder, to activate the brakes on all four wheels. The remaining brake fluid in the master cylinder is removed. Flexible hoses connect the emergency braking system to the brake lines in the engine compartment. The onboard braking system weighs 10.6 kg.
12-volt battery and monitoring system: This system supplies electrical power for the vehicle, emergency braking system, and the Denton Intelligent Dummy Data Acquisition System (IDDAS). A two-conductor cable connects this battery to the vehicleís battery terminals. The system weighs 32.0 kg.
2004 Insurance Institute for Highway Safety Offset Barrier Crash Test Protocol (Version X) 1005 N. Glebe Road, Arlington, VA 22201. All rights reserved. April 2004 ó 5
The test weight of the vehicle is 100ñ140 kg greater than the measured curb weight (weight of the vehicle as delivered from the dealer with full fluid levels) of the vehicle. If the vehicle test weight needs to be increased to fall within the range, steel plates are added to the instrumentation rack. If the vehicle test weight needs to be decreased, non-essential, non-structural items are removed from the rear of the vehicle.
A steel plate is welded to the floor of the rear seating area along the centerline of the vehicle for mounting accelerometers. The carpeting in this area is removed to allow access to the floor. If floormats are standard or offered as an option through the manufacturer or dealership, a floormat is installed only in the driver footwell.
The antilock braking system (if equipped) and daytime running lights (if equipped) are disabled by means of removing fuses or relays to these devices to reduce the electrical power required for the test.
A plastic block containing an array of high-intensity light-emitting diodes (LED) is attached to the hood of the vehicle with sheet metal screws. The LEDs are illuminated when the vehicle first contacts the barrier.
A pressure-sensitive tape switch is applied to the vehicle such that it makes first contact with the barrier during the crash. Pressure applied to this tape completes an electrical circuit that signals the start of the crash (time-zero) for the data acquisition system and illuminates the LEDs mounted on the hood.
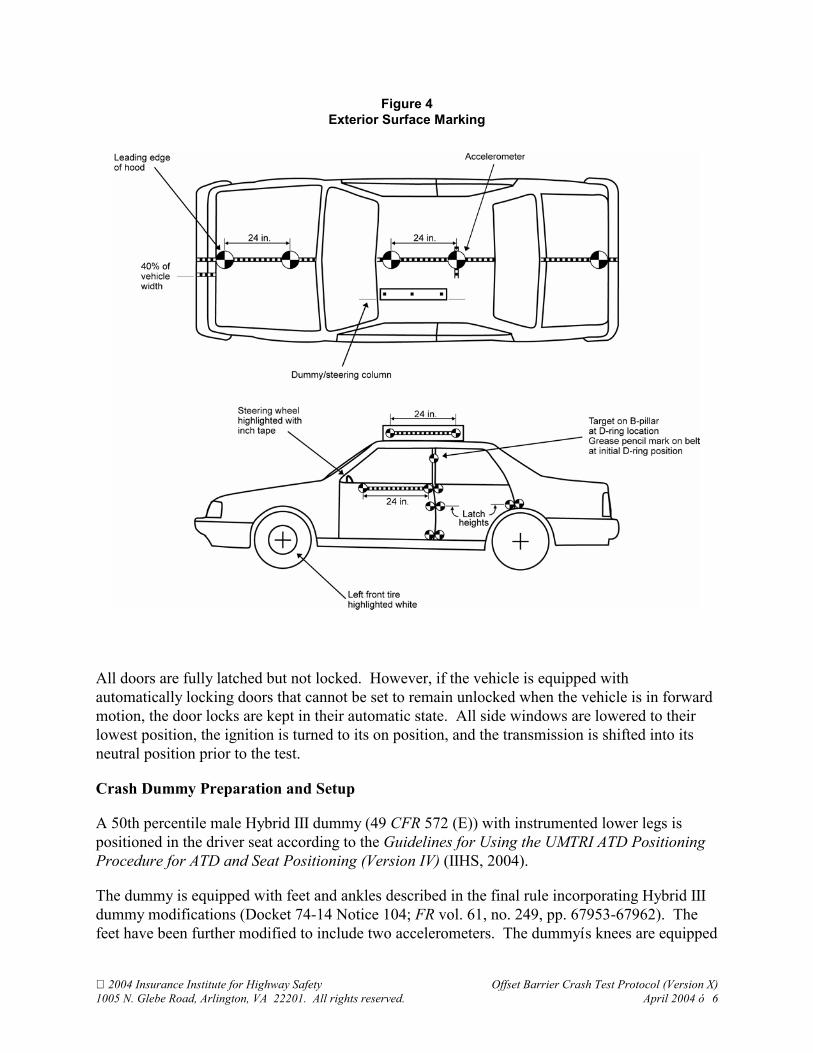
The exterior surfaces of the vehicle are trimmed with inch tape and photographic targets to facilitate analysis of the high-speed crash films (Figure 4). The scheme consists of four 61-cm length gages in four separate reference planes: the surface of the roof, the surface of the hood, the surface of the driver door, and a vertical plane passing through the centerline of the driver seat. The location of the vehicle accelerometers and the location of the vehicleís precrash center of gravity are marked with photographic targets applied to the appropriate top surfaces of the vehicle. An additional target also is placed at the rear of the vehicle on the centerline. The locations of driver door latch, left rear door latch, and driver shoulder belt upper anchorage D-ring are marked on the side surfaces with photographic targets. The steering wheel is highlighted with inch tape, and the left front tire is highlighted with white shoe polish.
The driverís head restraint (if adjustable) is adjusted upward until the top of the head restraint is level with the top of the dummyís head. If the head restraint lacks sufficient height adjustment to reach to the top of the dummyís head, the test is conducted with the head restraint set at its highest setting. The head restraint height adjustment locking mechanism (if equipped) is examined to ensure the mechanism has engaged. All manually adjustable head restraint tilting mechanisms are adjusted to their full-rearward position during the test.
The driver seat manually adjustable inboard armrest (if equipped) is adjusted to its lowered position. For vehicles equipped with multiple locking armrest positions, the position that results in the top surface of the armrest being closest to parallel with ground is chosen.
2004 Insurance Institute for Highway Safety Offset Barrier Crash Test Protocol (Version X) 1005 N. Glebe Road, Arlington, VA 22201. All rights reserved. April 2004 ó 6
Figure 4 Exterior Surface Marking
All doors are fully latched but not locked. However, if the vehicle is equipped with automatically locking doors that cannot be set to remain unlocked when the vehicle is in forward motion, the door locks are kept in their automatic state. All side windows are lowered to their lowest position, the ignition is turned to its on position, and the transmission is shifted into its neutral position prior to the test.
Crash Dummy Preparation and Setup
A 50th percentile male Hybrid III dummy (49 CFR 572 (E)) with instrumented lower legs is positioned in the driver seat according to the Guidelines for Using the UMTRI ATD Positioning Procedure for ATD and Seat Positioning (Version IV) (IIHS, 2004).
The dummy is equipped with feet and ankles described in the final rule incorporating Hybrid III dummy modifications (Docket 74-14 Notice 104; FR vol. 61, no. 249, pp. 67953-67962). The feet have been further modified to include two accelerometers. The dummyís knees are equipped
2004 Insurance Institute for Highway Safety Offset Barrier Crash Test Protocol (Version X) 1005 N. Glebe Road, Arlington, VA 22201. All rights reserved. April 2004 ó 7
with ball-bearing sliders, and the neck is fitted with a neck shield. In addition, the dummyís thoracic spine has been modified to accommodate an onboard data acquisition system (IDDAS). The mass and moments of inertia of the modified thoracic spine are similar to those of the standard dummy.
The dummies used in these tests are calibrated according to 49 CFR 572 (E) after being subjected to no more than five crash tests. Additionally, individual parts are recalibrated if levels recorded during a test exceed the higher of published injury reference values or the values achieved in dummy certification tests, or if postcrash inspection reveals damage. All visible damage is repaired before the dummy is used again.
The dummy and vehicle are kept in a temperature controlled area at the beginning of the runway where the temperature is maintained at 20.6ñ22.2 degrees Celsius and the relative humidity at 10ñ70 percent for at least 16 hours prior to the test. The driver seat belt is fastened around the dummy. For vehicles with continuous-loop lap/shoulder seat belts, the slack from the lap portion of the driver seat belt is removed and the webbing is pulled fully out of the retractor and allowed to retract under tension a total of four times. The lap belt slack is then removed again with a small pulling force. For vehicles with separate lap and shoulder seat belt retractors, the webbing from each is pulled fully out of the retractor and allowed to retract under tension a total of four times. The dummyís head, knees, and shins are colored with grease paint to facilitate postcrash identification of impacts with the vehicle interior. Photographic targets are placed on both sides of the head to mark the location of its center of gravity.
Photography
Still Photography
The precrash and postcrash conditions of each test vehicle are photographed. Two precrash views and two postcrash views show the side and left front quarter of the test vehicle.
Additional photographs document the precrash position of the driver dummy, including close-up views of the dummyís legs.
Three standard views of the vehicle in its postcrash position in front of the barrier are recorded. Additional photographs document the postcrash position of the driver dummy.
High-Speed Motion Picture Photography
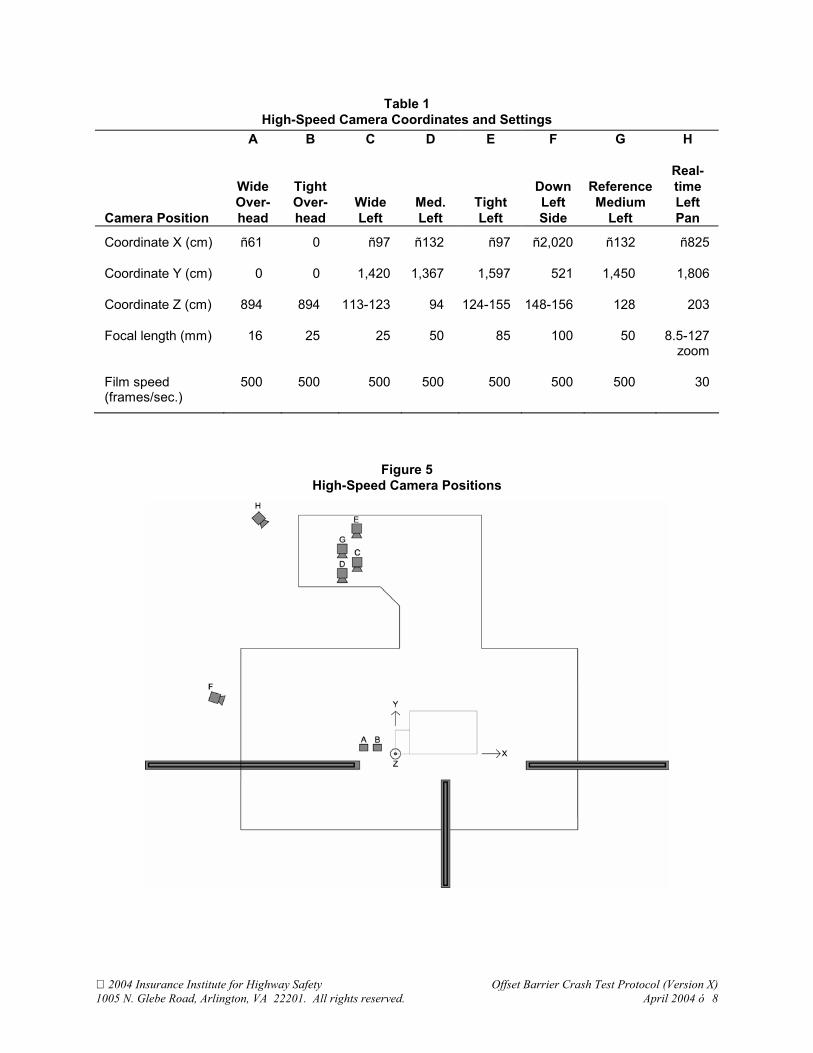
Motion picture photography is made of the test with seven 16 mm film cameras and one video camera. The lens focal length and frame rate of each camera are described in Table 1. Frame rates for the 16 mm cameras are accurate to ±1 percent of the set frame rate. The positions of all cameras are shown in Figure 5.
2004 Insurance Institute for Highway Safety Offset Barrier Crash Test Protocol (Version X) 1005 N. Glebe Road, Arlington, VA 22201. All rights reserved. April 2004 ó 8
Table 1 High-Speed Camera Coordinates and Settings
Camera Position
A
Wide Over- head
B
Tight Over- head
C
Wide Left
D
Med. Left
E
Tight Left
F
Down Left Side
G
Reference Medium Left
H
Real- time Left Pan
Coordinate X (cm) ñ61 0 ñ97 ñ132 ñ97 ñ2,020 ñ132 ñ825
Coordinate Y (cm) 0 0 1,420 1,367 1,597 521 1,450 1,806
Coordinate Z (cm) 894 894 113-123 94 124-155 148-156 128 203
Focal length (mm) 16 25 25 50 85 100 50 8.5-127zoom
Film speed (frames/sec.)
500 500 500 500 500 500 500 30
Figure 5 High-Speed Camera Positions
2004 Insurance Institute for Highway Safety Offset Barrier Crash Test Protocol (Version X) 1005 N. Glebe Road, Arlington, VA 22201. All rights reserved. April 2004 ó 9
Measurements/Observations
Test Weight
The test weight of the vehicle is measured at each of the four wheels. The vehicle is weighed with all test equipment installed including the driver dummy. The front and rear axle weights are used to determine the longitudinal position of the center of gravity for the test vehicle.
Impact Speed
The impact speed is determined by averaging two speed trap measurements. Both speed traps measure the average velocity of the vehicle at 1ñ1.5 m before impact with the barrier. The propulsion system also has an optical speed measuring device that serves as a backup to the two speed traps. This device measures the speed of the hardware attaching the vehicle to the propulsion system immediately prior to vehicleís release from the propulsion system before impact. The speed is clocked over a 1 m length of vehicle travel ending 0.5 m before the vehicleís release from the propulsion system.
Overlap
The actual overlap is determined from the film taken by the high-speed camera tight overhead view (position B in Figure 5). The lateral distance between the centerline of the vehicle and the right edge of the deformable barrier is measured using a film analyzer and software package. This measurement is subtracted from half the vehicleís overall width, and the result is divided by the vehicleís overall width to determine the actual overlap percentage. The photographic targets applied to the top surfaces of the deformable barrier are used for the image scaling.
Vehicle Accelerations
The linear accelerations in three orthogonal directions (longitudinal, lateral, and vertical) of the vehicleís occupant compartment are measured by accelerometer arrays (three Endevco 7264A-2000 accelerometers) and recorded by IDDAS. Positive vehicle accelerations are forward along the longitudinal axis, to the right along the lateral axis, and downward along the vertical axis. The data are presented filtered according to the channel frequency class (CFC) 60 as defined in SAE J211 ñ Instrumentation for Impact Tests (SAE, 1998).
Fuel System Integrity
Observations about fuel system integrity are recorded for each test. Any Stoddard fluid leaked from the fuel system within 1 minute after the impact is collected as the first sample. This typically is done by soaking up the fluid with an absorbent pad of known mass. The second sample of leaked Stoddard fluid is collected during the 5 minutes immediately following the collection of the first sample. This sample typically is collected in pans placed under the sources of identified leaks. The third sample is collected during the 25 minutes immediately following the collection of the second. The pans used to collect the second sample are replaced with clean empty pans. The volume of each sample is determined by dividing the weight of the sample by the density of Stoddard fluid (790 g/l). The elapsed time is determined using a stopwatch. The entire process is recorded with a video camera equipped with an internal timer, which displays the time in each frame.
2004 Insurance Institute for Highway Safety Offset Barrier Crash Test Protocol (Version X) 1005 N. Glebe Road, Arlington, VA 22201. All rights reserved. April 2004 ó 10
Crush Profile
The profile of the vehicleís front bumper is measured both before and after the crash. Eleven measurements equally spaced along the precrash lateral reference axis are marked and then recorded using a coordinate measuring machine (CMM ó as of fall 1999, a FARO Technologies Inc. Bronze Series FARO ARM). These same marks are measured after the crash using the same reference coordinate system. All measurements are made to the nearest 0.5 cm.
Intrusion Measurements
A total of 18 locations are marked on the driver side interior and exterior of the vehicle, and their longitudinal, lateral, and vertical coordinates are recorded using a CMM. These same marks are measured after the crash using the same reference coordinate system. Intrusion of the steering wheel, instrument panel, and footwell relative to the driver is calculated by subtracting the average component displacements (difference between precrash and postcrash coordinates) of the four seat-attachment bolts, which also were measured relative to the primary coordinate system, from the respective components of displacement for each of the target locations.
Coordinate system definition: A right-handed, three-axis orthogonal coordinate system is used for these measures: longitudinal (rear to front is positive), lateral (right to left is positive), and vertical (bottom to top is positive). The lateral and vertical axes and the origin are defined and marked on the vehicle prior to the crash and also necessarily define the longitudinal axis. The axis marks are used after the crash to reestablish the coordinate system.
The precrash coordinate system is defined with the vehicle unloaded (no occupants) on a level floor. The lateral axis is defined by placing a level rod against the right and left B-pillars inside the front window frames (with the front doors open) as close to the intersection of the B-pillars and roof rails as possible. Alternatively for four-door vehicles, the lateral axis may be defined by placing a level rod against the right and left B-pillars inside the rear window frames (with the rear doors open), as close to the intersection of the B-pillars and roof rails as possible. For pickup trucks and vehicles with removable or convertible roofs, the vertical position of the lateral axis is at the base of the front side windows. The origin is then defined as the intersection of this level rod (lateral axis) and the most inboard trim piece on the right B-pillar and marked. A plumb line suspended from this point to the right rear floor defines the vertical axis. The lateral axis is marked on both B-pillars and the origin point is marked on the right B-pillar. A mark is made on the right rear floor that corresponds to the plumb line location.
The postcrash coordinate system is re-established by first defining the plane created by the previously created marks on the B-pillars and right rear floor. The vertical axis is then explicitly defined as the line between the right B-pillar mark and the plumb mark on the right rear floor. Note that defining the vertical axis on the lateral-vertical plane necessarily defines the lateral axis. The precrash origin mark is used again to define the origin, which along with the vertical axis, necessarily defines the longitudinal axis.
2004 Insurance Institute for Highway Safety Offset Barrier Crash Test Protocol (Version X) 1005 N. Glebe Road, Arlington, VA 22201. All rights reserved. April 2004 ó 11
Measurement Point Locations
The following are the locations for measuring vehicle intrusion:
Steering column (one point): The marked reference is the geometric center of the steering wheel, typically on the airbag door. After the crash, this point is measured by folding the airbag doors back into their undeployed position. In most cases, this measurement is probably less than the maximum intrusion into the compartment. However, if the steering column completely separates from the instrument panel (due to shear module separation, for example) during the crash, the steering column postcrash measurement is taken by placing and holding the wheel and column in its approximate maximum dynamic position as recorded on the high-speed film. The film may not always show clearly where the column was during the crash, and in such cases other clues would be needed to reposition the column for measurement. In rare instances, it may not be possible to obtain any meaningful postcrash measurement.
Lower instrument panel (two points): The left and right lower instrument panel (knee bolster) lateral coordinates are defined by adding 15 cm to and subtracting 15 cm from the steering column reference lateral coordinate, respectively. The vertical coordinate is the same for both left and right references and is defined as 45 cm above the height of the floor (without floormats). If the panel or knee bolster loosens or breaks away in the crash, the postcrash measurements are taken by pressing and holding the panel against the underlying structure.
Brake pedal (one point): The geometric center of the brake pedal pad (top surface). If the brake pedal is constructed so that it dangles loosely after the crash, the brake pedal is pushed straight forward against the toepan/floorpan and held there to take the postcrash measurement. If the pedal drops away entirely, no postcrash measurement is taken.
Toepan (three points): The vertical coordinate for all toepan measurement locations is the vertical coordinate of the brake pedal reference. The lateral coordinates of the left, center, and right toepan locations are obtained by adding 15 cm to, adding 0 cm to, and subtracting 15 cm from the brake pedal reference lateral coordinate, respectively. The longitudinal coordinate is measured and a mark is temporarily placed at the locations on the toepan. A utility knife is used to cut a small ì vî in the carpet and underlying padding at each point on the toepan. The point of the ì vî is peeled back, and the exposed floor is marked and measured. The carpet and padding are then refitted prior to the crash.
Left footrest (one point): The vertical coordinate for the footrest measurement location is the vertical coordinate of the brake pedal reference. The lateral coordinate of the footrest is obtained by adding 25 cm to the brake pedal reference lateral coordinate. The same procedure described above for cutting the carpet is used to mark and measure the underlying structure. In cases where there is a specific footrest construct at the footrest measurement location, the construct is removed and the underlying structure is marked and measured. The construct is reinstalled prior to the crash.
2004 Insurance Institute for Highway Safety Offset Barrier Crash Test Protocol (Version X) 1005 N. Glebe Road, Arlington, VA 22201. All rights reserved. April 2004 ó 12
Seat bolts (typically, four points): Each of the four (or fewer) bolts that anchor the driver seat to the floor of the vehicle.
Seat (four points): Each of the corners of a 20-cm square, whose sides are aligned with the lateral and longitudinal reference axes, is centered on the surface of the seat cushion.
A-pillar (one point): The A-pillar is marked on the outside of the vehicle at the same vertical coordinate as the base of the left front window.
B-pillar (one point): The B-pillar is marked on the outside of the vehicle at the longitudinal center of the pillar at the same vertical coordinate as the lower A-pillar mark.
Seat Belt Retractor Spool-Out and Crash Tensioner Spool-In
Slack seat belt webbing that is allowed to spool off the retractor is measured during the crash. Only the maximum length of spool-out is measured and recorded. After the seat belt is fastened around the dummy, a piece of string is stitched into the belt webbing above the retractor housing. The free end of the string is pulled taut and taped against the B-pillar trim panel. The precrash position of the string relative to the tape is marked. After the crash, the position of the string relative to the tape is marked. The reported maximum belt spool-out is the distance between the precrash and postcrash marks on the string measured to the nearest centimeter.
For belts equipped with crash tensioners, a second piece of string is stitched into the belt webbing near the upper anchorage D-ring. The free end of the string is pulled taut and taped against the B-pillar trim panel, usually above the D-ring. The precrash position of the string relative to the tape is marked. After the crash, the position of the string relative to the tape is marked. The reported maximum belt spool-in is the distance between the precrash and postcrash marks on the string measured to the nearest centimeter. Because separate strings that show pull in opposing directions are used, the measured belt spool-out and spool-in values are independent of each other.
Dummy Kinematics and Contact Locations
Dummy kinematics are studied by reviewing the high-speed film using a film analyzer and analysis software. Contact of the dummyís head or knees with the vehicle interior are recorded on the basis of postcrash grease paint deposits.
The dummy is inspected in its undisturbed postcrash position. The condition of the ankle joints, resting positions of the feet, and positions of the knees are recorded, and photographs are taken of these components. Any damage to the dummy or unusual dummy resting position information is noted. The locations of paint transferred from the dummy to the vehicle interior are noted, and the contacted components are photographed.
The high-speed film record is used to estimate the time after the start of the crash that various events occur. For each event, the camera that provides the clearest view of the event is used. The start of the crash is considered to be the first frame in the film from each camera in which the LEDs mounted on the hood of the vehicle are illuminated. The time recorded for each event is based on the number of frames elapsed from the start of the crash and the nominal operating
2004 Insurance Institute for Highway Safety Offset Barrier Crash Test Protocol (Version X) 1005 N. Glebe Road, Arlington, VA 22201. All rights reserved. April 2004 ó 13
speed of the camera. For the cameras operating at 500 frames/second, the estimate of the crashís start time can be up to 2 ms late, and the eventís time, as determined from the film, can be early or late by 2 ms. The time of the driver airbag deployment, full inflation, and first dummy contact are recorded as well as any other notable events.
Dummy Responses
Each Hybrid III dummy is equipped with instrumentation for measuring the following:
Head Triaxial accelerations (three Endevco 7264A-2000 accelerometers)
Neck A-P shear force Axial force A-P moments (R.A. Denton Model 2564 or 1716A upper neck load cell)
Chest Triaxial accelerations (three Endevco 7264A-2000 accelerometers) Rib compression
Lower Extremities Femur axial forces (R.A. Denton Model 2121A load cell) Tibia-femur displacements Upper tibia A-P moments Upper tibia L-M moments (R.A. Denton Model 1583 load cell) Lower tibia A-P moments Lower tibia L-M moments Lower tibia axial forces (custom R.A. Denton Model 3093 load cell) Biaxial foot accelerations (A-P and I-S) (two Endevco 7264A-2000 accelerometers)
All instruments are regularly calibrated to a known standard. Accelerometers and load cells are calibrated every 12 months.
All measurements recorded from these instruments comply with the recommendations of SAE Information Report J1733 ñ Sign Convention for Vehicle Crash Testing DEC94 (SAE, 1998).
The Denton IDDAS is installed in the thorax of the Hybrid III dummy and used for all dummy and vehicle data acquisition. During the crash, all measurements are recorded in the systemís random access memory with 12-bit resolution at a sample rate of 10 kHz. Signals in all channels convert simultaneously, so the time reference for different channels is not skewed. To ensure digital fidelity, all signals are filtered by an analog low-pass prefilter with a 2.5 kHz cutoff frequency.
After the data have been downloaded from the IDDAS, any initial offset from zero is removed from each channel by computing the mean value for 100 data points preceding the crash event (from 50 to 40 ms before impact) for each channel and subtracting each mean from the respective
2004 Insurance Institute for Highway Safety Offset Barrier Crash Test Protocol (Version X) 1005 N. Glebe Road, Arlington, VA 22201. All rights reserved. April 2004 ó 14
data channel. The data are digitally filtered using the frequency response classes recommended in SAE Recommended Practice J211/1 ñ Instrumentation for Impact Test ñ Part 1. Electronic Instrumentation MAR95. Foot accelerations are filtered to SAE CFC 180. All filtering and subsequent calculations are executed using DSP Development Corporationís (1997) DADiSP Ver. 4.1 NI NK B07.
Modifications to Hybrid III Lower Leg A-P (MY) Moments
The Hybrid III lower leg geometry allows pure compressive loads on the tibia to result in the tibia bowing forward (negative Y moment per SAE J1733 sign convention). This forward upper tibia bending in many cases can be shown to be only the product of the axial force acting on the moment arm between the upper tibia load cell and the line of force through the ankle and knee pivots, and not due to external forces bending the tibia. The upper tibia A-P moment (and to a much lesser extent, the lower tibia A-P moment) are modified mathematically to correct the problem. The mathematical adjustment is based on the tibia axial force, the known moment arms between the tibia load cells and the line of force through the ankle and knee pivots, and the known angle between the tibia shaft and the actual line of force. The adjusted upper tibia moment is calculated using Equation 1, and the adjusted lower tibia moment is calculated using Equation 2. Note that these equations are based on the SAE J1733 sign convention, with moments in Newton-meters (Nm) and axial force in Newtons (N). The lower tibia moments change very little because the line of force between the ankle and knee is very close to the center of the lower tibia load cell (Welbourne, 1998; Zuby et al., 2001).
MY adjusted = MY measured − FZ measured (0.02832) (1)
MY adjusted = MY measured + FZ measured (0.006398) (2)
In addition to summary metrics for each of the recorded data channels, the following calculations are made: vector resultant of the head acceleration; 3 ms clip of the vector resultant head acceleration; head injury criterion (HIC);* neck Nij (calculated using formulas presented in 65 FR 30680); vector resultant of the spine accelerations; 3 ms clip of the vector resultant thoracic spine acceleration; viscous criterion; sternum deflection rate; vector resultant of the tibia bending moments (using the adjusted tibia A-P moments); tibia index (using the adjusted tibia A-P moments); and vector resultant of the foot accelerations. All calculations comply with the recommendations of SAE Information Report J1727 ñ Injury Calculation Guidelines AUG96 (SAE, 1998). The sternum deflection rate is calculated from the sternum deflection filtered to CFC 60. * HIC is calculated two ways: the first limits the maximum HIC interval to 36 ms (HIC-36), and the second limits the maximum HIC interval to 15 ms (HIC-15).
2004 Insurance Institute for Highway Safety Offset Barrier Crash Test Protocol (Version X) 1005 N. Glebe Road, Arlington, VA 22201. All rights reserved. April 2004 ó 15
References
DSP Development Corporation. 2002. DADiSP Ver. 6.0 NI NK B03. Cambridge, MA.
Insurance Institute for Highway Safety. 2004. Guidelines for using the UMTRI ATD positioning procedure for ATD and seat positioning (version IV). Arlington, VA.
Society of Automotive Engineers. 1998. 1998 SAE Handbook, Vol. 3 ñ On-Highway Vehicles and Off-Highway Machinery. Warrendale, PA.
Wellbourne, E.R. and Shewchenko, N. 1998. Improved measures of foot ankle injury risk from the Hybrid III tibia. Proceedings of the 16th International Technical Conference on the Enhanced Safety of Vehicles, 1618-26. Washington, DC: National Highway Traffic Safety Administration.
Zuby, D.S.; Nolan, J.M.; and Sherwood, C.P. 2001. Effect of Hybrid III leg geometry on upper tibia bending moments (SAE paper offer 01B-240). To be presented at the 2001 SAE International Congress and Exposition, Detroit, MI. Arlington, VA: Insurance Institute for Highway Safety.
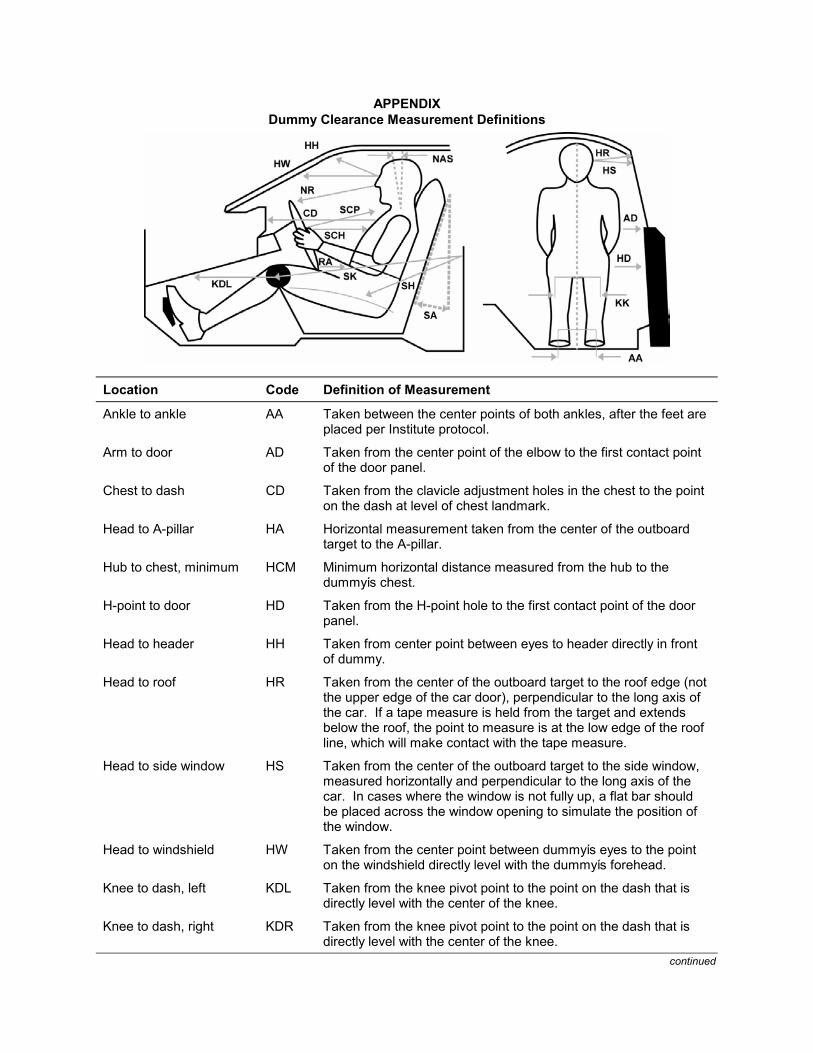
APPENDIX Dummy Clearance Measurement Definitions
Location Code Definition of Measurement
Ankle to ankle AA Taken between the center points of both ankles, after the feet are placed per Institute protocol.
Arm to door AD Taken from the center point of the elbow to the first contact point of the door panel.
Chest to dash CD Taken from the clavicle adjustment holes in the chest to the point on the dash at level of chest landmark.
Head to A-pillar HA Horizontal measurement taken from the center of the outboard target to the A-pillar.
Hub to chest, minimum HCM Minimum horizontal distance measured from the hub to the dummyís chest.
H-point to door HD Taken from the H-point hole to the first contact point of the door panel.
Head to header HH Taken from center point between eyes to header directly in front of dummy.
Head to roof HR Taken from the center of the outboard target to the roof edge (not the upper edge of the car door), perpendicular to the long axis of the car. If a tape measure is held from the target and extends below the roof, the point to measure is at the low edge of the roof line, which will make contact with the tape measure.
Head to side window HS Taken from the center of the outboard target to the side window, measured horizontally and perpendicular to the long axis of the car. In cases where the window is not fully up, a flat bar should be placed across the window opening to simulate the position of the window.
Head to windshield HW Taken from the center point between dummyís eyes to the point on the windshield directly level with the dummyís forehead.
Knee to dash, left KDL Taken from the knee pivot point to the point on the dash that is directly level with the center of the knee.
Knee to dash, right KDR Taken from the knee pivot point to the point on the dash that is directly level with the center of the knee.
continued
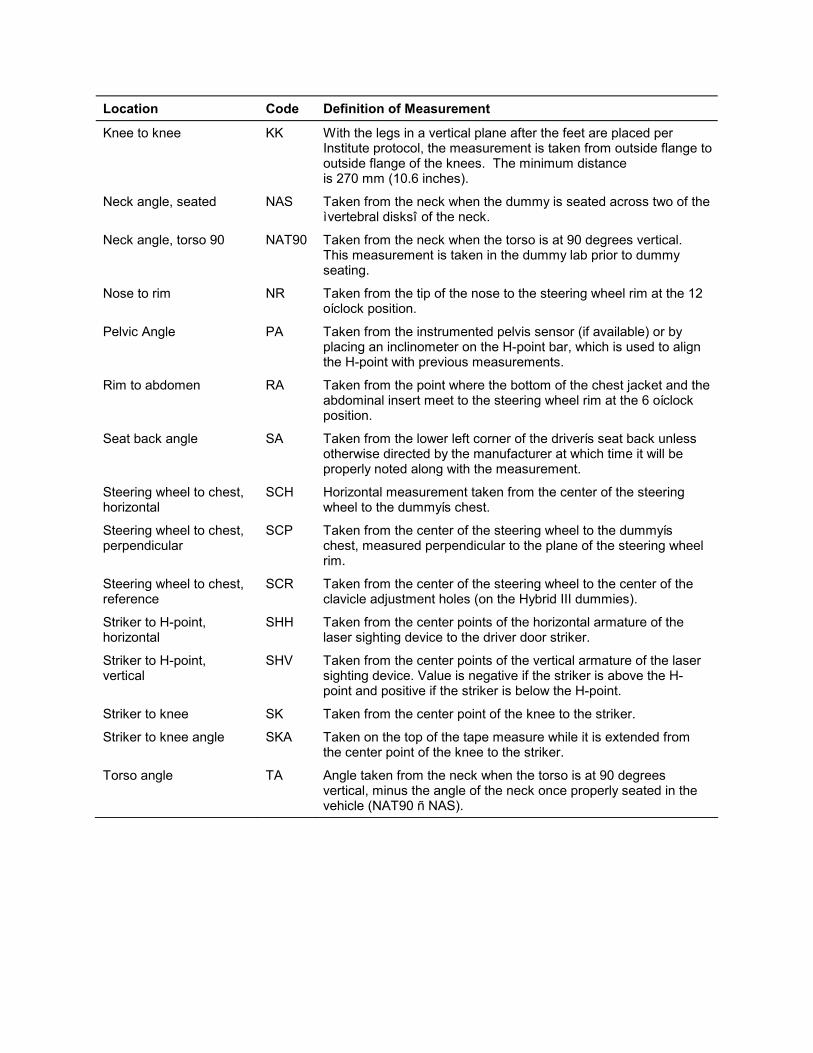
Location Code Definition of Measurement
Knee to knee KK With the legs in a vertical plane after the feet are placed per Institute protocol, the measurement is taken from outside flange to outside flange of the knees. The minimum distance is 270 mm (10.6 inches).
Neck angle, seated NAS Taken from the neck when the dummy is seated across two of the ìvertebral disksî of the neck.
Neck angle, torso 90 NAT90 Taken from the neck when the torso is at 90 degrees vertical. This measurement is taken in the dummy lab prior to dummy seating.
Nose to rim NR Taken from the tip of the nose to the steering wheel rim at the 12 oíclock position.
Pelvic Angle PA Taken from the instrumented pelvis sensor (if available) or by placing an inclinometer on the H-point bar, which is used to align the H-point with previous measurements.
Rim to abdomen RA Taken from the point where the bottom of the chest jacket and the abdominal insert meet to the steering wheel rim at the 6 oíclock position.
Seat back angle SA Taken from the lower left corner of the driverís seat back unless otherwise directed by the manufacturer at which time it will be properly noted along with the measurement.
Steering wheel to chest, horizontal
SCH Horizontal measurement taken from the center of the steering wheel to the dummyís chest.
Steering wheel to chest, perpendicular
SCP Taken from the center of the steering wheel to the dummyís chest, measured perpendicular to the plane of the steering wheel rim.
Steering wheel to chest, reference
SCR Taken from the center of the steering wheel to the center of the clavicle adjustment holes (on the Hybrid III dummies).
Striker to H-point, horizontal
SHH Taken from the center points of the horizontal armature of the laser sighting device to the driver door striker.
Striker to H-point, vertical
SHV Taken from the center points of the vertical armature of the laser sighting device. Value is negative if the striker is above the H-point and positive if the striker is below the H-point.
Striker to knee SK Taken from the center point of the knee to the striker.
Striker to knee angle SKA Taken on the top of the tape measure while it is extended from the center point of the knee to the striker.
Torso angle TA Angle taken from the neck when the torso is at 90 degrees vertical, minus the angle of the neck once properly seated in the vehicle (NAT90 ñ NAS).