cranfield university mishal m. alotaibi · pdf file · 2016-01-13... customer...
TRANSCRIPT

© Cranfield University 2014. All rights reserved. No part of this publication may be reproduced without the
written permission of the copyright owner.
CRANFIELD UNIVERSITY
MISHAL M. ALOTAIBI
Evaluation of “AIRQUAL” scale for measuring airline service quality
and its effect on customer satisfaction and loyalty
School of Aerospace, Transport and Manufacturing
Centre for Air Transport Management
PhD Thesis
Academic Year: 2010 - 2015
Supervisor: Dr. Keith John Mason
April 2015

Measuring Service Quality, Customer satisfaction and Loyalty in Airline Industry
© Cranfield University 2014. All rights reserved. No part of this publication may be reproduced without the
written permission of the copyright owner.

© Cranfield University 2014. All rights reserved. No part of this publication may be reproduced without the
written permission of the copyright owner.
CRANFIELD UNIVERSITY
School of Aerospace, Transport and Manufacturing
Centre for Air Transport Management
PhD Thesis
Academic Year 2010 – 2015
MISHAL M. ALOTAIBI
Evaluation of “AIRQUAL” scale for measuring airlines service quality
and its effect on customer satisfaction and loyalty
Supervisor: Dr. Keith John Mason
April 2015
This thesis is submitted in partial fulfilment of the requirements for
the degree of Doctor of Philosophy

Measuring Service Quality, Customer satisfaction and Loyalty in Airline Industry
© Cranfield University 2014. All rights reserved. No part of this publication may be reproduced without the
written permission of the copyright owner.

i
ABSTRACT
Globalisation and stiff competition have changed the landscape of doing
business. Decrease in customer loyalty and increase in customer expectations
have challenged businesses to come up with unique methods of enhancing their
quality of service. The same is true for airlines industry too. As a result, many
airlines have transformed their marketing strategies, especially with regard to
service quality, in order to compete efficiently in the global market. The marketing
literature has introduced models of service quality, e.g.: SERVQUAL and
AIRQUAL to help organisations measure and enhance customer experiences.
SERVQUAL has been extensively researched and applied in many industries.
Similarly, AIRQUAL, a model for the airline industry, has been developed but
applied only in Cyprus. Moreover, the AIRQUAL scale lacks validity, as its
development process is incomplete. This research, therefore, adapted 30-items
of AIRQUAL and assessed and validated this revised scale. The validated scale
was then applied to the airline industry of Saudi Arabia. Further, a comprehensive
model is proposed, where the impact of the validated scale of service quality is
tested with its impact on customer satisfaction, attitudinal loyalty, word of mouth,
repurchase intentions and complaining behaviour. The assessment and
validation process is divided into two main stages: first, qualitative; where four
focus group interviews were undertaken that generated 46 items for the adapted
scale. These items describe the perceptions of airline customers regarding
service quality and were classified on the bases of the scheme proposed by
Parasuraman et al. (1988). Second, a three-phase two sample, quantitative,

ii
research was performed to derive a validated 30-item scale comprising five
dimensions: tangibles, reliability, responsiveness, assurance, and empathy.
Further, the improved scale was tested in a new market (Saudi market) in order
to assess the service quality of Saudi Airlines. A total of 500 self-administered
questionnaires were distributed among airline customers. The returned
questionnaires underwent thorough screening and cleaning. The reliability of the
scale was tested through Cronbach’s Alpha, followed by exploratory factor
analysis (EFA), which emerged with five dimensions. The content, convergent
and discriminant validities were established. Further scale confirmation was
conducted on a sample of US airline passengers. Finally, the proposed model
with nine hypotheses was tested, which resulted in statistically significant results
for all the proposed hypotheses
Keywords:
Service quality, AIRQUAL, airlines, customer satisfaction, attitudinal loyalty, word
of mouth, repurchase intentions, complaining behaviour, Kingdom of Saudi
Arabia.

iii
ACKNOWLEDGEMENTS
First of all, I like to thank ALLAH, the Most Merciful, Most Compassionate, who
has guide me in the right direction to complete this thesis.
I would also like to take this good opportunity to express my thankfulness to Saudi
Arabian Airlines who awarded me a scholarship to broaden my horizons. I like to
express my sincere gratitude to my supervisor Dr. Keith Mason, Head of Centre
for Air Transport Management, for his supervision, support, guidance as well as
his positive criticism, during the programme of my PhD. Without his advice, I
would not have the personal, professional and academic achievements that I
have had. Also, all staff and members of the air transport management group for
their help and support during the whole period of this journey at Cranfield
University. In addition, I would also like to thank thousands of anonymous
respondents who had participated in this survey. Moreover, honourable thank
goes to my wife and children for their patience and encouragement. Last but not
least, I would also like to express my thankfulness for all my friends here in UK
and also in Saudi Arabia for their helpful advice and support.

iv
TABLE OF CONTENTS
ABSTRACT ..................................................................................................... i
ACKNOWLEDGEMENTS .............................................................................. iii
TABLE OF CONTENTS .................................................................................... iv
LIST OF FIGURES........................................................................................... vii
LIST OF TABLES ............................................................................................ viii
CHAPTER 1 ...................................................................................................... 9
Introduction ....................................................................................................... 9
1.1 Subject of study ....................................................................................... 9
1.2 Problem statement................................................................................. 10
1.3 Research questions ............................................................................... 11
1.4 Aim ........................................................................................................ 12
1.5 Objectives .............................................................................................. 13
1.5.1 General objectives ...........................................................................13
1.5.2 General objectives ...........................................................................13
1.6 Hypotheses............................................................................................ 14
1.7 Contributions to knowledge .................................................................... 17
1.5 Structure of the thesis ............................................................................ 17
CHAPTER 2 .................................................................................................... 19
Literature review ............................................................................................. 19
2.1 Characteristics of service ....................................................................... 19
2.1.1 Intangibility .......................................................................................20
2.1.2 Heterogeneity ...................................................................................21
2.1.3 Inseparability ....................................................................................22
2.1.4 Perishability......................................................................................22
2.2 Service quality ....................................................................................... 22
2.2.1 SERVQUAL model ...........................................................................25
2.2.2 Criticism of SERVQUAL ...................................................................29
2.2.3 Emergence of AIRQUAL ..................................................................32
2.2.4 AIRQUAL model ..............................................................................38
2.3 Customer satisfaction ............................................................................ 48
2.4 Customer loyalty .................................................................................... 52
CHAPTER 3 .................................................................................................... 58
Research methodology ................................................................................... 58
3.1 Methodological approach ....................................................................... 59
3.2 Research design .................................................................................... 60
3.2.1 Justification of exploratory research .................................................61
3.2.2 Justification of survey research ........................................................62
3.3 Questionnaire development ................................................................... 64
v
3.4 Sampling design process ....................................................................... 65
3.4.1 Target population .............................................................................65
3.4.2 Sampling design ..............................................................................66
3.4.3 Determination of sample size ...........................................................67
3.5 Data analysis ......................................................................................... 68
3.5.1 Qualitative data ................................................................................68
3.5.2 Quantitative data ..............................................................................69
3.5.2.1 Descriptive analysis .................................................................. 69
3.5.2.2 Data preparation and screening ................................................ 69
3.5.2.3 Exploratory factor analysis ........................................................ 70
3.5.2.4 Scale validity ............................................................................. 70
3.5.2.5 Hypotheses testing ................................................................... 72
3.7 Conclusion ............................................................................................. 72
CHAPTER 4 .................................................................................................... 73
Qualitative study ............................................................................................. 73
4.1 Focus Group Discussions ...................................................................... 73
4.1.1 Recruitment of Focus Group participants .........................................74
4.1.2 Focus Group Structure .....................................................................76
4.1.3 Role of Moderator ............................................................................78
4.2 Qualitative Data Analysis ....................................................................... 79
4.3 Qualitative Data Finding......................................................................... 80
4.4 Conclusion ............................................................................................. 82
CHAPTER 5 .................................................................................................... 83
Quantitative appraisal of AIRQUAL scale ........................................................ 83
5.1 Pre-testing ............................................................................................. 84
5.1.1 Descriptive analysis .........................................................................84
5.1.2 Reliability test ...................................................................................87
5.2 Saudi sample ......................................................................................... 88
5.2.1 Data preparation and screening .......................................................88
5.2.1.1 Missing Data ............................................................................. 88
5.2.1.2 Outliers ..................................................................................... 90
5.2.1.3 Normality .................................................................................. 91
5.2.2 Descriptive analysis .........................................................................93
5.2.2.1 Response rate .......................................................................... 93
5.2.2.2 Demographic profile .................................................................. 94
5.2.2.3 Attributes of service quality ....................................................... 98
5.2.3 Reliability test ................................................................................. 100
5.2.4 Exploratory factor analysis (EFA) ................................................... 101
5.2.5 Scale validity .................................................................................. 106
5.2.5.1 Convergent validity ..................................................................107

vi
5.2.5.2 Discriminant validity .................................................................108
5.3 United States sample ............................................................................111
5.3.1 Data preparation and screening ..................................................... 111
5.3.1.1 Missing Data ............................................................................111
5.3.1.2 Outliers ....................................................................................112
5.3.1.3 Normality .................................................................................113
5.3.2 Descriptive analysis ....................................................................... 113
5.3.2.1 Response rate .........................................................................114
5.3.2.2 Demographic profile .................................................................115
5.3.2.3 Attributes of service quality ......................................................118
5.3.3 Reliability test ................................................................................. 121
5.3.4 Exploratory Factor Analysis ............................................................ 122
5.3.5 Scale validity .................................................................................. 129
5.3.5.1 Convergent validity ..................................................................129
5.3.5.2 Discriminant validity .................................................................130
5.4 HYPOTHESES TESTING .....................................................................133
CHAPTER 6 ...................................................................................................149
Conclusion & recommendation ......................................................................149
Introduction .................................................................................................149
6.1 Research questions addressed.............................................................149
6.2 Significance for theory and practice ......................................................157
6.2.1 Implication for knowledge ............................................................... 157
6.2.2 Implication for practitioners ....................................................... 159
6.2.3 Implication for policy-makers .......................................................... 159
6.3 Limitations and directions for future research........................................161
REFERENCES ..............................................................................................163
APPENDICES ................................................................................................186

vii
LIST OF FIGURES
Figure 2.1 The Gap model .............................................................................. 26
Figure 2.2 Suggested procedure for developing a better measurement .......... 34
Figure 2.3 Summary of steps employed in developing the AIRQUAL scale..... 37
Figure 2.4 An investigation on the factors influencing passengers’ loyalty in
the North Cyprus national airline ..................................................................... 41
Figure 2.5 Perceptions of service quality in North Cyprus National Airline....... 42
Figure 2.6 Service Loyalty “An Integrative Model and Examination across
Service Contexts ............................................................................................. 45
Figure 2.7 The Effect of Airline Service Quality on Passengers’ Behavioural
Intentions Using SERVQUAL Scores: A TAIWAN Case Study ........................ 46
Figure 2.8 Proposed Model for this study ........................................................ 47
Figure 3.1 Summery of steps will be employed in validating the AIRQUAL
scale……………………………………………………………………………….…..71

viii
LIST OF TABLES
Table 4.1 Focus group interviewees ................................................................ 76
Table 5.1 Demographic breakdown of the sample (n = 72) ............................. 86
Table 5.2 Pre-testing - reliability statistics of the questionnaire….....................88
Table 5.3 Response Rate of the distributed questionnaire………………………94
Table 5.4 Demographic profile of the respondents……………………………....97
Table 5.5 Descriptive statistics: service quality..................................................98
Table 5.6 Reliability statistics of the questionnaire……………….……….…....101
Table 5.7 KMO and Bartlett’s Test...................................................................102
Table 5.8 Result of Factor Analysis.................................................................103
Table 5.9 Revised of Factor Analysis..............................................................105
Table 5.10 Reliability Coefficient of the Extracted Factors...............................106
Table 5.11 Significant Differences in Mean Scale Values for Respondents....110
Table 5.12 Response Rate of the Distributed Questionnaires.........................114
Table 5.13 Demographic Profile of the Respondents......................................118
Table 5.14 Descriptive Statistics: Service Quality............................................119
Table 5.15 Reliability Statistics of the Questionnaire - US...............................122
Table 5.16 KMO and Bartlett’s Test - US.........................................................123
Table 5.17 Results of Factor Analysis –US .....................................................124
Table 5.18 Revised Factor Analysis –US .......................................................127
Table 5.19 Reliability Coefficient of the Extracted Factors -US.......................128
Table 5.20 Significant Differences in Mean Scale Values for Respondents....132
Table 5.21 Pearson correlation………………………………………………........134
Table 5.22 Result of hypothesis testing…………..…………………..................136

9
CHAPTER 1
Introduction
Customers are the lifeblood of any business. Those businesses that fail to satisfy
and retain customers usually end up with a decline in the overall profit, and
demonstrate a limited prospective for growth. This is the reason that many
researchers have shown a keen interest in exploring the antecedents to better
financial performance (Babakus, Bienstock, & Van Scotter, 2004; Fornell, 1992;
Ittner & Larcker, 1998). These studies found that improving service quality and
customer satisfaction result in better financial performance. Should
methodologies of best practice be evidenced, the ramifications for businesses
are potentially enormous. As a result, the present study also attempts to
investigate service quality and customer satisfaction with their impact on
customer loyalty, specifically within the airline sector.
1.1 Subject of study
This thesis is related to airline service quality (AIRQUAL scale) and its effect on
customer satisfaction and customer loyalty. The reason for selecting this study is
to assess the extent to which this model overcomes the limitations of the
SERVQUAL scale, particularly with regards to its applicability in the airline
industry. The present study will, therefore, contribute to the knowledge by the
confirmation, assessment and validation of AIRQUAL scale. This is based upon
second stage of validity procedures, as proposed by Parasuraman et al. (1988).

10
Furthermore, the validated scale will be applied to a new market (Saudi Arabia)
in order to empirically test its strength from a different contextual perspective.
1.2 Problem statement
Almost three decades ago Parasuraman and colleagues developed their famous
scale for service quality, named SERVQUAL. This scale has been widely applied
in various industries in numerous countries. There are, however, a number of
inconsistencies within the scale. For example, the five original service quality
dimensions proposed by Parasuraman et al. (1988) have been criticised by many
due to the lack of consistency across industries. This is the reason, researchers
began to both add and delete dimensions in the original service quality scale
(SERVQUAL), and gave it names based on the respective industry, e.g., in
airlines industry the service quality scale proposed is called AIRQUAL (Bari et al.,
2001). The scale developed and proposed by Bari et al. (2001) based on the
Cypriot market lacked validity, as it did not follow all the required steps necessary
for the validation of an instrument. Due to this problem the AIRQUAL scale could
not be applied in other countries, the opposite problem presented by the original
SERVQUAL scale. In order to address this problem, this study considered the
same AIRQUAL scale and followed all the steps proposed by Parasuraman et al.
(1988) to confirm and validate an instrument. This is a unique hybrid scale, which
will provide a more rigorous academic assessment of the perceptions of service
quality in practice. Further, the validated scale was tested in the airline industry
of the Kingdom of Saudi Arabia.

11
In addition to the main problem addressed by the present study, another issue
considered was the positive correlation between the impact of airline service
quality and customer satisfaction and loyalty. With the objective of improving
customer loyalty and increasing profitability, many airlines introduced loyalty
schemes in the 1980s and 1990s. The common name given to these schemes
were frequent flyer programs (FFP). The objective of these was to reward
passengers for flights taken with a given airline and encourage loyalty. While
these programmes attract a large number of customers, it is still unclear if they
really ensure customer satisfaction and loyalty. Researchers proposed many
antecedents of customer satisfaction and loyalty with enhanced service quality
as being most important. Investigating the relationship among service quality,
customer satisfaction and customer loyalty is imperative in the airline industry, as
many other options are available with airlines to ensure repeat purchase by
customers (e.g., FFP). Exploring the link between service quality, customer
satisfaction and customer loyalty has not been explored in a country like Saudi
Arabia. This research therefore, attempts to assess both the validity of the hybrid
AIRQUAL model in practice, and also to establish the contextual impact of service
quality of customer satisfaction and loyalty in a Saudi Arabian context.
1.3 Research questions
1. What are the main dimensions of service quality (AIRQUAL) in the airline
industry after validation
2. What is the impact of airline service quality on customer satisfaction in the
airline industry

12
3. What is the impact of airline service quality on attitudinal loyalty in the
airline industry
4. What is the impact of airline service quality on repurchase intention in the
airline industry
5. What is the impact airline service quality on word of mouth in the airline
industry
6. What is the impact of airline service quality on complaining behaviour in
the airline industry
7. What is the effect of customer satisfaction on attitudinal loyalty in the airline
industry
8. What is the effect of customer satisfaction on repurchase intention in the
airline industry
9. What is the effect of customer satisfaction on word of mouth in the airline
industry
10. What is the effect of customer satisfaction on complaining behaviour in the
airline industry
1.4 Aim
The aim of this research is to reassess the AIRQUAL scale for measuring service
quality, customer satisfaction and loyalty in airline Industry.

13
1.5 Objectives
1.5.1 General objectives
The general objective of the study is to confirm, assess and validate the
AIRQUAL scale, through assessment in different contexts. Furthermore, this
study investigates the impact of the validated AIRQUAL scale on customer
satisfaction and customer loyalty in the airline industry of Saudi Arabia.
1.5.2 General objectives
This research has the following objectives:
1. To confirm, assess and validate the AIRQUAL scale with identification of
its dimensions
2. To investigate the impact of service quality on customer satisfaction in the
airline industry
3. To examine the impact of service quality on attitudinal loyalty in the airline
industry
4. To investigate the impact of service quality on repurchase intention in the
airline industry
5. To examine the impact of service quality on word of mouth in the airline
industry
6. To examine the impact of service quality on complaining behaviour in the
airline industry
7. To investigate the influence of customer satisfaction on attitudinal loyalty
in the airline industry

14
8. To investigate the influence of customer satisfaction on repurchase
intention in the airline industry
9. To investigate the influence of customer satisfaction on word of mouth in
the airline industry
10. To investigate the influence of customer satisfaction on complaining
behaviour in the airline industry
1.6 Hypotheses
The following hypotheses are devised for the present study:
H1: Airline service quality has a positive impact on customer satisfaction in airline
industry
H2: Airline service quality has a positive impact on attitudinal loyalty in airline
industry
H3: Airline service quality has a positive impact on repurchase intention in airline
industry
H4: Airline service quality has a positive impact on word of mouth in airline
industry
H5: Airline service quality has a negative impact on complaining behaviour in
airline industry
H6: Customer satisfaction has a positive impact on attitudinal loyalty in the airline
industry

15
H7: Customer satisfaction has a positive impact on repurchase intention in the
airline industry
H8: Customer satisfaction has a positive impact on word of mouth in the airline
industry
H9: Customer satisfaction has a negative impact on complaining behaviour in the
airline industry

16
Note: (TANG) Tangible, (REL) Reliability, (PER) Responsiveness, (ASS) Assurance, (EMP)
Empathy, (PSQ) Perceived Service Quality, (CSAT) Customer Satisfaction, (BL) Behavioural
Loyalty, (RI) Repurchase Intention. (CB) Complaining behaviour, (WOM) Word of Mouth and (AL)
Attitudinal Loyalty.
ATTITUDINAL LOYALTY
EMP RES TANG
REL ASS
OVERALL SERVICE QUALITY
CUSTOMER SATISFACTION
BEHAVIORAL LOYALTY
RI
CB
WOM
17
1.7 Contributions to knowledge
This research has manifold significance for the extant body of modern service
quality research. Firstly, it attempts to confirm and validate the AIRQUAL scale,
which is based on the SERVQUAL scale. The validation is crucial as the original
developers of the AIRQUAL scale, (Bari et al., 2001), did not complete all the
steps required for its validation in practice. Secondly, the validated scale was
empirically tested in the airline industry of Saudi Arabia. This is unique as it is the
first time this scale has been applied in a Saudi Arabian context. Thirdly, the final
AIRQUAL scale is also tested with its impact on customer satisfaction and
customer loyalty. The result of the present study would be equally significant for
policy-makers and practitioners of the services industry in general and airline
industry in particular. The correlated results will re-affirm the relationship
between quality and loyalty, with recommendations for future notions of strategic
best practice management in the industry. Lastly, this study will also add to the
literature of service quality by enhancing the understanding of the dimensions
explored, which may be applied by airlines to improve their service quality,
resulting in enhance a customer satisfaction and increased customer loyalty.
1.5 Structure of the thesis
This thesis is designed in six chapters. The first chapter represents the overview
of the topic, and describes why this area of research has been chosen. The aim,
objectives, research questions, problem statement, hypothesis and the structure
of this thesis are also presented in chapter one. The second chapter contains an
extensive review of the literature on the given topic. The development of

18
hypotheses and framework of the study is also based on the literature review and
is explained in this chapter. The third chapter highlights the methodology of the
study. It presents and describes information regarding what, how, where, and
when data are sourced for using it in the present research. The fourth and the
fifth chapter present the analyses and results from the qualitative, as well as, the
quantitative research. Finally, discussion on the results, contribution of the
present study, suggestions for future research and conclusion are explained in
the sixth chapter.
19
CHAPTER 2
Literature review
This chapter provides a detailed review of current academic literature pertaining to
airline service quality, customer satisfaction and consumer loyalty. Initially, therefore,
it is important to establish the evolution, roots, and foundations of knowledge (Moller
& Halinen, 2000) that underpin 21st century notions of 'service quality' in order to
develop a robust framework for assessing customer loyalty in the Airline industry,
This literature review examines current established academic opinion and debates
surrounding our understanding of service quality, and the metrics by which this is
currently quantified. The chapter will then examine the interrelationships between
AIRQUAL, customer satisfaction, and customer loyalty to illuminate propositions
based on the extant literature. From this assessment a model for customer loyalty in
the airline industry is proposed based on the theoretical foundations that have
emerged from the literature.
2.1 Characteristics of service
A number of essential characteristics of the determining factors of 'services' need
establishing before an assessment of their quality can be made. Firstly, it is important
to note that services are distinct from goods, as they are not physical things
(Schneider & White, 2004) but processes (McLuhan, 1964). For example, we say
“airline” when we mean “air transportation”, we say “movie” when we mean
“entertainment services”, we say “hotel” when we mean “lodging rental”, and so on
(McLuhan, 1964, p.34). Based on these characteristics, Schneider and White (2004)

20
highlighted that pure services cannot be seen, touched, held, or stored because they
have no physical manifestation, but are considered part of a process or interaction.
Berry (1980, pp. 24-29) distinguished between services and goods and argued that,
services are acts, deeds, performances, or efforts, whereas, goods are articles,
devices, materials, objects, or things. That is why, when a customer buys a physical
good, they acquire its title and transfer of ownership takes place. In contrast, a service
consumer receives only the right to a service for a specified amount of time
(Kandampully, 2002). Services are characterized by the following elements:
intangibility, heterogeneity, inseparability (Zeithaml et al., 1985) and in some cases
perishability (Hartman & Lindgren, 1993), although this is not a pre-determinate factor
constituting a service.
2.1.1 Intangibility
As services are defined as an intangible process, customers can only measure its
quality through their own subjective perception (Mackey and Crompton, 1998;
Kandampully, 2002). Lovelock and Gummenson (2004) went a step further by
filtering this conception of a service through three dimensions of intangibility, namely,
physical intangibility, mental intangibility, and generality. Physical intangibility
dimension refers to the untouchability, mental intangibility refers to the degree of
visualisation, and generality dimension of intangibility refers to the accessibility or
inaccessibility (Lovelock & Gummesson 2004). Insofar as research found that the
more tangible parts of the service experience can serve as a proxy (Berry, 1983;
Zeithaml, 1988), service providers should manage those tangible parts to optimize

21
the consumer’s perception of service quality (Berry, 1983). Intangibility, therefore,
necessitates a subjective engagement of the consumer in evaluating the process.
2.1.2 Heterogeneity
Another element central to understanding and quantifying a 'service' is to note that
they are heterogeneous. The service delivery is itself totally dependent on the staff
member's skill level. For this reason, firms have the extra challenge maintaining
unwavering standards of quality (Zeithaml, 1985; Bitner et al., 1994). Airline
management is especially challenged insofar as air travellers have direct interaction
with the airline staff, which may diminish the level of service quality, especially the
service perceived by its customers (Zeithaml et al., 1993). The limited access to other
staff members means that these staff also need to be excellent problem solvers, often
improvising to provide the best quality of service possible. For example, successful
companies must therefore do their utmost to ensure their customer contact staff are
highly trained in people skills and public relations, compared to the non-customer
contact staff (Zeithaml et al., 1993).
Heterogeneity in this sense, therefore indicates the varying demands and
expectations of customers that staff or managers in the services production have to
meet. This is due to the fact that service production and delivery involves the
interaction of service personnel and customers that make delivery of services non-
identical in nature (Schneider and White, 2004). For instance, an insurance company
might be receiving customers each with different demands, or even if the demand is
similar, the expectation in terms of delivery differs. Thus the personnel have to
continually adjust to the heterogeneous environment in which they work.

22
2.1.3 Inseparability
As a process that is intangible then, service is experienced the moment it is delivered
(Kotler, 2003, Gronroos, 1990). One important feature therefore is the inseparability
of services. This means that an organization must strive hard to ensure maximization
of consumption of output by customers when service is readily available as no further
storage can be made (Schneider and White, 2004). Airline managers must work hard
to leave no empty seat exists as it cannot be inventoried for later use (Schneider and
White, 2004). Similarly, a hotel management must try to fill vacant rooms as much
as possible as the unfilled room’s revenue cannot be recovered.
2.1.4 Perishability
Services are perishable, which means that they cannot be saved, stored for reuse at
a later date, resold, or returned in the same sense as a product (Lovelock &
Gummesson, 2004). The issue of perishability is also of prime concern for the
producers (Hartman & Lindgren, 1993). This dimension of service comes to play
especially, when an organisation can’t fully meet the demands of the consumers
(Hartman & Lindgren, 1993). In the case of airlines, if the customers wait for the
registration process in long queues or wait in the boarding area for long hours, service
perishability is resulted (Hartman & Lindgren, 1993).
2.2 Service quality
In marketing, the focus of service performance has been on the quality of service, or
the evaluation of the performance of service. For decades, the definition and
measurement of service quality has occupied a significant position in services
23
marketing literature (see Appendix A). Lewis and Booms (1983) define service quality
as “a measure of how well the service delivered matches customer expectations.
Delivering service quality means conforming to customer expectations on a
consistent basis.” It has also been defined as the difference between customers’
expectations and the service delivered (Parasuraman et al., 1985).
Service quality can therefore be quantified by the degree of discrepancy between
customers’ desired, as opposed to predicted, expectations and their perceptions of
service performance (Parasuraman et al., 1985). Service quality levels are higher
when the gap between perceptions of performance and desired expectations is non-
existent or small; the levels of satisfactory service quality exist when perceived
performance exceeds predicted expectations (Parasuraman et al., 1988).
Service quality evaluation takes place when the customer's perceptions of the service
experienced are compared with the service expected. In contrast, product quality
results from a comparison of customer’s perceptions of product performance with the
expected level of product performance. A Service quality gap results when service
perceptions fall below expected levels. The gap that exists between the service
provider’s perception of quality and the customer’s perception of quality is the
perception gap (Oliver, 1999).
The difference between customers’ expectations and the service delivered is termed
the service quality (Parasuraman et al., 1985). Despite some definitional nuances,
researchers generally agree that service quality is concerned with whether service
perceptions meet, exceed or fall short of customer expectations (Babakus & Boller,
1992; Bolton & Drew, 1991; Boulding et al., 1993; Cronin & Taylor, 1992, 1994;

24
Gronroos, 1983a, 1983b; Oliver, 1993; Parasuraman et al., 1985; Zeithaml et al.,
1993). Understanding the service quality expectations of customers would give
marketers the opportunity to close the gap between expectations and perceptions of
service quality levels.
While academic researchers have long studied service quality and customer
satisfaction constructs, they differ on the nature of that research (Parasuraman et al.,
1988; Teas, 1993; Bitner & Mohr, 1995; Boulding, 1993; Oliver, 1993). Most
researchers argue that customer satisfaction and service quality are not the same
concepts (Parasuraman et al., 1988; Bitner & Mohr, 1995; Boulding, 1993; Oliver,
1993). Notwithstanding detractors, researchers are of two schools, that customer
satisfaction leads to service quality or the quality leads to satisfaction (Zeithaml et al.,
1993).
As such, researchers have become increasingly interested in exploring the
conceptual relationship between service quality and customer satisfaction (Oliver,
1993; Parasuraman et al., 1994). The evidence from the literature suggests that
quality precedes satisfaction, and more importantly, service quality, service value,
and satisfaction all lead to consumer loyalty (Cronin et al., 2000),(see Appendix B).
Ham (2003) also concluded that in most cases, customer satisfaction and customer
loyalty are the outcomes of service quality. Based on the previous research and
arguments of different scholars, Parasuraman et al. (1985) developed a scale for
assessing customer perceptions of service quality in service and retailing
organisations, named, SERVQUAL.

25
2.2.1 SERVQUAL model
In discussing service quality, Berry (1983) and Parasuraman et al. (1985, 1988, 1990,
and 1991) posited that both scholars and business professionals should not measure
quality directly. Indeed, Alotaibi (1992) stated that they should decompose the word
quality into manageable components or dimensions, which can in turn be quantified
and processed. Parasuraman et al. (1985) developed a procedure for quantifying
customers’ perceptions of service quality. SERVQUAL determines customers’ quality
perceptions as influenced by a series of five distinct gaps that can interfere with
delivery of high quality service. Each gap measures the difference. Gap 1 assesses
the difference between actual customer expectations and management’s perceptions
of customer expectation. Gap 2 measures the difference between management’s
perception of customer expectations and service quality expectations. Gap 3
addresses the difference between service quality specifications and the service
actually delivered. Gap 4 assesses the difference between service delivered and
what is communicated about the service to customers. Gap 5 arguably is the most
important; it occurs between customer expectations and perceptions, and gauges
perceived service quality (Parasuraman et al., 1985). (See figure 2.1)

26
Figure 2.1: The Gap Model
Customer
------------------------------------------------------------------------------------------------------------ Provider
Source: Parasuraman, A., Zeithaml V., Berry, L.L. (1985, p.44).
Word-of-mouth
Communications
Personal
needs
Past
experience
Service
delivery
External
communications to
customers
Expected
service
Perceived
service
Service quality
specification
Management perceptions of
customer expectations
Gap 5
Gap 2
Gap 4
Gap 1
Gap 3

27
Further, Parasuraman et al. (1990, 1991) refined their conceptual model to
operationalise and measure the gaps in their earlier conceptual service quality model.
They viewed SERVQUAL scores along the dimension indicators of the construct of
the perceived service quality.
One of the first items of research to be conducted on airline service quality was by
Gourdin (1988). Interestingly Gourdin (1988) did not use SERVQUAL. However,
Gourdin along with Kloppenborg in 1991 used the Parasuraman et al.’s (1985)
conceptual gaps model to find out the gaps between passenger expectations and
management perceptions of these gaps that might result in customer dissatisfaction
in the airline industry. The service quality gaps approach using SERVQUAL scale to
measure perceived service quality has also been applied by many other researchers
in various service industries (Fick & Ritchie, 1991).
The methodology of Fick and Ritchie (1991) was criticised by Cunningham et al.
(2004) who mentioned that, “they simply reported the mean scores of consumer
expectation and perception of service performance measures and failed to determine
the relative impact of various SERVQUAL items on overall service quality and
satisfaction” (p. 3). They further mentioned that SERVQUAL can result in better
findings if data analyses of individual items are done by means of multivariate
statistical techniques.
When developing SERVQUAL, Parasuraman et al. (1985) noted that both focus
group and in-depth interviews methods were adopted in the beginning with senior
management of different service firms, including; banks, telecommunication,
securities brokerages, appliance repair and maintenance shops, and credit card
companies. Further, empirical research was undertaken where they (Parasuraman

28
et al., 1985) proved that the criteria used by consumers in evaluating and assessing
service quality consists of ten dimensions which was later refined to five main
dimensions (Parasuraman et al., 1988). Customers’ responses to their perceptions
and expectations are measured on a 7-point Likert scale at (perception - expectation)
gap scores.
The refined version of SERVQUAL, (Parasuraman et al., 1988) replaced
communication, credibility, security, competence, and courtesy with one main
dimension of assurance. This consists of a number of dimensions, including:
1. Customers should be able to trust employees of these firms,
2. Customers should be able to feel safe in their transactions with these firms’
employees.
3. A firm’s employees should be polite, their employees should get adequate support
from these firms to do their jobs well.
Further, understanding /knowing the customers, and access was replaced by
empathy. The items they used for empathy (expectation and perception) are:
1. Firms should not be expected to give customers individual attention,
2. Employees of these firms cannot be expected to give customers personal
attention.
3. It is unrealistic to expect employees to know what the needs of their customers are
4. It is unrealistic to expect these firms to have their customers’ best interests at heart,

29
5. They shouldn’t be expected to have operating hours convenient to all their
customers.
This scale purification process resulted in the new refined instrument of SERVQUAL
with 22 items and five dimensions, namely; tangibles, reliability, responsiveness,
assurance, and empathy (Parasuraman et al., 1988). (See appendix C)
2.2.2 Criticism of SERVQUAL
Research on service quality is a volatile area of research, with fierce debate from
many theorists adopting a number of wide and conflicting stances. This is owed in
part to the subjective and qualitative nature of service quality perception. According
to Buttle (1996), in the period January 1992 to April 1994 articles published in various
journals on service quality and SERVQUAL differs dramatically in number. The
Global edition (September 1994) reported service quality to be a keyword in around
1447 articles compared to only 41 articles mentioning SERVQUAL (Buttle, 1996).
This huge gap in the number of articles published in various journals is due to the
criticism of SERVQUAL.
Buttle (1996) mentioned a number of criticisms of SERVQUAL. A principle criticism
of SERVQUAL is that the main focus is on the process of service delivery and not the
outcomes of the service encounter. As a means of determining 'quality' therefore, it
focusses not on the perceived receipt of service quality from the consumer, (whose
perceptions can change depending on culture, context, and personal subjectivity),
but on the quality of the service process itself. Further, the five dimensions of
SERVQUAL (Tangibles, Reliability, Responsiveness, Assurance and Empathy) are
not universal because during the principal component analysis, the 22 items were

30
found not to load on their respective factors and there is a high degree of correlation
between the five dimensions.
Buttle (1996) also explained that SERVQUAL cannot measure absolute service
quality expectations. He argued that only four or five items are not sufficient to capture
the variability within each service quality dimension. SERVQUAL also causes
confusion and raises the chances of respondents’ error because of the reversed
polarity of some items in the scale (see appendix C). In a similar manner, the seven-
point Likert scale used in SERVQUAL has also been criticised by numerous studies.
In fact, these criticisms are not specific to the applications of SERVQUAL. Lewis
(1993) has criticised the scale for its lack of verbal labelling for points two to six which
may cause the respondents to overuse the extreme ends of the scale and imply that
could be avoided by labelling all points. Another problem the interpretation of the
meaning of the midpoint of the scale (e.g. is it “don’t know” or “do not feel strongly in
either direction” or a “do not understand the statement”).
Lewis (1993) has also noted that there is a gap in responses. For example, the
expectation of the customer is perhaps 5.4, on the other hand may have 4.6 of
perception (a gap of 0.8) however by completing SERVQUAL; they may evaluated
each one as 5, the close to potential answer. Babakus and Mangold (1992) also
suggested using a five-point Likert scale instead because the seven-point Likert may
cause frustration and decrease both response rate and response quality. Finally, two
different sets of questions (expectation and perception) of the SERVQUAL instrument
can cause boredom and confusion (Buttle, 1996).

31
Carman (1990) highlighted the limitations of SERVQUAL instrument and stated that
the 22 items were never completely applicable, therefore, the robustness of the
instrument. He further objected to the nine items of the instrument which were stated
in negative format (see appendix C). These negatively stated items may lead the
respondents to misconstrue the questions resulting in unexpected outcomes
(Carman, 1990). Many other researchers also reported SERVQUAL to be
cumbersome and unsatisfactory based on the number of items it has for one field
study (Fick & Ritchie, 1991).
SERVQUAL has also been criticised on several other grounds. For example, Cronin
and Taylor (1992) argued that expectations cannot remain constant over time, which
attest to the inability of SERVQUAL to provide management with sufficient
information for strategy implementation and resource allocation for the purpose of
customer satisfaction (Hemmasi et al., 1997). Further, Jayasundara et al. (2009) and
Al-alak (2009) indicated that SERVQUAL cannot be used to measure customer
satisfaction to any great extent because of its relevance to measuring service quality.
Another criticism of SERVQUAL dimensions is its inability to measure service quality
consistently across different cultures, countries, and ethnicities (Furer et al., 2000).
Finally, the criticism of the inapplicability of the SERVQUAL model to all service
industry(Bekhet & Al-alak, 2011), which resulted in many modified versions of
SERVQUAL model over time (Bekhet & Al-alak, 2011; Eastman et al., 2011;
Beecham, 2009; Micuda & crucern, 2010; Kanning & Bergmann, 2009; Munteanu et
al., 2010; Maditinos & Theodoridis, 2010). Based on the above mentioned criticism
of SERVQUAL, scholars (Bekhet & Al-alak, 2011) recommended developing a more
realistic model specific to a particular culture, country, ethnicity, or service sector.
32
Bekhet and Al-alak (2011) also recommended that researchers in different emerging
economies should propose models that suit their country’s, culture, and service
sectors, because merely replicating a model may result in false outcomes which
ultimately will lead to the failure of organisational strategies.
2.2.3 Emergence of AIRQUAL
Given the wide criticisms of SERVQUAL as a process-based assessment of service
quality, a new measurement scale was developed by Bari et al. (2001): AIRQUAL.
This scale was used to measure airline service quality in The Turkish Republic of
Northern Cyprus (TRNC). The main reason behind the development of AIRQUAL
was that the existing scales of service quality were developed and evaluated in
different countries and were not psychometrically eligible to measures of service
quality in TRNC. This returns to our understanding of culture and context as being
essential to the process of quantifying consumer notions of 'service quality'.
AIRQUAL was important as many researchers argued that the dimensions and
nature of the SERVQUAL construct may be industry specific (Ekiz et al., 2006; Nadiri
et al, 2005; Nadiri et al., 2008 ; Babakus & Mangold, 1992). Further, many studies
have tried to replicate the five-dimensions of SERVQUAL, but have resulted in a
principal components analysis (PCA) in which only one dimension was found to be
significant (Angur et al., 1999; Babakus & Mangold, 1992; Babakus & Boller, 1992).
Occasionally this was the result of the exploratory factor analysis with eigenvalues
greater than one emerged with even ten dimensions, hence Carman (1990)
described the SERVQUAL dimensions as not being totally generic.

33
Nadiri and Hussain (2005), Karatepe and Avci (2002), Ekinci et al. (2003) found the
same scale to be two-dimensional. In a similar manner, researchers found
performance-only (SERVPERF) to be a better of exploring variance in an overall
measure of service quality compared to SERVQUAL instrument (Cronin & Taylor,
1994). These arguments in SERVQUAL made researchers develop scales which are
more industry specific.
Other objectives were to prove the efficiency of the newly designed AIRQUAL scale
compare to others, SERVQUAL scale and SERVPERF scale. Bari and her
colleagues carried out fieldwork in the form of an exploratory study, where
quantitative research was undertaken. To achieve their goal they followed two
important methods, first one was the sequence of 8 steps (specify domain of
construct, generate sample of items, collect data, purify the measure, assess
reliability with new data, assess construct validity and developing norms) presented
by Churchill (1979) (see Figure 2.2). The reason for choosing this method was to
ensure that their research is reliable on the subject and that the use of this framework
could be in order to gather information necessary to develop improved measures as
well as to evaluate the quality of measures which have been developed. The second
was SERVQUAL Instrument revealed by Parasuraman et al. (1988) that was based
on perceptions – Expectations which is known as a disconfirmation Paradigm.

34
Figure 2.2: suggested procedure for developing a better measurement
Recommended
coefficients or Techniques
Source: Churchill (1979, p.66)
Literature search
Literature search
Experience survey
Insight stimulating examples
Critical incidents
Focus groups
Coefficient alpha
Factor analysis
Coefficient alpha
Split- half reliability
Average and other statistics
Summarizing distribution of
scores
Multitrait-Multimethod Matrix
Criterion validity
11111 1.
4.
5.
6.
7.
8.
Specify domain of construct
Generate sample of items
Collection data
Purify measure
Collect data
Assess reliability
Assess validity
Develop norms
2.
3.
1.
7.

35
Bari et al. (2001) collected data by using both qualitative and quantitative techniques
using probability and non-probability sampling techniques. Their study was focusing
on Turkish customers who travelled with Turkish Airlines. In the qualitative research,
they selected tourists who are customers of ETS (Ersoy Touristic Services). They
undertook in-depth interviews of 50 respondents who were either Turkish or Cypriot.
The outcomes of the exploratory study were used to form a pilot questionnaire. Then
the final questionnaire was driven from the pilot study. 200 customers of ETS travel
agency answered the final questionnaire.
According to Bari et al. (2001) there are two basic approaches to develop a
hypothesis. The first of these is a classical approach which requires a concept to be
applied to observed data and, the second is a grounded approach which uses
observed data to form a concept. In other words, the concept driven approach or data
driven approach becomes the central dichotomy of academic theory. The former
assesses the validity of an already established concept while the latter perceives
there to be no existing concept, but hypotheses are developed following analysis.
Bari et al. (2001) illustrated that the concept is developed according to the collected
data and the hypothesis related to this concept is improved in their study process.
Then the improved hypothesis was tested in their research process as well using
collected data.
In developing the AIRQUAL scale, they used a grounded approach and applied the
method of Parasuraman et al. (1988) directly. Parasuraman et al. (1988) have used
the sequence of steps suggested by Churchill (1979). Moreover they suggested
applying 11 steps in developing SERQUAL scale. Among these steps, the first three
steps describes the generation of the scale items. Steps 4 to 9 present the data
36
collection and scale purification procedures. Step 10 provides an evaluation of the
scale’s reliability and factor structure. Step 11 deals with the assessment of validity
of the scale. Bari et al. (2001) followed the same steps of procedure however due to
the time limitation they just used 6 steps only (see Figure 2.3) and they suggested
that those were enough to fulfil the requirements in order to develop new scale.
For developing a multiple-items scale for measuring customer perceptions about
service quality, Parasuraman et al. (1988) suggested that there should be two stages
for data collection and refinement. On the other hand, Bari et al. (2001)'s investigation
was focusing on two distinct areas. First, by considering the instrument by retaining
those items capable of discriminating well across respondents having differing quality
perceptions about firms in several categories. Secondly it was used to examine the
dimensionality of the scale and establishing the reliability of components. However
the second stage of Parasurman’s suggestion was not included in their research as
well as they recommended further research to test the second stage of AIRQUAL
which is primarily confirmatory in nature and involves re-evaluating the condensed
scale’s dimensionality and reliability by analysing data from some independent
samples.

37
Figure 2.3: Summary of steps employed in developing the AIRQUAL scale
Source: Bari et al. (2001, p69)
Step 2: interviewing from ETS travel agency customers, collection of similar
statements, and identification of 5 dimensions making up the domain of
service quality construct
Step 1: Definitions of service quality, customer satisfaction, and repurchase
intension
Step 4: Collection of the perceptions data from a sample of 200 respondents,
each of whom was a current or recent user of the Cyprus Turkish Airlines.
Step 3: Generation of 38 items representing the 5 dimensions
Computation of coefficient alpha for 38 items and each dimension
Deletion of items whose item-to-total correlations were low and whose removal increased coefficient alpha
Factor analysis to verify the dimensionality of
the overall scale
Reassignment of items and restructuring of
dimensions where necessary
Step 6: Identification of 30 items representing 5 dimensions
38
Nevertheless, the multiple items of AIRQUAL has good reliability and validity in
measuring airline service quality which service providers can use to better
understand the service expectations and perceptions of customers. As a result, it will
enable them to improve their service performance levels. However, these results do
illustrate that this scale needs to be refined in the second stage as well as analysis
of the questions in detail to ensure those wording/statements are expected to
measure the related dimensions.
Further research should therefore consider the convergent validity, for example, as it
is a very important issue that means questions should be grouped under
corresponding dimensions as expected after exploratory factor analysis. Cronbach
Alpha values should be reconsidered and values greater than 0.5 should be used for
interpretation. If possible, for more reliable results, probability sampling techniques
should be implemented. Bari et al. (2001) mentioned that they have some limitation
in their study. The first, was being the shortage of time and be difficulty in finding
respondents. So they selected only ETS travel agency customers for their exploratory
study with judgmental sampling. In the final study they also used convenience
sampling to achieve the required respondent number due to time constraint as well.
2.2.4 AIRQUAL model
In measuring airline service quality, researchers have been conscientious in
developing quality dimensions. Research related to investigating the dimensions of
airline service quality remains extensive and ongoing (Alotaibi, 1992; Etherington &
Var, 1984). In light of the available information on air travellers' preferences, research
instrumentation on service quality measures specific to the airline industry were

39
deemed necessary. For this purpose, Bari et al. (2001) came up with an instrument
for measuring service quality in the airline industry, and named it AIRQUAL. The
AIRQUAL scale developed by Bari et al. (2001) has five distinct dimensions, namely,
airline tangibles, terminal tangibles, personnel, empathy, and image. Their study was
conducted in North Cyprus, and they investigated whether AIRQUAL could
successfully measure the service quality of perceptions of airline customers. In the
AIRQUAL instrument these five dimensions inquire various aspects of the airline
product. For example, airline tangibles contain questions related to the interior of
aircraft used by airlines, the quality of catering in the plane, the cleanliness of the
plane’s toilets, the cleanliness of the plane seats, the comfort of the plane seats, and
the quality of air-conditioning in the planes (Bari et al.,2001 ;Ekiz et al., 2006; Nadiri
et al., 2008).
Terminal tangibles, another important dimension of AIRQUAL, contain questions
more related to airports. In this dimension respondents are asked about cleanliness
of the airport toilets, availability of shop in the airport, parking space availability in
airport, size of airport, air-conditioning of the airport, dedicated areas for smokers,
effectiveness of sign age in the airport, availability of trolleys in airport, efficiency of
security control system in airport, employee’s uniforms, and comfort of waiting hall of
the airport (Bari et al., 2001; Ekiz et al., 2006; Nadiri et al., 2008).
The third dimension of AIRQUAL, personnel, was designed to evaluate employees
working in airlines. Questions included in this dimension are about employees’
attitude, knowledge, experience, and level of education, personal care of employees
to everyone, dutifulness of employees, and airlines’ error-free reservations and
ticketing transactions.

40
The fourth dimension of AIRQUAL is “empathy”, which poses questions like;
punctuality of the departures and arrivals, transportation between city and airport,
compensation schemes in case of loss or hazard, care paid to passengers’ luggage,
availability of health personnel during the flights, locations of the airline company
offices, and number of flights to satisfy passengers’ demands (Bari et al, 2001; Ekiz
et al., 2006; Nadiri et al., 2008).
The last dimension of AIRQUAL relevant to airline service quality is image (Bari et
al., 2001; Ekiz et al., 2006; Nadiri et al., 2008). In this dimension questions on
availability of low price ticket offerings, consistency of ticket prices with given service,
and image of the airline company is included (Bari et al., 2001; Ekiz et al., 2006;
Nadiri et al., 2008). Ekiz et al. (2006) and Nadiri et al. (2008) used the AIRQUAL to
investigate whether it could capture customer satisfaction along with some other
constructs (see Figures 2.4; 2.5). Both these studies (Ekiz et al., 2006; Nadiri et al.,
2008) found that better service quality, as measured by AIRQUAL, has statistically
significant impact on customer satisfaction. Nadiri et al. (2008) also found a
significant positive impact of service quality as measured by the AIRQUAL scale on
customer loyalty behavioural aspects; repurchase intentions and word-of-mouth
communication.

41
Figure 2.4: An investigation on the factors influencing passengers’ loyalty in the
North Cyprus national airline.
Note: Airline Tangible (ATANG), Terminal Tangible (TTANG), Personnel (PER), Empathy
(EMP), Image (IMG), Customer Satisfaction (CSAT), Repurchase Intention (RI) and Word of
Mouth (WOM)
Source: Nadiri et al. (2008, p.272)
ATANG
TTANG
PER
IMG
EMP RI
WOM
CSAT

42
Figure 2.5: Perceptions of service quality in North Cyprus National Airline
Note: PSQ = Perception of service quality
Source: Ekiz et al. (2006, p788)
CSAT
IMG
ATAN
G
TTAN
G
PER
EMP
PSQ

43
Further, Huang (2009) used SERVQUAL to see its impact on service value, customer
satisfaction, and to assess the behavioural aspect of customer loyalty. The findings
of Huang (2009) revealed that service quality as measured by SERVQUAL has a
significant positive impact on service value, customer satisfaction, and behavioural
intentions (customer loyalty). These findings are of primary importance to this
research, especially in developing the framework for the study. The unique
contribution of this research would be the use of AIRQUAL (Bari et al.; Ekiz et al.,
2006; Nadiri et al., 2008) instead of SERVQUAL (Parasuraman et al., 1988), this
focuses solely on the experiential nature of service quality as an intangible and
subjective experience.
Based on this wide field of research Han et al. (2008) has developed a model of
customer loyalty. Many antecedents of customer loyalty were used, including, service
quality, trust, and customer satisfaction. Their findings revealed a significant positive
impact of service quality on trust, customer satisfaction, and customer loyalty. It is
worth mentioning that Han et al. (2008) also used items of service quality from
Parasuraman et al. (1988).
In this research, however, AIRQUAL was used to measure the impact of some quality
on customer satisfaction, and customer loyalty. The differences between Han’s,
Huang’s and this model can be clearly understood through the diagrammatic
representation of these models (see Figure 2.6, 2.7, 2.8).
The present study, therefore, take Nadiri et al.’s (2008) study further by incorporating
the both constructs of customer loyalty in the model for airline industry.

44
Based on the above discussion, the following hypotheses was proposed:
H1: Airline service quality has a positive impact on customer satisfaction in the airline
industry
H2: Airline service quality has a positive impact on attitudinal loyalty in the airline
industry
H3: Airline service quality has a positive impact on repurchase intention in the airline
industry
H4: Airline service quality has a positive impact on word of mouth in the airline
industry
H5: Airline service quality has a negative impact on complaining behaviour in the
airline industry

45
Figure 2.6: Service Loyalty “An Integrative Model and Examination across Service
Contexts
Source: Han, X., Kwortnik, R. J., and Wang, C (2008) “A Conceptual Model of Service
Loyalty Determinants”

46
Figure 2.7: The Effect of Airline Service Quality on Passengers’ Behavioural
Intentions Using SERVQUAL Scores: A TAIWAN Case Study
Source: Yu-Kai HUANG (2009) “factors influencing Airline passengers’ Behavioural
Intentions”
47
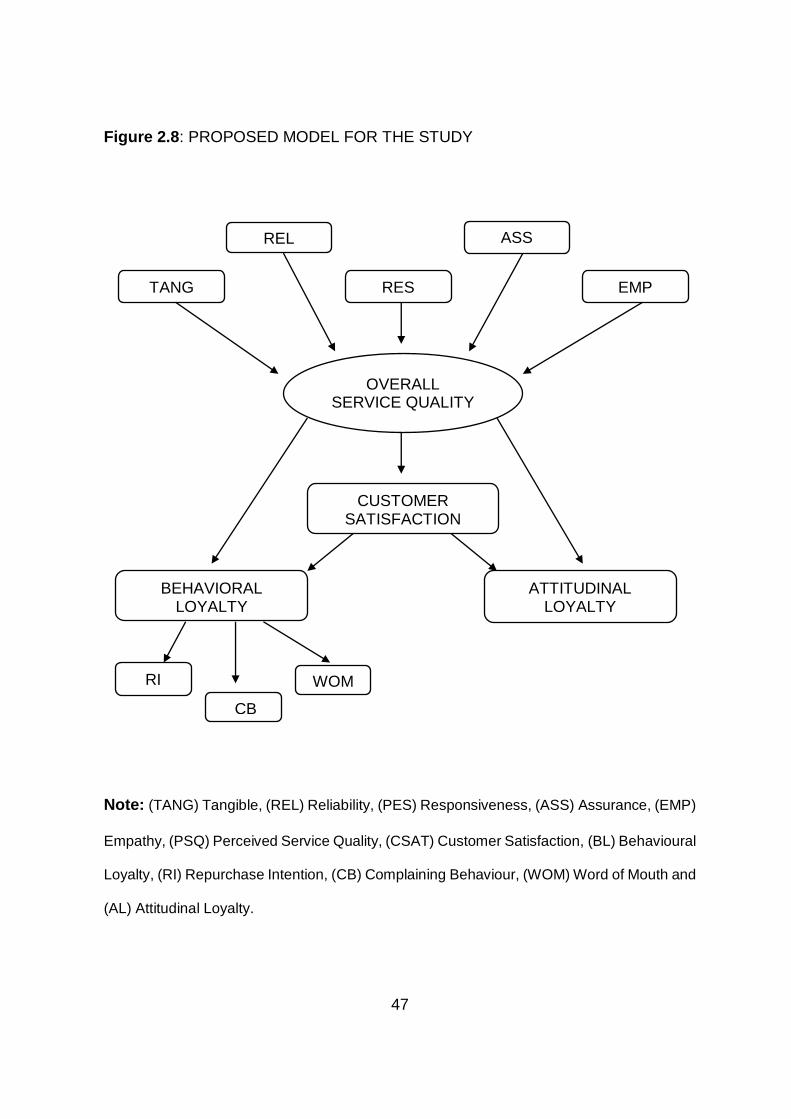
Figure 2.8: PROPOSED MODEL FOR THE STUDY
Note: (TANG) Tangible, (REL) Reliability, (PES) Responsiveness, (ASS) Assurance, (EMP)
Empathy, (PSQ) Perceived Service Quality, (CSAT) Customer Satisfaction, (BL) Behavioural
Loyalty, (RI) Repurchase Intention, (CB) Complaining Behaviour, (WOM) Word of Mouth and
(AL) Attitudinal Loyalty.
ATTITUDINAL LOYALTY
EMP RES TANG
REL ASS
OVERALL SERVICE QUALITY
CUSTOMER SATISFACTION
BEHAVIORAL LOYALTY
RI
CB
WOM

48
2.3 Customer satisfaction
Over recent years marketing researchers have shown an interest in exploring
satisfaction (Heitmann et al., 2007) and, more specifically, customer satisfaction
(Preis, 2003). This is because the concept of satisfaction can be held responsible for
the competitive advantage of an organisation (Anderson et al., 1994; Anderson &
Mittal, 2000; Edvardsson et al., 2000; Fornell, 1992; Hallowell, 1996; Reichheld et
al., 2000; Soderlund & Vilgon, 1999), resulting in the increasing interest of companies
around the world to monitor satisfaction on a continuous basis (Fornell, 1992).
Durvasula et al. (2004) made this factor responsible for the investment of companies
in improving their customer satisfaction. Fornell (1992) also agreed that companies
need to dedicate significant resources for the improvement of customer satisfaction
because satisfaction indicates the general health of the organisation.
Scholars defined satisfaction based on Oliver’s disconfirmation paradigm, which
states that satisfaction is the notion of the consumer comparison between the
expectation and performance (Bloemer & Kasper, 1995). If the consumer is able to
compare between expectation and performance, it is called manifest satisfaction
(Bloemer & Kasper, 1995). However, in some situations it could be quite difficult to
compare or the consumers might not be capable of forming expectations, evaluating
performance, and comparing the two as independent elements. In that situation,
satisfaction is defined as latent satisfaction, which is the result of an implicit
evaluation (Bloemer & Kasper, 1995).
49
The satisfaction response can therefore be broken down into cognitive and affective
components (Durvasula et al., 2004; Homburg & Gierin, 2001; Oliver, 1993;
Szymanski & Henard, 2001; Yu & Dean, 2001).
When a consumer forms pre-consumption expectations by observing the product or
product attribute performance and compares performance with prior expectations,
forming perceptions, and compare those perceptions with expectations, cognitive
satisfaction takes place (Oliver, 1993). On the other hand, the affective component
of satisfaction is based on post-purchase attributes and includes positive effects on
consumption and negative effects on consumption (Yu & Dean, 2001). The cognitive
element also includes equity and attribution; and whereas the former is consumer
perception fair of treatment, the latter is a consumers’ attribute towards favourable
outcomes to themselves, while unfavourable to others (Oliver, 1993).
Yu and Dean (2001) explained the positive effect on consumption as success,
whereas, the negative effect on consumption was determined as failure. These
affects also include emotional components such as happiness, surprise or
disappointment (Yu & Dean, 2001). Strauss and Neuhaus (1997) amend this
assertion noting that one of the major issues in the satisfaction research is that many
researchers concentrate on cognitive elements and do not include the affective
component of satisfaction.
The current literature in marketing highlights the importance of satisfaction in
continuous buyer’s relationship (Oliver, 1980; Hellier et al., 2003; Selnes, 1998). In
this vein Ganesan (1994) found that a retailer’s satisfaction with past outcomes is
significantly related to the retailer’s long-term orientation. Similarly, in a retail sales
setting, Swan and Trawick (1981) found that satisfaction determines a customer’s

50
anticipation of future behaviour to patronise a retail store. Further Ping (1993) found
that satisfaction is positively associated with re-purchase intentions in a service
setting. Many scholars researched on the impact of customer satisfaction on
customer loyalty in different settings. For example, Patterson and Spreng (1997) and
Patterson et al. (1997) found a positive relationship between satisfaction and re-
purchase intentions in a consulting firm, Cronin and Taylor (1992) found a positive
relationship between customer satisfaction and customer loyalty in four different
service industries, and Taylor and Baker (1994) reported a positive relationship
between customer satisfaction and loyalty in a long distance communication context.
After an extensive review of literature, two main schools of thought can be evidenced
regarding the causal relationship between satisfaction and loyalty. The first view
considers satisfaction as the main driver of customer loyalty (Cronin et al., 2000;
Dixon et al., 2005; Fornell, 1992; Genzi & Pelloni, 2004; Hallowell, 1996; Heitmann
et al., 2007; Mittal & Kamakura, 2001; Olsen, 2007; Szymanski & Henard, 2001;
Zeithaml et al., 1996). This group of scholars think that satisfaction positively affects
loyalty, willingness to recommend, and word of mouth. Satisfaction affects future
customer’s choices, which in turn leads to improved customer’s retention and
ultimately these customers want to, continue their relationship and stay loyal to the
company because they are satisfied (Heitmann et al., 2007).
The second view considers that customer satisfaction may positively influence
customer loyalty but it is not sufficient to form loyalty itself (Auh & Johnson, 2005;
Balabanis et al., 2006; Johnson et al., 2001; Julander et al., 2003; Kim et al., 2004;
Oliver, 1999; Olsen & Johnson, 2003; Olsen, 2007; Reichheld et al., 2000; Suh & Yi,
2006). According to these scholars satisfaction does not universally translate into

51
loyalty and the direct effect of satisfaction on loyalty varies among industries (Olsen,
2007). It is reported by many researchers (Reichheld et al., 2000; Suh & Yi, 2006)
that a loyal satisfied customer is still vulnerable to situational factors such as
competitors’ coupons or price cuts. As such, satisfaction is not likely to be the sole
and reliable predictor of loyalty.
The relationship between customer satisfaction and customer loyalty is by no means
straightforward. It is strongly influenced by the characteristics of the customer such
as variety seeking, age, and income (Homburg & Gierin, 2001). Oliver (1999) agreed
to the complexity of satisfaction-loyalty relationship and demonstrates that loyalty can
totally encompass satisfaction or satisfaction and loyalty can overlap or satisfaction
does not transform to loyalty and can exist without it. However, overall researchers
agree that when customers are completely satisfied, they are less likely to defect or
switch, which makes them loyal to the company (Strauss & Neuhaus, 1997).
Based on the above discussion on the relationship between customer satisfaction
and customer loyalty, the following propositions was suggested:
H6: Customer satisfaction has a positive impact on attitudinal loyalty in the airline
industry
H7: Customer satisfaction has a positive impact on repurchase intention in the airline
industry
H8: Customer satisfaction has a positive impact on word of mouth in the airline
industry
H9: Customer satisfaction has a negative impact on complaining behaviour in the
airline industry

52
2.4 Customer loyalty
The concept of customer loyalty has been developed gradually over a number of
years by a wide range of scholars and academics. In the earlier years, the focus of
loyalty was brand loyalty with regard to tangible goods (Tucker, 1964; Day, 1969).
Cunningham (1956) defined it as the proportion of purchases of a household devoted
to the brand it purchase most often. Similarly, Oliver (1999, p. 34) defined customer
loyalty as, “a deeply held commitment to re-buy or re-patronise a preferred
product/service consistently in the future, thereby causing repetitive same-brand or
same brand-set purchasing, despite situational influences and marketing efforts
having the potential to cause switching behaviour”. Early perceptions therefore
centred on loyalty as a firm concept, upon which the product/service could rely.
It is further argued by Oliver (1999) that none of the definitions of loyalty included all
three components of cognition, affect, and behavioural intention. For example, some
scholars (see Cronin & Taylor, 1992) focused exclusively on repurchase intentions,
while others (see Boulding et al., 1993) measured it using repurchase intentions and
willingness to recommend. In a similar manner, Zeithaml et al. (1996) argued that
price sensitivity and price-increase tolerance were also often excluded in previous
research.
The review of extant literature, however, brought up two main dimensions of
customer loyalty, namely, the behavioural dimension, and the attitudinal dimension
(Kandampully & Suhartanto, 2000; Julander et al., 1997). The behavioural dimension
refers to a customer’s behaviour on repeat purchases, indicating a preference for a
brand or a service over time (Bowen & Shoemaker, 1998), whereas, the attitudinal
dimension refers to a customer’s intention to repurchase and recommend, which is

53
considered a good indicator of customer loyalty by researchers (see Getty &
Thompson, 1994). Oliver (1993) considered behavioural intentions as a post-
purchase activity that customers engage in after the services encounter. Zeithaml et
al. (1996) propose a model to measure the consequences of behavioural intentions,
where it is considered a multi-dimensional concept, consisting of word of mouth
communication, repurchase intentions, price sensitivity and complaining behaviour.
Zeithaml (2000) explained customers’ repurchase intentions as an activity that occurs
after purchasing goods or services from an organisation. It indicates that a customer
has been retained by the organisation which is proved empirically by many scholars
to have a strong impact on profits (Bloemer et al., 1998; Reichheld, 1996; Reichheld
& Sasser, 1990). Repurchase intentions are also reported to have an impact on
organisational growth through increased purchases, willingness to pay higher prices,
reduction in marketing costs and less vulnerability to competitive offerings (Anderson
et al., 1994; Fornell, 1992; Reichheld & Sasser, 1990). Another important measure
of behavioural intentions is customers’ willingness to recommend (Boulding et al.,
1993).
According to Zeithaml et al. (1996), favourable word of mouth depicts a customers’
willingness to recommend. Organisations profit from this behaviour because
customers talk about their favourable perceptions of service quality with friends,
family, co-workers and reference groups, strongly influencing other customers to
conduct business with the organisation (Reichheld, 1996; Reichheld & Sasser, 1990;
Susskind, 2002; Zeithaml et al., 1996). Word of mouth communications can be
positive or negative, with each proving to influence other people’s behaviour
(Susskind, 2002). With regard to behavioural intentions, Alexandris et al. (2002)

54
argued that it is an accurate predictor of actually behaviour and may be favourable
or unfavourable depending on the satisfaction with service quality. Favourable
behavioural intentions include willingness to recommend, intention to pay a premium
price, and intention to continue to purchase from the organisation in the future (Rust
& Zahorik, 1993).
Zeithaml et al. (1996) considered favourable behavioural intentions an action of
loyalty. Customers who express favourable behavioural intentions indicate that they
have formed a bond with the organisation (Zeithaml et al., 1996). In contrast,
unfavourable behavioural intentions, based on the perception of poor quality of
service may include intent to defect, intent to spend less money with the organisation,
intent to complain, and even the intent to take action (Parasuraman et al., 1994;
Zeithaml, 2000). The extent to which this bond impacts upon the reputation of the
firm again reflects the subjective nature of the intention to defect is when customers
seek alternatives and avoid the organisation’s product or service. Arnould et al.
(2004) explained that the possible reason for customers to choose to defect rather
than complain is to avoid the possibility of an unpleasant confrontation. Another
unfavourable behavioural intention might be when customers intend to complain. It
may take several forms, including negative word of mouth to the organisation, to other
customers, and to third parties (Arnould et al., 2004). Finally, customers may also
express themselves through actions other than defecting or complaining. For
example, acts of resistance such as picketing, seeking legal action, creating
disgruntled web sites, and a myriad of other resistance behaviours (Arnould et al.,
2004).
55
Jacoby (1971) conducted extensive literature review on the topic and confirmed that
previous studies have focused primarily on behavioural outcomes and ignored
consideration of what went on in customers’ minds. Jacoby and Chesnut (1978)
further concluded that loyalty was simply measured in terms of its outcome
characteristics, for example, determining the sequence of purchase (Tucker, 1964;
McConnell, 1968; Lawrence, 1969), proportion of a given brand purchase, and
probability of purchase (Maffei, 1960; Frank, 1962). However, recent researchers
(Alexandris et al., 2002; Zeithaml et al., 1996) have demonstrated empirical evidence
for the usefulness of predicting customer loyalty for organisational success.
Organisational success and increased profitability are the outcomes of loyalty (Hong
& Goo, 2004; Johnson et al., 2001). Loyal customers exhibit favourable behavioural
intentions such as the intention to return and repurchase and the intention to
recommend (Arnould et al., 2004). However, Gremler and Brown (1998), and Cronin
and Taylor (1992) argued that for customers to be loyal, customer satisfaction and
service quality are the prerequisites. Danaher and Mattsson (1998) also agreed that
high customer satisfaction and service quality result in higher customer loyalty and
willingness to recommend the service to others. Bitner (1990) confirmed that the word
of mouth becomes more positive as satisfaction increase. In a similar manner, Barnes
(1997) added closer relationship of customer with a service employee to the list of
prerequisites of customer loyalty and increased profitability, as customer-employee
relationship present higher share of business and greater share of customer’s wallet
(Barnes, 1997).
Prior studies on customer loyalty have focused primarily on product-related or brand-
related loyalty whereas research on customer loyalty to service organisation has
56
remained limited (Gremler & Brown, 1998). Many scholars (Berry, 1983; Crosby et
al., 1990; Dick & Basu, 1994; Zeithaml, 1981) concluded that the finding in the field
of product loyalty cannot be generalised to service loyalty because of the many
reasons. For example, person to person interactions is an inevitable element in the
marketing of services (Suprenant & Solomon, 1987; Crosby et al., 1990; Czepiel,
1990), hence service loyalty is more dependent on the development of interpersonal
relationship as opposed to loyalty of tangible products (Berry, 1983). Further, the
influence of perceived risk is greater in the case of services, as customer loyalty may
act as a barrier to customer switching behaviour (Zeithaml, 1981; Klemperer, 1987).
And, finally, it is also evident that in the service context, intangible attributes such as
reliability and confidence may play a major role in building or maintain loyalty (Dick &
Basu, 1994).
The relationship between customer loyalty and customer satisfaction has been
investigated by many researchers (Coner & Gungor, 2002; Cronin & Taylor, 1992,
1994; Dabholkar et al., 2000). Cronin and Taylor (1992) found purchase intentions,
an important dimension of customer loyalty, to be significantly affected by customer
satisfaction. Getty and Thompson (1994) reported that in the lodging experience the
customer’s intentions to recommend depend on their perception of both their
satisfaction and service quality. Further, Kandampully and Suhartanto (2000)
concluded that there is a positive relationship between customer loyalty and customer
satisfaction. Cronin and Taylor (1992) examined the causal relationship among
service quality, customer satisfaction, and purchase intention (a dimension of
customer loyalty). Each variable was measured by one time in their research. There
were 660 usable questionnaire randomly collected from customers of four different

57
types of businesses including, banking, pest control, dry cleaning, and fast food. The
results of correlation analysis have suggested that: a) service quality was an
antecedent of customer satisfaction, b) service quality had less effect on purchase
intentions than did customer satisfaction, and c) customer purchase intentions
(customer loyalty) was significantly affected by customer satisfaction. Similar results
were found by Dabholkar et al. (2000) where customer satisfaction strongly mediated
the effect of service quality on behavioural intentions and the results of regression
analysis in structural equation modelling supported their proposition that behavioural
intentions (customer loyalty) was strongly affected by customer satisfaction
compared to service quality (Dabholkar et al., 2000)

58
CHAPTER 3
Research methodology
This chapter will provide a methodological overview of the approaches taken to
analyse the three key research questions of this study. These are as follows:
1. Confirmation, assessment and validation of AIRQUAL scale that is based on
stage-two of Parasuraman et al. (1988);
2. Development of an improved and validated AIRQUAL model; and
3. Application of an improved AIRQUAL scale to a new market, i.e., the Saudi
market.
This chapter will discuss why the techniques and methods used were selected. The
academic theory behind the selection of the research design will be assessed, and a
number of approaches to data collection will be explored, in order to produce the most
robust conclusions. Furthermore, this study will also develop a specific research
instrument, used for the final evaluation and assessment of the hypothesised model
that will be explicated in detail.
Specifically, this chapter analyses the potential of both qualitative and quantitative
research methods used in the study, along with the data collection techniques utilised
in both approaches. The target population, merits of the selected sampling design and
determination of requisite sample size will also be described. Finally the means of
codifying a mixed methodological approach of both qualitative and quantitative data
will be explored and established. This demonstrates a particular focus on the analysis
of quantitative data and its numerous descriptive approaches such as data screening,
factor analysis and validity testing.

59
3.1 Methodological approach
This research adopts a mixed methodological approach, focussed on refining a quality
scale for airline service based on consumer perceptions of value. Creswell (2007, P.5)
defined a mixed method of study as “a method, which focuses on collecting, analysing,
and mixing both quantitative and qualitative data in a single study or a series of
studies”.
Precisely regarding this study, qualitative techniques such as the use of focus groups
were employed. The primary purpose of the focus group is to test and screen the
original AIRQUAL dimensions of; airline tangible, terminal tangible, personnel,
empathy and image, and from there determine the extent to which these coded
definitions reflect the respondents’ data. The screening process throughout the focus
group explored the extent to which respondents understood these dimensions, and
assessed whether respondents could distinguish between the attributes of the original
AIRQUAL dimensions. The result of the focus group was used to confirm the survey
instrument.
The present study embarked on the following steps:
1. Qualitative data collection
2. Qualitative data analysis
3. Qualitative findings
4. Qualification/ confirmation of the instrument
5. Quantitative data collection
6. Quantitative analysis; and
7. Overall results and interpretation

60
In the initial stage of the qualitative study a number of exploratory analyses were
considered; as these are more convenient for the understanding of the issues that
affect airline service quality. Qualitative methods are necessary in this case as they
can help to define the scope of certain phenomena, such as 'airline quality', to provide
it with a sound metric based upon which quantitative research can be conducted. This
quantitative research will then explore the relationship between these robust variables
determined through the qualitative study.
3.2 Research design
A detailed research design is central to conducting responsible, robust research. It
requires making decisions regarding the purpose of the study, the location of the study,
the type of study, the extent to which the researcher manipulates and controls the
study, the temporal aspects of the study and the level of which the data is analysed
(Sekaran, 2003). According to McDaniel and Gates (1999), a research design is a plan
for a study that provides specification of procedures to be followed by the researcher
in order to achieve the research objective, as well as, to test the hypotheses. Similarly,
many researchers (e.g., Churchill and Iacabucci, 2005) call it a blueprint for a research
to be followed in order to successfully implement the research. The core purpose of a
research design is to ensure that it clearly answers the research objectives from the
generated data in a confident and convincing manner (De Vaus, 2001).
There are a number of different approaches to research design, including exploratory,
descriptive and causal (Malhotra, 2008), each with different purposes. Exploratory
research, for example, intends to acquire preliminary insights into an ambiguously
defined research problem, which could provide the foundation and direction for a

61
constructive research investigation (Parasuraman, 1991). Descriptive research
focuses more on describing an extant and clearly defined process (Parasuraman,
1991). It also helps in assessing the characteristics of the variables examined in the
study (Sekaran, 2003). Lastly, causal research design is normally applied through
experimentation and is considered the best method to determine cause and effect
outcomes (Churchill and Iacobucci, 2005). This study contains elements of both
exploratory and casual research design. On the one hand it is focussed on attempting
to define a qualitative phenomenon and assessing its impact in practice, and on the
other it is assessing the cause and effect outcomes between good customer service
and competitive advantage.
The present research began with gaining insight into the AIRQUAL instrument by
conducting exploratory research through focus groups. This was followed by
employing quantitative research through airline passenger surveys to corroborate
these findings and attempt to quantify their impact. Both these designs will be
separately explained below.
3.2.1 Justification of exploratory research
Exploratory research is generally employed as an initial step to provide insights and
understanding of the specific phenomena being investigated. It is expected that
interactions among participants will lead to circumstantial insights about airline service
quality that other quantitative or qualitative techniques could not capture. As such,
focus groups were selected as a suitable approach for this study (Blackston, 1995;
Morgan, 1997). This method is considered appropriate in the preliminary stage of the
analyses because it helps the researcher to gain valuable insights and also to identify
and confirm the dimensions underlying the original AIRQUAL scale.
62
When these dimensions are confirmed through focus group analysis, more detailed
research can be conducted into the relationship between these values and the
AIRQUAL scale. A focus group has been defined as a “carefully planned series of
discussions designed to obtain perceptions on a defined area of interest in a
permissive, non-threatening environment” (Krueger and Casey, 2009, p5). Guidelines
and marketing research which govern the responsible formation and utilisation of focus
groups have been followed in this study. Many researchers have suggested that the
focus group is a useful method in exploratory study or in generating new ideas (Flick,
1998; Neuman, 1997). In this investigation, focus groups were used to determine
whether the AIRQUAL survey instrument results in an equal number of dimensions as
proposed by the original author or it varies in number.
The focus group is also considered appropriate because it is intended to check if the
dimensions (and their subsequent items) measure airline service quality or not. For
the first part of this investigation, purposive sampling was used. Initially, in order to
satisfy the requirement of exploratory study, each participant was scanned for his/her
journey at least once in the proceeding twelve months for business or leisure-related
purposes. A discussion guide was followed for each group (see appendix F) in which
each group were digitally recorded, allowing key statements to be produced. By using
key statements transcripts, descriptive coding was solely carried out.
3.2.2 Justification of survey research
The second stage of this research demonstrated the application of a systematic
measure to improve the instrument of analysis. The sequences of eight scale
development steps that are presented by Churchill (1979) were followed (See Figure

63
3.2). Survey research tends to be the most popular method and is generally utilised in
descriptive and causal research designs. It is also considered useful because a
researcher can quickly and conveniently collects large sums of raw data using a
questionnaire. The collation of data from a survey helps to ensure data
standardisation, which facilitates the investigation of specific questions of how, who,
what, why and when (Hair et al., 2010). Given that the main focus of this research is
assessing the validity of the AIRQUAL scale, a target sample of around 500 were
considered sufficient for data analyses purposes based on the 95% confidence level,
where the recommended sample was around 380. It was considered appropriate to
choose more because usually in data cleaning and screen cases are deleted. Further,
selecting an appropriate sample size is also important to address the objectives of the
study. In the present research, as assessment and validation of AIRQUAL scale was
the main objective, through exploratory factor analysis (EFA). Therefore, various
guidelines were kept in mind in the selection of a sample of five hundred. Literature
highlights several guiding rules of thumb with regard to sample size (see Williams et
al., 2010), however, there is a lack of agreement on the appropriateness of a sample
size (Hogarty et al., 2005). For example, some scholars (see Tabachnick, 2007)
recommend a sample size of at least 300, whereas, some others (see Hair et al., 2010)
suggest a size of 100 or more. Lastly, Comrey and Lee’s (1973) guide to sample sizes
consider 100 as poor, 200 as fair, 300 as good, and 500 very good. Considering all
the aforementioned suggestions and recommendations, a sample size of 500 was
finally selected.

64
3.3 Questionnaire development
The development of the questionnaire was based upon the research of Bari et al.
(2001). The instrument was then adapted and checked for its validity during focus
group analyses (the exploratory stage). It was subsequently further tuned to increase
relevance and focus.
The instrument developed was divided into many parts with the first page of the
questionnaire as cover letter that summarised the intention of the research and the
address and affiliation of the researcher. Subsequently, the questionnaire collected
basic information about the respondents, e.g., questions about the frequency of travel,
the purpose of travel, the duration of trip and the class used, etc.
The main section of the questionnaire contained questions relating to the various
dimensions of AIRQUAL. In total, 30 questions were adapted from the previous studies
conducted on service quality. Particularly relevant studies to this aspect of the
research include Parasuraman et al. (1989) and Bari et al. (2001). The 30 items of the
scale were divided into five distinctive factors (Tangible, Reliability, Responsiveness,
Assurance and Empathy). These factors had seven, six, five, five and seven items,
respectively.
The penultimate section of the questionnaire was designed to collect data on
respondents’ level of satisfaction and loyalty. The final section contained questions on
the respondents’ profile. The questionnaire was pre-tested on passengers travelling
with Saudi Airlines at Jeddah International Airport to ensure that the statements are
unambiguous and understood. The main reason of pre-testing the questionnaire on
the passengers (respondents) of Saudi Airlines was because this research intended
final data collection from Jeddah International Airport and from the passengers of

65
Saudi Airlines. It is also important to note that the one of the objectives of the present
study was to test various hypotheses in the Saudi market, that is why, pre-testing and
final data collection was undertaken in The Kingdom of Saudi Arabia. Various tests
were conducted to ensure that the outcomes achieve the aim of this thesis.
3.4 Sampling design process
This section of the methodology examines the target population, and sampling
procedure and the process of determination for the requisite sample size. These
methods are essential for the study as it highlights that the selected respondents and
collected data are appropriate for the present research.
3.4.1 Target population
According to Suki (2005), population refers to a group of people, variables, ideas or
other common characteristics. In terms of research, therefore, the definition is more
complex than it may be universally received, and requires careful analysis of a number
of variables. It includes important elements from which the research may draw
inference, and this can also interfere with the objectivity of the study and resulting data
(Churchill & Iacobucci, 2005).
The main objective of this study is to validate and confirm the AIRQUAL scale and
also to investigate its impact on customer satisfaction and customer loyalty in Saudi
Arabia. The most suitable population of the present study includes all passengers of
Saudi Airlines. However, the study also targeted respondents from the United States,
in which case the second target population was passengers travelling with any airline
in United States. It is important to note that the suitable place considered for collecting

66
data for Saudi was Jeddah International Airport, whereas, in the United States an
online survey was preferred.
3.4.2 Sampling design
There are two types of sampling designs: probability and non-probability sampling
(Malhotra, 2008; Sekaran, 2003). Probability sampling ensures that elements in the
population are selected by some known chance, whereas non-probability sampling
evidences that elements of the population do not have a known chance of being
selected as a subject (Sekaran, 2003).
The selection of a sample from the Saudi population was based on the non-probability
sampling design, more specifically; a convenience sampling technique was used to
select respondents. This method was considered appropriate for the present study. In
order to preserve objectivity and collect data responsibly, a detailed ethical approach
to data collection was followed. Initially the researcher requested permission from the
concerned authorities in Saudi Arabia to collect data in Jeddah International Airport.
When permission was received and the airport staff informed of the study, the
researcher was stationed soon after the immigration counters in the International
arrival terminal of Jeddah International Airport. Once the respondents cleared the
immigration formalities and waited for their luggage to arrive, the researcher requested
for participating in the survey.
All the respondents were selected through convenience sampling, i.e., those freely
available to answer questions. It is also important to note that all the questionnaires
were self-administered via face-to-face approach. This method was deemed

67
appropriate for this study as it eliminates response-error (Lovelock et al., 2004). This
method has many other advantages as well, for example, the availability of the
researcher to screen potential respondents, to clarify the questions to the respondents
in case of any confusion and to encourage interest in the completion of the
questionnaire.
The target population was also airline passengers in the United States. The sample
determination in this part was through purposive sampling technique, where
respondents are selected based on their appropriateness to the study. For this
purpose, a well-established research organisation “Survey Monkey” was
commissioned to collect data. This is a professional organisation that uses online
survey methods to collect relevant data.
3.4.3 Determination of sample size
After the identification of the target population, a relevant sampling design was used
to determine a suitable sample size. This is a crucial factor in determining the results
of the study as it is influenced by a number of factors including cost, time and
availability of resources. Furthermore, the determination of sample size must take into
account statistical accuracy. Luck and Rubin (1987) recommended a larger sample
size for more sophisticated data analysis. In the present research, a sample size of
500 was considered appropriate for the Saudi sample, as explained earlier, whereas,
a sample size of 1000 was needed for the United States sample. The main reason
behind bigger sample size in United States was because of the use of online survey
technique. This technique helps in quickly and conveniently collecting data from a
large group of people compared to face-to-face surveys.

68
3.5 Data analysis
Data analysis is usually not only considered critical to any research but also difficult in
the whole research process. In the present research, as the main motive was to
validate and confirm the AIRQUAL instrument, and then empirically test the new
developed scale on respondents from Saudi Arabia; the data analysis was divided into
two broad categories, i.e., qualitative data and quantitative data. These will be
highlighted separately below:
3.5.1 Qualitative data
Initially, an exploratory stage of qualitative research garnered initially responses from
a focus group. The focus group were completed within the time-frame of around four
weeks in the United Kingdom on April 2012. Firstly, recruitment notices were published
in two newspapers in the cities of Milton Keynes and Bedford. Secondly, the selected
groups were invited for a focus group discussion to Jury’s Inn Hotel in Milton Keynes
and also to the Park Inn Hotel in Bedford. All together four focus groups were
conducted with 6 to 8 members each: one in Milton Keynes and the other three in
Bedford. Of the total four groups, one group consisted of only males and one group
with only females. The remaining two groups had both the genders. Each focus group
discussion lasted for around one hour. The participants in each group were those
people who have travelled by air at least once in the last 12 months. In order to
encourage the selected participants, an invitation email was sent to each member and
an honorarium of twenty pounds was given for their time. All the sessions were audio
recorded for future reference and transcription purposes.

69
3.5.2 Quantitative data
The second phase of this research centred around collating and coding qualitative
data collected from the focus groups, and forming quantitative questionnaires to be
distributed to a far larger sample population. For both the aforementioned samples
(Saudi and US samples), many statistical techniques were used to analyse the
quantitative data. Throughout the analysis SPSS software version 21.0 was used in
order to employ various tests. The detailed description of the analyses is provided
separately below.
3.5.2.1 Descriptive analysis
The main purpose of descriptive analysis is to provide a picture of the characteristics
of respondents along with their profiles. This information is necessary to establish
whether respondents are suitable for study. Standard deviation and frequency
distributions are used to explore data and understand their characteristics (Nor, 2009).
In the present research, data collected from both samples (Saudi and US) was tested
in this way.
3.5.2.2 Data preparation and screening
In any dataset there is potential for missing or invalid responses. In order to avoid the
influence of missing data and invalid responses, it is suggested to screen and clean
the data for further analyses. Many screening and cleaning techniques were used as
per modern academic approaches (Pallant, 2007; Hair et al., 2010). In this case, the
most appropriate were handling the missing data, outliers and issues of normality. For
missing data, the data file in SPSS was checked thoroughly, not only for case-wise
but also item-wise missing values. Frequency tests were also undertaken to check for

70
missing data. In the case of outliers, both univariate and multivariate outliers were
checked. Univariate outliers were checked using skewness and kurtosis, whereas,
multivariate outliers were checked using Mahalanobis D2. Lastly, in the case of
normality, skewness and kurtosis were observed to detect any signs of non-normality.
All these are explained in detail in chapter 5 of this study.
3.5.2.3 Exploratory factor analysis
After preparing the data for extended analyses, the reliability of the overall scale was
tested. This was followed in turn by factor analysis. Factor analysis is an important
technique in order to explore trends in the overall data. It has the capability to reduce
large number of variables in order to smaller sets by grouping them together (Kline,
2011). Correspondingly, the main purpose of applying factor analysis is to determine
the most suitable items from a set of items for a particular construct, in which their
internal consistency has been analysed. Here, the results of factor analyses across
two different sets of data samples were examined against the originally proposed
AIRQUAL scale, and where appropriate, improvements to the scale suggested.
3.5.2.4 Scale validity
After acceptable reliability tests and achieving consistent factor structure, various
validity tests were undertaken. In this case, both content/face validity and construct
validity (which includes: convergent and discriminant validity) were established.
Further, in testing for validity a method Parasuraman et al. (1988) was followed (See
figure 3.1)
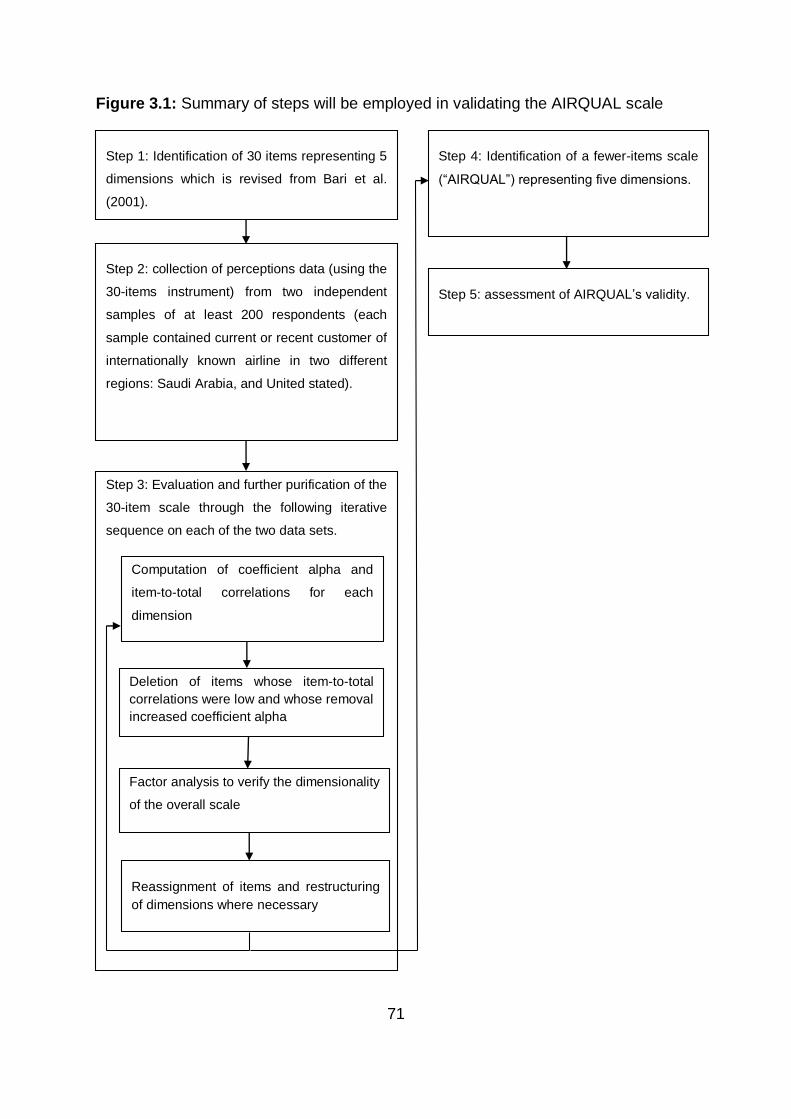
71
Figure 3.1: Summary of steps will be employed in validating the AIRQUAL scale
Step 2: collection of perceptions data (using the
30-items instrument) from two independent
samples of at least 200 respondents (each
sample contained current or recent customer of
internationally known airline in two different
regions: Saudi Arabia, and United stated).
Step 3: Evaluation and further purification of the
30-item scale through the following iterative
sequence on each of the two data sets.
Computation of coefficient alpha and
item-to-total correlations for each
dimension
Deletion of items whose item-to-total
correlations were low and whose removal
increased coefficient alpha
Factor analysis to verify the dimensionality
of the overall scale
Reassignment of items and restructuring
of dimensions where necessary
Step 4: Identification of a fewer-items scale
(“AIRQUAL”) representing five dimensions.
Step 1: Identification of 30 items representing 5
dimensions which is revised from Bari et al.
(2001).
Step 5: assessment of AIRQUAL’s validity.

72
3.5.2.5 Hypotheses testing
One further important objective of the research was accomplished by testing the
proposed model and predicted hypotheses. As explained in the previous chapter
(chapter 2) a number of hypotheses were developed based on the review of the
literature and a model is also proposed. In the present research, hypotheses were
tested using Pearson product-moment and regression analysis.
3.7 Conclusion
This chapter documents various themes to the qualitative and quantitative research
approaches. Specifically, it consisted of a section regarding the research design
employed, data collection methods adopted, development of the instrument and
numerous tests undertaken to achieve the required objectives of the study. It also
highlighted different steps of the statistical techniques employed for verification of the
constructs, as well as, testing of the hypotheses and the subsequent proposed model
of the study.

73
CHAPTER 4
Qualitative study
The methodology developed in chapter 3, is focussed on addressing the core three
research questions highlighted. This mixed- methodological approach examining
attitudes and contributing factors to airline service quality has two phases. The aim
of the qualitative study which used focus groups to determine whether AIRQUAL
survey instrument produces the same number of dimensions or not. Moreover,
focus group analysis was conducted to examine the dimensions of the scale and
whether their subsequent items measured provide an accurate metric for the
assessment of service quality. This chapter codifies the results collated through
this qualitative approach. Initially focus group discussions will be identified, the
structure and role of the moderator will be summarised. Subsequently the
qualitative analysis and findings will be presented.
4.1 Focus Group Discussions
Focus groups have been defined as “carefully planned series of discussions
designed to obtain perceptions on a defined area of interest in a permissive, non-
threatening environment” (Krueger and Casey, 2009, p5). Many researchers have
suggested that focus groups are useful method in exploratory study or in
generating new ideas (Flick, 1998; Neuman, 1997). This study builds upon this
academic consensus, and utilises the research tool of the focus group to shape
the future quantitative research. In order to achieve this, all interviews were

74
completed with a time-scale of four weeks and were held in United Kingdom. This
does not impact upon the validity of the results in this stage, as the purpose of the
study is to assess the extent to which universal notions of service quality exist.
4.1.1 Recruitment of Focus Group participants
Recruitment notices were posted in two local newspapers in United Kingdom.
These included a Milton Keynes newspaper and the Bedfordshire on Sunday
newspaper. From respondents to these adverts, selected groups were invited for
a focus group discussion to Jury Inn Hotel in Milton Keynes and also to Park Inn
Hotel in Bedford town. (See appendix D, D1, and D2). Because the notice was
placed for the respondents who have travelled during the last twelve months, the
recruitment process was difficult to find adequate participants for the focus group.
Some of the participants withdrew since there was lack of funds for the research
process. The sampling method used is purposive sampling. The main aim of
purposive sampling is to focus on particular characteristics of the participants
selected for the focus group discussion, which will help to answer the research
questions. Four focus group discussions were held. In order to assert consistency
and full participation, the participants were selected from various demographic
profiles and were varied in ages and gender. Many studies have suggested that
more participants results in less interaction during the session and that the reverse
is also true. To encourage public participation, an invitation letter was sent by email
to each participant as well as remuneration was given for their time (see appendix
E). Each focus group lasted for around an hour. Of the total, one focus group

75
discussions involved only female participants and it was conducted on the 24th
April 2012. The second focus group discussions were male-only participants and
it was performed on the 26th April 2012. The last two focus group discussions were
mixed gender and it was carried out on 1st May 2012 and 8th May 2012. Each
focus group had between 6 and 8 participants. See Table 4.1
The focus group moderator invited participants to talk about positive and negative
experiences with airline services in order to ensure balanced opinions. Incidents
that might be connected to potential future consumer behaviour, such as changing
carrier or demonstrating loyalty were taken into account.

76
Table 4.1: Focus Group interviewees
4.1.2 Focus Group Structure
Discussions in each focus group were guided by a logical sequence of
standardized structure. This structure provided a guide to the discussions within
each focus group and facilitated the ideas. The guide was provided by Krueger
and Casey, 2000. (See Appendix F)
The discussion guide was divided into three sections and discussions in each
focus group are based on the three distinct areas descried. The first section was
a 5 minute introductory lecture which explained the aim of the focus group, and
stimulated discussion. The Introduction notes that the comments in the focus group
are confidential. The moderator encouraged the participants to stay until the end
of the discussion. Open-ended questions were used throughout the discussion and
0 1 2 3 4 5 6 7 8
Session 1
session 2
session 3
session 4
Female
Male

77
all of the questions asked were clearly related air travel matters. Unstructured and
open discussions were undertaken in all focus groups, although certain topic was
applied to keep the conversation on track.
The moderator subsequently explained his role and encouraged participants to
interact amongst themselves. Each participant had to sign a permission form
before the discussion started (meeting ethical approval standards). The
participants also gave permission for digital recording of the focus group
discussion (see Appendix G). The moderator informed the participants that the
discussion forms part of an academic research project for his PhD.
The second part lasted roughly 50 minutes and entailed questions about quality of
airline service. For this second part a number of general introductory questions
asked, where the participants evaluated the qualities they think are necessary to
make a successful airline. The transition questions put to the participants
examined their responses to their previous experience of travel with an airline
provider and what were their first impressions. The Key Questions asked the
participants how they felt about the quality of service of the airline (see Appendix
F).
The third part of the focus group discussion is the closing or ending questions
about airline service quality. These assess both the consumer views of airline
quality. In this section the moderator asked the participants the advice they would
give to airline providers if they had a chance. In addition, the moderator asked
participants for advice on how to improve the airline service quality. The moderator
asked the participants if there is anything that they would add about airline service

78
quality if they were given chance. The moderator thanked the participants for their
valuable contribution (see Appendix F).
4.1.3 Role of Moderator
In order to facilitate focus group discussion and encourage interaction among the
participants, the moderator performed a significant role. After each participant had
stated their opinion, the moderator asked probing questions for instance: ‘Can you
give me an example?’; ‘I am not quite sure about that: what do you mean?’; ‘Does
anybody have something similar?’ (Participant x) – how do you respond to that
claim?’ The aim of asking probing questions is to clarify the responses as well as
reducing any ambiguity and subjective interpretation of data during analysis.
During the focus group discussions, the moderator ensured that every participant
had received an equal chance to share his or her opinions. The moderator also
asked participants that did not engage into the conversations if they agreed or
disagreed with other participants’ views. For instance, ‘I have not heard from you
in a while: have you experienced something similar to (participant x)’? According
to Ritchie and Lewis (2003), non-response and silent participants did not
necessarily mean that the issue they are participating on was irrelevant or
unimportant. All volunteers in the focus group discussions were eligible to
participate, as they had satisfied the established conditions for the research.
The moderator encouraged discussions about positive and negative aspects of
airline service quality to ensure balanced views were being presented to the
79
groups. Krueger and Casey (2009), illustrates that obtaining balanced views was
important because each participant’s responses influenced other participants’
views and the dynamics of the group, as noted above in 4.2.2.
4.2 Qualitative Data Analysis
Each focus group discussion was digitally recorded and the key elements and
statements were transcribed. The aim of summarised transcription is to determine
whether AIRQUAL instrument results in equal number of dimension as proposed
by the original author or it varies in number. Moreover, it is to check if the
dimensions and subsequent items measure the airline service quality.
A process of descriptive coding was used in the analysis of the qualitative data.
This permits the researcher to place ideas from each transcript into the original
categories. Initially, the eight distinguished dimensions among AIRQUAL and
SERVQUAL scale was manually created into Excel sheet (tangibles, reliability,
responsiveness, assurance, empathy, terminal tangibles, personnel, and image).
Each dimension has its own questions and therefore each question is made up of
key words in order to facilitate the allocation process and tested. The output of
each focus group’s discussions was analysed based on systematic approaches.
This process involves reading the ideas for each focus group discussions and
assigning a keyword or phrase for each comment in order to categorise themes
within text and also allocated the subsequent items to its dimension. The examples
of these descriptive categories are: tangibles (safety standard, in-flight
80
entertainment, food and drink); reliability (handling luggage, accuracy, delivering a
promised); responsiveness (free to response, willing to help, and prompt service);
assurance (courteous, knowledge); empathy (compensated for any damages,
caring).
The overall ideas that emerged from the four focus group discussions were 302
items. Each focus group was coded and assigned its items separately to
appropriate dimensions in accordance with the key word of the original questions.
The coded key word technique permits for more accuracy in allocation of items.
Then all the ideas was created in overall sheet to illuminate on the entire
information.
4.3 Qualitative Data Finding
It was discovered that some new information emerged from the focus groups that
led to a revision to existing AIRQUAL scale. As a result, the terminal tangible
(TTANG) label with its items was deleted because insight from exploratory study
with regard to this dimension shows that airline had no control the terminal service
quality. The examples of these statements are:
the car park is not about airline they cannot control that
airline and airport need to work together
we are not talking about the airport, are we

81
Moreover, the image (IMG) label was also removed because many members
illustrate that “you get what you paid for” which is more related to service value.
The examples of these statements are:
Value for money
you get what you pay for
Zeitham (1988, p. 14) defined perceived service value as “consumers’ overall
assessment of service utility based on perception of what is received and what is
given”.
This stage reveals overlapping among the two set of scale which needs further
refinement. The empathy factor was merged together.
The personnel factor was distributed among other labels based on the
Parasurman’s definition of these labels:
Tangibles: Physical facilities, equipment, and appearance of personnel.
Reliability: Ability to perform the promised service dependably and accurately.
Responsiveness: Willingness to help customers and provide prompt service.
Assurance: Knowledge and courtesy of employees and their ability to inspire trust
and confidence.
Empathy: Caring, individualized attention the firm provides its customers.

82
In fact, the final stage was to present fewer statements by reduction of the similar
information. This step resulted in 5 dimensions and 30 items of the AIRQUAL scale
which was ready for pre-test. (See appendix H)
4.4 Conclusion
The qualitative data provided by the focus groups therefore had a profound impact
in shaping the future quantitative research. This study provided a sound theoretical
basis for quantitative study of service quality by establishing a number of potential
coded categories that constitute contributing factors of 'quality', The four focus
group sessions have provided an invaluable qualitative insight into both the
constituent factors of service quality, and the methodological positives and
negatives of the AIRQUAL instrument. The process of reduction of the AIRQUAL
scale is unique to this study. The robust qualitative nature of this revision of the
existing model will necessarily lead to a more streamlined understanding of the
issues which affect service quality from the consumer, rather than the academic or
the business, perspective. Without TTANG or IMG labels, the model will
necessarily present a clearer reading of fewer factors which reflect and influence
of quality from the perspective of the consumer in a more tangible way. This step
has been taken as the qualitative evidence that has been corroborated to find this
reflective from four different, independent focus groups.

83
CHAPTER 5
Quantitative appraisal of AIRQUAL scale
In the previous chapter, the exploratory research was conducted to refine the
AIRQUAL instrument which measures airline service quality. The outcomes of the
qualitative study have be used to design the second, quantitative stage of the
research. This chapter commences with descriptive analysis of the pre-testing.
This is followed by the description of data preparation and screening steps for the
analysis which involve procedures such as the treatment of missing data, detection
of outliers and normality, followed by detailed descriptive analysis of the two
samples of this research, namely, Kingdom of Saudi Arabia and United States.
Descriptive analysis is deemed necessary in order to assist the research in
understanding the characteristics of the respondents pertaining to the phenomena
that are currently being studied. The next stage concentrates on employing
reliability tests for the two samples of the study. This step is vital as it helps to
establish the strength of the developed scale. Another step considered important
was the exploratory factor analysis. In the present study, exploratory factor
analysis (hereafter, EFA) was undertaken in order to explore the dimensions in
both the datasets, and also to find out if the items fall under the extracted
dimensions as expected. After EFA, the extract dimension was tested for reliability
individually, followed by validity tests. Lastly, this chapter will highlight the result of
hypotheses testing.

84
5.1 Pre-testing
Pre-testing is a necessary aid for constructing a good questionnaire that provides
a genuine test before the full-scale data collection is carried out (Churchill and
Iacobucci, 2005). Pre-testing helps the researcher to improve many serious
problems of the questionnaire such as item wording, sequencing and the flow.
Riley et al. (2000) highlighted that pre-testing is perceived as the best safety net.
For this study, a pilot survey was conducted before undertaking full-fledged data
collection. For this purpose a sample of 82 Saudi Airlines passengers of various
international flights were selected at Jeddah International Airport during the period
of 15th January 2013 to 10th February 2013. The main purpose of this study was
to refine the scale and to establish face validity. A self-administered questionnaire
was handed over to the selected respondents at the airport, in person.
5.1.1 Descriptive analysis
The self-administered questionnaire used in the pilot study (see Appendix I)
contained 5 sections with a total of 55 questions. Of the total 55 questions, 9
questions were about airline usage, 30 questions about perception of service
quality, 6 questions regarding overall service quality, customer satisfaction and
customer loyalty, 5 questions were about attitude, and 5 questions were about the
demographics. As mentioned earlier, a total of 82 respondents were contacted for
the pilot study. 72 respondents were considered as valid cases. Of the total,
majority (63 or 87.5%) were male respondents, indicating the main influence of this
85
group on the survey. Only two female respondents completed the questionnaire,
whereas, seven respondents did not complete this question. Therefore, it was
considered as missing, accumulating a total of 9.7%. The significantly lower
response from female respondents is due to the cultural diversity of the Kingdom
of Saudi Arabia, where females are reluctant to participate in these kind of face-
to-face surveys.
Another important demographic variable was the age of respondents. Around a
third (29.2%) of the respondents fall under the age bracket of 35 – 44, followed by
25 – 34 with a total of 27.8% contribution in the survey. Further, respondents were
asked to reply on the place they live, most of them (52.8%) were from Asia,
indicating a major influence of this region’s respondents on the survey. With regard
to education, the majority (48.6%) had at least a bachelor’s degree. The second
highest response in terms of education was from those holding a graduate degree,
with a total of 22.2% contribution in the survey. Respondents were also requested
to indicate their occupation. The results revealed that 19.4% of the cases selected
“other management” as well as, “senior management” with 19.4% of the total
response. A detailed breakthrough of the demographic profile of the respondents
is given in Table 5.1.
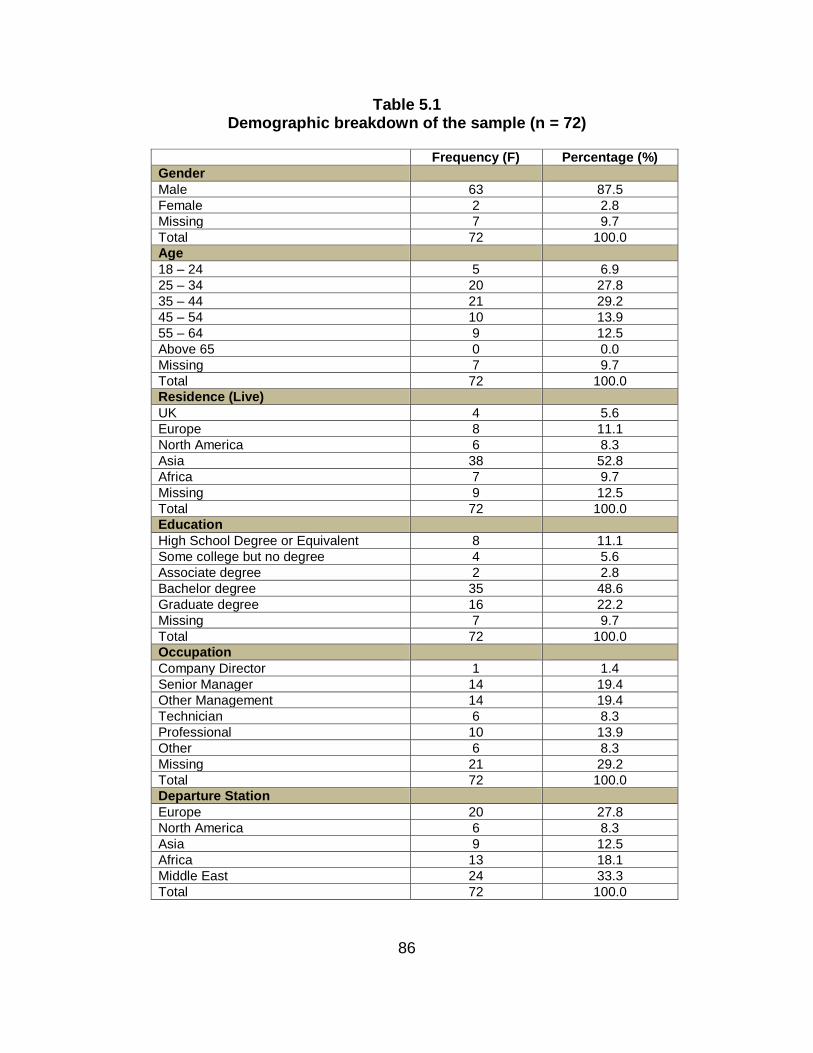
86
Table 5.1 Demographic breakdown of the sample (n = 72)
Frequency (F) Percentage (%)
Gender
Male 63 87.5
Female 2 2.8
Missing 7 9.7
Total 72 100.0
Age
18 – 24 5 6.9
25 – 34 20 27.8
35 – 44 21 29.2
45 – 54 10 13.9
55 – 64 9 12.5
Above 65 0 0.0
Missing 7 9.7
Total 72 100.0
Residence (Live)
UK 4 5.6
Europe 8 11.1
North America 6 8.3
Asia 38 52.8
Africa 7 9.7
Missing 9 12.5
Total 72 100.0
Education
High School Degree or Equivalent 8 11.1
Some college but no degree 4 5.6
Associate degree 2 2.8
Bachelor degree 35 48.6
Graduate degree 16 22.2
Missing 7 9.7
Total 72 100.0
Occupation
Company Director 1 1.4
Senior Manager 14 19.4
Other Management 14 19.4
Technician 6 8.3
Professional 10 13.9
Other 6 8.3
Missing 21 29.2
Total 72 100.0
Departure Station
Europe 20 27.8
North America 6 8.3
Asia 9 12.5
Africa 13 18.1
Middle East 24 33.3
Total 72 100.0

87
It is also important to mention that during the pilot survey, respondents’
suggestions were also incorporated in the study. In this case, one extra question
regarding the “extra free baggage” was added and coded as question number 9 of
this final survey instrument. Lastly, question number 3 of the instrument, which
was about the residence (live) of the respondents, was divided into “Middle East
and Asia” in the final survey.
5.1.2 Reliability test
Before proceeding with further analysis, the reliability testing was conducted in
order to ensure consistent measurement across various items in the questionnaire.
Indeed, the reliability of a measure indicates stability and consistency of the
instrument (Sekaran, 2003). Consequently, this method determines reliability
through examining the internal consistency of the research instrument such as
questions (items) in the questionnaire, which are normally presented. Cronbach’s
Alpha is one of the most frequently used metrics to measure a scale’s reliability, in
which its index ranges from 0.0 to 1.0. Researchers should target a value closer
to 1.0, as Alpha value proves that the instrument of the study is strong and
consistent. However, it’s important to note that in social sciences the threshold
value of 0.7 is considered acceptable (Nunnally, 1978).
In the pilot study, a Cronbach’s Alpha value of 0.870 for the 30 items in the
AIRQUAL scale was achieved, indicating good consistency and stability of the
instrument. The results of the reliability tests are highlighted in Table 5.2.

88
Table 5.2 Reliability Statistics of the Questionnaire
Cronbach's Alpha Cronbach's Alpha
Based on Standardized Items
No. of Items
0.870 0.946 30
These results of the pilot study were, therefore considered satisfactory, and so a
full-scale data collection and the subsequent analyses was conducted with the
adapted survey.
In the following sections outcomes from the Saudi and US samples are presented.
In the next section, Saudi sample will be analysed in detail followed by US sample.
5.2 Saudi sample
5.2.1 Data preparation and screening
The next stage in the analytical process was data preparation and screening. This
is an inevitable process because researchers may face problems pertaining to the
data, which may consequently lead to failure of the analysis, or biased findings.
This stage includes many steps; in this study it will start with handling missing data,
identifying outlier, and checking for normality.
5.2.1.1 Missing Data
One of the main problems in the survey research is the likelihood of missing data.
Missing data (or incomplete data) becomes important because it creates
complexity in scientific research, and unfortunately, most data analysis procedures

89
are not able to take into consideration the missing data (Schafer & Graham, 2002).
Consequently, any missing data triggers two main problems; firstly, it reduces the
ability of a statistical test to determine a relationship in a dataset and secondly,
biases may arise during the analytical process.
It is important to note that scholars (e.g., De Vaus, 2001; Schafer & Graham, 2002)
recommend reducing the problems of missing data during the stage of
administrating the survey instrument. It is the best time to reduce the chance of
respondents missing a particular item. If the researcher focuses on this stage, it
may significantly reduce excessive missing data. Roth (1994) also suggested that
the best possible way in dealing with missing data is through meticulous planning
and thorough data collection. Hence, in the present survey these suggestions and
recommendation of the scholars were taken into consideration.
As mentioned in the earlier chapters that the administration of this survey
instrument was through self-administered method. The researcher and his
assistants made sure that the respondents gain personal assistance, especially
when they did not understand certain statements, given the fact that they had to
complete the questionnaire themselves. Hence, it was assured that the
questionnaire is answered correctly and completely upon return.
Next, all the raw data was labelled and coded according to the section of the
instrument and then tested for frequency of occurrence of each item to check for
any missing values. This step was also necessary to check for any offending
entries; a possible case during the data entry session. As mentioned in the
“response rate” of this chapter, all those cases were deleted with significant

90
missing values. After dealing with the missing data, the next step necessary was
to check for outliers, as explained below.
5.2.1.2 Outliers
According to Hair et al. (2010) and Kline (2011), outliers are those cases in the
data, which are exposing irrational features, where there are conditions in which
they might also act peculiarly, unlike other observations in the similar dataset.
There are usually two types of outliers: univariate outliers and multivariate outliers.
In case of the former, a case will have extreme value on one variable, whereas, in
case of the later, an odd combination of scores on two or more variables is found
(Kline, 2011). Outliers can possibly arise due to errors in responding to the
questionnaire by respondents or errors in data recording, as well as, inappropriate
representatives of the targeted population under study (Tabachnich and Fidell,
2001).
It has been established that problematic outliers can severely distort statistical
tests. However, the adverse effect of outliers is more likely to occur in small
samples than larger ones (West et al., 1995). Therefore, it is imperative to
recognize the presence of these outliers in the dataset. However, it should be
noted that there is no criterion for identifying “extreme” outliers.
Kline (2011) states that one way is to look at the univariate skewness, where
values more than 3 and univariate kurtosis index value of greater than 10 can be
regarded as outliers. Similarly, for multivariate outliers scholars (see e.g., Byrne,
2010; Hair et al., 2010) recommended the Mahalanobis D2 measure. It is also

91
recognized as the Mahalanobis distance, which is a measure to evaluate the
position of each observation compared with the centre of all observations on a set
of variables (Hair et al., 2010). A large Mahalanobis distance score denotes a case
as having extreme values on one or more of the independent variables. Moreover,
Tabachnich and Fidell (2001) recommended that a very conservative statistical
test of significance can be used with Mahalanobis distance measure, such as
0.001 as the cut-off value.
For this study, univariate and multivariate outliers were tested using SPSS
software. The examination of skewness and kurtosis depicted in Table 6 revealed
no cases of outliers. In a similar manner, for multivariate outliers, Mahalanobis D2
was examined, a total of 145 cases resulted in a significance value of lower than
0.001, indicating multivariate outliers. As a result, these cases were removed from
further analyses, eventually leaving 242 respondents.
5.2.1.3 Normality
The final step in data preparation and screening is the assessment of normality of
the distribution. The identification of variables’ departure from normality is
inevitable (Byrne, 2010; Hair et al., 2010). Normality is considered as one of the
most fundamental assumptions in multivariate analysis (Hair et al., 2010).
Eventually, it is characterised as the shape of the data distribution for an individual
metric variable and its correspondence to the normal distribution, which is the
benchmark for statistical methods” (Hair et al., 2010).
92
According to Hair et al. (2010), normality can occur both at the univariate and
multivariate levels. In case of the univariate normality distribution of the individual
variable is involved, whereas, in case of the multivariate normality distribution of
two or more variables is involved. An odd distribution may affect the analyses and
interpretation of the results. With regard to identifying the normality distribution, the
researcher may analyse histogram and normal probability plots (Blunch, 2008).
The normal probability plot visually compares the actual cumulative data scores
against a normal cumulative distribution. Hair et al. (2010) and Kline (2011)
highlighted that in case of normal distribution, the line representing the actual data
distribution strongly adheres to the diagonal lines. Further, skewness and kurtosis
in a dataset need to be examined in order to identify non-normality (Hair et al.,
2010). Kurtosis refers to the “peakedness” or “flatness” of the distribution
compared with the normal distribution (Hair et al., 2010). On the other hand,
skewness portrays the symmetry of the distribution, and normal distributions are
symmetrical about their means. Skewed distribution usually occurs when most of
the cases are either below the mean or above it (i.e., positive skew or negative
skew) (Hair et al., 2010).
Another method to check the normality is analysing z score, in which case, the z
value of ±2.58 which exceeds a critical value at 0.01 probability level and critical
value of ±1.96 at a 0.05 level can also be used to identify normality (Hair et al.,
2010). Kline (2011) and West et al. (1998) further explained that datasets with
absolute values of univariate skew index greater than 3.0 and univariate kurtosis

93
index greater than 10 may suggest a problem, hence indicating a possible chance
of non-normality.
In the present study, a detailed examination of skewness and kurtosis from Table
6, clearly indicate that all values are less than 3.0 in case of skewness and less
than 10 in case of kurtosis. Therefore, normality of the data is attested.
After the screening and cleaning of dataset, the issues pertaining missing
observations, outliers and normality were dealt with accordingly. The next stage
would be descriptive analysis.
5.2.2 Descriptive analysis
This type of analysis is conducted at the early stage of any data analysis before
establishing any further statistical analysis. The presentation of the characteristics
of the respondents is deemed important in this study as it represents an insight
into the representation of the sample for the population.
5.2.2.1 Response rate
Questionnaires were distributed to five hundred people, in person, using a self-
administered questionnaire at Jeddah, The Kingdom of Saudi Arabia. However,
only 432 questionnaires were returned, giving a response rate of 86.4%. Among
the 432, only 242 questionnaires were analysed since the other 190 seemed to be
incomplete or missing significant part of the questionnaire as revealed with missing
or zero variance, resulting an adjusted response rate of 48.4%. Table 5.3 illustrates
the response rate of the distributed questionnaires.

94
Table 5.3
Response Rate of the Distributed Questionnaires
Description Number and percentages
Sample size 500 Questionnaires returned 432 Raw response rate 86.4%
Complete questionnaires 242
Number of unusable questionnaires 190
Adjusted response rate 48.4%
5.2.2.2 Demographic profile
The demographic characteristics of the respondents are depicted in Table 5.4, for
the Saudi sample. The detailed analysis of descriptive statistics revealed that male
and female respondents comprised of 93.8% and 4.1%, respectively. The lower
response of the female respondents was due to the same reason as highlighted in
the pilot study; reluctance to participate in the survey by females. The ages of the
overall majority of the respondents were between 18 to 24 years, accumulating a
total of 47.9% or 116 respondents. Consequently, the opinions expressed in the
survey were mainly reflected by the attitudes and perceptions of this group of
respondents. Another age group that resulted with a higher influence on this survey
was those respondents between 25 to 34 years. Next, an age group of 35 to 44
years contributed 12% in this study. The last three age groups were 45 to 54 years,
55 – 64 years and 65 & above; their contribution was 4.1%, 1.2% and 0.8%,
respectively. This also indicated that only few respondents (2 in number) from an
age bracket of 65 and above intended to participate in this survey.

95
In addition, it also seems that the findings of this survey were highly influenced by
respondents who live in Middle East. Their percentage of participation was 43.4%.
Another highly influential region of residence was “Asia” with a contribution of
34.3%. This was followed by UK, as 9.1% of the sample. Respondents from
Europe and Africa also contributed with 2.9% and 5.8% impact on this survey,
respectively. Lastly, with regard to residence of the respondents, two regions;
namely, North America and South America were quite close with 3 respondents
from the earlier and 1 respondents from the later.
In terms of the respondents’ educational level, majority (87 or 36%) indicated to
have high school degree or equivalent, followed by bachelor degree holders with
around 25.2% influence on the survey. This indicates that in the result of this study
high school degree holders played an important role. It is also important to note
that in the questionnaire educational level of “some college but no degree” and
“less than high school degree” were included. Interestingly, of the total 242
respondents, 45 had some college education but no degree, whereas, 10
respondents mentioned that their educational level is less than high school.
Graduate degree holders and associate degree holders also participated in this
survey with a contribution of 11.2% and 2.5%, respectively. In this case, associate
degree resulted with a least influence on the present research.
The last demographic variable included in the questionnaire was about the
occupation of the respondents. Pertaining to this variable, most of them (36.8%)
indicated their occupation in the category of “other”, followed by “other
Management” with a total of 21.9% contribution. Some senior managers,

96
technicians and professionals also participated in this survey. Of the total, 24
respondents were technicians, 13 professionals and 10 respondents were senior
managers. In this case, the lower influential group for this survey was senior
managers.

97
Table 5.4 Demographic Profile of the Respondents
Demographic Variables Research sample
(n = 242)
No. of Respondents
Percentage
Gender
Male 227 93.8
Female 10 4.1
Missing 5 2.1
Age
18 – 24 116 47.9
25 – 34 77 31.8
35 – 44 29 12.0
45 – 54 10 4.1
55 – 64 3 1.2
65 and above 2 0.8
Missing 5 2.1
Residency
UK 22 9.1
Europe 7 2.9
North America 3 1.2
South America 1 0.4
Asia 83 34.3
Middle East 105 43.4
Africa 14 5.8
Missing 7 2.9
Education
Less than high school degree
10 4.1
High school degree or equivalent
87 36.0
Some college but no degree 45 18.6
Associate degree 6 2.5
Bachelor degree 61 25.2
Graduate degree 27 11.2
Missing 6 2.5
Occupation
Senior Manager 10 4.1
Other Management 53 21.9
Technician 24 9.9
Professional 13 5.4
Other 89 36.8
Missing 53 21.9

98
5.2.2.3 Attributes of service quality
In order to gain an overview of 242 respondents of this study with regard to their
perception on airlines service quality, it is imperative to perform descriptive
analyses on all the major attributes of the questionnaire. In this case, descriptive
analysis was used for Service Quality, which was measured on Five-point Likert
scale with 1 = strongly disagree, 2 = disagree, 3 = not sure, 4 = agree, 5 = strongly
agree. Table 6 describes respondents’ responses on the 30 items of service
quality.
Table 5.5 Descriptive Statistics: Service Quality
Item Statements Mean Standard Deviation
Skewness Kurtosis
Reliability (Cronbach’s α =0.949)
SQ1 The airline provides passengers with new, modern and well maintained aircraft.
3.2562 1.17391 -.433 -.637
SQ2 Food and drink served on the aircraft during the flight are of high quality and sufficiently varied.
3.0041 1.27698 -.152 -1.178
SQ3 Toilets on board the aircraft are clean and easy to use.
3.6074 1.13362 -.700 -.172
SQ4 There are daily newspapers and current magazines to read on board the aircraft.
3.8967 1.06319 -1.046 .603
SQ5 Personnel working for the airline are neatly dressed.
4.0702 1.05020 -1.225 1.055
SQ6 The airline provides passengers with allocated seats.
3.4959 1.20596 -.513 -.639
SQ7 The airline provides good inflight entertainment on board the aircraft.
2.9504 1.30655 -.054 -1.105
SQ8 Passengers' luggage are handled with care and attention.
3.1612 1.33996 -.266 -1.103
SQ9 When the airline promises to do something by a certain time, it does so.
3.0041 1.19646 -.052 -.851
SQ10 When you have problems, the airline shows sincere interest in solving it.
3.0992 1.18009 -.194 -.800
SQ11 The airline performs its service right the first time.
3.1736 1.11703 -.330 -.661

99
SQ12 The airline provides its services at the time it promises to do so.
3.1322 1.17683 -.121 -.794
SQ13 The airline maintains error free records.
2.8140 1.19929 .087 -.699
SQ14 Employees of the airline tell you exactly when services will be performed.
3.3967 1.17709 -.519 -.591
SQ15 Employees of the airline give you prompt service.
3.3223 1.28325 -.455 -.872
SQ16 Employees of the airline are always willing to help you.
3.3926 1.11144 -.604 -.347
SQ17 Employees of the airline are never too busy to respond to your requests.
3.0537 1.17070 -.246 -.869
SQ18 The airline provides its services to you promptly.
3.2686 1.07314 -.289 -.686
SQ19 The airline personnel are experienced and well trained.
3.4959 1.12404 -.467 -.675
SQ20 The behaviour of employees of the airline instills confidence in customers.
3.4793 1.19889 -.497 -.731
SQ21 You feel safe in your transactions with the airline.
3.5000 1.12405 -.601 -.349
SQ22 Employees of the airline are consistently courteous with you.
3.3471 1.15022 -.347 -.818
SQ23 Employees of the airline have the knowledge to answer your questions.
3.3926 1.09261 -.348 -.687
SQ24
Passengers are compensated sufficiently by the airline for any damages arising from service disruption in the shortest time possible.
2.9174 1.17785 -.069 -.780
SQ25 Personnel working for the airline put themselves in the place of the passengers when providing service.
3.0000 1.18777 -.045 -.849
SQ26 The airline gives you individual attention.
2.9421 1.15444 -.115 -.753
SQ27 The airline has employees who give you personal attention.
3.0165 1.19809 -.105 -.906
SQ28 Employees of the airline understand your specific needs.
3.1612 1.19944 -.373 -.740
SQ29 The airline has your best interests at heart.
3.0744 1.20280 -.216 -.857
SQ30 The airline has operating hours convenient to all its customers.
3.5413 1.21554 -.642 -.456
Average Score 3.2656 1.1753
Note: 1= strongly disagree, 5 = strongly agree
The detailed examination of the results presented in Table 5.5 reveals the
respondents’ responses pertaining to service quality in the airline industry. The
average score resulted with a mean of 3.265 (SD = 1.175). This indicates that

100
majority of the cases tend to mark on the middle of the scale on a 1 to 5 range.
However, most of the items resulted with a slightly higher mean than 3, indicating
the agreeableness of the respondents on those items, as imperative for service
quality.
The highest mean values for service quality emerged for the item “Personnel
working for the airline are neatly dressed” (mean = 4.070), followed by “There are daily
newspapers and current magazines to read on board the aircraft” (mean = 3.896),
whereas, the lowest mean value for this construct is for “The airline maintains error
free records”, followed by “Passengers are compensated sufficiently by the airline for any
damages arising from service disruption in the shortest time possible.”.
Lastly, two items: “Personnel working for the airline are neatly dressed.” and “There are
daily newspapers and current magazines to read on board the aircraft.” resulted with a
less varied standard deviation as, 1.050 and 1.063, respectively. These items are
from the dimension “tangibility”, consequently, indicating that for respondents it
seemed to be important with regard to service quality.
5.2.3 Reliability test
Before proceeding with further analysis, the reliability testing was conducted in
order to ensure consistent measurement across various items in the questionnaire.
Indeed, the reliability of a measure indicates stability and consistency of the
instrument (Sekaran, 2003). This method, consequently, determines reliability
through examining the internal consistency of the research instrument, which in a
questionnaire is usually presented in the form a scale (Nor, 2009). The most widely

101
used method of testing reliability of an instrument is through Cronbach’s Alpha,
where its value ranges from 0.0 to 1.0 (Nor, 2009). A value closer to 1.0 indicates
strong reliability of the instrument, eventually suggesting consistency and stability
of the questionnaire. As shown in Table 5.6, the present instrument resulted in a
considerably high Cronbach’s Alpha of 0.950.
Table 5.6 Reliability Statistics of the Questionnaire
Cronbach's Alpha Cronbach's Alpha
Based on Standardized Items
No. of Items
0.950 0.950 30
5.2.4 Exploratory factor analysis (EFA)
An imperative stage in the analyses of this study was to find out dimensions
underlying the dataset and their subsequent items. As the main objective of this
study is scale development, this stage is extremely important and crucial. EFA,
with its capability to reduce large number of variables into smaller sets and
grouping them together (Kline, 2011), make it essential for this study. Further,
according to Byrne (2010), EFA helps the researcher to detect any misfit variables
in the data. For this purpose, EFA was conducted using SPSS software using a
total of 242 cases since the remaining 145 were outliers. All the 30 items of service
quality were used to identify the number of dimensions and their association with
each dimension.

102
The first step during EFA was to test if the data is fit for employing factor analysis.
In this case the suggestions of Hair et al. (2010) were followed, where Kaiser-
Meyer-Olkin (KMO) measure of sample adequacy and Bartlett’s Test of Sphericity
were examined. According to the aforementioned scholars, KMO needs to be
above 0.7 and Bartlett’s test of Sphericity needs to be significant at p <0.001 levels,
for a researcher to proceed with EFA. Table 5.7 depicts the results of KMO and
Bartlett’s test of Sphericity of the present study.
Table 5.7 KMO and Bartlett’s Test
Kaiser-Meyer-Olkin Measure of Sampling Adequacy
.941
Bartlett's Test of Sphericity
Approx. Chi-Square
3721.924
Df 435 Sig. .000
These results indicate that KMO measure of sampling adequacy was 0.941, and
Bartlett’s Test of Sphericity was significant at p <0.001, indicating the data are
suitable for factor analysis.
Principal Component Analysis (PCA) with Varimax rotation was used to conduct
the factor analysis. All items with factor loadings 0.3 and above were grouped
together. Further, the criterion of an eigenvalue greater than 1.0 was also used to
establish the number of underlying factors. The results revealed a five-factor
solution with a total variance of 58.85%. Following the extraction of factors, these
were given suitable names as: reliability, empathy, assurance, tangibility and

103
responsiveness. Detailed results of exploratory factor analysis (EFA) are
presented in Table 5.8.
Table 5.8 Results of Factor Analysis: Saudi Arabia
Items (Variables)
Component
Factor 1 Factor 2 Factor 3 Factor 4 Factor 5
Reliability Empathy Assurance Tangibility responsiveness
Items 1 .440
Items 2 .471
Items 3 .625
Items 4 .780
Items 5 .690
Items 6 .520 .394
Items 7 .690
Items 8 .610 .382
Items 9 .682 .319
Items 10 .619 .419
Items 11 .711
Items 12 .618 .334 .319
Items 13 .636 .367
Items 14 .423 .377 .345
Items 15 .522 .382 .333
Items 16 .583 .343
Items 17 .806
Items 18 .384 .501 .349
Items 19 .663
Items 20 .712
Items 21 .734
Items 22 .759
Items 23 .579
Items 24 .697
Items 25 .700
Items 26 .694
Items 27 .740
Items 28 .763
Items 29 .744
Items 30 .438
Initial Eigenvalues 11.838 1.908 1.546 1.360 1.004
% of Variance 39.459 6.361 5.153 4.532 3.347
Cumulative % 39.459 45.820 50.973 55.505 58.852

104
As shown in the results of exploratory factor analysis Table 5.8, among the five
variables, reliability accounted for 39.459 percent of the variance explained in total,
with the highest eigenvalue of 11.838. This was followed by empathy with 6.361
percent variance and eigenvalue of 1.908. The third and fourth factor emerged with
5.153 percent (eigenvalue = 1.546) and 4.532 percent (eigenvalue = 1.360) of
variance, respectively. Responsiveness accounted for 3.347 percent of variance
(eigenvalue = 1.004). This result was also crosschecked with US sample to
facilitate cross-validation. As shown in the revised factor analysis Table 5.9, one
item was re-allocated (Q2). This re-allocation of one item resulted during the cross-
validation process in which exploratory factor analysis Table 5.8, was compared
with that of the United States EFA. In the sample of United States item number 2
loaded clearly on Factor 4 (Tangibility). When the aforementioned item loaded in
the Saudi sample on Factor 1 (Reliability), its original source was checked to
confirm its actual location in the EFA table. Interestingly, the question states that
“food and drink served on the aircraft during the flight are of high quality and
sufficiently varied”, which clearly indicates that it belongs to tangibility, as it
emerged in the United States. Therefore, it was considered appropriate to re-
allocate and put it under Factor 4 (Tangibility) for further analysis.

105
Table 5.9 Revised Factor Analysis: Saudi Arabia
Items (Variables)
Component
Factor 1 Factor 2 Factor 3 Factor 4 Factor 5
Reliability Empathy Assurance Tangibility Responsiveness
Items 1 .440
Items 2 Re-allocated
Items 3 .625
Items 4 .780
Items 5 .690
Items 6 .520
Items 7 .690
Items 8 .610
Items 9 .682
Items 10 .619
Items 11 .711
Items 12 .618
Items 13 .636
Items 14 .423
Items 15 .522
Items 16 .583
Items 17 .806
Items 18 .501
Items 19 .663
Items 20 .712
Items 21 .734
Items 22 .759
Items 23 .579
Items 24 .697
Items 25 .700
Items 26 .694
Items 27 .740
Items 28 .763
Items 29 .744
Items 30 .438
Total 10 7 7 5 1
Table 5.9 depicts the final EFA results after re-allocation and cross checking the
Saudi sample with the US sample. Ten items were kept in reliability, seven in each
of empathy and assurance, five items in tangibility and just one item was kept in
responsiveness.
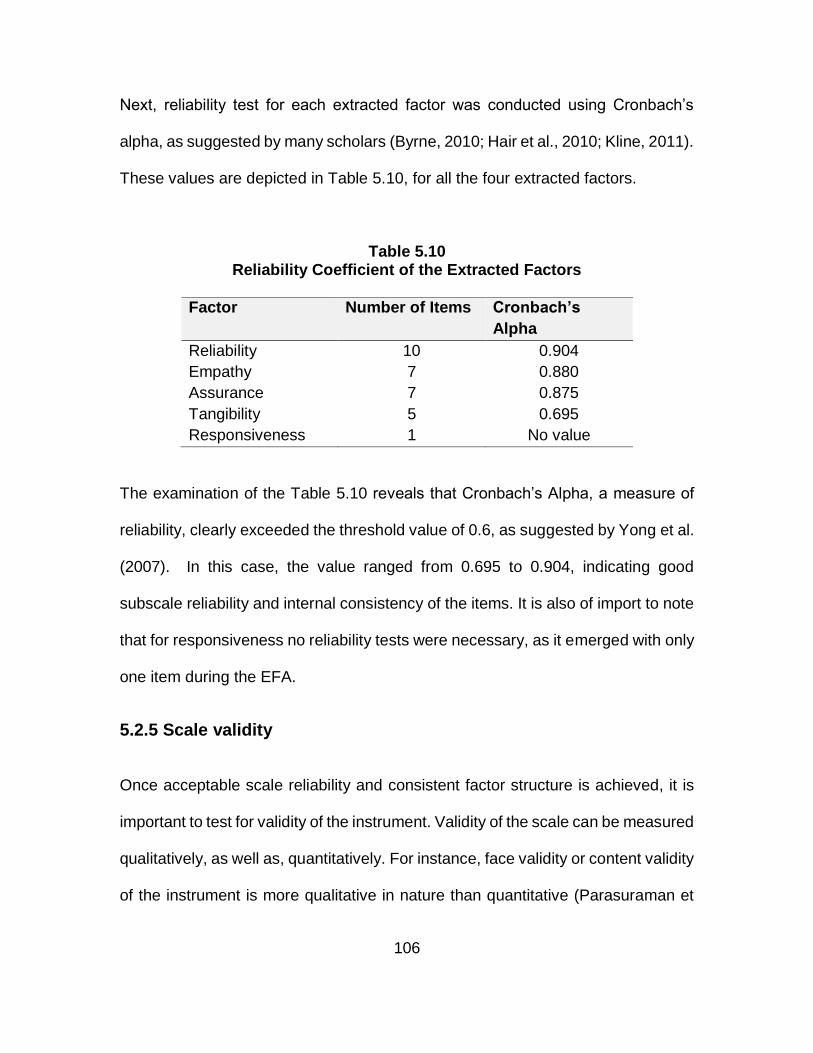
106
Next, reliability test for each extracted factor was conducted using Cronbach’s
alpha, as suggested by many scholars (Byrne, 2010; Hair et al., 2010; Kline, 2011).
These values are depicted in Table 5.10, for all the four extracted factors.
Table 5.10 Reliability Coefficient of the Extracted Factors
Factor
Number of Items Cronbach’s
Alpha
Reliability 10 0.904
Empathy 7 0.880
Assurance 7 0.875
Tangibility 5 0.695
Responsiveness 1 No value
The examination of the Table 5.10 reveals that Cronbach’s Alpha, a measure of
reliability, clearly exceeded the threshold value of 0.6, as suggested by Yong et al.
(2007). In this case, the value ranged from 0.695 to 0.904, indicating good
subscale reliability and internal consistency of the items. It is also of import to note
that for responsiveness no reliability tests were necessary, as it emerged with only
one item during the EFA.
5.2.5 Scale validity
Once acceptable scale reliability and consistent factor structure is achieved, it is
important to test for validity of the instrument. Validity of the scale can be measured
qualitatively, as well as, quantitatively. For instance, face validity or content validity
of the instrument is more qualitative in nature than quantitative (Parasuraman et
107
al., 1988). Content validity assures if a particular item measures what it is
supposed to measure. As the items in the presented study are adapted from a
well-established study, in the present study, the content validity of the scale was
established. Next a crucial part in the analyses was to ascertain the construct
validity of the scale. It includes establishing two types of validities, i.e., convergent
validity and discriminant validity. These two are explained separately with all the
empirical assessments undertaken.
5.2.5.1 Convergent validity
The scale validity was tested empirically by examining its convergent validity. The
testing methodology used in this part is similar to the method used by
Parasuraman et al. (1988).
Convergent validity was assessed by examining the association between service
quality scores and responses to a question that asked respondents to provide an
overall quality rating of the airline they were evaluating. This was done by
requesting the respondents to rate the airline’s overall quality (hereafter, referred
to as “overall Q”) by ticking on one of the five categories – very good, good,
average, bad, very bad. The correspondence between the overall Q ratings and
the service quality scores was examined using one-way ANOVA. The independent
variable (factor) in the ANOVA was overall Q with all the five categories, whereas,
the dependent variable was the average service quality scores on each dimension,
as well as, on the total service quality scale. It is important to note that separate

108
ANOVA were conducted for each dimension and for the total scale. The results of
ANOVA are presented in Table 5.11.
The numbers in Table 5.11 are the average service quality scores within each
overall Q category, measured on a 1 to 5 scale on which the higher the score, the
higher is the level of service quality. It is evident from the results that the combined
service quality score for those in the “very good” category is significantly higher
than for those in the “good” category. Similarly, the score for “good” category is
also significantly higher than those of “average” category. Furthermore,
respondents in the “average” category have a significantly higher combined
service quality score than those of the “bad” category. Lastly, the score of “bad”
category of the overall Q was higher than those of the “very bad” category. A similar
pattern of findings is also evident for the scores on the individual service quality
dimensions, except for the dimension “empathy” where the score for “good”
category was slightly higher than those of “very good” category. The strength and
persistence of the linkage between the overall Q categories and the combined
service quality scale scores offer strong support the instrument’s convergent
validity across 2 independent samples.
5.2.5.2 Discriminant validity
The present scale’s validity was further assessed, by examining whether the
construct measured by it was empirically associated with measures of other
conceptually related variables. For this purpose two general questions were asked

109
that provided measures of variables (see Table 5.11). These are labelled as
“Recommend” and “Problem”. In this case, the motive was to see which one could
expect to be related conceptually to service quality: whether the respondents
would recommend the service firm to a friend, and whether they had ever reported
a problem with the services they received from the firm. According to Parasuraman
et al. (1988), if respondent answer “yes” to the “recommend” question and “no” to
the “problem” question, it indicates higher service quality of the provider. It is
clearly revealed in the results, depicted in Table 5.11, that the combined score for
“yes” on the “recommend” part is significantly higher than those of “no”. Similarly,
the combined score for “no” is significantly higher on the “problem” part compared
to the score of “yes” on the same part. The trend in the individual dimensions’
scores is also alike, providing additional support for the validity of the scale.

110
Table 5.11
Significant Differences in Mean Scale Values for Respondents – Segmented According to the Variables
Overall Q, Recommend, and Problem: Saudi Arabia
Individual Scale
Dimensions
Overall Q Recommend Problem
Very
Good Good Average Bad Very Bad Yes No Yes No
Reliability 3.681 3.427 2.738 2.290 1.727 3.249 2.785 2.824 3.363
Assurance 3.5658 3.268 2.835 2.208 1.750 3.208 2.745 2.758 3.313
Empathy 3.706 3.723 3.196 2.485 1.571 3.532 3.056 3.030 3.669
Tangibility 3.881 3.856 3.582 3.433 2.416 3.782 3.543 3.505 3.849
Combined Scale 3.683 3.511 2.983 2.466 1.788 3.375 2.939 2.945 3.486
Sample Size 57 82 82 15 6 176 58 94 143

111
5.3 United States sample
5.3.1 Data preparation and screening
After the detailed descriptive analyses of the questionnaire, the next essential
stage was preparation, screening and cleaning of the data. This stage is important
because unprepared and unclean data may produce biased results, and even
cause failure. Therefore, before proceeding with further analyses, this stage was
considered with the many steps, e.g., handling of missing data, identifying outliers
and checking for normality.
5.3.1.1 Missing Data
The first task during the data preparation and screening stage was to check for
any missing data. It is quite normal that during the completion of the questionnaire,
some respondents do not attempt certain questions, or they forget to answer. In
any case, these missing values in the data set must be handled, as it may cause
serious problems during the analyses, consequently, producing biased results.
Schafer and Graham (2002) rightly mentioned that most of the statistical software
lacks the capability of handling missing data. That is why, special care is required
during the administration stage of the questionnaire (De Vaus, 2001; Schafer &
Graham, 2002) and thorough planning is also needed during the collection and
data entry stage (Roth, 1994). Hence, these propositions were taken into
consideration and were implemented by the current research.
As the data were collected online, it was possible to ensure that answer each and
every question by forcing elicitation. Once the questionnaires were received from

112
the research company; labelling, coding and data entry into SPSS was done with
special care. Later the entered data was also tested for frequency of occurrence
to crosscheck missing values or illegal entries. These results revealed that there
were 48 cases with missing value or zero variance, indicating invalid cases which
eventually excluded from further analysis, leaving 304 valid cases.
5.3.1.2 Outliers
In this second step of data preparation and screening process, both univariate and
multivariate outliers was test, similar to the process already undertaken for the
Saudi sample. With regard to univariate outlier, a case shows odd responses
compared to the rest of the cases on a single variable of the study, whereas, a
case showing peculiar responses on more than one variable is called multivariate
outlier (Kline, 2011).
In order to detect univariate outliers, it is suggested by Kline (2011) to examine
univariate skewness and kurtosis. The value of skewness above 3 and kurtosis
above 10 may trigger caution, as it may be a univariate outlier (Kline, 2011).
Similarly, testing for multivariate outliers require examining Mahalanobis D2
measure (Byrne, 2010; Hair et al., 2010). In this case, value lower than 0.001
(statistical significance lower than 0.001) indicates a possible case of multivariate
outlier (Tabachnich & Fidell, 2001).
Both univariate and multivariate outliers’ tests were conducted. The examination
of univariate skewness and univariate kurtosis given in Table 14 clearly indicates
that there were no offending values (i.e., skewness above 3 and kurtosis above

113
10). Similarly, Mahalanobis D2 was examined and a total of 39 cases resulted with
a value lower than 0.001, indicating a possible chance of multivariate outliers.
Therefore, these cases were not considered for further analyses, leaving only 265
cases.
5.3.1.3 Normality
The last stage under this part was to check the data for normality of the distribution.
It refers to the shape of the data distribution and is tested by examining the
skewness and kurtosis. Extreme values in skewness and kurtosis indicate the
possibility of abnormality in the data distribution. Researchers (see Kline, 2011;
West et al., 1998) suggested skewness values above 3 and kurtosis values above
10 might indicate possible problem in the data with regard to normality. In the
present study, Table 14 was checked for any value of skewness above 3 and
kurtosis above 10 and it was found that all the variables resulted in values below
the threshold. This assures that the data for the present study is normal. After the
preparation and screen of data, the next stage would be the descriptive analysis.
5.3.2 Descriptive analysis
After completing various analyses for the Saudi sample, the same would be
undertaken for the US sample. Detailed analyses of the respondents’ profiles will
be conducted. This part is important for gaining pivotal knowledge about
respondents of the study. The section initiates with highlighting response rate, as
follows:
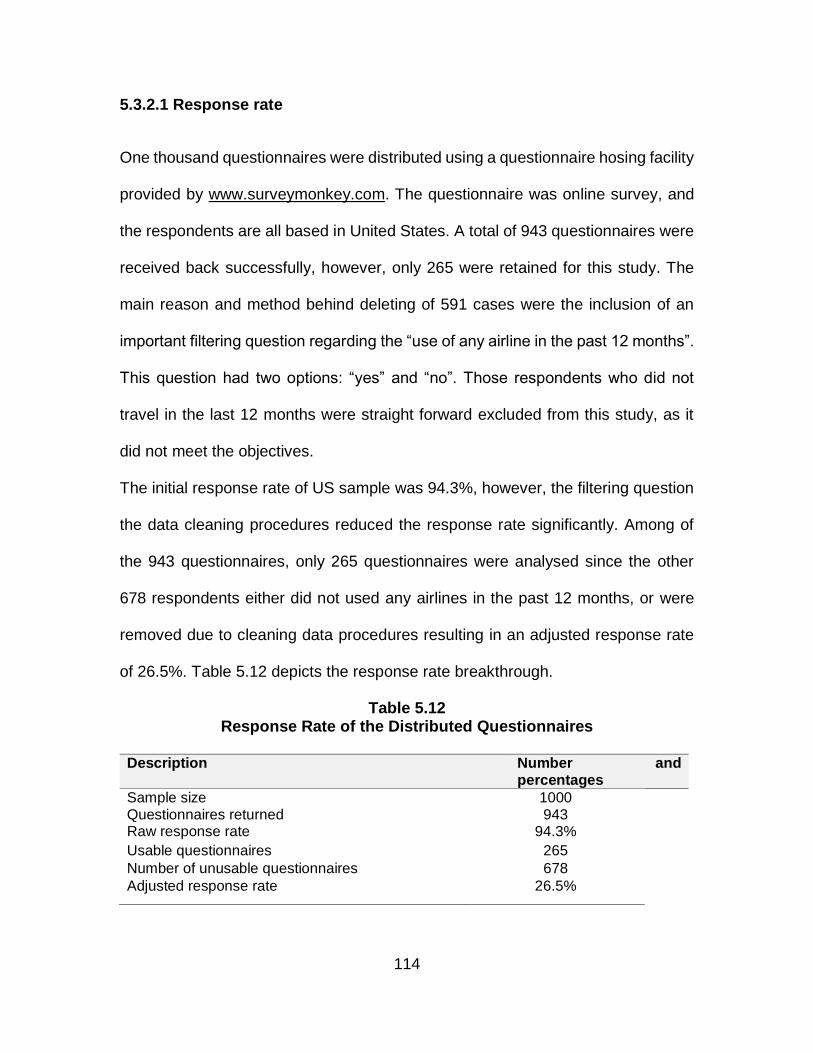
114
5.3.2.1 Response rate
One thousand questionnaires were distributed using a questionnaire hosing facility
provided by www.surveymonkey.com. The questionnaire was online survey, and
the respondents are all based in United States. A total of 943 questionnaires were
received back successfully, however, only 265 were retained for this study. The
main reason and method behind deleting of 591 cases were the inclusion of an
important filtering question regarding the “use of any airline in the past 12 months”.
This question had two options: “yes” and “no”. Those respondents who did not
travel in the last 12 months were straight forward excluded from this study, as it
did not meet the objectives.
The initial response rate of US sample was 94.3%, however, the filtering question
the data cleaning procedures reduced the response rate significantly. Among of
the 943 questionnaires, only 265 questionnaires were analysed since the other
678 respondents either did not used any airlines in the past 12 months, or were
removed due to cleaning data procedures resulting in an adjusted response rate
of 26.5%. Table 5.12 depicts the response rate breakthrough.
Table 5.12 Response Rate of the Distributed Questionnaires
Description Number and
percentages
Sample size 1000 Questionnaires returned 943 Raw response rate 94.3%
Usable questionnaires 265
Number of unusable questionnaires 678
Adjusted response rate 26.5%

115
5.3.2.2 Demographic profile
The demographic characteristics of US respondents are shown in Table 5.13. An
examination of the descriptive analyses with regard to respondents’ profiles
revealed some interesting information. For example, the number of female
respondents was 137 compared to 124 male respondents. In this case, females
contributed 51.7% in the total survey, whereas, males contributed 46.8%. This
particular finding is also interesting in a sense that if we compare it with that of the
Saudi sample, the results are astonishingly different, where only 10 (or 4.1%)
females responded to the survey. It also gives an indication that in US sample,
female respondents played a major role and had greater influence on the findings
of this study.
Followed by gender, age group of the respondents was also investigated. In terms
of age, the largest group of respondents (35.5%) of the fall under the category of
“65 and above”; which shows that this survey was attempted by most of the
experienced and aged people. The second highest response was from an age
group of 55 to 64 with the total of 79 (or 29.8%) responses. This was followed by
three other age brackets: 45 to 54, 35 to 44 and 25 to 34 with a contribution of
14.7%, 10.2% and 8.3%, respectively. Overall, this variable clearly indicates that
majority of the participants in this survey were those people who are aged 55 and
above. The findings of this particular variable also contradict with that of the Saudi
counterpart, where only 2 responses were received from people aged 65 and
above.
116
Another demographic variable included in the survey was about the location of the
respondents. The results revealed that significantly high number (259) or 97.7%
respondents reside in the North American region, followed by South America with
a response rate of only 0.4% (or 1 responses). Interestingly two respondents
indicated that their residence at the time of filling this survey was Asia and Middle
East. The results are very much aligned with our objective of targeting US sample.
The level of education of respondents was also enquired. The results clearly show
that the majority of the respondents hold at least a bachelor’s degree with a
contribution of 97 (or 36.6%) in this survey. It implies that bachelor degree holders
influence this study, which again is varied from what was seen in the Saudi sample
where majority of the respondents held a high school degree or equivalent.
Graduate degree holders also participated in a fairly higher response rate (69 in
number or 26%) compared to the 11.2% response in the Saudi sample. This was
followed by “Associate degree” with a total of 10.6% contribution in this survey.
Another educational level, “some college but no degree”, resulted in a response
rate of 13.6%, followed by “high school degree or equivalent” with a response rate
of 12.5%. It is also important to note that no respondent indicated on the education
level of “less than high school degree” compared to 10 respondents in the Saudi
sample.
With regard to occupation of the respondents, the descriptive analysis resulted in
37.4% were retired. This particular group of people have a major influence on this
survey. Another important group in terms of the contribution was “professional”,
which resulted in a total of 20.8% response rate. Of the total 265 questionnaires,

117
respondents holding “middle management” and “senior management” positions
accounted for 12.5% and 9.1% contribution, respectively. This was followed by 14
responses (5.3%) from “skilled manual workers”, 11 responses (4.2%) from “junior
management” and 10 responses (3.8%) from “other manual workers”. It is also
important to note here that 17 respondents indicated that they are unemployed,
accumulating a total of 6.4% in the total response. In comparison of this variable
with that of the same in the Saudi sample, it can be observed that many different
categories under the same question were distinct from that of the same question
in Saudi sample, e.g., the inclusion of categories like: middle management, junior
management, skilled manual workers, other manual workers, retired and
unemployed, which resulted in a fairly higher response rate.

118
Table 5.13 Demographic Profile of the Respondents
Demographic
Variables
Research sample (n = 265)
No. of Respondents
Percentage
Gender
Male 124 46.8
Female 137 51.7
Missing 4 1.5
Age
25 – 34 22 8.3
35 – 44 27 10.2
45 – 54 39 14.7
55 – 64 79 29.8
65 and above 94 35.5
Missing 4 1.5
Stay (Live)
North America 259 97.7
South America 1 0.4
Asia 1 0.4
Middle East 1 0.4
Missing 3 1.1
Education
High school degree or equivalent 33 12.5
Some college but no degree 36 13.6
Associate degree 28 10.6
Bachelor degree 97 36.6
Graduate degree 69 26
Missing 2 0.8
Occupation
Senior Management 24 9.1
Professionals 55 20.8
Middle Management 33 12.5
Junior Management 11 4.2
Skilled Manual Workers 14 5.3
Other Manual Workers 10 3.8
Retired 99 37.6
Unemployed 17 6.4
Missing 2 0.8
5.3.2.3 Attributes of service quality
The analysis proceeded with gaining more insight into the perception of service
quality by 265 respondents through descriptive analyses on all the major attributes
of the questionnaire. Similar to the Saudi sample, service quality in the present

119
sample was also measured using Five-point Likert scale with 1 = strongly disagree,
2 = disagree, 3 = not sure, 4 = agree, 5 = strongly agree. Table 5.14 presents
detailed descriptive results of the 30 items of service quality.
Table 5.14 Descriptive Statistics: Service Quality
Item Statements Mean Standard Deviation
Skewness Kurtosis
Reliability (Cronbach’s α =0.966)
SQ1 The airline provides passengers with new, modern and well maintained aircraft.
3.6943 .87957 -1.010 1.005
SQ2 Food and drink served on the aircraft during the flight are of high quality and sufficiently varied.
3.0000 1.20605 .052 -1.144
SQ3 Toilets on board the aircraft are clean and easy to use.
3.6906 .91417 -.606 .243
SQ4 There are daily newspapers and current magazines to read on board the aircraft.
2.7245 1.23842 .272 -.932
SQ5 Personnel working for the airline are neatly dressed.
4.2981 .59496 -.536 1.183
SQ6 The airline provides passengers with allocated seats.
3.8415 1.15690 -1.107 .440
SQ7 The airline provides good inflight entertainment on board the aircraft.
3.0226 1.21210 -.134 -.930
SQ8 Passengers' luggage are handled with care and attention.
3.3660 1.07219 -.419 -.395
SQ9 When the airline promises to do something by a certain time, it does so.
3.3698 1.04765 -.388 -.358
SQ10 When you have problems, the airline shows sincere interest in solving it.
3.3849 1.08840 -.439 -.327
SQ11 The airline performs its service right the first time.
3.6491 .95020 -.634 .211
SQ12 The airline provides its services at the time it promises to do so.
3.5887 .98505 -.657 -.010
SQ13 The airline maintains error free records.
3.2151 .91025 .016 .279
SQ14 Employees of the airline tell you exactly when services will be performed.
3.4868 1.01542 -.500 -.250
SQ15 Employees of the airline give you prompt service.
3.7358 .94450 -.972 .820
SQ16 Employees of the airline are always willing to help you.
3.7962 .95544 -.947 .719

120
SQ17 Employees of the airline are never too busy to respond to your requests.
3.3887 1.10262 -.458 -.607
SQ18 The airline provides its services to you promptly.
3.6491 .96993 -.778 .277
SQ19 The airline personnel are experienced and well trained.
3.9811 .75102 -.834 1.322
SQ20 The behaviour of employees of the airline instills confidence in customers.
3.9094 .90835 -.950 .982
SQ21 You feel safe in your transactions with the airline.
4.0491 .79858 -1.078 2.023
SQ22 Employees of the airline are consistently courteous with you.
4.0151 .87460 -1.227 1.964
SQ23 Employees of the airline have the knowledge to answer your questions.
3.9811 .79512 -1.014 1.857
SQ24 Passengers are compensated sufficiently by the airline for any damages arising from service disruption in the shortest time possible.
3.0302 1.07970 -.133 -.230
SQ25 Personnel working for the airline put themselves in the place of the passengers when providing service.
3.2264 1.07029 -.388 -.344
SQ26 The airline gives you individual attention.
3.4038 1.07625 -.419 -.539
SQ27 The airline has employees who give you personal attention.
3.5623 1.01732 -.671 .006
SQ28 Employees of the airline understand your specific needs.
3.5057 1.00800 -.519 -.074
SQ29 The airline has your best interests at heart.
3.3170 1.12036 -.390 -.551
SQ30 The airline has operating hours convenient to all its customers.
3.7321 .92927 -.612 .195
Average Score 3.553 0.989
Note: 1= strongly disagree, 5 = strongly agree
An examination of the descriptive table for service quality revealed important
information, regarding respondents’ choice on the scale of 1 to 5, standard
deviation, Skewness and kurtosis. The average score resulted with a mean of
3.553 (SD = 0.989), indicating that majority of the respondents was inclined
positively toward service quality.
The highest mean value for service quality resulted for an item “Personnel working
for the airline are neatly dressed” with the mean score of 4.298. This item was also
the least varied in terms of standard deviation (SD = 0.594). The second highest
121
mean value was for item “You feel safe in your transactions with the airline” (mean =
4.049; SD = 0.798). It seems that those items are from a service quality dimension
called “tangibility” and “assurance”. Interestingly, in the Saudi sample, tangibility
dimension also resulted as imperative based on the results of the descriptive
analysis.
The lowest mean value among the 30 items was for, “There are daily newspapers
and current magazines to read on board the aircraft” (mean = 2.724), followed by “Food
and drink served on the aircraft during the flight are of high quality and sufficiently varied”
(mean = 3.000). Except for these two items, it seems that respondents agreed to
the importance of the developed items with regard to service quality.
5.3.3 Reliability test
Reliability tests were also conducted for this sample, as it is imperative in order to
establish stability and consistency of the instrument (Sekaran, 2003). For this
purpose, SPSS software was used to test for the reliability of the instrument using
the most common and widely accepted measure, i.e., Cronbach’s alpha. As
mentioned earlier, the alpha value closer to 1.0 should be targeted, as it indicates
greater stability and consistency of the instrument. However, scholars (see
Nunnally, 1978; Yong et al., 2007) set the cut-off value of alpha as 0.6. The results
of reliability analysis are depicted in Table 5.15.

122
Table 5.15 Reliability Statistics of the Questionnaire
Cronbach's Alpha
Cronbach's Alpha Based on
Standardized Items No. of Items
0.956 0.959 30
The present instrument emerged with an acceptably higher Cronbach’s alpha
value of 0.956 for overall scale, indicating good consistency and stability of the
scale.
5.3.4 Exploratory Factor Analysis
After the reliability analyses, EFA was undertaken in order to find out dimensions
in the dataset along with their items. This stage was imperative not only to explore
dimensions in the dataset but also to compare these dimensions with that of the
Saudi sample. Similar to that of the EFA conducted for Saudi sample, SPSS
software was also used in this case with 265 remaining cases after excluding the
outliers. All the 30 items of service quality was used to identify the number of
dimensions and their association with each dimension. However, it is important to
note that the initial step considered crucial before conducting EFA is to check
Kaiser-Meyer-Olkin (KMO) measure of sample adequacy and Bartlett’s Test of
Sphericity (Hair et al., 2010). The threshold for KMO is 0.7, whereas, for Bartlett’s
test of Sphericity it is p<0.001 of significance level, in order to conduct EFA (Hair
et al., 2010). Table 5.16 highlights the results of KMO and Bartlett’s test of
Sphericity of the US sample.

123
Table 5.16 KMO and Bartlett’s Test
Kaiser-Meyer-Olkin Measure of Sampling Adequacy
.954
Bartlett's Test of Sphericity
Approx. Chi-Square
5522.171
Df 435 Sig. .000
The above table clearly indicates that the cut-off values for KMO and Bartlett’s Test
of Sphericity were met. In this case KMO measure of sampling adequacy was
0.954, and Bartlett’s Test of Sphericity was significant at p <0.001, demonstrating
the suitability of data for EFA.
Table 5.17 depicts the results of EFA for US sample. In this case, Principal
Component Analysis (PCA) method with Varimax rotation was used for this sample
during EFA. All items with factor loadings 0.3 and above were grouped together.
Further, during EFA eigenvalue greater than 1.0 was considered with suppression
of below 0.3. The result revealed four-factor solution with a total of 62.59% of
variance. The extracted dimensions were also given suitable names as:
assurance, reliability and tangibility. It was noticed during the EFA the original
tangibility related items loaded on two separate factors, that is why, it was
considered appropriate to give it related names. In this case soft tangibility and
hard tangibility were considered suitable, as shown in Table 5.17.
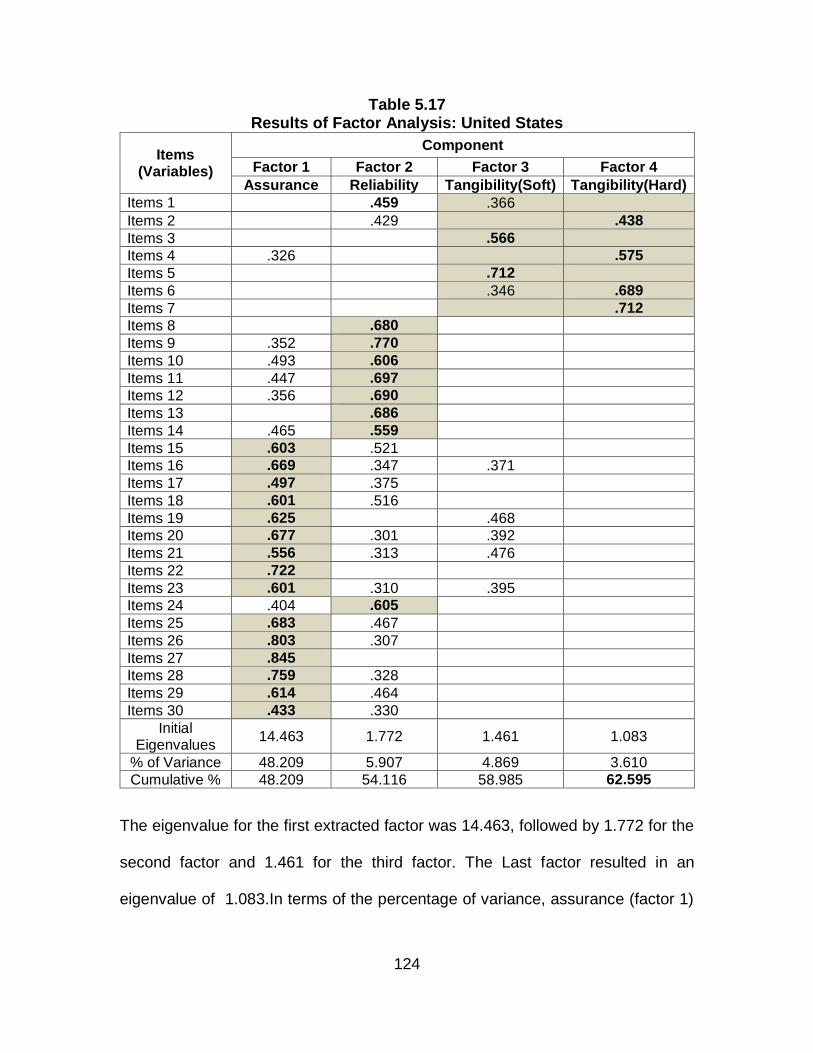
124
Table 5.17 Results of Factor Analysis: United States
Items (Variables)
Component
Factor 1 Factor 2 Factor 3 Factor 4
Assurance Reliability Tangibility(Soft) Tangibility(Hard)
Items 1 .459 .366
Items 2 .429 .438
Items 3 .566
Items 4 .326 .575
Items 5 .712
Items 6 .346 .689
Items 7 .712
Items 8 .680
Items 9 .352 .770
Items 10 .493 .606
Items 11 .447 .697
Items 12 .356 .690
Items 13 .686
Items 14 .465 .559
Items 15 .603 .521
Items 16 .669 .347 .371
Items 17 .497 .375
Items 18 .601 .516
Items 19 .625 .468
Items 20 .677 .301 .392
Items 21 .556 .313 .476
Items 22 .722
Items 23 .601 .310 .395
Items 24 .404 .605
Items 25 .683 .467
Items 26 .803 .307
Items 27 .845
Items 28 .759 .328
Items 29 .614 .464
Items 30 .433 .330
Initial Eigenvalues
14.463 1.772 1.461 1.083
% of Variance 48.209 5.907 4.869 3.610
Cumulative % 48.209 54.116 58.985 62.595
The eigenvalue for the first extracted factor was 14.463, followed by 1.772 for the
second factor and 1.461 for the third factor. The Last factor resulted in an
eigenvalue of 1.083.In terms of the percentage of variance, assurance (factor 1)

125
resulted in 48.209% variance; reliability (factor 2) emerged with 5.907% variance,
soft tangibility (factor 3) and hard tangibility (factor 4) resulted in 4.869 %, 3.610 of
variance respectively. As depicted in Table 5.17, the EFA for US sample doesn’t
seem to be very clean. Moreover, many cross-loadings can be noticed apart from
deduction of dimensions to four compared to the Saudi sample that emerged with
five dimensions. In this case, the 30 items of service quality was crosschecked
with previous sample, in order to detect any discrepancy and to handle it
appropriately. This process, facilitate to make cross-validation for both samples.
The revised factor analysis table is given below as Table 5.18.
As mentioned earlier that the questionnaire for this study was developed based on
the original “AIRQUAL” and “SERVQUAL” instruments. In the instrument of this
study item 24 to item 30 were originally ‘empathy’ related items. However, when
data was collected and analyses were undertaken, it was revealed that these items
loaded on ‘assurance’ and ‘reliability’ simultaneously except for item 27 that loaded
only on ‘assurance’ dimension. This was the case only in US sample. Further
action was taken to crosscheck these items with the main sample of the study
(Saudi sample) and also with that of the original source. Interestingly, in the Saudi
sample the same items loaded clearly on ‘empathy’ dimension, as were designed
for. The main reason behind this discrepancy between US and Saudi samples may
be because of the cultural difference and the way respondents perceive and read
the items. Further, data collection was also different in both the samples, i.e., in
US data was collected online without the presence of the researcher(s), whereas,

126
in Saudi Arabia researcher(s) was available at the time of completing the
questionnaire for clarification purposes.
It is also important to note that the items were re-allocated in the US sample from
‘assurance/reliability’ to ‘empathy’. It was because the original source was checked
for the items’ belongingness to the dimension. Therefore, it was considered
appropriate to re-allocate these items (24 – 30) and put it under their original
dimension (Empathy). Lastly, it is worth mentioning here that the final dimensions
and sample considered for this study was that of Saudi Arabia, as it was the main
objective of the study.
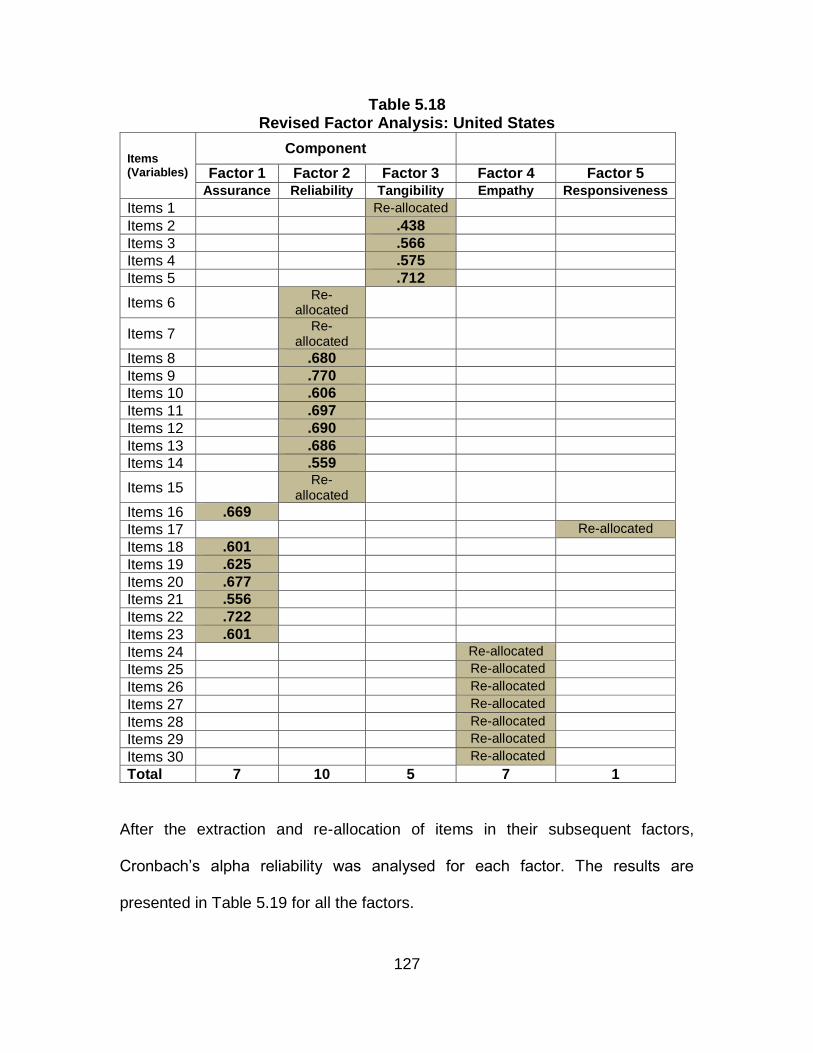
127
Table 5.18 Revised Factor Analysis: United States
Items (Variables)
Component
Factor 1 Factor 2 Factor 3 Factor 4 Factor 5 Assurance Reliability Tangibility Empathy Responsiveness
Items 1 Re-allocated
Items 2 .438
Items 3 .566
Items 4 .575
Items 5 .712
Items 6 Re-
allocated
Items 7 Re-
allocated
Items 8 .680
Items 9 .770
Items 10 .606
Items 11 .697
Items 12 .690
Items 13 .686
Items 14 .559
Items 15 Re-
allocated
Items 16 .669
Items 17 Re-allocated
Items 18 .601
Items 19 .625
Items 20 .677
Items 21 .556
Items 22 .722
Items 23 .601
Items 24 Re-allocated
Items 25 Re-allocated
Items 26 Re-allocated
Items 27 Re-allocated
Items 28 Re-allocated
Items 29 Re-allocated
Items 30 Re-allocated
Total 7 10 5 7 1
After the extraction and re-allocation of items in their subsequent factors,
Cronbach’s alpha reliability was analysed for each factor. The results are
presented in Table 5.19 for all the factors.

128
Table 5.19 Reliability Coefficient of the Extracted Factors
Factor Number of Items Cronbach’s
Alpha
Reliability 10 0.872
Assurance 7 0.923
Empathy 7 0.916
Tangibility 5 0.647
Responsiveness 1 No value
The examination of Table 5.19 reveals the Cronbach’s Alpha reliability results for
all the five dimension of the US sample. The highest of these are the dimension of
“Assurance” with an alpha value of 0.923, followed by dimension “Empathy” with
an alpha value of 0.916. Reliability dimension resulted in a Cronbach Alpha value
of 0.872, whereas, Tangibility emerged with the lowest Alpha value among all
which was 0.647. One dimension, namely, Responsiveness resulted with only one
item for which reliability tests were not considered necessary. All the values were
above the threshold value of 0.6, which indicate that the instrument of the study
was fairly consistent and reliable.

129
5.3.5 Scale validity
Similarly to Saudi sample, after achieving acceptable reliability and reasonably
clean factor structure during EFA, the next stage deemed necessary was to test
validity of the instrument. First type of validity that was considered imperative for
the present scale was face or content validity. For content validity, researchers are
suggested to validate the content of the instrument in order to ensure if the items
selected measure what it is intended to measure. Moreover, if items are adopted
from previous studies, researchers have to make sure that those items are reliable
and valid. In the present research items are adapted from a very established
instrument and then these adapted items are thoroughly checked for their
suitability for the present research, establishing face validity of the instrument.
Face or content validity is more qualitative and is not sufficient.
5.3.5.1 Convergent validity
The scale validity was tested empirically by examining its convergent validity, using
the same method as explained in section 5.3.5.1. The correspondence between
the overall Q ratings and the service quality scores was examined using one-way
ANOVA. The independent variable (factor) in the ANOVA was overall Q with all
the five categories, whereas, the dependent variable was the average service
quality scores on each dimension, as well as, on the total service quality scale. It
is important to note that separate ANOVA were conducted for each dimension and
for the total scale.

130
The results of ANOVA are presented in Table 5.20. The numbers in Table 5.20 are
the average service quality score within each overall Q category, measured on a
1 to 5 scale on which the higher the score, the higher is the level of service quality.
It is evident from the results that the combined service quality score for those in
the “very good” category is significantly higher than for those in the “good”
category. Similarly, the score for “good” category is also significantly higher than
those of “average” category. Furthermore, respondents in the “average” category
have a significantly higher combined service quality score than those of the “bad”
category. Lastly, the score of “bad” category of the overall Q was higher than those
of the “very bad” category. A similar pattern of findings is also evident for the scores
on the individual service quality dimensions. The strength and persistence of the
linkage between the overall Q categories and the combined service quality scale
scores offer strong support for the instrument’s convergent validity.
5.3.5.2 Discriminant validity
The present scale’s validity was further assessed, by examining whether the
construct measured by it was empirically associated with measures of other
conceptually related variables. For this purpose two general questions were asked
that provided measures of variables (see Table 5.20). These are labelled as
“Recommend” and “Problem”. In this case, the motive was to see which one could
expect to be related conceptually to service quality: whether the respondents
would recommend the service firm to a friend, and whether they had ever reported
a problem with the services they received from the firm. According to Parasuraman

131
et al. (1988), if respondent answer “yes” to the “recommend” question and “no” to
the “problem” question, it indicates higher service quality of the provider. It is
clearly revealed in the results, depicted in Table 5.20, that the combined score for
“yes” on the “recommend” part is significantly higher than those of “no”. Similarly,
the combined score for “no” is significantly higher on the “problem” part compared
to the score of “yes” on the same part. The trend in the individual dimensions’
scores is also alike, providing additional support for the discriminant validity of the
scale.

132
Table 5.20
Significant Differences in Mean Scale Values for Respondents – Segmented According to the Variables
Overall Q, Recommend, and Problem: United States
Individual Scale
Dimensions
Overall Q Recommend Problem
Very
Good Good Average Bad Very Bad Yes No Yes No
Reliability 4.050 3.566 2.991 2.560 2.180 3.578 2.688 2.845 3.642
Assurance 4.463 3.976 3.337 2.900 1.925 3.995 2.908 3.165 4.036
Empathy 4.056 3.540 2.853 2.142 1.457 3.547 2.407 2.661 3.602
Tangibility 4.050 3.566 2.991 2.560 2.180 3.578 2.688 2.845 3.642
Combined Scale 4.136 3.664 3.083 2.566 1.993 3.682 2.706 2.935 3.728
Sample Size 68 103 83 5 5 216 34 59 205
133
5.4 HYPOTHESES TESTING
The hypotheses of the present research are the product of the review of the
literature. Nine hypotheses were devised (see chapter 2) and are subsequently
tested. This part highlights various tests undertaken during the hypotheses testing.
Firstly, a correlation analysis was performed on all the key constructs of the study.
These included: service quality along with its five dimensions, overall service
quality, satisfaction, and repurchase intention, word of mouth, attitudinal loyalty
and complaint behaviour. The complete results of Pearson Correlation analysis
are presented in Table 5.21.
The review of the Pearson Correlation shows that all the correlations of overall
service quality with other constructs were significant at p < 0.01. The envisaged
and hypothesised direction of relationships is also supported by the results. In this
case, a statistically significant positive relationship of overall service quality with
satisfaction (0.717), repurchase intention (0.436), word of mouth (0.377) and
attitudinal loyalty (0.260) support the hypotheses of this study. Moreover, a
statistically significantly negative relationship of overall service quality with
complaint behaviour (-0.272) was also hypothesised and therefore, supported
based on the results depicted in Table 5.21.

134
Table 5.21: Pearson Correlation
Correlations Table
1 2 3 4 5 6 7 8 9 10 11
(1) Reliability
Pearson Correlation 1
Sig. (2-tailed)
N 242
(2) Empathy Pearson Correlation .690** 1
Sig. (2-tailed) .000 N 242 242
(3) Assurance Pearson Correlation .694** .621** 1
Sig. (2-tailed) .000 .000 N 242 242 242
(4) Tangibility Pearson Correlation .607** .452** .575** 1
Sig. (2-tailed) .000 .000 .000 N 242 242 242 242
(5) Responsiveness
Pearson Correlation .357** .324** .400** .226** 1 Sig. (2-tailed) .000 .000 .000 .000
N 242 242 242 242 242
(6) Overall SQ Pearson Correlation -.542** -.497** -.475** -.361** -.152* 1
Sig. (2-tailed) .000 .000 .000 .000 .018 N 242 242 242 242 242 242
(7) Satisfaction Pearson Correlation -.515** -.455** -.429** -.333** -.121 .717** 1
Sig. (2-tailed) .000 .000 .000 .000 .059 .000 N 242 242 242 242 242 242 242
(8) Repurchase Intention
Pearson Correlation -.278** -.274** -.238** -.106 -.100 .436** .369** 1 Sig. (2-tailed) .000 .000 .000 .100 .120 .000 .000
N 241 241 241 241 241 241 241 241
(9) Word of mouth
Pearson Correlation -.228** -.235** -.240** -.150* -.076 .377** .363** .088 1 Sig. (2-tailed) .000 .000 .000 .021 .248 .000 .000 .181
N 234 234 234 234 234 234 234 234 234
(10) Attitudinal loyalty
Pearson Correlation -.082 -.107 -.168** -.022 -.079 .260** .128* .154* .271** 1 Sig. (2-tailed) .207 .099 .009 .734 .222 .000 .047 .017 .000
N 240 240 240 240 240 240 240 240 234 240
(11) Complaint Behaviour
Pearson Correlation .300** .325** .369** .233** .090 -.248** -.272** -.178** -.319** -.094 1
Sig. (2-tailed) .000 .000 .000 .000 .166 .000 .000 .006 .000 .150
N 237 237 237 237 237 237 237 237 231 237 237
**. Correlation is significant at the 0.01 level (2-tailed). *. Correlation is significant at the 0.05 level (2-tailed).

135
The review of the Pearson Correlation depicted in Table 5.21 shows that all the
correlations of overall service quality with other constructs were significant at p <
0.01. The envisaged and hypothesised direction of relationships is also supported
by the results. In this case, a statistically significant positive relationship of overall
service quality with satisfaction (0.717), repurchase intention (0.436), word of
mouth (0.377) and attitudinal loyalty (0.260) support the hypotheses of this study.
Moreover, a statistically significantly negative relationship of overall service quality
with complaint behaviour (-0.272) was also hypothesised and therefore, supported
based on the results depicted in Table 5.21.
Some interesting findings are also revealed during Pearson Correlation as
presented in Table 5.21. These unique findings were with regard to the correlation
of five dimensions of service quality with other constructs, namely, overall service
quality, satisfaction, repurchase intention, word of mouth, attitudinal loyalty, and
complaint behaviour. It can be seen in the above table that all these correlations
resulted in negative outcomes, except for complaint behaviour that resulted in a
positive outcome. It is because the scales go in different directions, i.e., a higher
number is better for factor scores and a lower score is better for service quality.
However, it is of prime importance to keep in mind that the main focus should be
the relationship of the devised hypotheses, and in this case all resulted as
envisaged.

136
Another important attempt to test the hypotheses was through regression analysis.
Detailed results of the tests of hypotheses are provided in Table 5.22.
TABLE 5.22
RESULTS OF HYPOTHESES TESTING
Hypotheses Hypothesised Relationship
R Square
ANOVA Standardized Coefficients
P Value
Result
F Β SQ CS H1 .514 253.64 .717 *** Supported
SQ RI H2 .190 56.100 .436 *** Supported
SQ WOM H3 .142 38.322 .377 *** Supported
SQ AL H4 .068 17.280 .260 *** Supported
SQ CB H5 .061 15.346 -.248 *** Supported
CS RI H6 .136 37.717 .369 *** Supported
CS WOM H7 .132 35.181 .363 *** Supported
CS AL H8 .016 3.975 .128 ** Supported
CS CB H9 .074 18.757 -.272 *** Supported
Legends
*** P < 0.001 ** P < 0.05 SQ Service Quality CS Customer Satisfaction RI Repurchase Intention WOM Word of Mouth AL Attitudinal Loyalty CB Complaint Behaviour
The review of the hypotheses testing table clearly reveals that all the hypotheses
are supported at P level of less than 0.001, except one hypothesis (customer
satisfaction has a positive impact on attitudinal loyalty) that resulted in a
significance level of p < 0.05. Of all the hypotheses, H1 (service quality has a
positive impact on customer satisfaction) resulted with a stronger impact compared
to the rest. In this case, the R-square was 0.514, whereas, standardized coefficient

137
beta was 0.717. Similarly, the weakest among the hypothesis was H8 (customer
satisfaction has a positive impact on attitudinal loyalty) with R-square of 0.016 and
beta value of 0.128. However, it should be noted that this hypothesis was
statistically significant at p < 0.05.
Overall, all the results were acceptable with no offending estimates.
In this section, the researcher wishes to offer some recommendations to Saudi
Airlines based on the in-depth analyses of the results and findings of the present
study. Moreover, suggestions for improvements will also be offered in order for the
Saudi Airlines to overcome the issues highlight by the present research.
As evident from the demographic part of the analysis (see demographic profile of
the respondents – Table 5.4), male respondents have a major influence on the
present study. This is important to take note of, because recommendations and
suggestions by the researcher may not be fully generalised, particularly with regard
to females. However, when it comes to service quality and satisfaction in the airline
industry, male and female respondents usually respond in the same manner.
High Cronbach’s reliability results of the service quality scale clearly indicates that
respondents were aware of their responses and that every item replied to should
be discussed with its implications for Saudi Airlines.

138
Five dimensions of service quality resulted during the analysis (see Table 5.9),
with reliability as the first dimension of service quality, followed by empathy,
assurance, tangibility, and responsiveness. These dimensions emerged with
certain number of items under each. Let’s highlight each factor (dimension) of
service quality, as resulted in the present study, with its implication for the Saudi
Airlines.
Factor 1 – Reliability:
The first factor loaded during the exploratory factor analysis was “reliability” with
10 items. These items resulted with various loadings. The highest being item 11
with the loading of 0.711. Under this item the respondents were asked to rate Saudi
Airline’s right performance of service. It states that, “This airline performs its
service right the first time.” It is important for Saudi airlines to consider the
importance of this particular question, as it has the highest loading. It suggests to
the airline that they should try their best to perform airlines related service right.
The emphasis is not only on doing the service right but also right the very first time.
Previous research also indicates that customer’s tendency to switch a particular
brand increases when the service provider fail to provide the expected service right
in the first encounter.
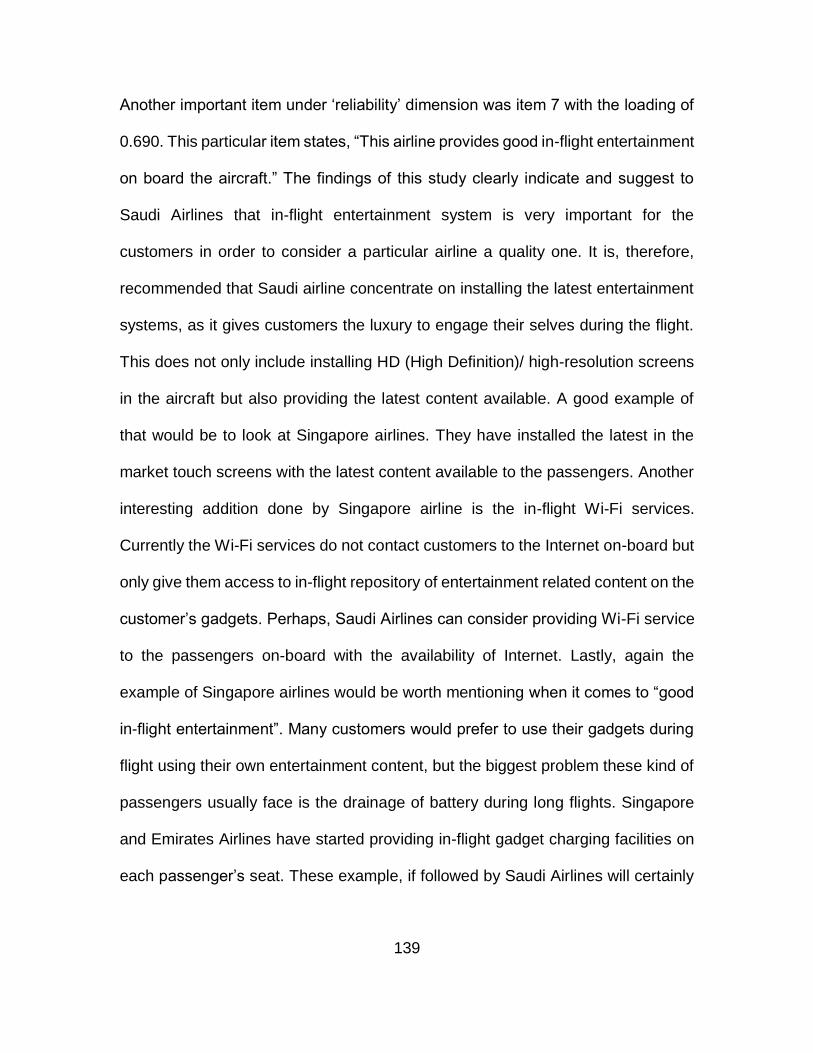
139
Another important item under ‘reliability’ dimension was item 7 with the loading of
0.690. This particular item states, “This airline provides good in-flight entertainment
on board the aircraft.” The findings of this study clearly indicate and suggest to
Saudi Airlines that in-flight entertainment system is very important for the
customers in order to consider a particular airline a quality one. It is, therefore,
recommended that Saudi airline concentrate on installing the latest entertainment
systems, as it gives customers the luxury to engage their selves during the flight.
This does not only include installing HD (High Definition)/ high-resolution screens
in the aircraft but also providing the latest content available. A good example of
that would be to look at Singapore airlines. They have installed the latest in the
market touch screens with the latest content available to the passengers. Another
interesting addition done by Singapore airline is the in-flight Wi-Fi services.
Currently the Wi-Fi services do not contact customers to the Internet on-board but
only give them access to in-flight repository of entertainment related content on the
customer’s gadgets. Perhaps, Saudi Airlines can consider providing Wi-Fi service
to the passengers on-board with the availability of Internet. Lastly, again the
example of Singapore airlines would be worth mentioning when it comes to “good
in-flight entertainment”. Many customers would prefer to use their gadgets during
flight using their own entertainment content, but the biggest problem these kind of
passengers usually face is the drainage of battery during long flights. Singapore
and Emirates Airlines have started providing in-flight gadget charging facilities on
each passenger’s seat. These example, if followed by Saudi Airlines will certainly

140
increase customer’s perception of the quality of service provided by Saudi airlines,
along with its positive impact on satisfaction.
Some other items loaded high on ‘reliability’ factor of service quality were item 9
(When the airline promises to do something by a certain time, it does so), item 13
(The airline maintains error-free records), item 10 (When you have problems, the
airline shows sincere interest in solving it), item 12 (The airline provides its services
at the time it promises to do so), and item 8 (Passengers’ luggage are handled
with care and attention). These items are rated as important by respondents for
Saudi airlines in order to establish “reliability”. The aforementioned items also
suggest many important things to the airlines. For instance, keeping the promise
by an airline with regard to time. In this case, it is suggested to Saudi airline that if
they promise customer to do a particular thing for them, the airlines should take
any steps to ensure that the promises are fulfilled. Similarly, customers’ perception
of service quality reduces with regard to airlines when they repeatedly make errors.
Therefore, it is important for Saudi airline to make sure to maintain an error-free
record in all cases. Another very important point that Saudi airline should consider
is to show keen interest in customers’ problems. When customers have problem
pre or post boarding and the airline shows interest and do efforts to solve that
problem, customer’s perception of service quality increases followed by a positive
impact on satisfaction and loyalty. Lastly, under ‘reliability’ dimension, customers
consider handling of their luggage by an airline as very important. In this case, it is
suggested that Saudi airlines take special measures to guarantee the careful

141
handling of customers’ luggage and if possible personalised attention to each
customer, especially the one with special needs.
Factor 2 – Empathy:
The second factor during exploratory factor analysis was “Empathy”. This factor
emerged with 7 items, comprising of loading as high as 0.763. This highest loading
under ‘empathy’ dimension was for item 28. This item was used to acquire
respondents’ ratings on employees understanding of customer’s needs.
Specifically, it stated, “Employees of the airline understand your specific needs.”
This particular item suggests to Saudi airlines that they should make sure that each
employee tries to understand passenger’s specific needs. Based on this, it is
recommended that Saudi airlines get maximum possible information on customer’s
profiles, in order for them to provide customised services to each passenger. A
simple example of that would be getting information from passengers about the
meals that they prefer. Many airlines even have an in-flight professional chef (a
case of Singapore airlines). Perhaps, Saudi airlines should also take steps to
understand what exactly the passengers’ needs are, so that it can be addressed
successfully.
Another important item with highest loading (0.744) under ‘empathy’ dimension
was item 29, which stated that; “The airline has your best interest at heart”. This
particular question revealed that Saudi airlines should not only try to behave in a

142
positive and favourable manner towards passengers but actually feels at heart the
same way too.
Some other items extracted with high loading were item 27 (The airline has
employees who give you personal attention), item 25 (Personnel working for the
airline put themselves in the place of the passengers when providing service), and
item 24 (Passengers are compensated sufficiently by the airline for any damages
arising from service disruption in the shortest time). These items clearly offer many
recommendations and suggestions to the Saudi airlines. Firstly, employees of
Saudi airlines have to take special care when dealing with customers. A human-
touch is more appreciable than installing automatic kiosks. Passengers have to be
given personal attention, as it is rated as important factor under empathy
dimension. Secondly, employees need to put their selves in the shoes of the
passengers with regard to giving them different types of services. How will they
(employees) want to be treated if they were instead of the passengers? This
particular way of thinking will certainly improve the service provided by these
employees to the customers. Lastly, people often get dis-satisfied when the
promises are not met. This is also true for any type of service industry including
airlines. Saudi airlines have to make sure that in case of service disruption,
customers are compensated appropriately and in the fastest possible way. Many
well-known airlines (e.g., Emirates, Singapore, and Thai) offer various facilities to
the passengers in case of service disruption. Some of these include offering high

143
quality food, Free Internet service, and even high star hotel, in order to reduce
customers’ discontent.
Factor 3 – Assurance:
Assurance is an important dimension of service quality. It is a promise to the
customer that their experience will be exemplary. During the analysis, the present
study emerged with seven items under assurance factor. The highest among these
was item 22 with 0.759 loading. This particular item acquired respondents’
responses on the employee’s courtesy. It was rated as the highest among other
items in the ‘assurance’ dimension. It states that, “Employees of the airline are
consistently courteous with you.” It is recommended that Saudi airline pay attention
to this particular question, as the passengers have an improved perception of
service quality when the employees are repeatedly courteous to them. Emphasis
is also given to the word “consistently”, which means that employees of Saudi
airline have to build a habit of behaving in a courteous manner in order to satisfy
customers.
Another important item under ‘assurance’ dimension that resulted in high loading
(0.734) was item 21. This item enquired about safety with regard to transactions
with the airlines. It states that, “You feel safe in your transactions with the airline.”
The implication of this question for Saudi airline would be; to assure that any
transaction made by the passengers with the airline is safe. The least Saudi
airlines can do is to win customer’s trust, when it comes to safety in transactions.
Due to the growth in information and communication technology, the use of

144
automatic systems have increased dramatically which eventually increased
customer’s worries for safety when using these technologies. The same is true for
airlines as well, where passengers book their tickets online, check-in online, or use
credit or debit cards to buy various airlines’ products. In order to assure quality in
the service, Saudi airline has to take steps to make the customers feel at ease
when doing any sort of transactions with them.
Other important questions under this factor were item 20 (The behaviour of
employees of the airline instils confidence in customers), item 19 (The airline
personnel are experienced and well trained), item 16 (Employees of the airline are
always willing to help you), item 23 (Employees of the airline have the knowledge
to answer your questions), and item 18 (The airline provides its services to your
promptly). The aforementioned questions resulted in various loadings under
empathy factor with many implications to offer to Saudi airlines. For instance,
employees of the Saudi airline have to develop a positive and professional
behaviour because employee’s behaviour delivers a lot of direct and indirect
messages to the customers. Positive behaviour of the employees will build
customer confidence and hence encourage them to travel with the airline.
However, as evident from item 19, experience and training is a must for the
employees to show positive and professional behaviour. It is, therefore,
recommended that Saudi airline pay attention to employees’ training to instil in
them professionalism and positive behaviour. These training will also help the
employees build a culture in the organisation (Saudi airlines) to jump in and offer
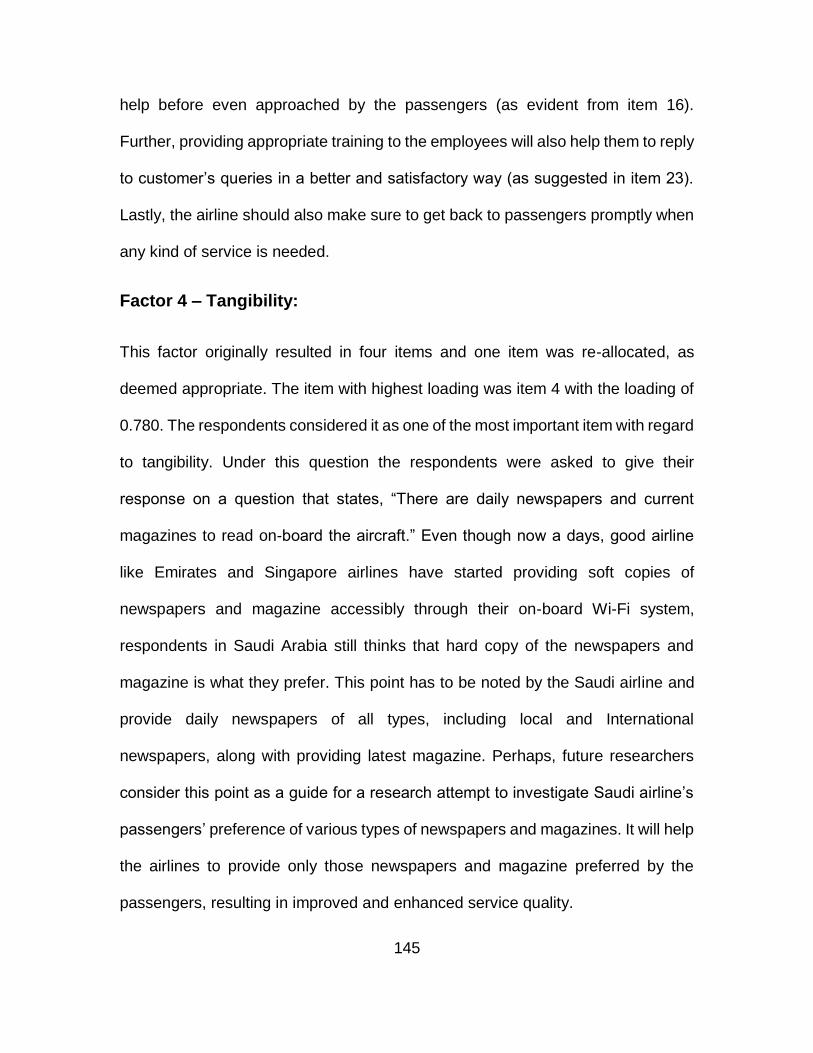
145
help before even approached by the passengers (as evident from item 16).
Further, providing appropriate training to the employees will also help them to reply
to customer’s queries in a better and satisfactory way (as suggested in item 23).
Lastly, the airline should also make sure to get back to passengers promptly when
any kind of service is needed.
Factor 4 – Tangibility:
This factor originally resulted in four items and one item was re-allocated, as
deemed appropriate. The item with highest loading was item 4 with the loading of
0.780. The respondents considered it as one of the most important item with regard
to tangibility. Under this question the respondents were asked to give their
response on a question that states, “There are daily newspapers and current
magazines to read on-board the aircraft.” Even though now a days, good airline
like Emirates and Singapore airlines have started providing soft copies of
newspapers and magazine accessibly through their on-board Wi-Fi system,
respondents in Saudi Arabia still thinks that hard copy of the newspapers and
magazine is what they prefer. This point has to be noted by the Saudi airline and
provide daily newspapers of all types, including local and International
newspapers, along with providing latest magazine. Perhaps, future researchers
consider this point as a guide for a research attempt to investigate Saudi airline’s
passengers’ preference of various types of newspapers and magazines. It will help
the airlines to provide only those newspapers and magazine preferred by the
passengers, resulting in improved and enhanced service quality.
146
One item (i.e., item 2) loaded originally on ‘reliability’ factor but was considered
appropriate to re-allocate it based on the nature of the item. This item states that,
“Food and drink served on the aircraft during the flight are of high quality and
sufficiently varied.” By looking at the question, it clearly indicates that it is a
‘tangibility’ dimension question that is why, it was moved to tangibility factor. Based
on this question, it is recommended to Saudi airline to ensure the high quality of
the food and drinks provided in the aircraft throughout the flight. In many airlines,
it is noticed that during long flights the food and drink provided in the beginning of
the flight is different than that of the middle or later time of the flights. Moreover, in
some airlines it is also observed by the passengers that availability of the food and
drinks are not sufficient and it finishes after few hours of the flight. These things
may result in discontent and customers’ perception of service quality may change.
It is, therefore, recommended that Saudi airline take these points in order to keep
the customers satisfied.
It is also of import for Saudi airlines to take note of two other important items, as
emerged in EFA during the analysis. These items are item 5 (Personnel working
for the airline are neatly dressed) and item 3 (Toilets on board the aircraft are clean
and easy to use). In light of the first item (i.e., item 5), it is recommended that
employees of Saudi airline always dress well and neat. This is considered
important because the outlook of the employees, especially with regard to their
dress up represent Saudi airlines. The next item considered important by the
respondent in terms of service quality was the cleanliness of toilets in the aircraft.

147
Organisation (Saudi airline) should take steps to ensure the cleanliness of the
toilets in the plane along with providing some guidelines on how to use these
toilets. Perhaps, the airline’s personnel should check the toilets after being used
by the passengers. Moreover, it will add value to the overall service provided by
Saudi airline that they also provide various high-class toiletries in the toilets. The
aforementioned steps are very vital to be considered by Saudi airlines, as these
things emerged under tangibility, attesting their visibility unlike other dimensions.
148
Factor 5 – Responsiveness:
During EFA, one item loaded very strongly separately (i.e., item 17). The
researcher keenly observed this question and created a separate dimension for it
with the name of ‘responsiveness’. This item acquired passengers’ responses on
how busy the airline’s staffs is? It states that, “Employees of the airline are never
too busy to respond to your request.” Based on this question, it is recommended
to Saudi airlines to quickly and promptly respond to the passengers’ requests. It
also suggests that the employees should not look too busy and always ensures
their availability in case of customer’s request.
The above recommendations are provided to airlines in general and to Saudi
airlines in particular. These recommendations and suggestions, based on the
findings of the present research, will make the Saudi airlines enhance their quality
of services and eventually positively impact customer satisfaction and loyalty.

149
CHAPTER 6
Conclusion & recommendation
Introduction
This concluding chapter attempts to highlight and summarize the significant
contributions of this study. Specifically, the focus would be on explicating how
each research question is answered by this research. As the main objective of
the present research is to validate the airlines service quality scale following the
step proposed by Parasuraman et al. (1988), an attempt is made to explain how
these steps succeeded in meeting the research questions, designed in the first
chapter. Further, the supported and unsupported causal linkages, as proposed
in the framework of this study, will also be explained. Furthermore, the
contribution of the study to the practice and to the theory will also be explicated.
Lastly, recommendations for future research directions that are potentially
beneficial and practical, as well as, certain limitations of the study will also be
highlighted in the following sections.
6.1 Research questions addressed
As highlighted in chapter 1 of this study, ten research questions were
established. .There is one main question and the rest revolves around that single
question. This question is about the exploration of the dimensions of AIRQUAL
and the subsequent validation, which is followed by its impact on various other
150
proposed variables. The detailed explanation of each research question will be
presented in the following part.
RQ 1: What are the main dimensions of service quality (AIRQUAL) in the
airline industry after validation?
Bari et al. (2001) initially proposed AIRQUAL. The roots from where this
construct was conceptualised is the model of Parasuraman et al. (1988), named,
SERVQUAL. The problem with AIRQUAL was its lack of validity. The original
authors didn’t follow all the steps necessary for the assessment and validation
of the scale, as proposed by Parasuraman et al. (1988). This is why, the present
research considered it imperative to assess and validate the AIRQUAL scale,
so that it can be adopted and applied by researchers and organisations.
Researchers can adopt the AIRQUAL construct, validated in the present
research, and test it in other countries than Saudi Arabia. Similarly,
organisations, particularly the airline industry, can adopt this scale to improve
service quality of their airlines.
After the complete analyses (see chapter 5), a revised new AIRQUAL scale
emerged with five dimensions, namely, Reliability, Empathy, Assurance,
Tangibility and Responsiveness. These findings are aligned with that of the
original SERVQUAL (Parasuraman et al., 1988), as well as, AIRQUAL (Bari et
al., 2001), that also resulted in five dimensions of service quality. However, in
the present study the names of these dimensions are similar to SERVQUAL

151
rather than AIRQUAL. This is due to the suitability of names presented by
Parasuraman et al. (1988) in SERVQUAL with the present research. In the case
of the AIRQUAL the dimensions were: Airport tangibles, Terminal tangibles,
Personnel, Empathy, and Image. Another important difference to mention here
is the number of items in each dimension, in case of AIRQUAL (Bari et al., 2001):
airport tangibles have seven items, terminal tangibles have eleven items,
personnel and empathy have eight items each, and image have four items. But
in case of the present research, the reliability dimension emerged with ten items,
empathy and assurance with seven items each; tangibility with five items and
responsiveness resulted in only one item. This discrepancy is due to the fact
that the service quality scale varies from industry to industry and also from
country to country. The number of dimensions and their subsequent items, as
researched by scholars (see Angur et al., 1999; Babakus and Mangold, 1992;
Carman, 1990; Nadiri and Hussain, 2005), vary significantly. The
aforementioned is aligned with the present study as well, because to the
knowledge of the researcher, a service quality scale has never been validated
or tested in the airline industry. Therefore, the main dimensions of service
quality, more specifically AIRQUAL, in the airline industry of Saudi Arabia are
five.

152
RQ2: What is the impact of airline service quality on customer satisfaction
in the airline industry?
To investigate the impact of airline service quality on customer satisfaction,
regression analysis was conducted. The results revealed that there is indeed a
positively significant impact of service quality on customer satisfaction. It means
that if an airline attempts to improve their quality of services (the dimensions of
service quality proposed in this research), it will in return enhance the
satisfaction level of their customers. This particular finding is also in congruence
with the literature, particularly the benchmarked study for the present research
by Bari et al. (2001). They also found a significantly positive impact of service
quality on customer satisfaction. Moreover, researchers around the globe have
extensively investigated the link between service quality and customer
satisfaction not only in airlines but also other industries, and found positive
significance (see Anand & Selvaraj, 2012; Cronin & Taylor, 1992; Fatima &
Razzaque, 2014; Saleem & Raja, 2014: Sivadas & Baker-Prewitt, 2000).
RQ3: What is the impact of airline service quality on attitudinal loyalty in
the airline industry?
The empirical results exhibit strong support that airline service quality positively
and significantly impacts attitudinal loyalty. It means that improvement in the
service quality by an airline will possibly result in stronger attitudinal loyalty. It is
also supported by the literature (Sivadas & Baker-Prewitt, 2000), where a

153
positive and significant impact of service quality on attitude was found. This
particular finding is imperative for the airline industry because of intensive
competition. If the airline industry can focus on strengthening attitudinal loyalty
of their customers, it will result in customers talking positive about that particular
airline, consequently attracting and acquiring more customers. The investigation
of this question is of import because many previously researchers (see Bei &
Chiao, 2001; Kumar et al., 2010) have studied an indirect effect of service quality
on attitudinal loyalty (through customer satisfaction), but in the present research
an attempt is made to investigate a direct link.
RQ4: What is the impact of airline service quality on repurchase intention
in the airline industry?
Investigating the impact of service quality on repurchase intention was also an
important part of the study, as the same was undertaken by Bari et al. (2001),
using the same but non-validated AIRQUAL scale. The contribution of the
present research is: first the validation of the AIRQUAL scale and then testing
its impact on various envisaged variables. A strong support of the link between
airline service quality and repurchase intentions is found in the present research.
This finding is aligned with the literature, especially with Bari et al. (2001), who
also found a significant impact of service quality on repurchase intentions.
Interesting, Sivadas and Baker-Prewitt (2000) found an impact of service quality
on repurchase intention but through customer satisfaction.
154
RQ5: What is the impact airline service quality on word of mouth in the
airline industry?
To answer this question, analyses were conducted (see chapter 5) and the
results revealed a positive significant impact of airline service quality on word of
mouth. This means that if airlines improve their quality of services, it will possibly
translate into customer talking positively about them. This particular finding is
congruent with previous studies (see Harrison-Walker, 2001), which found a
positive impact of service quality on word of mouth; however, the
aforementioned argued that this link is industry specific. In a similar manner, a
support for the present finding can also be seen in the study of Chaniotakis and
Lymperopoulos (2009), who found a positive impact of service quality on word
of mouth, but through customer satisfaction. In the present research, a
contribution is made to see the direct impact of these variables in the airline
industry, as was found.
RQ6: What is the impact of airline service quality on complaining
behaviour in the airline industry?
The evidence gained from the empirical study showed that airline service quality
has a negative significant effect on complaining behaviour. This means that
improved service quality reduce customer’s complaints. Answer to this question
is obvious because organisations always seek to reduce customer’s complaints.
More complaints from the customer usually means poor quality of the service

155
and may lead to customer dis-satisfaction, eventually resulting in customer’s
defect. In order for the companies, especially airlines, to overcome this issue of
customer’s behaviour toward complaining, steps should be taken to improve
overall service quality.
RQ7: What is the effect of customer satisfaction on attitudinal loyalty in
the airline industry?
Satisfaction of the customers is one of the main objectives of organisations. This
is because customer satisfaction leads to retention and loyalty and ultimately
increased profits. The investigation of the link between customer satisfaction
and attitudinal loyalty, in the present research, was positively significant.
Support for this particular finding can also be found in the literature (e.g.,
Sivadas & Baker-Prewitt, 2000).
RQ8: What is the effect of customer satisfaction on repurchase intention
in the airline industry?
The empirical study provides support that there is a significant impact of
customer satisfaction on repurchase intention. It means that if the airline wants
to attract customers again and again, they should seek to improve their
satisfaction first. This finding is aligned with that of Sivadas and Baker-Prewitt
(2000), who also found a positive significant relationship between customer

156
satisfaction and repurchase. Therefore, the present research concludes that the
effect of customer satisfaction on repurchase intention is positive.
RQ9: What is the effect of customer satisfaction on word of mouth in the
airline industry?
In this study, examining the effect of customer satisfaction on word of mouth
was important, as many other researchers (see e.g., Chaniotakis &
Lymperopoulos, 2009) found the same. The investigation of this question
revealed that if airlines focus on enhancing the satisfaction level of their
customers, it might result in customer talking positive about them. This is
inevitable because of the growth of information technology and social networks,
where customers can spread their views more rapidly and conveniently.
RQ10: What is the effect of customer satisfaction on complaining
behaviour in the airline industry?
The evidence gained from the empirical study showed that customer satisfaction
has a negative impact on complaining behaviour. It means that the more the
customers are satisfied, the less they are going to complain. Interestingly,
previously researchers have focused more on the impact of dis-satisfaction on
complaining behaviour, as is evident from the study of Day (1983). These
previous attempts have been mainly on the extension of the satisfaction models
that integrated complaining behaviour as one of the consequences of
157
dissatisfaction (Halstead & Page, 1992). The finding of the present study is
aligned with the literature (e.g., Bearden & Teel, 1993; Oliver, 1987), where the
negative impact of customer satisfaction on complaining behaviour is
highlighted.
6.2 Significance for theory and practice
The purpose of the study is to develop an understanding of the dimensions of
airline service quality (AIRQUAL) and its relationship to customer satisfaction,
repurchase intention, word of mouth, attitudinal loyalty, and complaining
behaviour. Further, it also attempts to investigate the impact of customer
satisfaction on repurchase intention, word of mouth, attitudinal loyalty, and
complaining behaviour. The findings from this study have implications for both
theory and practice.
6.2.1 Contribution for knowledge
The initiation of service quality research has indeed called for further research.
This is why for many decades’ researchers have been actively researching
service quality and its impact on other variables in many industries.
Parasuraman et al. (1988) introduced SERVQUAL, which opened more doors
for exploring and investigating the dimensions of service quality, as it had many
limitations. Adopting the idea of SERVQUAL, Bari et al. (2001) proposed
AIRQUAL, which was developed for investigating the service quality of airlines.
However, AIRQUAL had one of the major limitations and that was, its lack of
assessment and validity. The present research, therefore, took the same scale

158
further by assessing and validating it. This was done by following a systematic
procedure, as presented by Bari et al. (2001) and Parasuraman et al. (1988).
This is the first and one of the major contributions of the present study to the
body of knowledge by establishing the validity of the service quality scale in the
airline industry and then empirically testing using various recommended tests.
The final validated scale, as developed by this study, can be considered as the
final validated AIRQUAL scale, and perhaps can be adopted by other
researchers.
Another important contribution to the knowledge was the testing of hypotheses.
The results revealed some really interesting and crucial findings. For instance,
the link between service quality (validated one) and other important variables
(customer satisfaction, repurchase intentions, word of mouth, and attitudinal
loyalty, complaining behaviour) is worth mentioning. These linkages have added
to the existing literature on service quality, customer satisfaction, customer
loyalty, and complaining behaviour.
Further, this study has offered methodological contributions; the most significant
is the development of the robust measures of the study. The stringent methods
of assessment and validation were followed, resulting in a very good scale. This
was through establishing the reliability of the scale, as well as, its content,
convergent and discriminant validity. This addition to the knowledge, in the form
of a robust scale, will definitely encourage future researchers to adopt and apply
it in other countries.
159
6.2.2 Implication for practitioners
Organisations around the world struggle to find methods through which they can
improve their quality of service, because it leads to enhanced satisfaction and
loyalty. Alone the measures of service quality are imperative for organisations,
as it tells them to focus on those facets that are critical for success. The same
is true of airline industry too. With the growth of competition in the airline
industry, and the introduction of budget airlines, full-service airlines like Saudi
Airlines, are struggling to find ways to improve their service quality in order to
ensure customer satisfaction and loyalty, along with repeat purchases and
reduced complaints from customers. This present study, therefore, attempted to
come up with a scale that can be adopted by airline industries not only in Saudi
Arabia, but in other countries that share the same traits, and ensure their high
levels of service quality. This in even will increase the satisfaction level of
customers resulting in high levels of loyalty, which eventually will generate
positive word of mouth as well. In this era of stiff competition, the present study
is considered important for practitioners.
6.2.3 Implication for policy-makers
For policy-makers, this study suggests that firstly, the dimensions of service
quality differ in the airline industry from those of other industries, thus
announcing it industry specific and also country specific. It is very important for
the industries to come up with their own service quality scales, or perhaps
validate and test the existing scales available for the respective industries. The

160
present research, therefore, made an attempt to do the same and hence
validated and tested the service quality scale for the airline industry of Saudi
Arabia.
Policy-makers may consider the present study to design strategies for airlines
in Saudi Arabia. Different dimensions of service quality, which resulted in
different scores and strength, may be used to improve the overall quality of
services provided by the respective airlines. Furthermore, different relationship
investigated in the present research may also be kept in mind while making any
policy related to airlines. For instance, this study found that the service quality
of airlines has a significantly positive impact on customer satisfaction. Similarly,
the positive and significant impact of service quality on attitudinal loyalty, word
of mouth and repurchase intentions are also very important and valuable
findings for the policy-makers. Keeping in mind these findings will surely improve
the way various marketing strategies are designed. Lastly, the negative impact
of service quality on complaining behaviour is also imperative and noticeable. It
is because, if the policy-makers want to reduce the customers’ complaints, they
should design the policies focusing mainly on high levels of quality services.

161
6.3 Limitations and directions for future research
As with almost every study, the present study also have some limitations, which
may call for further research in the same area. Firstly, the lack of generalizability
of the findings to other industries is an issue. As the sample was from Saudi
Arabia and the industry researched was airlines, therefore, the findings of this
study may not be of the same value to other industries, as it is for airlines
industry. That is why, it is suggested that future research may use the same
method and come-up with the scales for different industries.
Secondly, the consumer as respondent is another limitation and thus, more
research can be done to identify service quality from the perspective of the
employees of airlines. In addition, a worthy attempt would be to choose non-
consumer (those people who have not yet travelled with any airline) and ask
them what service quality means to them. More importantly, the study would
have greater impact if random sampling or quota sampling method were used
to ensure its generalizability and representativeness.
Thirdly, many important variables from the same model of the study can be used
as mediating or moderating variables. The present study did not consider any
mediating or moderating variables, which in the scope of this study can be a
valuable addition. For instance, impact of service quality on repurchase intention
should be tested with a mediating role of customer satisfaction. Similarly, the
impact of service quality on attitudinal loyalty and word of mouth should also be
tested with a mediating role of variables like customer satisfaction. It is,

162
therefore, recommended that future research may consider using mediating
variables, as highlighted above.
Lastly, the model of the study can be strengthened by incorporating important
variables of trust and perceived value, as these are reported to have significant
impacts on customer satisfaction and loyalty. Future researchers may consider
incorporating these variables in the model of the present study. The present
research is one of the most valuable and unique in the airline industry of Saudi
Arabia and thus substantiates various opportunities for future research.

163
REFERENCES
Al-alak, B. (2009). "Measuring and evaluating business students' satisfaction
perceptions at public and private universities in Jordan", Asian Journal of
Marketing, 3(2): 33-51.
Alexandris, K., Dimitriadis, N., & Markata, D. (2002). Can perceptions of service
quality predict behavioral intentions? An exploratory study in the hotel sector in
Greece. Managing Service Quality , 12 (4), 224-231.
Alotaibi, K. F. (1992) "An empirical investigation of passenger diversity, airline
service quality, and passenger satisfaction". Unpublished PhD thesis, Tempe,
Arizona State University.
Andaleeb, S. S. (1996). Determinants of customer satisfaction with hospitals: a
managerial model. International Journal of Health Care Quality Assurance , 11
(6).
Anderson, E. W., & Mittal, V. (2000). Strengthening the satisfaction-profit chain.
Journal of Service Research , 3 (2), 107-120.
Anderson, E. W., Fornell, C., & Lehmann, D. R. (1994). Customer satisfaction,
market share, and profitability: Findings from Sweden. Journal of Marketing , 58
(3), 53-66.
Anderson, E., & Weitz, B. A. (1989). Determinants of continuity in conventional
industrial channel dyads. Marketing Science , 8 (4), 310-323.
Anderson, J. C., & Narus, J. A. (1990). A Model of Distributor Firm and
Manufacturer firm Working Partnerships. Journal of Marketing , 54 (1), 42-58.

164
Angur, M. G., Nataraajan, R., & Jahera, J. S. (1999). Service quality in the
banking industry: an assessment in a developing economy. The Journal of
Services Marketing , 13 (2), 132-50.
Arnould, E., Price, L., & Zinkhan, G. (2004). Consumers(2nd ed). Boston, MA:
McGraw Hill.
Auh, S., & Johnson, M. D. (2005). Compatibility effects in evaluations of
satisfaction and loyalty. Journal of Economic Psychology , 26 (1), 35-57.
Babakus, E., & Boller, G. W. (1992). An empirical assessment of SERVQUAL
scale. Journal of Business Research , 24 (3), 253-268.
Babakus, E., & Mangold, G. W. (1992). Adapting the SERVQUAL scale to
hospital services: An empirical investigation. Health Services Research , 26 (6),
767-786.
Babakus, E., Bienstock, C. C. and Van Scotter, J. R. (2004), Linking Perceived
Quality and Customer Satisfaction to Store Traffic and Revenue Growth.
Decision Sciences, 35: 713–737.
Balabanis, G., Reynolds, N., & Simintiras, A. (2006). Bases of e-store loyalty:
Perceived switching barriers and satisfaction. Journal of Business Research ,
59 (2), 214-224.
Bari, S., Bavik, A., Ekiz, H. E., Hussain, K. and Toner, S. (2001), "AIRQUAL: A
Multiple-Item Scale for Measuring Service Quality, Customer Satisfaction, and
Repurchase Intention", HOS-414 Graduation Project (Thesis), Gazimagusa:
Eastern Mediterranean University, School of Tourism and Hospitality
Management.

165
Barnes, J. G. (1997). Closeness, strength, and satisfaction: examining the
nature of relationships between providers of financial services and their retail
customers. Psychology and Marketing , 14 (8), 765-790.
Beecham, R., (2009). "Teaching quality and student satisfaction: nexus or
simulacrum?", London Review of Education, 7(2): 135-146.
Bejou, D., Ennew, C. T., & Palmer, A. (1998). Trust, ethics and relationship
satisfaction. The International Journal of Bank Marketing , 16 (4).
Bekhet, H. and B. Al-alak (2011). "Measuring factors affecting the adoption of
E-statement in Malaysia", a paper presented at the 5th International conference
on Services Management, 19-21. Gurgaon, India.
Bendapudi, N., & Berry, L. L. (1997). Customers' motivations for maintaining
relationships with service providers. Journal of Retailing , 73 (1), 15-37.
Beneke, J., Adams, E., Demetriou, O., & Solomons, R. (2011). An exploratory
study of the relationship between store image, trust, satisfaction and loyalty in a
franchise setting. Southern African Business Review , 15 (2), 59-74.
Berry, L. L. (1980). Service Marketing Is Different. Business , 30, 24-29.
Berry, L. L. (1983). Relationship Marketing. In L. L. Berry, G. L. Shostack, & G.
D. Upah (Eds.), Emerging Perspectives on Services Marketing (pp. 25-28).
Chicago: American Marketing Association.
Berry, L. L. (1995). Relationship marketing of services. Growing interest,
emerging perspectives. Journal of Academy of Marketing Science , 23, 236-45.
Bitner, M. J. (1990). Evaluating service encounters: The effects of physical
surroundings and employee responses. Journal of Marketing , 54, 69-82.

166
Bitner, M. J. (1995). Building service relationships: It's all about promises.
Journal of the Academy of Marketing Science , 23, 246-251.
Bitner, M. J., & Mohr, L. A. (1995). The role of employee effort in satisfaction
with service transactions. Journal of Business Research , 32 (3), 239-252.
Bitner, M. J., Booms, B. H., & Mohr, L. A. (1994). Critical service encounters:
The employee's viewpoint. Journal of Marketing, 58, 95-106.
Blackston, M. (1995), "The qualitative dimension of brand equity", Journal of
advertising research, Vol. 35, No. 4, p.RC1-RC7.
Bloemer, J. M., & Kasper, H. D. (1995). The complex relationship between
consumer satisfaction and brand loyalty. Journal of Economic Psychology , 16,
311-329.
Bloemer, J., Ruyter, K., & Peeters, P. (1998). Investigating drivers of bank
loyalty: The complex relationship between image, service quality and
satisfaction. International Journal of Bank Marketing , 16 (7), 276-286.
Bolton, R. N., & Drew, J. H. (1991). A Multistage Model of Customers’
Assessments of Services Quality and Value. Journal of Consumer Research ,
17 (4), 375-384.
Boulding, W., Kalra, A., Staelin, R., & Zeithaml, V. A. (1993). A dynamic process
model of service quality: From expectations to behavioral intentions. Journal of
Marketing Research , 30, 7-27.
Bowen, J. T., & Shoemaker, S. (2003). Loyalty: A strategic commitment. Cornell
Hotel & Restaurant Administration Quarterly , 44 (5/6), 31-46.

167
Brady, M. K., Knight, G. A., Cronin, J. J., Tomas, G., Hult, M., & Keillor, B. D.
(2005). Removing the contextual lens: A multinational, multi-setting comparison
of service evaluation models. Journal of Retailing , 81 (3), 215-230.
Brashear, T. G., Boles, J. S., Bellenger, D. N., & Brooks, C. M. (2003). An
empirical test of trust-building processes and outcomes in sales manager-
salesperson relationships. Journal of Academy of Marketing Science , 31 (2),
189-200.
Buttle, F (1996). SERVQUAL: Review, Critique, Research Agenda, European
Journal of Marketing, 30,1, 8-32.
Caceres, R. C., & Paparoidamis, N. G. (2007). Service quality, relationship
satisfaction, trust, commitment and business to business loyalty. European
Journal of Marketing , 41 (7/8), 836-867.
Carman, J. M. (1990). Consumer perceptions of service quality: an assessment
of the SERVQUAL dimensions. Journal of Retailing , 66, 33-35.
Chaudhuri, A., & Ligas, M. (2007). Understanding the relationship of perceived
merchandise value and willingness to pay a higher price. Conference
proceedings of 2007 AMA winter educators' conference. San Diego, CA:
American Marketing Association.
Chow, S., & Holden, R. (1997). Toward and understanding of loyalty: The
moderating role of trust. Journal of Managerial , 9 (3), 275-297.
Churchill, G. A., & Iacobucci, D. (2005). Marketing Research: Methodological
Foundations (9th ed.). Mason, Ohio: Thomson South-Western.

168
Churchill G. A., Ford N. M., Walker C. O.(1974). "Measuring the Job Satisfaction
of Industrial Salesmen". Journal of Marketing Research, 11(3), 254-260.
Churchill, G. A., & Surprenant, C. (1982). An investigation into the determinants
of customer satisfaction. Journal of Marketing Research , 19, 491-504.
Churchill, G. A., Jr. (1979), “A Paradigm for Developing Better Measures of
Marketing Constructs,” Journal of Marketing Research, 16 (February), 64–73.
Coner, A., & Gungor, M. O. (2002). Factors affecting customer loyalty in the
competitive Turkish metropolitan retial markets. Journal of American Academy
of Business , 2 (1), 189-195.
Cook, D. P., Goh, C., & Chung, C. H. (1999). Service typologies: A state of the
art survey. Production and Operations Management , 8 (3), 318-338.
Creswell, J. W. (2007), Designing and conducting mixed methods research,
Sage, Thousand Oaks, CA.
Cronin, J. J., & Taylor, S. A. (1992). Measuring Service Quality: A
Reexamination and Extension. Journal of Marketing , 56 (3), 55-68.
Cronin, J. J., & Taylor, S. A. (1994). SERVPERF versus SERVQUAL;
Reconciling performance-based and perceptions-minus-expectations
measurement of service quality. Journal of Marketing , 58 (1), 125-131.
Cronin, J. J., Brady, M. K., & Hult, G. T. (2000). Assessing the effects of quality,
value, and customer satisfaction on consumer behavioral intentions in service
environments. Journal of Retailing , 76 (2), 193-218.
Crosby, L., Evans, K., & Cowles, D. (1990). Relationship Quality in Service
Selling: An Interpersonal Influence Perspective. Journal of Marketing , 54 (3),
66-81.

169
Cunningham, L. F., Young C. E., & Lee, M (2004). Perceptions of airline service
quality Pre and Post 9/11. Public works Management & Policy, 9(1), 10-25
Cunningham, R. M. (1956). Brand Loyalty: What, Where, How Much? Harvard
Business Review , 34, 116-128.
Czepiel, J. A. (1990). Service encounters and service relationships: Implications
for research. Journal of Business Research , 20, 13-21.
Dabholkar, P. A., Shepherd, C. D., & Thorpe, D. I. (2000). A comprehensive
framework for service quality: an investigation of critical conceptual and
measurement issues through a longitudinal study. Journal of Retailing , 76 (2),
139-173.
Danaher, J., & Mattsson, J. (1998). A comparison of service delivery processes
of different complexity. International Journal of Service Industry Management ,
9 (1), 48-63.
Day, G. (1969). A two-dimensional concept of brand loyalty. Journal of
Advertising Research , 9 (3), 29-35.
De Vaus, D. (2001). Surveys in Social Research. (5th edition). London:
Routledge.
Dick, A. S., & Basu, K. (1994). Customer Loyalty: Toward an Integrated
Conceptual Framework. Journal of the Academy of Marketing Science , 22 (2),
99-113.
Dixon, J., Bridson, K., Evans, J., & Morrison, M. (2005). An alternative
perspective on relationships, loyalty and future store choice. The International
Review of Retail, Distribution and Consumer Research , 15 (4), 351-374.
170
Dodds, W., & Monroe, K. (1991). Effects of price, brand, and store information
on buyers' product evaluations. Journal of Marketing Research , 28 (3), 307-
320.
Doney, P. M., & Cannon, J. P. (1997). An Examination of the Nature of Trust in
Buyer-Seller Relationships. Journal of Marketing , 61 (2), 35-51.
Donio, J., Massari, P., & Passiante, G. (2006). Customer satisfaction and loyalty
in a digital environment: An empirical test. Journal of Consumer Marketing , 23
(7), 445-457.
Dorsch, M., Swanson, S., & Kelley, S. (1998). The role of relationship quality in
the stratification of vendors as perceived by customers. Journal of the Academy
of Marketing Science , 26 (2), 128-42.
Drew, J. H., & Bolton, R. N. (1987). Service value and its measurement. In C.
Surprenant, Add value to your service (pp. 49-54). Chicago: American Marketing
Association.
Durvasula, S., Lysonski, S., Mehta, S. C., & Tang, B. P. (2004). Forging
relationships with services: The antecedents that have an impact on behavioural
outcomes in the life insurance indsutry. Journal of Financial Services Marketing
, 8 (4), 314-326.
Dwyer, F. R., Schurr, P. H., & Oh, S. (1987). Developing buyer-seller
relationship. Journal of Marketing , 51 (2), 11-27.
Eakuru, N., & Mat, N. K. (2008). The application of structural equation modeling
(SEM) in determing the antecedents of customer loyalty in banks in South
Thailand. The Business Review, Cambridge , 10 (2), 129-139.

171
Eastman, J., R. Iyer and K. Eastman (2011). "Business students' perceptions,
attitudes, and satisfaction with interactive technology: An exploratory study",
Journal of Education for Business, 86: 36-43.
Edvardsson, B., Johnson, M. D., Gustafsson, A., & Strandvik, T. (2000). The
effects of satisfaction and loyalty on profits and growth: Products versus
services. Total Quality Management , 11 (7), 917-927.
Ekinci, Y., Prokopaki, P., & Cobanoglu, C. (2003). Service quality in Cretan
accommodations: marketing strategies for the UK holiday market. International
Journal of Hospitality Management , 22, 47-66.
Ekiz, H. E., Hussain, K., & Bavik, A. (2006). Perceptions of service quality in
North Cyprus national airline. Tourism and Hospitality Industry 2006- New
Trends in Tourism and Hospitality Management, Proceedings of 18th Biennial
International Conference. 03-05, pp. 778-790. Croatia: Faculty of Tourism and
Hospitality Management.
Etherington, L.D. and Var, T. (1984). “Establishing a measure of airline
preference for business and non-business travellers”. Journal of Travel
Research, 22 (4), pp. 22-27.
Fick, G. R., & Ritchie, J. R. B. (1991). Measuring service quality in the travel and
tourism industry. Journal of Travel Research, 30 (Fall), 2-9.
Flint, D., Woodruff, R., & Gardial, S. (2002). Exploring the phenomenon of
customers' desired value change in a business-to-business context. Journal of
Marketing , 66 (4), 102-117.
Fornell, C. (1992). A national customer satisfaction barometer: The swedish
experience. Journal of Marketing , 56 (1), 6-21.
172
Frank, R. E. (1962). Brand choice as a probability process. Journal of Business
, 35(1), 43-56.
Free, C. (2008). Walking the talk? Supply chain accounting and trust among UK
supermarkets and suppliers. Accounting, Organizations and Society , 33 (6),
629-662.
Furer, O., S.H. Liu and D. Sudharshan, (2000). "The relationship between
culture and service quality perceptions: Basis for cross- cultural market
segmentation and resource allocation", Journal of services Research, 2: 355-
371.
Gale, B. (1994). Managing Customer Value. New York: The Free Press.
Ganesan, S. (1994). Determinants of Long-Term Orientation in Buyer-Seller
Relationships. Journal of Marketing , 58, 1-19.
Genzi, P., & Pelloni, O. (2004). The impact of interpersonal relationship on
customer satisfaction and loyalty to the service provider. International Journal of
Service Industry Management , 15 (3/4), 365-384.
Getty, J. M., & Thompson, K. N. (1994). The relationship between quality,
satisfaction, and recommending behaviour in lodging decision. Journal of
Hospitality & Leisure Marketing , 2 (3), 3-22.
Gourdin, K. N. (1988). Bringing quality back to commercial air travel.
Transportation Journal, 27(3), 23-29.
Gourdin, K. N., & Kloppenborg, T. J. (1991). Identifying service gaps in
commercial air travel: The first step toward quality improvement. Transportation
Journal, 31(1),22-30.

173
Gremler, D. D., & Brown, S. W. (1998). The loyalty ripple effect: Appreciating
the full value of customers. International Journal of Service Industry
Management , 10, 271-291.
Gronroos, C. (1983a). Strategic management and marketing in the service
sector. Cambridge, MA: Marketing Science Institute.
Gronroos, C. (1983b). Innovative marketing strategies and organizational
structures for service firms. In L. L. Berry, G. L. Shostack, & G. D. Upah,
Emerging 077perspectives on service marketing (pp. 9-21). Chicago: American
Marketing Association.
Gronroos, C. (1990), Service Management and Marketing, Lexington Books,
Lexington, MA.
Guenzi, P., Johnson, M. D., & Castaldo, S. (2009). A comprehensive model of
customer trust in two retail stores. Journal of Service Management , 20 (3), 290-
316.
Hallowell, R. (1996). The relationships of customer satisfaction, customer
loyalty, and profitability: an empirical study. International Journal of Service
Industry , 7 (4), 27-42.
Ham, C. L. (2003). Service quality, customer satisfaction, and customer
behavioral intentions in higher education. Dissertation Abstracts International.
Han, X., Kwortnik, R. J., & Wang, C. (2008). Service Loyalty: An Integrative
Model and Examination across Service Contexts. Journal of Service Research
, 11 (22).

174
Harris, L. C., & Goode, M. M. (2004). The Four Levels of Loyalty and the Pivotal
Role of Trust: A Study of Online Service Dynamics. Journal of Retailing , 80,
139-158.
Hartman, D. E., & Lindgren, J. H. (1993). Consumer evaluations of goods and
services: Implications for services marketing. The Journal of Services Marketing
, 7 (2).
Heitmann, M., Lehmann, D. R., & Herrmann, A. (2007). Choice goal attainment
and decision and consumption satisfaction. Journal of Marketing Research , 44
(2), 234-250.
Hellier, P. K., Geursen, G. M., Carr, R. A., & Rickard, J. A. (2003). Customer
repurchase intention: A general structural equation model. European Journal of
Marketing , 37 (11/12), 1762-1800.
Hemmasi, M., L. Graf and M. Williams, (1997). "Strategic planning in health care
merging two methodologies", competiveness Review, 7: 38-51.
Henning-Thurau, T., Gwinner, K., & Gremler, D. (2002). Understanding
Relationship Marketing Outcomes, An Intration of Relational Benefits and
Relationship Quality. Journal of Service Research , 4 (3), 230-246.
Heskett, J. L., Earl, S. J., & Christopher, W. L. (1990). Service Breakthroughs:
Changing the rules of the game. New York: The Free Press.
Holbrook, M. B. (1994). The nature of customer value: An axiology of services
in the consumption experience. In T. R. Roland, & L. O. Richard, Service Quality:
New directions in theory and practice (pp. 21-71). Newbury Park, CA: Sage.
175
Homburg, C., & Gierin, A. (2001). Personal characteristics as moderators of the
relationship between customer satisfaction and loyalty - An empirical analysis.
Psychology & Marketing , 18 (1), 43-66.
Hong, S., & Goo, Y. J. (2004). A causal model of customer loyalty in professional
service firms: An empirical study. International Journal of Management , 21,
531-540.
Huang, Y (2009), ‘The effect of airline service quality on passengers’
behavioural intentions using SERVQUAL scores: A Taiwan case study’, Journal
of Eastern Asia Society for Transportation Studies, vol. 8, pp. 2330-2343.
Ittner, C.D. and Larcker, D.F. (1998), "Are non-financial measures leading
indicators of financial performance? An analysis of customer satisfaction",
Journal of Accounting Research, Vol. 36 (supplement).
Jacoby, J. (1971). A model of multi-brand loyalty. Journal of Advertising
Research , 11, 25-31.
Jacoby, J., & Chesnut, R. W. (1978). Brand Loyalty: Measurement and
Management. New York, NY: John Wiley.
Jayasundra, C., P. Ngulube and M. Minish-Majanja, (2009). "A theoretical model
to predict customer satisfaction in relation to service quality in selected
university libraries in Sri Lanka", SA Jnl Libs & Info. Sci,75(2): 179-192.
Johnson, J. T., Barksdale, H. C., & Boles, J. S. (2001). The Strategic Role of the
Salesperson in Reducing Customer Defection in Business Relationships.
Journal of Personal Selling and Sales Management , 21 (2), 123-134.
176
Johnson, M. D., Gustafsson, A., Andreassen, T. W., Lervik, L., & Cha, J. (2001).
The Evolution and Future of National Customer Satisfaction Index Models.
Journal of Economic Psychology , 22 (2), 217-245.
Johnson, M. D., Herrmann, A., & Huber, F. (2006). The Evolution of Loyalty
Intentions. Journal of Marketing , 70, 122-132.
Julander, C. R., Soderlund, M., & Soderberg, R. (2003). Effects of switching
barriers on satisfaction, repurchase intentions and attitudinal loyalty. SSE/EFI
Working Paper Series in Business Administration .
Julander, C., Magi, A., Jonsson, J., & Lindqvist, A. (1997). Linking customer
satisfaction to financial performance data. In Edvardsson, Advancing Service
Quality: A Global Perspective (pp. 301-310). Sweden: University of Karlstad.
Kandampully, J. (2002). Innovation as the core competency of a service
organisation: the role of technology, knowledge and networks. European
Journal of Innovation Management , 5 (1), 18-26.
Kandampully, J., & Suhartanto, D. (2000). Customer loyalty in the hotel industry:
the role of customer satisfaction and image. International Journal of
Contemporary Hospitality Management , 12 (6), 346-351.
Kanning, U. and N. Bergmann, (2009). "Prediction of customer satisfaction:
testing the classical paradigms", Managing Service Quality, 19(2): 377-390.
Karatepe, O. M., & Avci, T. (2002). Measuring service quality in the hotel
industry: evidence from Northern Cyprus. Anatolia: An International Journal of
Tourism and Hospitality Research , 13 (1), 19-32.
177
Kim, M. K., Park, M. C., & Jeong, D. H. (2004). The effects of customer
satisfaction and switching barrier on customer loyalty in Korean mobile
telecommunication services. Telecommunications Policy , 28 (2), 145-159.
Kleijnen, M., Ruyter, K., & Wetzels, M. (2007). An assessment of value creation
in mobile service to delivery and the moderating role of time consciousness.
Journal of Retailing , 83 (1), 33-46.
Klemperer, P. (1987). Market with consumer switching costs. The Quarterly
Journal of Economics , 102, 375-394.
Kotler, P. (2003). Marketing Management (11th ed.). Upper Saddle River. NJ:
Pearson Educations.
Lawrence, R. J. (1969). Patterns of buyer behavior: Time for a new approach.
Journal of Marketing Research , 6, 137-144.
Lee, W.-I., Chen, C.-W., Chen, T.-H., & Chen, C.-Y. (2010). The relationship
between consumer orientation, service value, medical care service quality and
patient satisfaction: The case of a medical center in Southern Taiwan. African
Journal of Business Management , 4 (4), 448-458.
Levitt, T. (1960). Marketing myopia. Harvard Business Review , 38, 45-56.
Lewis, B.R. (1993), “Service quality measurement”, Marketing Intelligence and
Planning, Vol. 11, No. 4, pp. 4-12.
Lewis. R. C., & Booms, B. H. (1983). The Marketing Aspects of Service Quality.
In Berry, L., Shostack, G., & Upah, G. (Eds.). Emerging Perspectives on Service
Marketing. Chicago, IL: American Marketing, 99-107.

178
Liang, C. J., & Wang, W. H. (2004). Attributes, benefits, customer satisfaction
and behavioral loyalty- an integrative research of financial service industry in
Taiwan. Journal of Services Research , 4 (1), 57-91.
Lovelock, C., Gummesson, E. (2004), "Whither services marketing? In search
of a new paradigm and fresh perspectives", Journal of Service Research, Vol. 7
No.No. 1, August, pp.20-41.
Macintosh, G., & Lockshin, L. (1997). Retail relationships and store loyalty: A
multi-level perspective. International Journal of Research in Marketing , 14 (5),
487-497.
MacKay, K. J., & Crompton, J. L. (1988). A conceptual model of consumer
evaluation ofrecreation service quality. Leisure Studies, 7, 41–49.
Maditions, D. and K. Theodoridis, (2010). "Satisfaction determinants in the
Greek online shopping context", Information Technology & People, 23(4): 312-
329.
Malhotra, N. K. (2008). Marketing Research: An Applied Orientation, 5/e. Pearson
Education India.
Maffei, R. B. (1960). Brand preference and simple Markov Process. Operation
Research , 8, 210-218.
McCole, P. (2002). The role of trust for electronic commerce in service.
International Journal of Contemporary Hospitality Management , 14 (2), 81-87.
McConnell, J. D. (1968). The development of brand loyalty: An experimental
study. Journal of Marketing Research , 5, 13-19.
McDaniel, C. & Gates, R. 1999. Contemporary marketing research. 4th
Edition. South Western University Publications: Cincinnatti.

179
McDougall, G. H., & Levesque, T. (2000). Customer satisfaction with services:
putting perceived value into the equation. Journal of Services Marketing , 14,
392-410.
McLuhan, M. (1964). Understanding Media. New York, US: McGraw-Hill.
Micuda, D. and G. Cruceru, (2010). "Testing SERVQUAL dimensions on the
Romanian banking sector", Proceedings of the International Conference on Risk
Management, Assessment and Mitigation.
Mittal, V., & Kamakura, W. A. (2001). Satisfaction, repurchase intent, and
repurchase behavior: Investigating the moderating effect of customer
characteristics. Journal of Marketing Research , 38 (1), 131-142.
Moller, K., & Halinen, A. (2000). Relationship marketing theory: its roots and
direction. Journal of Marketing Management , 16, 29-54.
Moorman, C., Deshpande, R., & Zaltman, G. (1992). Relationships Between
Providers and Users of Marketing Research: The Dynamics of Trust within and
Between Organizations. Journal of Marketing Research , 29, 314-29.
Moorman, C., Deshpande, R., & Zaltman, G. (1993). Factors Affecting Trust in
Market Research Relationships. Journal of Marketing , 57, 81-101.
Morgan, R. M., & Hunt, S. D. (1994). The commitment-trust theory of relationship
marketing. Journal of Marketing , 58 (3), 20-38.
Morgan, D. L. (1997), Focus groups as qualitative research, (2nd ed), Sage
Publications, Thousand Oaks, CA.
Morganosky, M. A., & Cude, B. J. (1999). Trust, loyalty, and food retailers: The
consumer perspective. 1999 Agribusiness Forum Papers. Agribusiness Forum
in Florence, Italy: IAMA.

180
Munteanu, C., C. Ceobanu, C. Bobalca and O. Anton, (2010). "An analysis of
customer satisfaction in a higher education context", International Journal of
Public Sector Management, 23(2): 124-140.
Nadiri, H., & Hussain, K. (2005). Diagnosing the zone of tolerance for hotel
services. Managing Service Quality , 15 (3), 259-277.
Nadiri, H., Hussain, K., Ekiz, E. H. Erdogan S. (2008). An investigation on the
factors influencing passengers‟ loyalty in the North Cyprus national airline. The
TQM Journal. Vol. 20 (3), 265-280
Oh, H. (1999). Service quality, customer satisfaction and customer value: A
holistic perspective. International Journal of Hospitality Management , 18, 67-
82.
Oliver, R. I. (1999). Whence consumer loyalty? Journal of Marketing , 63, 33-
44.
Oliver, R. L. (1980). A cognitive model of the antecedents and consequences of
satisfaction decisions. Journal of Marketing Research , 17 (4), 460-469.
Oliver, R. L. (1993). Cognitive, affective, and attribute bases of the satisfaction
response. Journal of Consumer Research , 20 (3), 418-430.
Oliver, R. L. (1997). Satisfaction: A behavioral Perspective on the
Consumer.NewYork: McGraw-Hill.
Olsen, L. L., & Johnson, M. D. (2003). Service equity, satisfaction, and loyalty:
From transaction-specific to cumulative evaluation. Journal of Service Research
, 5 (3), 184-195.
Olsen, S. O. (2007). Repurchase loyalty: The role of involvement and
satisfaction. Psychology & marketing , 24 (4), 315-341.

181
Orth, U. R., & Green, M. T. (2009). Consumer loyalty to family versus non-family
business: The roles of store image, trust and satisfaction. Journal of Retailing
and Consumer Services , 16 (4), 248-259.
Parasuraman, A. L., Zeithaml, V. L., & Berry, L. L. (1985). A conceptual model
of service quality and its implications for future research. Journal of Marketing ,
49, 41-50.
Parasuraman, A., Zeithaml, V. A., & Berry, L. L. (1988). SERVQUAL: A multiple
item scale for measuring consumer perceptions of service quality. Journal of
Retailing , 64, 12-40.
Parasuraman, A., Zeithaml, V. A., & Berry, L. L. (1990). Moving Forward in
Service Quality Research: Measuring Different Customer Expectation Levels,
Comparing Alternative Scales, and Examining the Performance-Behavioral
Intentions Link. MSI Report, 94-114.
Parasuraman, A., Zeithaml, V. A., & Berry, L. L. (1994). Reassessment of
expectations as a comparison standards in measuring service quality:
Impliactions for future research. Journal of Marketing , 58, 111-124.
Parasuraman, Berry and Zeithaml, "Refinement and Reassessment of the
SERVQUAL Scale," Journal of Retailing, Winter (1991), pp. 420-50.
Patterson, P. G., & Spreng, R. A. (1997). Modeling the Relationship Between
Perceived Value, Satisfaction and Repurchase Intentions in a Business-to-
Business, Services Context: An Empirical Examination. International Journal of
Service Industry Management , 8 (5), 414-434.

182
Ping, R. A. (1993). The Effects of Satisfaction and Structural Constraints on
Retailer Exiting, Voice, Loyalty, Opportunism, and Neglect. Journal of Retailing
, 69 (3), 320-352.
Preis, M. W. (2003). The impact of interpersonal satisfaction on repurchase
decisions. Journal of Supply Chain Management , 39 (3), 30-38.
Ravald, A., & Gronroos, C. (1996). The value concept and relationship
marketing. European Journal of Marketing , 30 (2), 19-30.
Reichheld, F. F. (1996). Learning from customer defection. Harvard Business
Review , 74 (2), 56-67.
Reichheld, F. F., & Sasser, W. E. (1990). Quality comes to services. Harvard
Business Review , 68 (5), 105-111.
Reichheld, F. F., Markey, R. G., & Hopton, C. (2000). The loyalty effect- the
relationship between loyalty and profits. European Business Journal , 12 (3),
134-139.
Rust, R. T., & Oliver, R. L. (1994). Service quality: Insights and managerial
implications from the frontier. In R. T. Rust, & R. L. Oliver, Service quality: New
directions in theory and practice (pp. 1-19). Thousand Oaks, CA, USA: Sage
Publications.
Rust, R. T., & Zahorik, A. J. (1993). Customer satisfaction, customer retention,
and market share. Journal of Retailing , 62 (2), 193-215.
Saxe, Robert, and Barton A. Weitz (1982). "The SOCO Scale: A Measure of the
Customer Orientation of Salespeople." Journal of Marketing Research, 19, (3),
343-351.

183
Schneider, B., & White, S. S. (2004). Service Quality: Research perspectives.
California: Sage Publications.
Selnes, F. (1998). Antecedents and Consequences of Trust and Satisfaction in
Buyer-Seller Relationship. European Journal of Marketing , 32 (3/4), 305-322.
Singh, J., & Sirdeshmukh, D. (2000). Agency and Trust Mechanisms in
Consumer Satisfaction and Loyalty Judgements. Journal of the Academy of
Marketing Science , 28 (1), 150-167.
Sirdeshmukh, D., Singh, J., & Sabol, B. (2002). Consumer Trust, Value, and
Loyalty in Relational Exchanges. Journal of Marketing , 66, 15-37.
Soderlund, M., & Vilgon, M. (1999). Customer satisfaction and links to customer
profitability: An empirical examination of the association between attitudes and
behavior. SSE/EFI Working Paper Series in Business Administration, (pp. 1-21).
Strauss, B., & Neuhaus, P. (1997). The qualitative satisfaction model.
International Journal of Service Industry Management , 9 (2), 169-188.
Suh, J. C., & Yi, Y. (2006). When brand attitudes affect the customer
satisfaction-loyalty relation: The moderating role of product involvement. Journal
of Consumer Psychology , 16 (2), 145-155.
Suprenant, C. F., & Soloman, M. R. (1987). Predictability and Personalization in
the Service Encounter. Journal of Marketing , 51, 86-96.
Susskind, A. M. (2002). I told you so! Restaurant customers' word-of-mouth
communication patterns. Cornell Hotel and Restaurant Quarterly , 43(2), 75-85.
Swan, J. E., & Trawick, F. I. (1981). Disconfirmation of Expectations and
Satisfaction with a Retail Service. Journal of Retailing , 57 (3), 49-67.

184
Swan, J. E., Bowers, M. R., & Richard, L. D. (1999). Customer trust in the
salesperson: an integrative review and meta-analysis of the empirical literature.
Journal of Business Research , 44 (2), 93-107.
Sweeney, J. C., & Soutar, G. N. (2001). Consumer perceived value: The
development of a multiple item scale. Journal of Retailing , 77 (2), 203-220.
Sweeney, J. C., Soutar, G. N., & Johnson, L. W. (1999). The role of perceived
risk in the quality-value relationship: A study in a retail environment. Journal of
Retailing , 75 (1), 77-105.
Neuman, W.L (1997), Social Research Method Qualitative and Quantitative
Approaches, 3rd ed, Allyan and Bacon, Boston, MA.
Flick, U. (1998). An ?Introduction to Qualitative Research, Saga Publications,
London.
Szymanski, D. M., & Hernard, D. H. (2001). Customer satisfaction: A meta-
analysis of the empirical evidence. Journal of the Academy of Marketing Science
, 29 (1), 16-35.
Taylor, S. A., & Baker, T. L. (1994). An Assessment of the Relationship Between
Service Quality and Customer Satisfaction. Journal of Retailing , 70 (2), 163-
178.
Teas, R. K. (1993). Expectations, performance evaluation, and consumers'
perception of quality. Journal of Marketing , 57 (10), 18-34.
Tucker, W. T. (1964). The Development of brand loyalty. Journal of Marketing
Research , 1, 32-35.
185
Yu, Y. T., & Dean, A. (2001). The contribution of emotional satisfaction to
consumer loyalty. International Journal of Service Industry Management , 12
(3/4), 234-250.
Zeithaml, V. A. (1981). How consumer evaluation processes differ between
goods and services. In J. H. Donnelly, & W. R. George, Marketing of services.
Chicago, IL: American Marketing Association.
Zeithaml, V. A. (1988). Consumer perceptions of price, quality and value: A
means-end model and synthesis of evidence. Journal of Marketing , 52, 2-22.
Zeithaml, V. A. (2000). Service Quality, Profitability, and the Economic Worth of
Customers: What we Know and What We Need to Learn. Journal of the
Academy of Marketing Science , 28 (1), 67-85.
Zeithaml, V. A., Barry, L. L., & Parasuraman, A. (1996). The Behavioral
Consequences of Service Quality. Journal of Marketing , 60 (2), 31-46.
Zeithaml, V. A., Berry, L. L., & Parasuraman, A. (1993). The nature and
determinants of customer expectations of service. Academy of Marketing
Science , 21 (1), 1-13.
Zeithaml, V. A., Parasuraman, A., & Berry, L. L. (1985). Problems and Strategies
in Services Marketing. Journal of Marketing , 49 (2), 33-46.
Zeithaml, Valarie A. (1984), "Issues in Conceptualizing and Measuring
Consumer Response to Price," Advances in Consumer Research, Volume 11,
T. C. Kinnear (Ed.),628-63

Measuring Service Quality, Customer satisfaction and Loyalty in Airline Industry
186 Cranfield University
APPENDICES
APPENDIX A: Previous research in measuring service quality.
Study Instrument Sector Focus Analysis Factor Structure
Andaleeb (2001) 25 items Health in
Bangladesh Gap scores
Exploratory
factor
Five factors. Some are related to SERVQUAL dimensions,
some are completely different
Bouman and Van der Wiele
(1992) 33 items Car service Gap scores
Exploratory
factor
Five factors extracted. Three were meaningful.
Without any extractions, 12 factors were found (item loading
>0.40)
Babakus and Mangold (1992) Original
SERVQUAL items Health
Expectations Exploratory
factor
Unidimensional
Performance Unidimensional
Gap scores No meaningful factor structure
Expectations Confirmatory
(Lisrel)
Five dimensions are extracted under one factor,
which is some for performance dimensions Performance
Gagliano and Hathcote (1994) Original
SERVQUAL items Retail Gap scores
Exploratory
factor Four factors were extracted
Markovic (2006) 40 items Higher education Expectations Exploratory
factor
Seven factors with 26 items.
Five original SERVQUAL dimension plus two sector-specific
dimensions
Cronin and Taylor (1992) Original
SERVQUAL items
Banks, pest control, dry
cleaning,
fast food
Gap scores Confirmatory
(Lisrel) Not confirmed in any sector
Gap,
Performance
Exploratory
factor Unidimensional factor structure
Gap,
Performance
Confirmatory
factor
SERVQUAL is confirmed in two industries
SERFPERF is confirmed in all four industries
Smith, Smith and Clarke
(2007)
Original
SERVQUAL items
Higher education
IT service department Expectations
Confirmatory
factor Four factors were extracted
Source: Bayraktaroglu et al. (2010, p.50)

Measuring Service Quality, Customer satisfaction and Loyalty in Airline Industry
187 Cranfield University
APPENDIX B: Literature Linking Quality, Value, and Satisfaction to various
Service Encounter Outcomes
Source
Relevant Constructs
Link(s) to
Outcomes
Empirically
Tested
Parasuraman, Zeithaml, and Berry
(1988)
SQ,BI SQ Yes
Parasuraman, Berry, and Zeithaml
(1991)
SQ,BI SQ Yes
Anderson and Sullivan (1993) SQ,SAT,BI SQ,SAT Yes
Boulding et al. (1993) SQ,BI SQ Yes
Taylor and Baker (1994) SQ,SAT,BI SQ Yes
Zeithaml, Berry, and Parasurman (1996) SQ,BI SQ Yes
Taylor (1997) SQ,SAT,BI SQ,SAT Yes
Athanassopoulos (2000) SAC,SQ,SAT,BI SQ Yes
Cronin and Taylor (1992) SQ,SAT,BI SAT Yes
Anderson and Fornell (1994) SQ,SAT SAT No
Gotlieb, Grewal, and Brown (1994) SQ,SAT,BI SAT Yes
Ostrom and Iacobucci (1995) SAC,SQ,SAT,VAL,BI SAT Yes
Fornell et al. (1996) SQ,SAT,SV,BI SAT Yes
Patterson and spreng (1997) SAT,SV,BI SAT Yes
Hallowell (1996) SAT,BI SAT Yes
Andreassen (1998) SQ,SAT,SV,BI SAT Yes
Bolton (1998) SAT,BI SAT Yes
Chenet, Tynan, and Money (1999) SQ,SV,SAT,BI SAT No
Oliver (1999) SAT,BI SAT No
Garbarino and Johnson (1999) SAT,BI SAT Yes
Bolton and Lemon (1999) SAT,BI SAT Yes
Bernhardt, Donthu, and Kennett (2000) SAT,BI SAT Yes
Ennew and Binks (1999) SQ,SV,SAT,BI SAT,SV Yes
Zeithaml (1988) SAC,SQ,SV,BI SV No
Bolton and Drew (1991) SQ,SAT,SV,BI SV No
Gale (1994) SQ,SV,BI SV No
Chang and Wildt (1994 ) SAC,SQ,SV,BI SV Yes
Hartline and Jones (1996) SQ,SV,BI SV Yes
Wakefield and Barnes (1996) SQ,SV,BI SV Yes
Cronin et al. (1997) SAC,SQ,VAL,BI SV Yes
Sirohi, McLaughlin, and Witting (1998) SAC,SQ,SV,BI SV Yes
Sweeney, Soutar, and Johnson (1999) SAC,SQ,SV,BI SV Yes
Source: Cronin et al. (2000, p.197).

Measuring Service Quality, Customer satisfaction and Loyalty in Airline Industry
188 Cranfield University
APPENDIX C: The SERVQUAL Instrument
DIRECTIONS: This survey deals with your opinions of __________ services.
Please show the extent to which you think firms offering _________ services should
possess the features described by each statement. Do this by picking one of the
seven numbers next to each statement. If you strongly agree that these firms should
posses a feature, circle the number 7. If you strongly disagree that these firms
should possess a feature, circle 1. If your feelings are not strong, circle one of the
numbers in the middle. There are no right or wrong answers – all we are interested
in is a number that best shows your expectations about the firms offering ________
services.
E1. They should have up-to-date equipment. E2. Their physical facilities should be visually appealing. E3. Their employees should be well dressed and appear neat. E4. The appearance of the physical facilities of these firms should be in keeping with the
type of services provided. E5. When these firms promise to do something by a certain time, they should do so. E6. When customers have problems, these firms should be sympathetic and reassuring. E7. These firms should be dependable E8. They should provide their services at the time they promise to do so. E9. They should keep their records accurately. E10. They shouldn’t be expected to tell customers exactly when services will be
performed.( − )b E11. It is not realistic for customers to expect prompt service from employees of these
firms. ( − ) E12. Their employees don’t always have to be willing to help customers. ( − ) E13. It is okay if they are too busy to respond to customer requests promptly. ( − ) E14. Customers should be able to trust employees of these firms. E15. Customers should be able to feel safe in their transactions with these firms’
employees. E16. Their employees should be polite. E17. Their employees should get adequate support from these firms to do their jobs well. E18. These firms should not be expected to give customers individual attention. ( − ) E19. Employees of these firms cannot be expected to give customers personal attention.(
−) E20. It is unrealistic to expect employees to know that the needs of their customers are.(
− ) E21. It is unrealistic to expect these firms to have their customers’ best interests at
heart.(−) E22. They shouldn’t be expected to have operating hours convenient to all their
customers. ( − )

Measuring Service Quality, Customer satisfaction and Loyalty in Airline Industry
189 Cranfield University
DIRECTIONS: The following set of statements relate to your feelings about XYZ.
For each statement, please show the extent to which you believe XYZ has the
feature described by the statement. Once again, circling a 7 means that you strongly
agree that XYZ has that feature, and circling a 1 means that you strongly disagree.
You may circle any of the numbers in the middle that show how strong your feelings
are. There are no right or wrong answers – all we are interested in is a number that
best shows your perceptions about XYZ.
P1. XYZ has up-to-date equipment.
P2. XYZ’s physical facilities are visually appealing.
P3. XYZ’s employees are well dressed and appear neat
P4. The appearance of the physical facilities of XYZ is in keeping with the type of
services provided.
P5. When XYZ promises to do something by a certain time, it does so.
P6. When you have problems, XYZ is sympathetic and reassuring.
P7. XYZ is dependable
P8. XYZ provides its services at the time it promises to do so.
P9. XYZ keeps its records accurately.
P10. XYZ does not tell customers exactly when services will be performed. ( − )
P11. You do not receive prompt service from XYZ’s employees. ( − )
P12. Employees of XYZ are not always willing to help customers. ( − )
P13. Employees of XYZ are too busy to respond to customer requests promptly. ( − )
P14. You can trust employees of XYZ.
P15. You feel safe in your transactions with XYZ’s employees.
P16. Employees of XYZ are polite.
P17. Employees get adequate support from XYZ to do their jobs well.
P18. XYZ does not give you individual attention. ( − )
P19. Employees of XYZ do not give you a personal attention. ( − )
P20. Employees of XYZ do not know what your needs are. ( − )
P21. XYZ does not have your best interests are heart. ( − )
P22. XYZ does not have operating hours convenient to all their customers. ( − )
*b) rating on these statements were reverse-scored prior to data analysis.
Source: Parasuraman, A., Zeithaml V., Berry, L. L., (1988, p.38-40).

Measuring Service Quality, Customer satisfaction and Loyalty in Airline Industry
190 Cranfield University
APPENDIX D: Focus Group Recruitment Notice.
Focus Groups recruitment Notice
Volunteers needed!
We’re looking for airline customers to participate in a Focus
Group interview
We’d like you to participate in a group discussion on how to improve
airline service quality.
You must be:
A current or recent airline customer (at least you have used an
airline service within the last 6 months)
Compensation for your time is available.
For further details contact
07889017784
Or
E-mail: [email protected]

Measuring Service Quality, Customer satisfaction and Loyalty in Airline Industry
191 Cranfield University
APPENDIX D.1: Focus group Recruitment notice in Milton Keynes
newspaper.

Measuring Service Quality, Customer satisfaction and Loyalty in Airline Industry
192 Cranfield University
APPENDIX D.2: Focus group Recruitment notice in Bedfordshire newspaper.
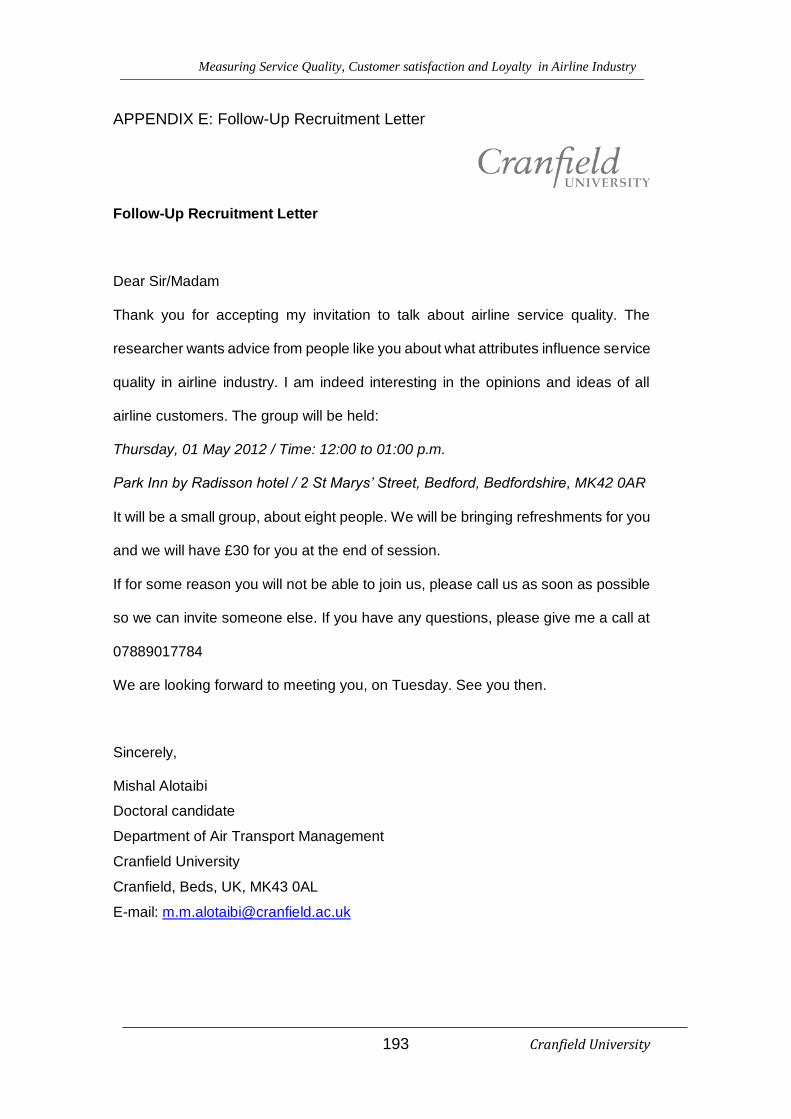
Measuring Service Quality, Customer satisfaction and Loyalty in Airline Industry
193 Cranfield University
APPENDIX E: Follow-Up Recruitment Letter
Follow-Up Recruitment Letter
Dear Sir/Madam
Thank you for accepting my invitation to talk about airline service quality. The
researcher wants advice from people like you about what attributes influence service
quality in airline industry. I am indeed interesting in the opinions and ideas of all
airline customers. The group will be held:
Thursday, 01 May 2012 / Time: 12:00 to 01:00 p.m.
Park Inn by Radisson hotel / 2 St Marys’ Street, Bedford, Bedfordshire, MK42 0AR
It will be a small group, about eight people. We will be bringing refreshments for you
and we will have £30 for you at the end of session.
If for some reason you will not be able to join us, please call us as soon as possible
so we can invite someone else. If you have any questions, please give me a call at
07889017784
We are looking forward to meeting you, on Tuesday. See you then.
Sincerely,
Mishal Alotaibi
Doctoral candidate
Department of Air Transport Management
Cranfield University
Cranfield, Beds, UK, MK43 0AL
E-mail: [email protected]

Measuring Service Quality, Customer satisfaction and Loyalty in Airline Industry
194 Cranfield University
APPENDIX F: Focus group questions
Focus Group Questions
I. Introduction ( 5 Minutes)
1. The welcome
“Good afternoon and welcome. Thanks for taking the time to join our
discussion of airplane travel. My name is Mishal Alotaibi and I am full-
time PhD student at Cranfield University.”
2. Overview of topic
“You have invited because you are all airline customers and you have
all flown at least twice in the last six months. I want to tap into those
experience and your opinions about airline services.”
3. Ground rules
“There are no right or wrong answers. I expect that you will have
differing point of view. Please feel free to share your point of view even
if it differs from what others have said.”
“I am recording the session because I do not want to miss any of your
comments.
No names will be included in any reports. Your comments are
confidential.”
“We have name tents here in front of us. They help me remember
names, but they can also help you. Don’t feel like you have to respond
to me all the time. If you want to follow up on something that someone
has said, you want to agree or disagree, or give an example, feel free
to do that. Feel free to have a conversation with one another about
these questions. I am here to ask questions, listen and make sure
everyone has a chance to share. I am interesting in hearing from each
of you. So if you are talking a lot, I may call on you to give others a
chance. And if you are not saying much I may call on you. I just want
to make sure all of you have a chance to share your ideas.”

Measuring Service Quality, Customer satisfaction and Loyalty in Airline Industry
195 Cranfield University
“If you have a cell phone please put it on the quiet mode, and if you
need to answer step out to do so. Feel free to get up and get more
refreshments if you would like.”
II. Questions for quality of Airline Services (50 Minutes)
4. Opining Question ( 10 Minutes)
“Let’s begin. Let’s find out more about each other by going around the
table one at time. Tell us your name and some of the places that you
have flown to in last six months.”
5. Introductory Questions (5 Minutes)
What qualities do you think are necessary to make a success
of your airline?
6. Transition Questions (5 Minutes)
Think back to when you last travelled with an airline provider.
What were your first impressions?
7. Key Questions (30 Minutes)
How do you feel about the quality of service of the airline you
dealt with?
a. Compare with other airline service that you have received.
b. What was particularly helpful about the services you
received?
c. What was particularly frustrating/bad about the services you
received?
d. What do you expect to get from the airline company in terms
of service quality?
e. To you, what is the most important component in terms of
service quality?
f. Despite partial satisfaction, why don’t you switch the airline
service company?

Measuring Service Quality, Customer satisfaction and Loyalty in Airline Industry
196 Cranfield University
g. Do you recommend the airline company you used to your
friends?
h. In the future, what kinds of service do you expect?
II. Closing ( 5 minutes )
8. Closing/ Ending Questions
If you had a chance to give advice to the airline providers, what
advice would you give?
We want to know how to improve the airline service quality, is
there anything that we missed? Is there anything that you came
wanting to say that you didn’t get a chance to say?
Thanks for your valuable contribution.

Measuring Service Quality, Customer satisfaction and Loyalty in Airline Industry
197 Cranfield University
APPENDIX G: Participant consent form
Please tick each box to confirm that you have read and understood each section of the form:
I, _________________________________ (please print your name in block capitals) confirm that I have volunteered to participate in the project by taking part in a workshop discussion as described to me.
I understand that the discussions will be audio recorded and transcribed for analysis. The analysis will be only used to develop operational procedures and for no other purposes. Any results submitted within the final report to the client will not be available to me for commercial reasons.
I understand that the audio recordings and transcriptions will be stored at
Cranfield University in accordance with the Data Protection Act (1998).
I understand that my confidentiality and anonymity are assured as all personal information that I provide will be treated with the strictest confidence. It will not be possible to identify any specific individual from the final report produced for the client.
I undertake to respect the confidentiality of the others partaking in the
workshops by not discussing comments made outside of the room.
I understand that I am free to withdraw from project at any stage simply by informing a member of the research team. I also understand that, as the data is anonymous, it will not be possible to withdraw my data from the
research once my contributions have been transcribed.
If you have any questions about the research, please do not hesitate to ask.
I confirm I have read and completely and fully understand the
information provided on this form and therefore give my consent to
taking part in this research.
Signature: _______________________________ Date: _________________
Full name: _______________________________ Contact number: _________________________
Address: ________________________________ Email address: _________________________

Measuring Service Quality, Customer satisfaction and Loyalty in Airline Industry
198 Cranfield University
Appendix H: scale items used in pre-test exercise
Dimensions Label No. of
Items Items Questions Source
Airline Tangibles ATANG 7
Q1 The airline company provides passengers with new,
modern and well maintained aeroplanes. AIRQUAL
Q2 Food and drink served on the aeroplane during the flight
are of high quality and sufficiently varied. AIRQUAL
Q3 The toilet on board the aeroplane is clean and easy to
use. AIRQUAL
Q4 There are daily newspapers and current magazines to
read in the aeroplane. AIRQUAL
Q5 Personnel working for the airline company are neatly
dressed. AIRQUAL
Q6 The airline company provides passengers with allocated
seats NEW
Q7 The airline company provides entertainment for
passenger on board the aircraft NEW
Airline Reliability REL 6
Q8 Passengers' luggage is handled with care and attention. AIRQUAL
Q9 When airline company promises to do something by a
certain time, it does so SERVQUAL
Q10 When you have problems, airline company shows sincere
interest in solving it SERVQUAL
Q11 Airline company performs the service right the first time SERVQUAL
Q12 airline company provides its services at the time it
promises to do so SERVQUAL
Q13 airline company insists on error-free records SERVQUAL
Responsiveness RES 5
Q14 Employees of airline company tell you exactly when
services will be performed SERQUAL
Q15 Employee of airline company give you prompt service SERQUAL
Q16 Employees of airline company are always willing to help
customers SERQUAL
Q17 Employees of airline company are never too busy to
respond to your requests SERQUAL
Q18 Airline company provides its services for customers
promptly NEW
Assurance ASS 5
Q19 Airline company personnel are experienced and well
trained. AIRQUAL
Q20 The behaviour of employees of airline company instills
confidence in customers SERQUAL
Q21 You feel safe in your transactions with airline company SERQUAL
Q22 Employees of airline company are consistently courteous
with you SERQUAL
Q23 Employees of airline company have the knowledge to
answer your questions SERQUAL
Empathy EMP 7
Q24
Passengers are compensated sufficiently by the airline
company for any damages arising in the shortest time
possible.
AIRQUAL
Q25 Personnel working for the airline company put themselves
in the place of the passengers when providing service. AIRQUAL
Q26 Airline company gives you individual attention SERQUAL
Q27 Airline company has employees who give, you personal
attention SERQUAL
Q28 Employees of airline company understand your specific
needs SERQUAL
Q29 Airline company has your best interests at heart SERQUAL
Q30 airline company has operating hours convenient to all its
customers SERQUAL
Total : 5 dimensions / 30 Items (9 Items AIRQUAL ; 18 Items SERQUAL ; 3 Items NEW )

Measuring Service Quality, Customer satisfaction and Loyalty in Airline Industry
199 Cranfield University
Appendix I: Questionnaire used in pre-test exercise
Dear Participant
I am a doctoral candidate in Air Transport Management at Cranfield
University. I am working on my doctoral dissertation regarding airline service
quality measures. The main purpose of this research is to investigate
measures of Airline Service Quality.
The reason I send this questionnaire for conducting a pilot study. I would
appreciate if you could fill out the questionnaire. I hope that you will find the
time to participate in this test. Based on your feedback, the questionnaire will
be revised.
The survey is likely to take about 10 minutes.
All of the questions are of the tick box variety and so are easy to complete. I
ensure your anonymity and will not share your information with any other
organisation.
Should you need any further information, please contact:
Mishal Alotaibi
Doctoral Candidate
Department of Air Transport Management
Cranfield University [email protected]
Thank you for your participation

Measuring Service Quality, Customer satisfaction and Loyalty in Airline Industry
200 Cranfield University

Measuring Service Quality, Customer satisfaction and Loyalty in Airline Industry
201 Cranfield University

Measuring Service Quality, Customer satisfaction and Loyalty in Airline Industry
202 Cranfield University

Measuring Service Quality, Customer satisfaction and Loyalty in Airline Industry
203 Cranfield University

Measuring Service Quality, Customer satisfaction and Loyalty in Airline Industry
204 Cranfield University

Measuring Service Quality, Customer satisfaction and Loyalty in Airline Industry
205 Cranfield University
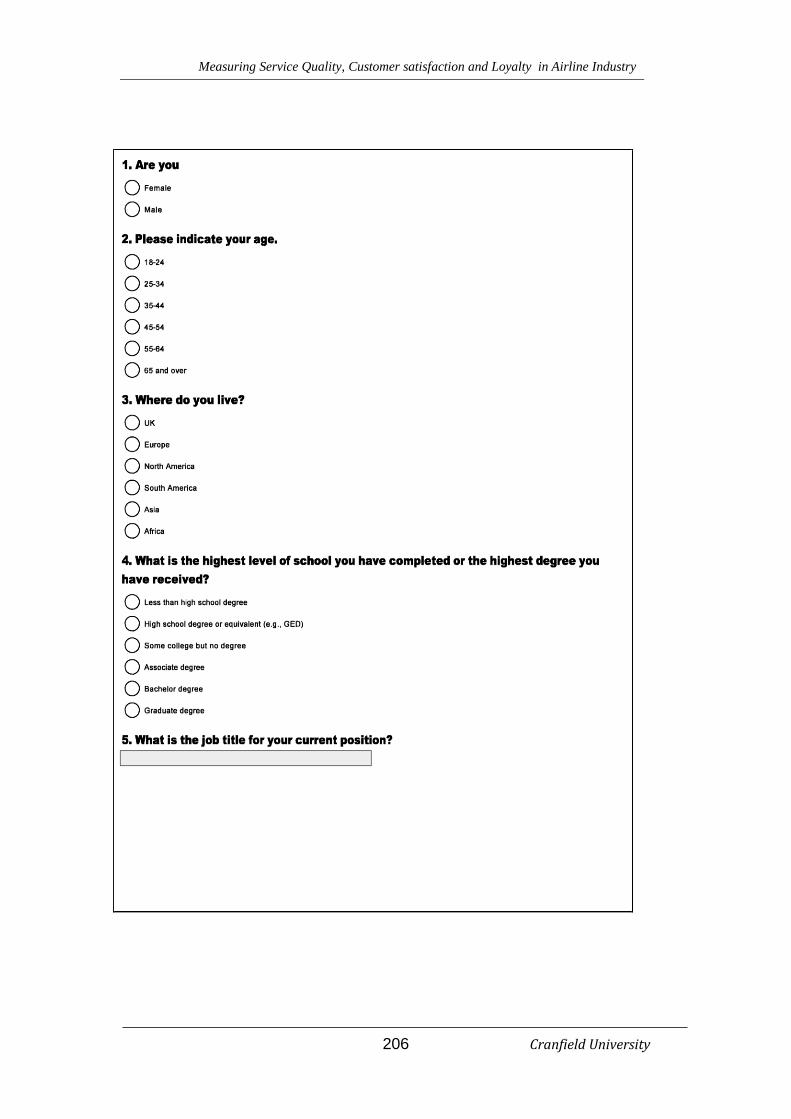
Measuring Service Quality, Customer satisfaction and Loyalty in Airline Industry
206 Cranfield University