cranfield university frank g noppel comparison of unconventional aero
TRANSCRIPT

CRANFIELD UNIVERSITY
Frank G Noppel
COMPARISON OF UNCONVENTIONAL
AERO ENGINE ARCHITECTURES
School of Mechanical Engineering
PhD Thesis

Cranfield University
School of Engineering
Department of Power and Propulsion
PhD Thesis
Frank G Noppel
COMPARISON OF UNCONVENTIONAL
AERO ENGINE ARCHITECTURES
30 April 2011
Supervisor: Professor Riti Singh
© Cranfield University, 2011. All rights reserved. No part of this publication
may be reproduced without the written permission of the copyright holder.

Abstract
In the light of global warming, the associated socio economical consequences, and
the projected shortage of natural energy resources and ever rising oil prices, this
thesis examines the potential for unconventional aero engine architectures to re-
duce fuel consumption of passenger aircraft. Current aircraft engines are based on
the Brayton cycle, where the working fluid successively experiences isentropic
compression, isobaric combustion, and isentropic expansion. Deviations from the
ideal cycle in real engines occur through component inefficiencies. The maximum
achievable thermodynamic efficiency of the Brayton cycle increases hand in hand
with its peak cycle temperature. Since the peak cycle temperature is limited by
material properties of the turbine, the maximum cycle efficiency of current jet en-
gines is limited by the laws of thermodynamics. Hence, efficiency improvements
of jet engines beyond what is possible with conventional turbofan designs are only
feasible through unconventional engine architecture.
Several technologies enabling unconventional engine architectures for aircraft
propulsion have been identified. They include wave rotor, pulse detonation and
internal combustion. These technologies are merged with conventional jet engine
technology to form hybrid designs. A one dimensional engine performance model
was developed to calculate the performance and allow a comparison of the hybrid
cycles with a conventional turbofan cycle. Gradient optimisation techniques were
applied to the allow comparison of the best possible designs. Results suggest that
of the examined cycles, the hybrid internal combustion cycle has the best potential
for fuel savings compared to conventional turbofan cycles.

Acknowledgements
My sincere gratitude belongs to Professor Riti Singh and Professor Pericles Pilidis
from the Department of Power and Propulsion at Cranfield University. Their con-
tinued and enduring support of any kind and emotional backing is exceptional and
greatly acknowledged. Many, many thanks!
All the help and assistance from Sam Broe and all the staff at the Department of
Power and Propulsion is very much appreciated.
I would also like to thank Mattia, Guido, Luismi, Pavlos, Costas, Jacinto, Javi and
all my friends whom I met at Cranfield University for the wonderful time I had.
Please, stay all in touch.
My family have always backed me during the time when I worked on my PhD, for
which I am very thankful.
This thesis is devoted to Lama, the love of my life and woman on my side.
5
Table of Contents
Abstract ................................................................................................................... 3
Acknowledgements ................................................................................................. 4
Table of Contents .................................................................................................... 5
List of Figures ......................................................................................................... 7
List of Tables ........................................................................................................ 12
Nomenclature ........................................................................................................ 15
1 Introduction................................................................................................... 17
1.1 The Jet Engine....................................................................................... 24
2 External Factors ............................................................................................ 30
2.1 Climate Change..................................................................................... 30
2.2 World Energy Reserves......................................................................... 40
3 Computational Model.................................................................................... 44
4 Conventional Turbofan ................................................................................. 55
4.1 Sensitivity Analysis............................................................................... 61
4.2 Optimisation.......................................................................................... 64
5 Wave Rotor Technology ............................................................................... 74
5.1 Introduction........................................................................................... 74

6
5.2 Process .................................................................................................. 76
5.3 Technology Parameters......................................................................... 81
5.4 Optimisation.......................................................................................... 83
6 Pulse Detonation ........................................................................................... 92
6.1 Introduction........................................................................................... 92
6.2 Process .................................................................................................. 97
6.3 Optimisation........................................................................................ 106
Internal Combustion............................................................................................ 113
6.4 Introduction......................................................................................... 113
6.5 Process ................................................................................................ 122
6.6 Computational Model.......................................................................... 127
Summary ............................................................................................................. 134
6.7 Estimating Installed Performance ....................................................... 140
6.8 Technology Readiness ........................................................................ 152
7 Conclusions................................................................................................. 154
Appendix ............................................................................................................. 162
A1: NASA TRL Scale......................................................................................... 162
References ........................................................................................................... 166

7
List of Figures
Figure 1: Horus, a flying god of the Ancient Egyptian religion, was an important
deity symbol of power........................................................................................... 18
Figure 2: Historical trends in direct operating cost per revenue passenger-
kilometre for short and long-range aircraft. .......................................................... 25
Figure 4: Combustor exit temperature trend with time......................................... 26
Figure 5: Specific fuel efficiency versus bypass ratio taking into account friction
losses of cowlings and nacelles23,24....................................................................... 27
Figure 6: Specific fuel consumption of current engines as it relates to thermal and
propulsive efficiency............................................................................................. 28
Figure 7: Fuel efficiency development of gas turbines......................................... 29
Figure 8: Simplified schematic of the carbon cycle.............................................. 32
Figure 9: Evolution of the global mean sea level between 1800 and 2100 from
observations and model projections. Pink and blue shaded regions include
projections from coupled climate models. ............................................................ 35
Figure 10: Probability in percent that future summer average temperatures will
exceed the highest summer temperature observed on record in 2090. ................. 37
Figure 11: Global near surface air temperature record 1880 until 2010 . Following
the common practice of the IPCC, the zero on this figure indicates the mean
temperature from 1961-1990................................................................................. 38

8
Figure 12: Global, anthropogenic Carbon emissions............................................ 39
Figure 13: Inflation adjusted monthly crude oil prices (1946 – 2011) in June 2010
US Dollars............................................................................................................. 42
Figure 14: Representation of the mathematical model. ........................................ 44
Figure 15: Temperature – Entropy diagram (not to scale) of the mathematical
model..................................................................................................................... 45
Figure 16: Cruise altitudes of commercial transport aircraft. Modern airliners’
cruise altitude averages at approximately 10 km42. .............................................. 56
Figure 17: Cruise speed for long range airliners, equating to approximately Mach
0.8542. .................................................................................................................... 56
Figure 18: Function value for each optimisation iteration. ................................... 67
Figure 19: A wave rotor drum consisting of cylindrically arranged tubes. .......... 75
Figure 20: Gas turbine with a wave rotor and continuous flow combustor. ......... 75
Figure 21: Cyclic operation of a four port wave rotor (simplified wave diagram).
Note that the tube is travelling upwards in the diagram and the velocity of the tube
is in accordance with the shock wave patterns that occur through the opening and
closing of the tube ends......................................................................................... 77
Figure 22: Schematic T-S diagrams for a gas turbine baseline engine (dashed) and
the additional wave rotor stages. Cooling air not shown. ..................................... 78
Figure 23: Graphical representation of a gas turbine cycle with wave rotor
technology. ............................................................................................................ 78
9
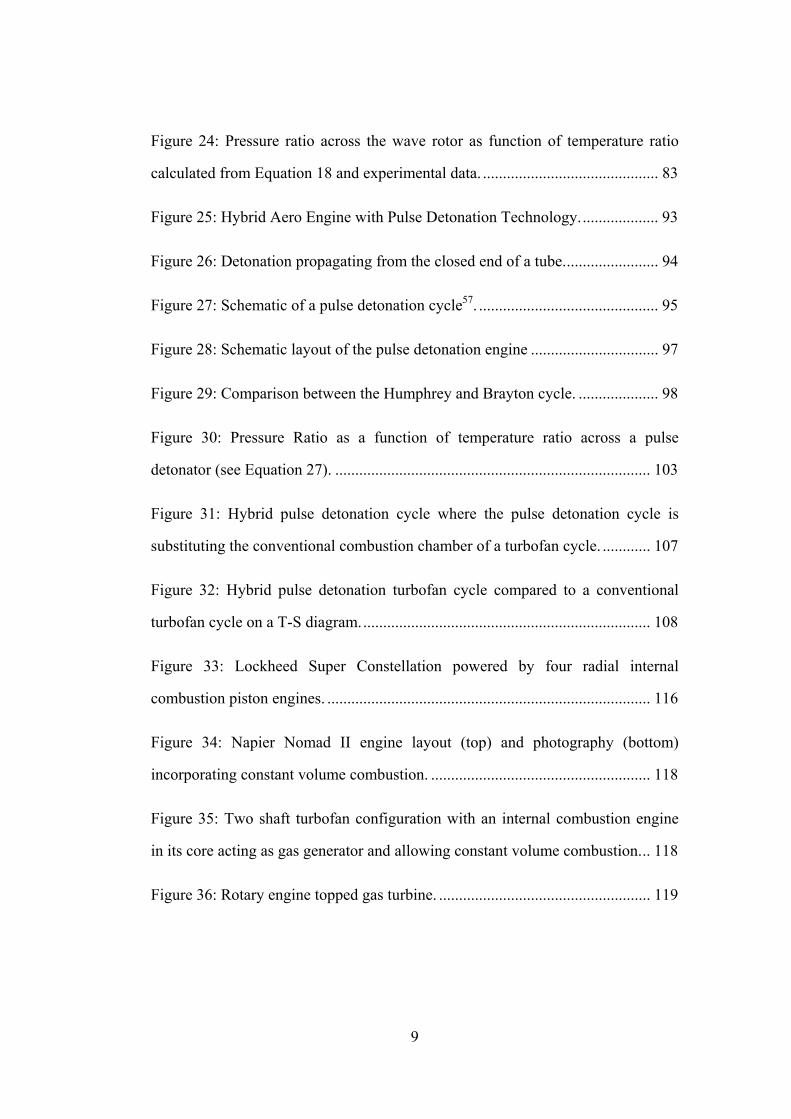
Figure 24: Pressure ratio across the wave rotor as function of temperature ratio
calculated from Equation 18 and experimental data. ............................................ 83
Figure 25: Hybrid Aero Engine with Pulse Detonation Technology.................... 93
Figure 26: Detonation propagating from the closed end of a tube........................ 94
Figure 27: Schematic of a pulse detonation cycle57. ............................................. 95
Figure 28: Schematic layout of the pulse detonation engine ................................ 97
Figure 29: Comparison between the Humphrey and Brayton cycle. .................... 98
Figure 30: Pressure Ratio as a function of temperature ratio across a pulse
detonator (see Equation 27). ............................................................................... 103
Figure 31: Hybrid pulse detonation cycle where the pulse detonation cycle is
substituting the conventional combustion chamber of a turbofan cycle. ............ 107
Figure 32: Hybrid pulse detonation turbofan cycle compared to a conventional
turbofan cycle on a T-S diagram......................................................................... 108
Figure 33: Lockheed Super Constellation powered by four radial internal
combustion piston engines. ................................................................................. 116
Figure 34: Napier Nomad II engine layout (top) and photography (bottom)
incorporating constant volume combustion. ....................................................... 118
Figure 35: Two shaft turbofan configuration with an internal combustion engine
in its core acting as gas generator and allowing constant volume combustion... 118
Figure 36: Rotary engine topped gas turbine. ..................................................... 119

10
Figure 37: Two shaft turbofan configuration with internal combustion stage is
driving the compressor........................................................................................ 120
Figure 38: Two shaft turbofan configuration where the internal combustion stage
is driving the fan. ................................................................................................ 121
Figure 39: The author’s suggestion of the exoskeletal, hybrid internal combustion
turbofan configuration where the fan is driven by the internal combustion stage
............................................................................................................................. 121
Figure 40: Temperature – entropy (left) and pressure-volume (right) diagram
featuring a constant volume and constant pressure combustion cycle................ 122
Figure 41: Turbofan engine with internal combustion engine replacing the
conventional combustor. The internal combustion engine facilitates constant
volume combustion and delivers high temperature and pressure gas to the turbine
stage. No mechanical work is extracted from the internal combustion engine shaft.
............................................................................................................................. 123
Figure 42: Temperature – Entropy diagram showing the conventional turbofan
cycle (dashed) versus a conventional turbofan cycle with an internal combustion
engine in its core (5-51-52-6). The turbine cooling flow is not shown in this
diagram to avoid confusion and 6 is not displayed. ............................................ 124
Figure 43: Peak cycle temperature for a hybrid internal combustion engine cycle
for different inlet temperatures (1,310K and 775K) and compression ratios. The
IC outlet temperature is 2,000K. ......................................................................... 128

11
Figure 44: Pressure ratio inlet to outlet of an IC cycle in a hybrid cycle for
different inlet temperatures (1,310K and 775K) to the IC cycle and compression
ratios. The IC outlet temperature is 2,000K........................................................ 129
Figure 45: Overall efficiency and specific thrust of optimised cycles. TET is
increasing from left to right (1,700K to 2,200K) within a given set................... 135
Figure 46: Compressor pressure ratio and bypass ratio of optimised cycles. The
fan pressure ratio is 1.26 for all cycles. TET is increasing from left to right
(1,700K to 2,200K) within a given set................................................................ 136
Figure 47: Overall efficiency and specific thrust of optimised cycles (bypass ratio
is 15). TET is increasing from left to right (1,700K to 2,200K) within a given set.
............................................................................................................................. 138
Figure 48: Compressor pressure ratio and bypass ratio of optimised cycles. The
bypass ratio is 15 for all cycles. TET is increasing from left to right (1,700K to
2,200K) within a given set. ................................................................................. 139
Figure 49: Summary of technologies – block fuel savings versus technology
readiness level. At the current level of understanding, the hybrid internal
combustion engine exhibits the highest potential for more fuel efficient engines
and offers more a more balanced risk to investment. ......................................... 156

12
List of Tables
Table 1: Definition of constants in the computational model. .............................. 49
Table 2: Flight conditions used in the computational model. ............................... 56
Table 3: Component efficiencies, combustor pressure loss and cooling flow used
in the computational model................................................................................... 58
Table 4: Combustor pressure loss and cooling flow. ............................................ 59
Table 5: Values of engine parameters................................................................... 59
Table 6: Performance results................................................................................. 60
Table 7: Change in performance for changes in engine parameters relative to
initial calculation................................................................................................... 63
Table 8: Optimiser parameters. ............................................................................. 66
Table 9: Optimisation constraints ......................................................................... 66
Table 10: Values of engine parameters for initial cycle and optimised cycle. ..... 68
Table 11: Performance results for initial cycle and optimised cycle. ................... 69
Table 12: Summary of engine parameters and performance of optimised cycles for
different TETs. ...................................................................................................... 70
Table 13: Summary of engine parameters and performance of optimised cycles for
different TETs and fixed BPR. ............................................................................. 71
Table 14: Cycle optimisation results of a 2 spool turbofan engine....................... 73

13
Table 15: Wave rotor parameters for the computational model. .......................... 84
Table 16: Summary of engine parameters and performance of optimised, hybrid
wave rotor cycles for different TETs with an internal wave rotor pressure ratio of
1.8.......................................................................................................................... 85
Table 17: Summary of engine parameters and performance of optimised, hybrid
wave rotor cycles for different TETs with an internal wave rotor pressure ratio of
3.6.......................................................................................................................... 86
Table 18: Summary of engine parameters and performance of optimised, hybrid
wave rotor cycles for different TETs with an internal wave rotor pressure ratio of
1.8 and constrained bypass ratio of 15. ................................................................. 87
Table 19: Summary of engine parameters and performance of optimised, hybrid
wave rotor cycles for different TETs with an internal wave rotor pressure ratio of
3.6 and constrained bypass ratio of 15. ................................................................. 89
Table 20: Summary of hybrid wave rotor cycles for a turbine entry temperature of
2,000K................................................................................................................... 90
Table 21: Typical values for purge fraction and the technology parameter C.... 103
Table 22: Summary of engine parameters and performance of optimised, hybrid
pulse detonation cycles for different TETs. ........................................................ 109
Table 23: Summary of engine parameters and performance of optimised, hybrid
pulse detonation cycles for different TETs and constrained bypass ratio........... 110
Table 24: Summary of hybrid pulse detonation cycles for a turbine entry
temperature of 2,000K. ....................................................................................... 112

14
Table 25: Summary of engine parameters and performance of optimised, hybrid
internal combustion engine cycles for different TETs........................................ 130
Table 26: Summary of engine parameters and performance of optimised, hybrid
internal combustion engine cycles for different TETs and a bypass ratio of 15. 131
Table 27: Summary of hybrid internal combustion cycles for a Turbine Entry
Temperature of 2,000K. ...................................................................................... 133
Table 28: Optimisation constraints for engine parameters. ................................ 140
Table 29: Results for cycle optimisations with constraints................................. 141
Table 30: Parameters for the calculation of the displacement volume of an internal
combustion engine. ............................................................................................. 147
Table 31: Wight of the resulting engine if a scaled version of a 1940s piston
engine with a state of the art turbofan were merged. Hypothetical weight changes
prior to the merge shown in the left hand column and top row. ......................... 148
Table 32: Comparison of installed performance of the engine cycles. ............... 151

15
Nomenclature
Symbol Description Unit
a Area m2
AFR Air to fuel ratio -
C Technology parameter -
CFD Computational fluid dynamics -
cp Specific heat -
cv Specific heat J/(kg K)
Δ Difference operator -
η0 Overall efficiency -
Fs Specific thrust N/(kg/s)
γ Ratio of specific heats -
IC Internal combustion -
HR Enthalpy ratio -
L/D Lift to drag ratio -
M Mach number -
m& Mass flow kg/s
n Cycle speed 1/sec
16
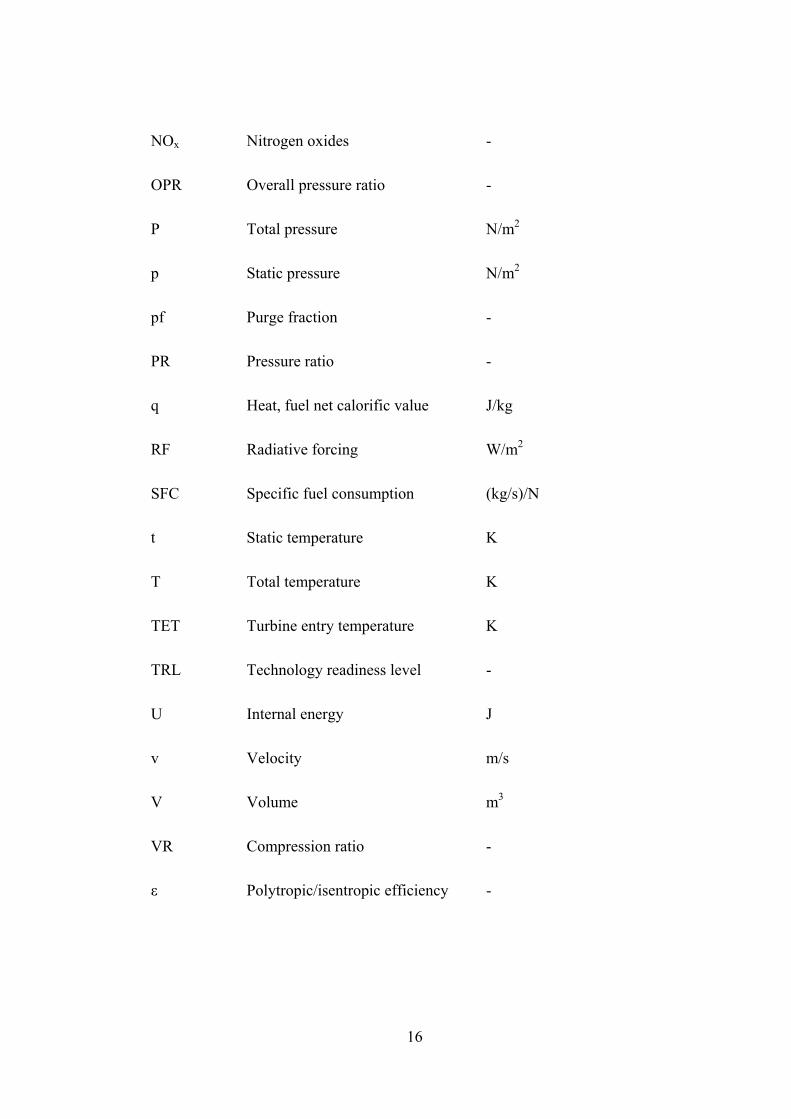
NOx Nitrogen oxides -
OPR Overall pressure ratio -
P Total pressure N/m2
p Static pressure N/m2
pf Purge fraction -
PR Pressure ratio -
q Heat, fuel net calorific value J/kg
RF Radiative forcing W/m2
SFC Specific fuel consumption (kg/s)/N
t Static temperature K
T Total temperature K
TET Turbine entry temperature K
TRL Technology readiness level -
U Internal energy J
v Velocity m/s
V Volume m3
VR Compression ratio -
ε Polytropic/isentropic efficiency -
17
1 Introduction
For a long time throughout human history, the dream of flight, the desire to dis-
obey the law of gravity and develop the ability to disconnect from earth, had re-
mained a vision. Although flight could be observed in other animals, such as birds
or insects, humans were not equipped with the necessary physical features to
overcome the laws of gravity on their own and were hence bound to the ground.
Therefore, flight was regarded to be an ability beyond human nature. The desire to
overcome the limits imposed on men has led to the stylisation of flight as means
to deal with human inability. This inability can lead to lethal outcomes, which our
earliest possible ancestors were already aware of. It is believed that humans’ worst
reoccurring night dream, which is a falling person, roots from the prehistoric
world of our genetic ancestors where falling from a tree would most certainly im-
ply a fatal outcome1.
Stylisations of flight can be found in almost every culture in its various forms,
where they can play a central part in myths, legends or religions. The capability to
penetrate into to humans inaccessible space, towards the sky, was given to winged
creatures only existent in the fantasies of men. Angels, fairies or dragons were in-
vented to provide projection grounds for human desires and inspired men through-
out history with remarkable results. Take scientist and inventor Robert Goddard as
example, who climbed a cherry tree on October 19th, 1899, age 17, and became
transfixed by the sky. He later developed essentially all aspects of the modern
rocket. His memoirs read:

18
“On this day I climbed a tall cherry tree at the back of the barn . . . and as I
looked toward the fields at the east, I imagined how wonderful it would be to
make some device which had even the possibility of ascending to Mars, and how it
would look on a small scale, if sent up from the meadow at my feet. I have several
photographs of the tree, taken since, with the little ladder I made to climb it, lean-
ing against it. […] I was a different boy when I descended the tree from when I
ascended. Existence at last seemed very purposive2.”
With symbolic uniformity across the various cultures, the ability to fly implies
freedom and supernatural power. Therefore, flying creatures often have meta-
physical or supernatural attributes and were given the position of heroes and gods.
Relicts of developed ancient cultures dating back as long as 5,000 years ago, such
as shown in Figure 1, demonstrate the importance of flight in a religious context;
and this has not changed: “And look into space; you shall see Him walking in the
cloud, outstretching His arms in the lightning and descending in rain.”3
Figure 1: Horus, a flying god of the Ancient Egyptian religion, was an important deity sym-
bol of power.

19
As the idea of flight developed in the peoples’ minds over centuries, the desire for
flight went beyond stylisation only. Attempts to achieve human flight can be
found throughout history. By at least 549 AD paper kites were flown in ancient
China4, paving the way for human flight. However, it took almost another one and
half millennia until the Wright brothers accomplished the first sustained and con-
trolled heavier-than-air powered flight capable of carrying a human being.
Today, when this sentence is written, we are writing the year 2011; the centenary
of British Powered Flight has passed. Aviation became one of the modern econ-
omy’s prime movers; it connects cultures and continents and sits at the heart of
globalisation. We see millions of airline passengers carried by aircraft every day,
a highly developed infrastructure, and military aircraft operating in conflict zones.
Aircraft have evolved to the most sophisticated man made machinery ever built,
combining various scientific and technological disciplines in a single unit.
Humans are equipped with a brain of disproportionally large capacity that makes
it possible to absorb their natural environment in a different way compared to
other living species on this planet. While predominantly instinctive behaviour can
be found in animals, humans are conscious observers of the reality, constantly try-
ing to comprehend it and attaching meaning to it. During that process, humans
discover that they live in a world where beauty and terror, birth and death, crea-
tion and destruction coexist. Facing the terrors of nature, they enter an existence
dilemma, causing perplexity and helplessness5.
As a result, reality becomes overwhelmingly incredible and incomprehensible and
imposes an experiential burden on individuals: they do not know why they were
born, what they are doing on this planet or what they are supposed to do. Their
own existence is incomprehensible to them, miraculous like the rest of their natu-

20
ral environment6, which, following the anthropic principle7, is a result of many
coincidences that happen to have favoured the emergence of reality as we know it
and with it the human race.
Humans do not want to admit to themselves that, ultimately, living species, in-
cluding human beings, are nothing else than, to put it in Richard Dawkins’ words,
survival machines for DNA embedded in complex proteins structures that form a
living organism8. The human being is struck by the ambivalent nature which has
been imposed onto him. On the one hand, he is conscious, apparently equipped
with the luxury of a free will. On the other hand he shares his destiny of death
with all other terrestrial creatures. It is the godlike that people is ambivalent about,
fascinate by and fearful of, motivated to and defensive against9.
Humans develop coping mechanisms and defence techniques to protect them-
selves from becoming conscious of the unpleasant and dangerous truths10. These
defence techniques support an illusion of equanimity that becomes the basic driv-
ing force of individuals. They have the purpose of spurring the illusion of superi-
ority and control over their natural environment. Humans are driven by things that
help them to generate a second reality with a human meaning. Creating challenges
which they are able of controlling by defying them6, humans fashion an ideology
of self-justification, a heroic dimension that is life itself to the symbolic animal6.
As means to transform the threatening reality, the human being invents cultural
contrivances that serve as self-hypnotic devices to fascinate himself with the pow-
ers of transcendence over natural reality11. The artist creates a second reality by
swallowing his natural environment, digesting it and throwing it up again in the
various forms that we call art. The joy and pain he witnesses in life are expressed
through his art, and his peers take advantage and use it in defiance of their animal

21
condition. Religion provides another pillar of self delusion. It gives life a purpose
by putting a god above it and, as common in most religions, promise eternal life,
taking away the fear of death. The left-brained scientist tries to master reality by
developing descriptive abstractions that represent reality in human language. Al-
though not in control of reality, the scientist is at least rewarded with the illusion
of being able to understand it. Technology provides the illusion of overcoming
nature, freeing humans of their complete dependence. The designer benefits from
the experience of building a device that defeats nature and the one applying tech-
nology obtains the skills of directly defying it.
If challenges keep the individual alive, what is more of a challenge than overcom-
ing the fundamental laws of gravity that kept him on Earth since his origin about
half a million years ago - in other words: flight? Equipped with their natural fea-
tures, humans are limited to traversing the planet in two dimensions only. Al-
though a third dimension can temporarily be added by going under water, rising
towards the sky has somewhat more heroic than trying do conquer the deep sea,
which, as humans being a child of the ocean, would be step backwards in evolu-
tionary terms.
The ability to fly is the gateway to heaven, inspires the artist, challenges the scien-
tist and keeps the technologist occupied. The aeronaut catapults himself in a ruling
position, giving him the illusion of being in control, facilitating transcendence
over nature in a dimension that has never been achieved prior to the advent of
human flight. While the philistine abuses flight to distract him from reality, the
strong introvert can find satisfaction while exploiting flight for military purposes.
Having discovered that aircraft serve well as troop carriers, surveillance vehicles
or bombers, the one in charge over such machinery can gain immense power. Al-

22
though still far from being able to act like a god, he can at least destroy like a god,
as has been demonstrated by military powers and dictators of this planet. How-
ever, despite its destructive potential, flight can have a more romantic touch when
it provides the bridge to overcome large distances, connecting the traveller with
unknown and heavenly territory.
Flying machines have become the synonym for ultimate transcendence over na-
ture. They stand for hope and destruction in conflict zones, serve the egos of their
military and civil operators in its own ways, go hand in hand with wealth creation
and satisfy melancholic desires further adding to their mystic. Being amongst the
most complex manmade machines, they are beyond the technological understand-
ing of the majority of the population, causing respectful admiration and miracu-
lous amazement.
Today, it is generally acknowledged that commercial aviation is amongst the prin-
cipal enablers for a global economy and the ongoing globalisation and brings in-
trinsic value and quality of life improvements to the society. It is suggested that
aviation may account for as much as 8% of the global gross domestic product
when tourism, probably the world’s largest industry, and air cargo is taken into
consideration12.
Although the aeroplane holds the pole position in terms of specific energy demand
of all modes of transport13, since the emergence of jet engine powered commercial
aeroplanes, advances were of incremental nature in both airframe and engine
technology and have contributed to the improvements in the fuel efficiency and
reductions in emissions of aircraft. The aerospace community recognises that the
current growth rates in air traffic will increase the contribution of aircraft emis-
sions to global warming and that the rate at which aircraft fuel efficiency is im-

23
proving is not offsetting emissions associated with growth in air traffic. Further-
more, increasing fuel prices and declining natural energy reserves add to the pres-
sure to reduce fuel consumption and hence more radical technological approaches
are sought to facilitate long term sustainability in the aviation industry. It is ac-
knowledged that due to maturing technology levels, more radical approaches of
disruptive nature are required in both airframe and engine technology to achieve
more drastic long term fuel efficiency improvements.
The objective of this study is to examine unconventional engine architectures that
enable fuel efficiency improvements in jet engines. Current jet engines are based
on the Brayton cycle, where the working fluid successively experiences isentropic
compression, isobaric increase in temperature, and isentropic expansion. Devia-
tions from the ideal cycle in real engines occur through component inefficiencies.
The maximum achievable thermodynamic efficiency of the Brayton cycle in-
creases hand in hand with its peak cycle temperature. Since the peak cycle tem-
perature is limited by material properties of the turbine, the maximum cycle effi-
ciency of current jet engines is limited by the laws of thermodynamics. Hence,
efficiency improvements of jet engines beyond what is possible with conventional
designs are only feasible through unconventional cycles that incorporate features
such as constant volume combustion.
Several technologies enabling novel cycles for aircraft propulsion have been iden-
tified. They include wave rotor, pulse detonation and internal combustion. This
study focuses on hybrid turbofan cycles designs incorporating these technologies.
24
1.1 The Jet Engine
The enabling technology for modern flight is the jet engine, derived from gas tur-
bine technology. The jet engine is a prime example of a disruptive technology.
Disruptive technologies are innovations that change the rules of the game, intro-
ducing a new value proposition. They do not have to outperform the technologies
they seek to replace, but they must offer some new, valuable feature that will jus-
tify their implementation. If enough momentum can be gathered, the new disrup-
tive technology will evolve to replace its predecessor14. In the late 1920s, Frank
Whittle, an RAF officer, became interested in high altitude, high speed flight. He
saw it as the key that would enable aviation to grow further, providing safer, faster
and more comfortable travel above the weather. Whittle concluded that incre-
mental improvements in existing piston propeller configurations were unlikely to
enable flight at higher altitudes and speeds, and this conclusion led him to begin
the development of what would eventually become the first jet engine15.
Early jet engines performed poorly compared to the well established piston en-
gines of the time. However, they opened the door to faster air travel at higher alti-
tudes, allowing passengers to fly above the weather and resulting in shorter, more
comfortable trips. These advantages allowed the jet engine to replace the piston
engine as the prime mover of choice for civil aircraft. The jet engine made air
travel accessible to ever growing numbers of passengers and the initial fuel con-
sumption, reliability and cost issues were overcome. The form of air travel that we
enjoy today has come about through a combination of technological leaps and
bounds and relentless research and development to improve performance, enhance
safety and comfort, and reduce the cost of air travel (see Figure 2).

25
Figure 2: Historical trends in direct operating cost per revenue passenger-kilometre for
short and long-range aircraft.16
Fuel consumption of aero gas turbines depends on two main parameters: thermal
efficiency and propulsive efficiency. The former is a measure of how well the en-
gine converts heat energy, and the latter describes how well the engine uses the
kinetic energy of the jet to generate thrust. High thermal efficiency requires a high
overall pressure ratio between air entering the jet engine and air in the combustion
chamber, high component efficiencies, for example how efficiently a compressor
stage compresses air, and a high turbine entry temperature. The propulsive effi-
ciency depends on jet velocity. The higher the jet velocity the lower the propul-
sive efficiency as kinetic energy is dissipated in the engine exhaust.
The different design parameters have evolved over the years to meet different
challenges in a quest for lower fuel consumption, weight, costs and environmental
26
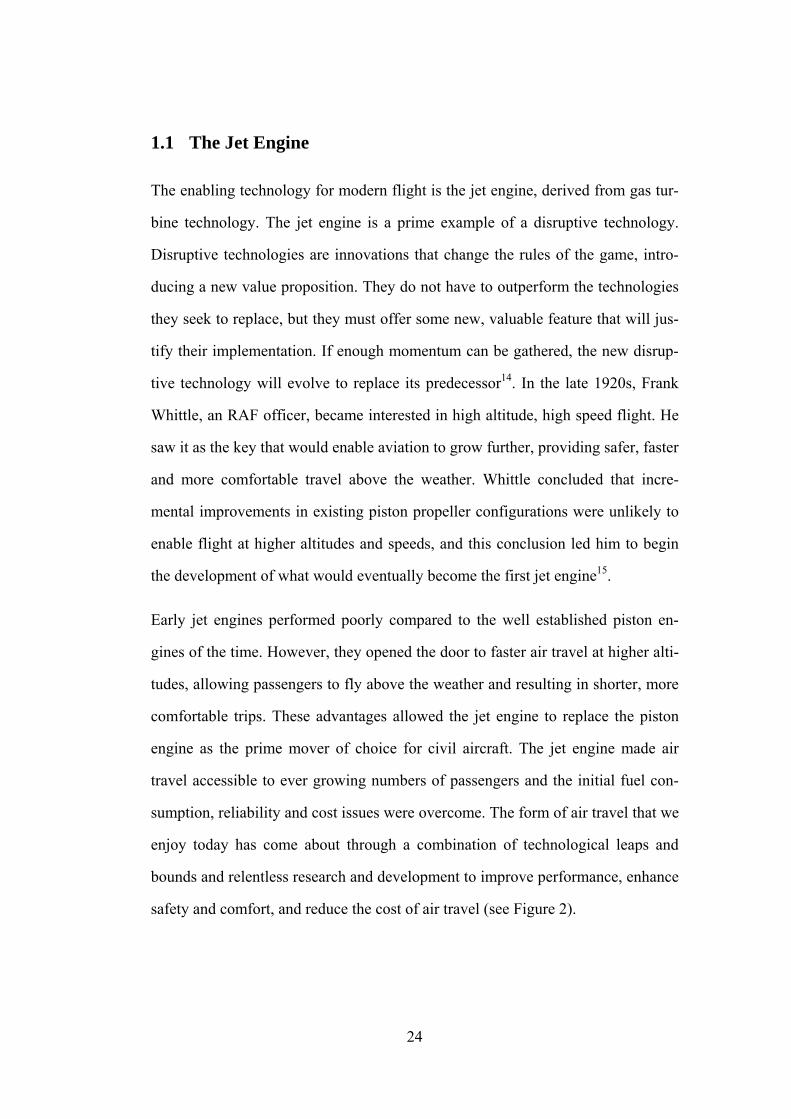
issues17. Increasingly high turbine entry temperatures, the advent of the high by-
pass ratio turbofan and improvements in component efficiencies were the main
enabling technologies to meet these challenges. Investments have resulted in high
temperature resistant materials and improved turbine cooling techniques. Whereas
the turbine entry temperature of early engines only reached about 1,200K, today’s
turbofans operate with turbine entry temperature approaching 2,000K (see Figure
3).
Figure 3: Combustor exit temperature trend with time.18
Considerable research has been undertaken to improve major components in the
engine ‘gas path’. Initially, the efficiency and weight of components were im-
proved by means of experimentation, but high performance computing marked the
advent of computational fluid dynamics, which allowed detailed simulation and
optimisation of components for example to design fan blade geometries capable of
higher pressure ratios. The cumulative effect of these efficiency improvements has

27
been very significant and resulted in an increase in thermal efficiency of jet en-
gines.
The propulsive efficiency can be improved by increasing the gas turbine’s bypass
ratio. However, this would result in an increase of the overall diameter of the en-
gine, resulting in fan cowl drag and weight increase that eventually offsets the ad-
vantages offered by a higher propulsive efficiency. It is expected that installed
fuel efficiency improvements peak for a bypass ratio of 20. Increasing the bypass
ratio further is likely to show adverse effects19,20. More innovative nacelle design
and approaches to minimise installation penalties could provide the solution to
allow further improvements. For a bypass ratio above 20, however, other propul-
sor technologies are required such as open rotors or distributed propulsion.
Figure 4: Specific fuel efficiency versus bypass ratio taking into account friction losses of
cowlings and nacelles19,20.
28
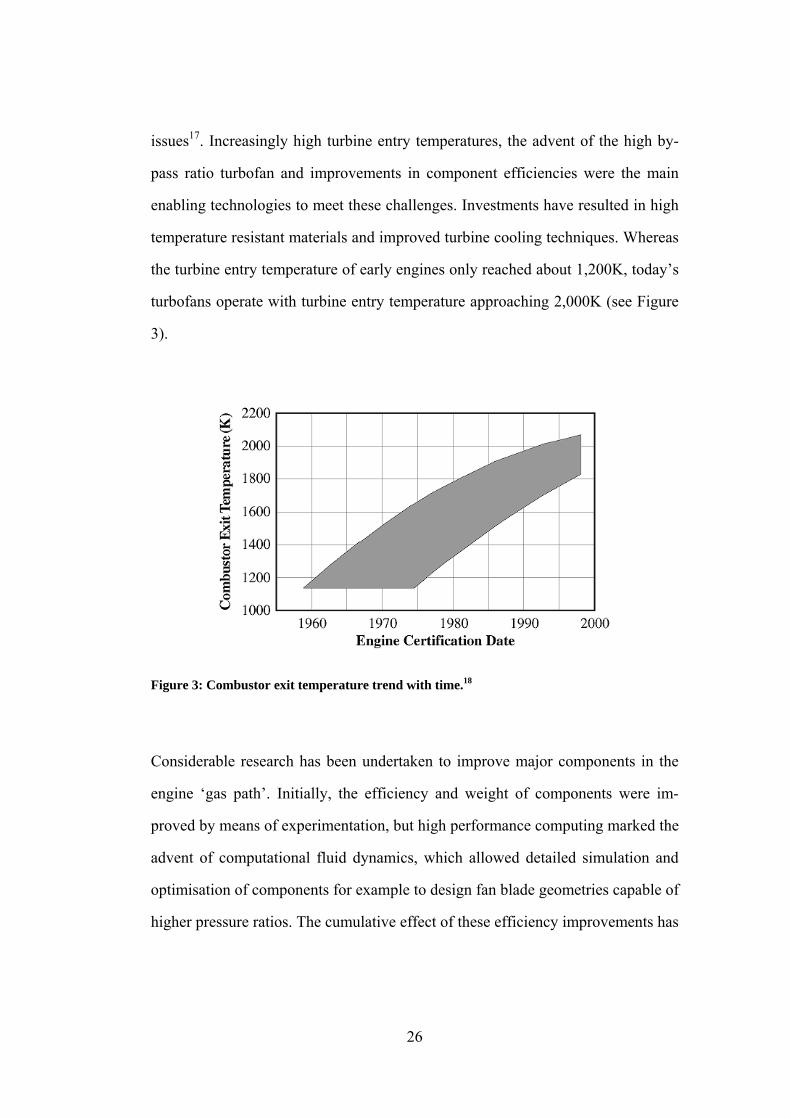
As shown in Figure 5, open rotors and high temperature technologies could bring
about a 30% improvement in fuel consumption compared to current technology
level but improvements in engine efficiency are ultimately constrained by physi-
cal laws, the stoichiometric turbine entry temperature and open rotor propulsive
efficiency. The theoretically achievable maximum overall engine efficiency of
conventional cycles is about 55%.
Figure 5: Specific fuel consumption of current engines as it relates to thermal and propulsive
efficiency21.
This fact represents the dilemma of the aerospace industry today: every improve-
ment in engine efficiency is a step toward the maximum achievable overall engine
efficiency. As this value is approached, the law of diminishing returns sets in: im-
29
provements become more and more difficult to achieve, and take place at subsys-
tem level with larger time spans between equivalent amounts of efficiency gains.
Larger research and development spending is required for ever smaller improve-
ments, reducing profit margins in an effort to remain competitive.
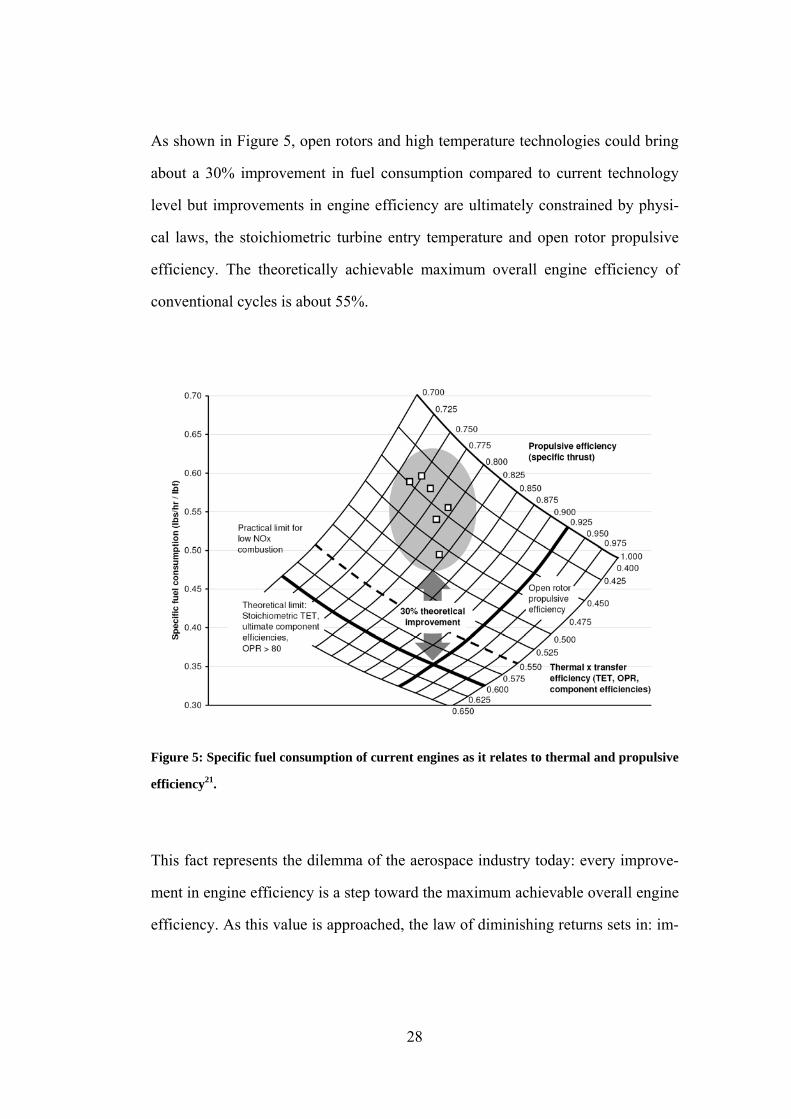
Figure 6 offers a view of the evolution in gas turbine fuel consumption from 1960
to present day. Large improvement in the early years, partly due to the adoption of
the turbofan can be seen, and a constant reduction in fuel consumption ever since.
Research and development programmes today are looking at concepts that could
lead to step fuel efficiency improvements. In the short to medium term, we might
see open rotor configurations emerge. Medium to long term solutions may exhibit
a more disruptive character than short term solutions, as more time for develop-
ment is available. However, long term solutions could require more radical inno-
vations, such as the application of wave rotor, pulse detonation or internal com-
bustion cycles.
Figure 6: Fuel efficiency development of gas turbines22.
30
2 External Factors
2.1 Climate Change
Whilst speed, range and comfort were the primary drivers in civil aviation in the
early 20th century, the picture has changed with the dawn of the new millen-
nium23. Two concerns are now drastically increasing the need for fuel efficient
technology over the past decade: depletion of natural fuel reserves and climate
change, also known as global warming. Scientists fear that with ongoing levels of
current greenhouse gas emissions, global temperatures could increase by several
degrees by the end of the 21st century.
Global warming is caused by solar radiation being absorbed by the planet’s at-
mosphere and surface and converted into heat energy. The natural occurrence of
greenhouse gases results in equilibrium conditions where terrestrial infrared radia-
tion is offset by incoming solar radiation, and the energy fluxes of the ingoing and
outgoing radiation are approximately equal on average, keeping the planet at a
habitable temperature. So called pollutants, which can be of human origin or natu-
ral, for example resulting from volcanic eruptions, such as carbon dioxide, impose
a perturbation on the equilibrium state by absorbing additional solar radiation
which converts into heat energy. The amount of energy absorbed is generally de-
noted by radiative forcing24, which is the amount of radiation forced to remain
within the ‘Earth system’, i.e. the atmosphere, oceans and soil. As more and more
heat is absorbed, the Earth’s temperature increases. A temperature rise will then
occur, continuing until the outgoing and the ingoing radiation are in equilibrium
again.

31
The expected temperature change due to a certain pollutant depends on the
strength of its radiative forcing. A positive radiative forcing will cause a tempera-
ture rise, whereas a negative radiative forcing will cause a temperature drop by
shielding the Earth from incoming radiation. Furthermore, the temperature change
is also determined by a pollutant-specific climate feedback parameter. It can be
understood as a gain factor, accounting for three-dimensional atmosphere-ocean
feedback mechanisms such as cloud or sea ice formation. The feedback parameter
determines how effective the radiative forcing of the pollutant is and over what
time period the temperature rise will take place.
Carbon dioxide is the dominant mode through which carbon is constantly trans-
ferred in the natural environment between a variety of carbon reservoirs (see
Figure 7). Burning fossil fuels, representing one reservoir, implies taking carbon
from beneath the Earth’s surface, converting it to carbon dioxide and emitting it
into the atmosphere - a process which can take up to 100 years. Atmospheric car-
bon dioxide is absorbed by natural carbon dioxide sinks such as oceans or plants,
which take up carbon and facilitate the formation of carbonates and forests. The
process of carbon transfer between carbon reservoirs is referred to as the ‘carbon
cycle’.
The consequences of additional carbon dioxide in the atmosphere, causing a
global temperature rise, are projected to be devastating: sea level rise, frequency
and intensity of extreme weather events, changes in agricultural yields, or an in-
creases in the ranges of disease vectors just to name a few. These consequences
might have a catastrophic impact on our society, and current public consensus
calls for an urgent reduction to counter act current trends. Although aviation only
represents approximately 5% of manmade carbon emissions, projected passenger
32
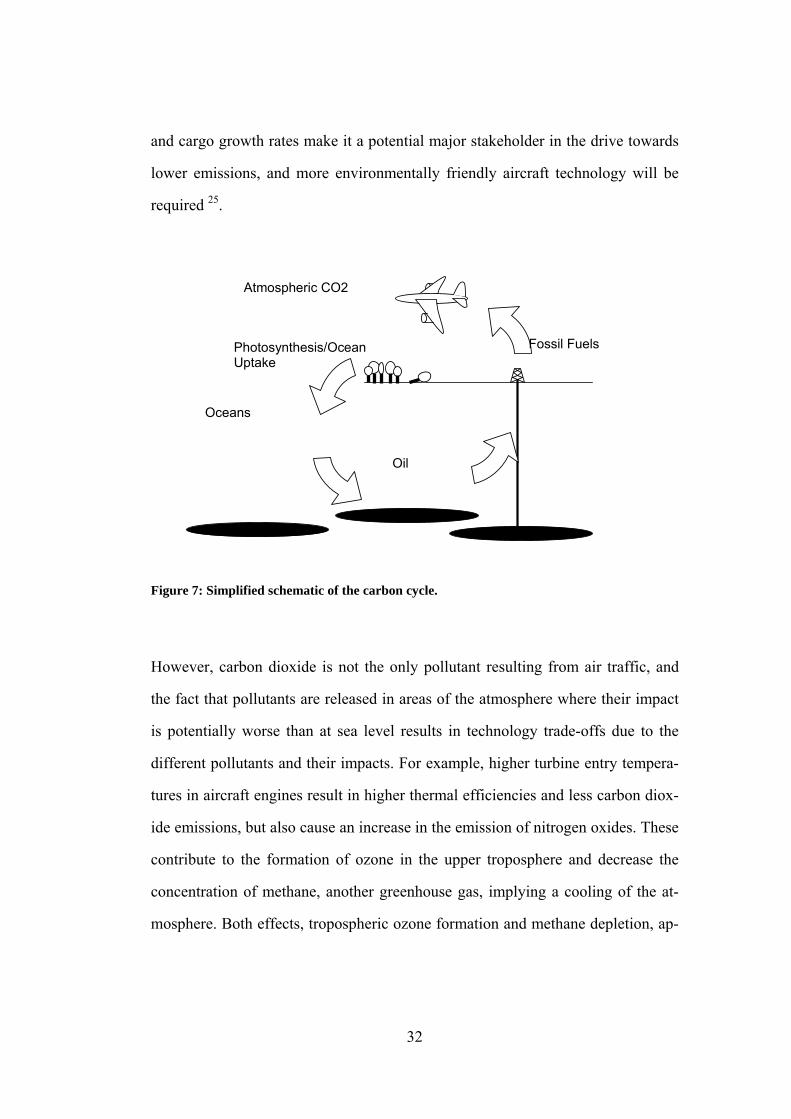
and cargo growth rates make it a potential major stakeholder in the drive towards
lower emissions, and more environmentally friendly aircraft technology will be
required 25.
Oceans
Oil
Photosynthesis/Ocean Uptake
Fossil Fuels
Atmospheric CO2
Figure 7: Simplified schematic of the carbon cycle.
However, carbon dioxide is not the only pollutant resulting from air traffic, and
the fact that pollutants are released in areas of the atmosphere where their impact
is potentially worse than at sea level results in technology trade-offs due to the
different pollutants and their impacts. For example, higher turbine entry tempera-
tures in aircraft engines result in higher thermal efficiencies and less carbon diox-
ide emissions, but also cause an increase in the emission of nitrogen oxides. These
contribute to the formation of ozone in the upper troposphere and decrease the
concentration of methane, another greenhouse gas, implying a cooling of the at-
mosphere. Both effects, tropospheric ozone formation and methane depletion, ap-

33
proximately cancel each other out. Nevertheless, stratospheric nitrogen oxide
emissions facilitate a reduction of ozone where it is needed to shield earth from
highly energetic cosmic radiation. When emitted at low altitudes, e.g. in the vicin-
ity of airports, nitrogen oxides exhibit additional environmental and health haz-
ards. Nitrogen oxides can react to form nitric acid that can penetrate into sensitive
lung tissue and causes severe health damage and premature death in extreme
cases. Inhalation of such particles may cause or worsen respiratory and heart dis-
eases.
Water, which in its vapour phase is a relatively strong greenhouse gas, is also a
combustion product. Water emitted by aircraft precipitates relatively shortly after
emission, whereas stratospheric water can have longer residence times and hence
cause radiative forcing, even though it is marginal compared to other aviation pol-
lutants.
Alleviated atmospheric aerosol concentrations caused by air-traffic are relatively
small compared to the contribution from surface sources. Soot emissions tend to
warm the atmosphere, whereas sulphates have an opposite effect. Compared to
other aircraft emissions, the direct radiative forcing of soot and aerosols is rela-
tively small. Aerosols also play an important role in the formation of cirrus clouds
that would not form in the absence of aviation, resulting in enhanced cloud forma-
tion and the modification of the radiative properties of natural cirrus clouds.
Contrails are artificial clouds composed of ice crystals. They form in the aircraft
wake if water saturation occurs during the mixing process of the engine’s exhaust
gases with ambient air. An analogy can be found by comparing the formation of
contrails to human breath in a cold winter day, which can become visible in the
form of steam. Contrails can persist in the atmosphere if it is ice-supersaturated.
34
Due to the shape and size of contrail ice crystals, contrails reflect incoming solar
radiation to a lesser extent than terrestrial infrared radiation. As a result, heat en-
ergy is trapped in the atmosphere below the contrail. Although radiative properties
of contrails vary depending on the ambient conditions, occasionally even leading
to local cooling of the atmosphere below the contrail, the average effect of global
contrail occurrences is a net contribution to global warming.
Moreover, dependent on ambient conditions, line-shaped persistent contrails can
spread to form large-scale cirrus clouds, so called contrail cirrus. Since they cover
much larger areas than line-shaped contrails, and thus trap more heat in the at-
mosphere, it is estimated that their environmental impact is larger than that of
line-shaped contrails. Furthermore, locally alleviated atmospheric soot and aerosol
concentrations due to air-traffic can initiate water nucleation, leading to the for-
mation of so called secondary cirrus clouds. These clouds, with radiative proper-
ties similar to those of contrails, also contribute to global warming. It is important
to note that they would not form in the absence of air traffic26,27.
Climate assessments have emphasized the environmental impact from persistent
contrails and contrail cirrus. Their radiative forcing might already exceed the ra-
diative forcing from all other air-traffic pollutants combined.
The consequences of climate change are far reaching and are predicted to affect
the world’s population in its various forms. The predictions are based on numeri-
cal models, which are accurate within the boundaries provided by large scale com-
putational climate simulations and results depend on the various simplifying as-
sumptions made and emission scenarios used.

35
Climate models suggest that the increase in global temperatures will result in de-
creasing arctic summer sea ice, which will allow more shipping and mining on the
one hand, but the landscape of which indigenous peoples were once an integral
part will diminish. Some mountain glaciers reduce in size and some are predicted
to disappear.
Various factors affect the volume and mass of the world’s oceans which can lead
to long term changes in the sea level. The two primary factors causing a rise in sea
level are global temperature change due to the temperature dependent volumetric
density of water, and the amount of water stored on land and also sea in solid form
that would become liquid and flow in the oceans.
Figure 8: Evolution of the global mean sea level between 1800 and 2100 from observations
and model projections28. Pink and blue shaded regions include projections from coupled cli-
mate models.

36
Sea level rise predictions by the year 2100 are uncertain and range from 0.2 m to
1.2 m (see Figure 9). While underlying volumetric expansion associated with in-
creasing atmospheric temperatures is less difficult to predict, the behaviour of the
Greenland and West Antarctic ice caps and associated increase in water masses of
the oceans cannot be predicted with great accuracy. As a result of rising water
levels, coast lines will travel in land and river deltas will be flooded, whereas the
societal impact is predicted to be more severe in case of river deltas as replenish-
ing sediments become increasingly held up by irrigation, hydropower production
and flood-control projects.
Tropical cyclones, which can cause damage in costal areas by pushing water
inland, may become less frequent. However, the occurrence of more destructive
hurricanes is likely to increase. Warmer oceans may suffer from coral bleaching
caused by increasing water temperatures whereas reefs currently immersed in
colder water will experience an increase in water temperature and may thus be
colonised by new corals. Both will have an impact on fishing and tourism, which
will be to the disadvantage of the nearby population that is now benefiting from
coral reefs, populations nearby emerging coral reefs will benefit. The increasing
concentration of atmospheric carbon dioxide will lead to ocean acidification but
impacts are uncertain.
It is predicted that shifting precipitation patters will result in the drying of already
dry places such as southern Africa and the south-western United States. Places
that are already wet, such as much of South-East Asia, are likely to get wetter. In
colder areas especially in the northern hemisphere, some land will become more
suitable for farming whereas in the tropics and subtropics some marginal land will
become barely inhabitable. In general, the increase in average temperature will be

37
less noticeable than extreme cases. Figure 9 showing the probability of a summer
warmer than the warmest on record suggest more extreme temperatures across the
globe.
Figure 9: Probability in percent that future summer average temperatures will exceed the
highest summer temperature observed on record in 209029.
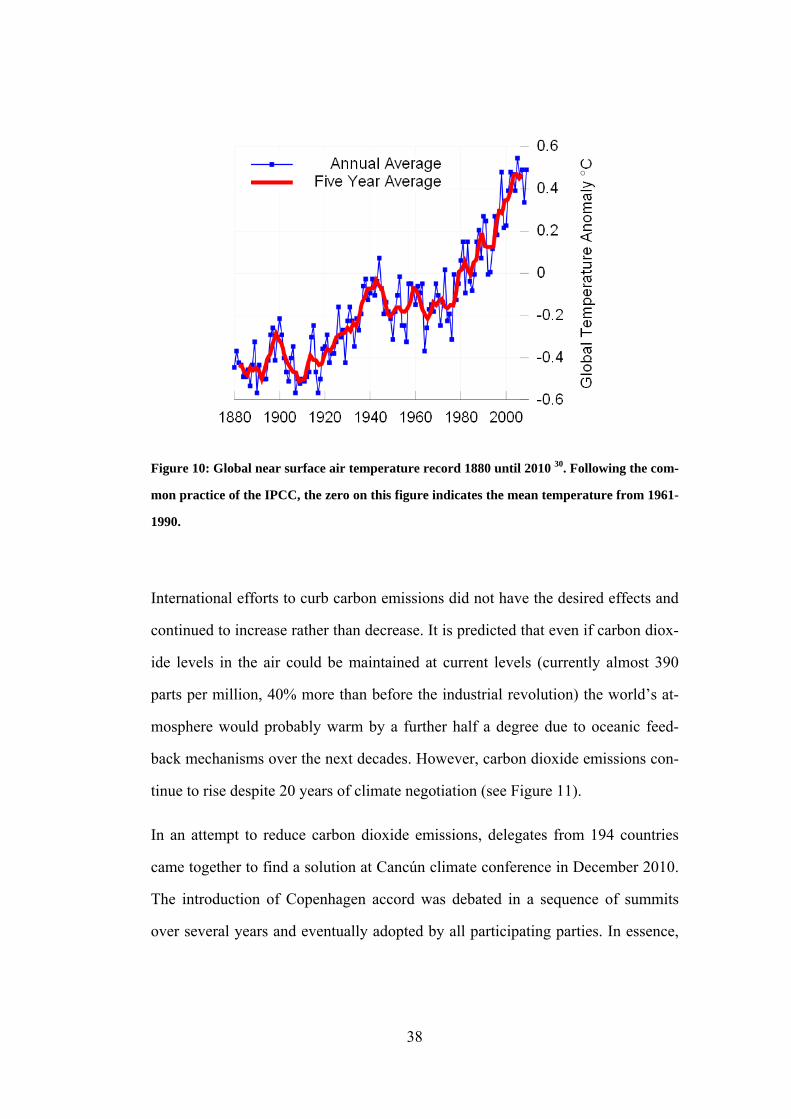
The list of possible impacts climate change will have and the resulting socio eco-
nomic consequences could be continued. Undisputable is that temperature records
show a global warming by approximately 1K between the 19th and the 20th cen-
tury. Figure 10 shows the global near surface air temperature record 1880 until
2010. Every year since the year 2000 has been warmer than any but one, 1998, of
the years during the 20th century (see Figure 10). The emission of more carbon
dioxide will further increase atmospheric carbon dioxide concentration and in-
crease the global temperature.
38
Figure 10: Global near surface air temperature record 1880 until 2010 30. Following the com-
mon practice of the IPCC, the zero on this figure indicates the mean temperature from 1961-
1990.
International efforts to curb carbon emissions did not have the desired effects and
continued to increase rather than decrease. It is predicted that even if carbon diox-
ide levels in the air could be maintained at current levels (currently almost 390
parts per million, 40% more than before the industrial revolution) the world’s at-
mosphere would probably warm by a further half a degree due to oceanic feed-
back mechanisms over the next decades. However, carbon dioxide emissions con-
tinue to rise despite 20 years of climate negotiation (see Figure 11).
In an attempt to reduce carbon dioxide emissions, delegates from 194 countries
came together to find a solution at Cancún climate conference in December 2010.
The introduction of Copenhagen accord was debated in a sequence of summits
over several years and eventually adopted by all participating parties. In essence,

39
the Copenhagen accord is a non-binding document which aims to keep the tem-
perature increase by 2100 not more than 2°C above pre-industrial averages.
This is, however, a matter of debate. The World Energy Outlook calculated a
3.5°C increase by 2100 if emissions were curbed according to the ‘new policies
scenario’ incorporated in the accord31. The new policies scenario requires a 2.8%
reduction in carbon dioxide emissions in the coming decade and a 5.5% rate
thereafter until 2035. It is the opinion of many scientists, campaigners and poli-
cymakers, that two degrees is a wishful dream and unlikely to become reality.
Figure 11: Global, anthropogenic Carbon emissions32.
As it seems that a more significant increase of global mean temperatures becomes
inevitable, it will be required to develop means to adapt to e.g. scarcer water,
higher peak temperatures and higher sea levels. Even though these measures will
40
help reducing the socio economic impacts, they will not protect everyone from all
harm that climate change may bring. Besides intensified research into improved
crop yields and higher tolerance of temperature and water scarcity, programs for
disease control, improving and conserving soil, cropping patterns and crop-
management techniques may be required. This will ensure that enough food for
the projected 9 billion planet’s inhabitants can be produced under the new circum-
stances without much of the planet’s remaining uncultivated areas being turned
into farmland.
While the developed countries are more likely to be able to afford and provide
resources to adapt to climate change, poor countries will often lack the financial
means, technical expertise or political institutions necessary for such endeavours.
In addition, they may often be at increased risk due to their dependency on farm-
ing and agriculture, principally because they are usually more dependent on farm-
ing than rich countries, and no other human activity is so intimately bound up
with the weather. Crop yields are sensitive to changes in patterns of rainfall and
peak temperature, as well as to average temperature and precipitation; so are the
pests and diseases that attack them.
2.2 World Energy Reserves
Climate change and its consequences are not the only reason why the consump-
tion of fossil fuels should be reduced or even abandoned. The world’s reserves of
fossil fuels are diminishing due to their continuous exploitation. With an esti-
mated 1.33 1012 barrels of global oil reserves33 and assuming a daily oil consump-
tion of 85.1 106 barrels34, the world’s oil reserves are estimated to last until 2054,
or for another 43 years (if you read this in 2011). This assumes no increase in oil
41
demand by then; but the reality will probably be that oil consumption will peak at
some point in the future before gradually declining as oil reserves diminish and
their exploitation becomes increasingly expensive.
With diminishing natural oil reservoirs, aircraft fuel could be synthesised from
charcoal via synthesis, which is a range of chemical processes: in the first step
syngas, which is a mixture of carbon monoxide and hydrogen as, is obtained from
coal through high temperature gasification with oxygen and steam. Subsequent
Fischer-Tropsch synthesis converts the mixture of carbon monoxide and hydrogen
into liquid hydrocarbons, which could be turned into aircraft fuel.
With an estimated 826 109 tonnes global coal reserves, and an annual consump-
tion of 5.7 109 tonnes33, the world will run out of coal in 144 years from 2011.
Again, this assumes global coal consumption remaining at 2009 levels, which is
unlikely to occur in the real world.
On the other hand, above estimates may be too high by several factors as a de-
crease of global energy demand and substituting fossil fuels with renewable en-
ergy sources or nuclear reactors will reduce the demand for fossil fuel. However,
considering the range of scenarios and possibilities, there are many reasons to be-
lieve that mankind can expect a serious shortfall of fossil fuels within the next 2-4
generations and precautionary actions should be taken to avoid worst case scenar-
ios. This time period is approximately similar to the time that has passed between
the Wright Brothers have undertaken their first heavier-than-air flight with Kitty-
Hawk and this sentence was written.
Aircraft engine design engineers are faced with the challenge to reduce the fuel
consumption of jet engines over time. This is achieved initially through step

42
changes and incremental improvements of existing designs. These changes are
associated with low risk as they are based on proven practice. However, these in-
cremental improvements will increasingly require disproportionally larger invest-
ment and are eventually restricted by the laws of physics. The law of diminishing
returns will cause a shift of attention towards technologies with larger long term
potential. The risk of introducing a new technology, which is a measure of the
amount of investment required and probability of success, is outweigh by the di-
minishing advantage the existing technology exhibits. For example, investment in
existing engine technology to achieve a limited improvement in performance of
existing technology could be used instead to develop far superior technology. If
the investments become equal then there will be a time that the change to more
disruptive technologies is considered.
Figure 12: Inflation adjusted monthly crude oil prices (1946 – 2011) in June 2010 US Dol-
lars35.

43
The trigger for the change may well be external circumstances, such as economi-
cal advantages, war or natural threads. As long as people have the feeling that
natural resources are abundant and that climate change is not a direct thread, in-
vesting in new technology may be seen as unnecessary. In the meanwhile, possi-
ble disruptive technologies are being invented and developed.
“Most people are unwilling to spend a lot of money to a future problem, espe-
cially when the outcome is uncertain. One good reason for waiting is that there
will be less costly options available in the future”36.
As fossil fuels become less abundant and more expensive (compare with Figure
12) and effects of climate change are posing a more direct thread to humans, more
disruptive solutions are becoming introduced, which will lead to new engine con-
figurations where eventually alternative energy sources are used once a revolution
in fuel infrastructure has taken place37.

44
3 Computational Model
A computational model was created to calculate the theoretical performance of
various thermodynamic cycles in order to facilitate a comparison. The perform-
ance of jet engines can be measured by indicators such as specific fuel consump-
tion (SFC), specific thrust (FS) and the overall efficiency (η0).
Inta
ke
Fan Compressor
Splitter
Mixer
Splitter
CombustionChamber
Noz
zle
Noz
zle
Turb
ine
1Ambient
2 3
12
4
7
5 6
9
10 11
13
Turbine
8
Figure 13: Representation of the mathematical model.
The performance parameters are indicators of the fuel efficiency and size of the
engine. The specific fuel consumption denotes the mass unit of fuel consumed per
mass unit of propulsive force generated. The overall efficiency is a measure of
how efficiently the chemical energy stored in the fuel is converted into useful en-
ergy utilised for propulsion. The higher the specific fuel consumption, the lower
the overall efficiency. The specific thrust denotes the mass unit of thrust generated
by the engine per mass unit of air passing through the engine. For a given thrust
45
requirement, lower specific thrust indicates more air to pass through the engine
resulting in larger engine dimensions.
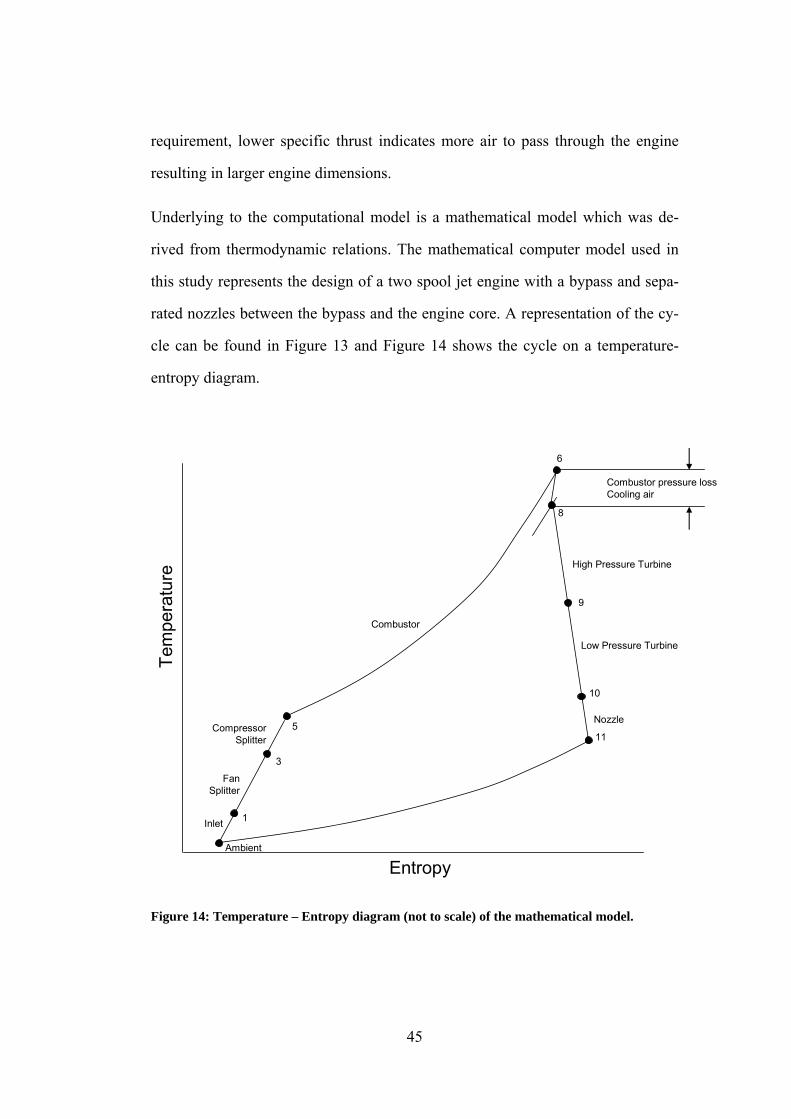
Underlying to the computational model is a mathematical model which was de-
rived from thermodynamic relations. The mathematical computer model used in
this study represents the design of a two spool jet engine with a bypass and sepa-
rated nozzles between the bypass and the engine core. A representation of the cy-
cle can be found in Figure 13 and Figure 14 shows the cycle on a temperature-
entropy diagram.
FanSplitter
CompressorSplitter
1
3
5
8
9
10
Combustor pressure lossCooling air
11
Ambient
Inlet
High Pressure Turbine
Low Pressure Turbine
Nozzle
Tem
pera
ture
Entropy
Combustor
6
Figure 14: Temperature – Entropy diagram (not to scale) of the mathematical model.
46
The mathematical model was translated into a computer code to perform the cal-
culations to predict the theoretical performance of the various engine designs in-
vestigated in this thesis. MATLAB was chosen as computer language, which is a
programming environment intended for numerical computing and which allows
the optimisation to obtain a set of engine parameters that result in the best possible
fuel efficiency. The computational model was coded with enough flexibility to
allow the replacement of the combustor unit of a conventional cycle with different
core cycles: wave rotor, pulse detonation and internal combustion.
The computational model incorporates a one dimensional, thermodynamic de-
scription of the engines’ gas paths. As the main purpose of the model was to com-
pare the performance of conventional jet engine designs to the performance of un-
conventional, hybrid designs, constant gas parameters were used throughout all
calculations for simplification. The compression and expansion processes in the
model are assumed to take place adiabatically and the International System of
Units (SI) was used.
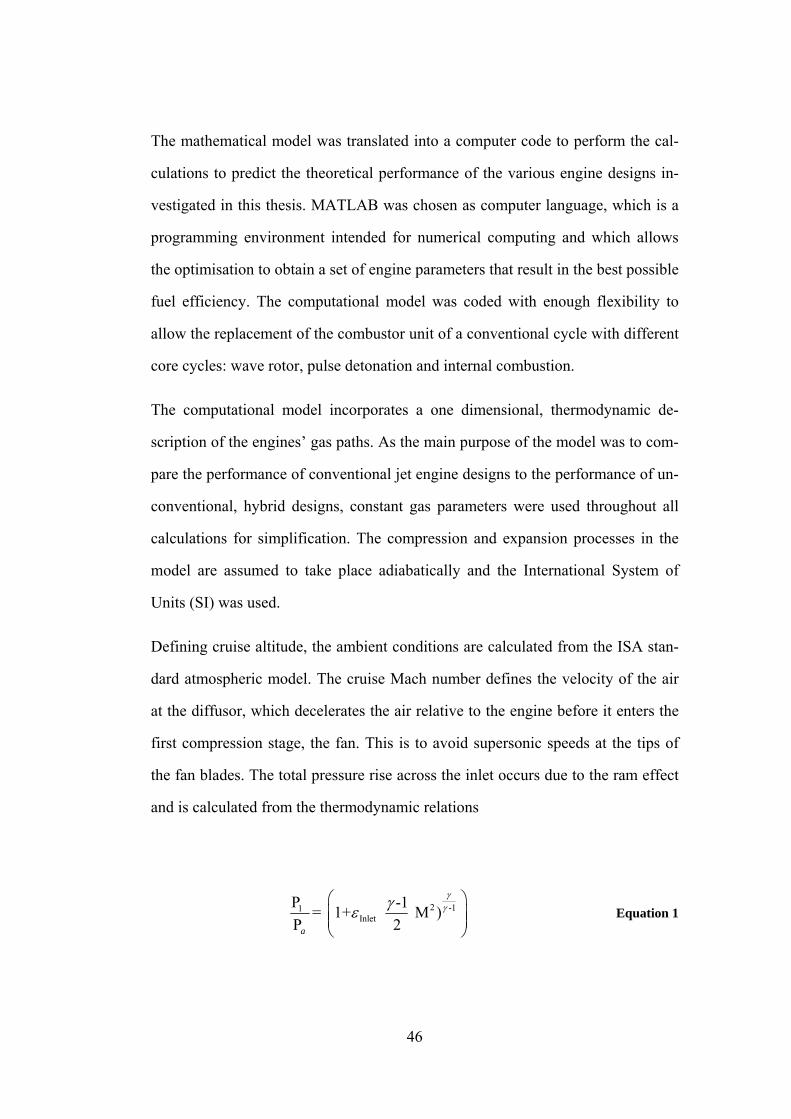
Defining cruise altitude, the ambient conditions are calculated from the ISA stan-
dard atmospheric model. The cruise Mach number defines the velocity of the air
at the diffusor, which decelerates the air relative to the engine before it enters the
first compression stage, the fan. This is to avoid supersonic speeds at the tips of
the fan blades. The total pressure rise across the inlet occurs due to the ram effect
and is calculated from the thermodynamic relations
2 -11Inlet
P -1= 1+ M )P 2a
γγγε
⎛ ⎞⎜ ⎟⎜ ⎟⎝ ⎠
Equation 1

47
where εInlet is the isentropic compression efficiency of the diffusor to account for
component losses. The total temperature rise across the diffusor is calculated from
the following thermodynamic relation
21
a
T -1= 1+ MT 2
γ⎛ ⎞⎜ ⎟⎝ ⎠
Equation 2
Once passed through diffusor, the incoming air is compressed in two stages before
a fraction of it is heated in the combustion chamber.
The first stage is the fan stage, where all of the incoming, decelerated air is com-
pressed. The compression ratio is defined by the fan geometry and rotational
speed, which determines the total temperature rise across the compression stage.
The increase in pressure across the fan in modern turbofan engines is typically
between 1.2 and 1.6 and varies during the flight as thrust requirements change
along the mission profile with decreasing aircraft weight, which causes a change
in the throttle setting. A change in throttle setting generally causes a change in all
processes as including bypass ratio, compressor pressure ratio and mass flow. The
temperature rise across the fan and the other compression stage is calculated from
the polytropic relation
Compressor
1 -1
2 2
1 1
T P =T P
γε γ⎛ ⎞
⎜ ⎟⎝ ⎠
Equation 3
48
As the compression of the air in turbomachinery is never ideal and occurs with an
increase in entropy, for example due to small scale turbulences, the polytropic ef-
ficiency ε is used to account fur such losses. The air leaving the fan stage is now
partially directed into the bypass duct and the mass flow ratio of the air entering
the bypass to the air entering the engine core is defined as the bypass ratio. Fur-
ther compression of the air in the engine core takes place. As the overall pressure
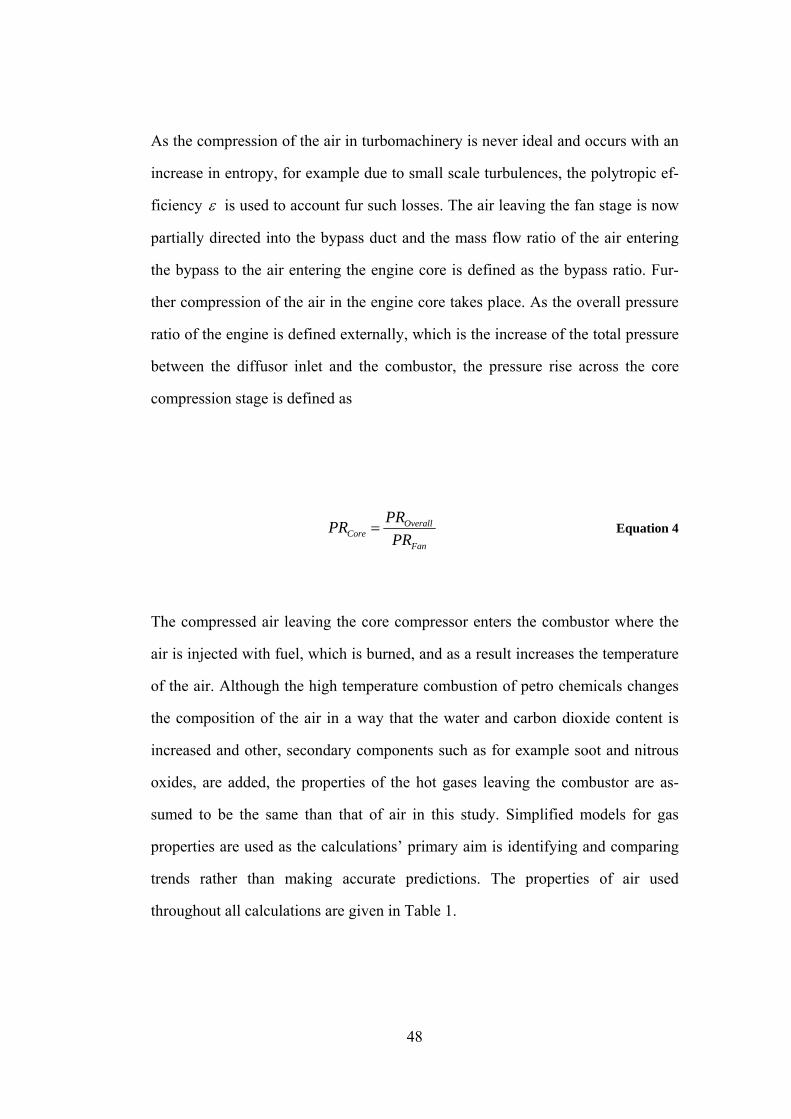
ratio of the engine is defined externally, which is the increase of the total pressure
between the diffusor inlet and the combustor, the pressure rise across the core
compression stage is defined as
OverallCore
Fan
PRPRPR
= Equation 4
The compressed air leaving the core compressor enters the combustor where the
air is injected with fuel, which is burned, and as a result increases the temperature
of the air. Although the high temperature combustion of petro chemicals changes
the composition of the air in a way that the water and carbon dioxide content is
increased and other, secondary components such as for example soot and nitrous
oxides, are added, the properties of the hot gases leaving the combustor are as-
sumed to be the same than that of air in this study. Simplified models for gas
properties are used as the calculations’ primary aim is identifying and comparing
trends rather than making accurate predictions. The properties of air used
throughout all calculations are given in Table 1.

49
Constant Value
Specific heat capacity of air (cp) 1,000 J/(kg K)
Gas constant (R) 287 J/(kg K)
Ratio of specific heats (γ) cp/(cp-R)
Fuel net calorific value (qFuel) 43E6 [J/kg]
Table 1: Definition of constants in the computational model.
A fraction of the air entering the combustion stage is directed around the flame
section and used to keep the temperature of the combustor walls and the turbine
blades below the melting point of the material they are made of. The fraction of
air used for cooling is typically 5% of the air in the engine core. In the computa-
tional model, a total pressure loss is taken into account over the combustion stage,
which occurs due to aerodynamic friction within the combustion device and also
the momentum changes produced by the combustion process itself. The turbine
entry temperature is defined by the throttle setting and knowing the total tempera-
ture entering the combustion chamber, the fuel mass flow required can be calcu-
lated from
p CombustorFuel Air
c Tm /m =
FuelqΔ
& & Equation 5

50
whereas ΔTcombustor is the temperature difference between T6 and T5, the tempera-
ture at the inlet and the outlet of the combustor.
In the computational model, the mixing of the cooling air and the hot gases exit-
ing the combustion stage is assumed to take place stoichiometrically and adiabati-
cally before the hot gases enter the turbine stages. In reality, the cooling flow
would be injected through drillings in the turbine blades to provide a cooling film
between the hot combustion gases and the blade itself.
The total pressure and total temperature loss in the turbines is defined by the work
required to compress the air in the compression stages. The mechanical power that
is generated in the high pressure turbine equals the mechanical power required to
drive the high pressure compression stage. From this relationship, the temperature
exiting the turbine is calculated and taking into account efficiency losses, the total
pressure change over the turbine stage is calculated from
Turbine
1-1
9 9
8 8
P T = P T
γγ ε⎛ ⎞
⎜ ⎟⎝ ⎠
Equation 6
The work extracted from the hot gases in the low pressure turbine equal the work
to drive the fan stage. The above mentioned calculation is repeated in the low
pressure turbine stage.
In order to calculate the thrust generated by the engine, it is required to calculate
the velocity of the air exiting the turbine stages and the bypass duct. This com-
51
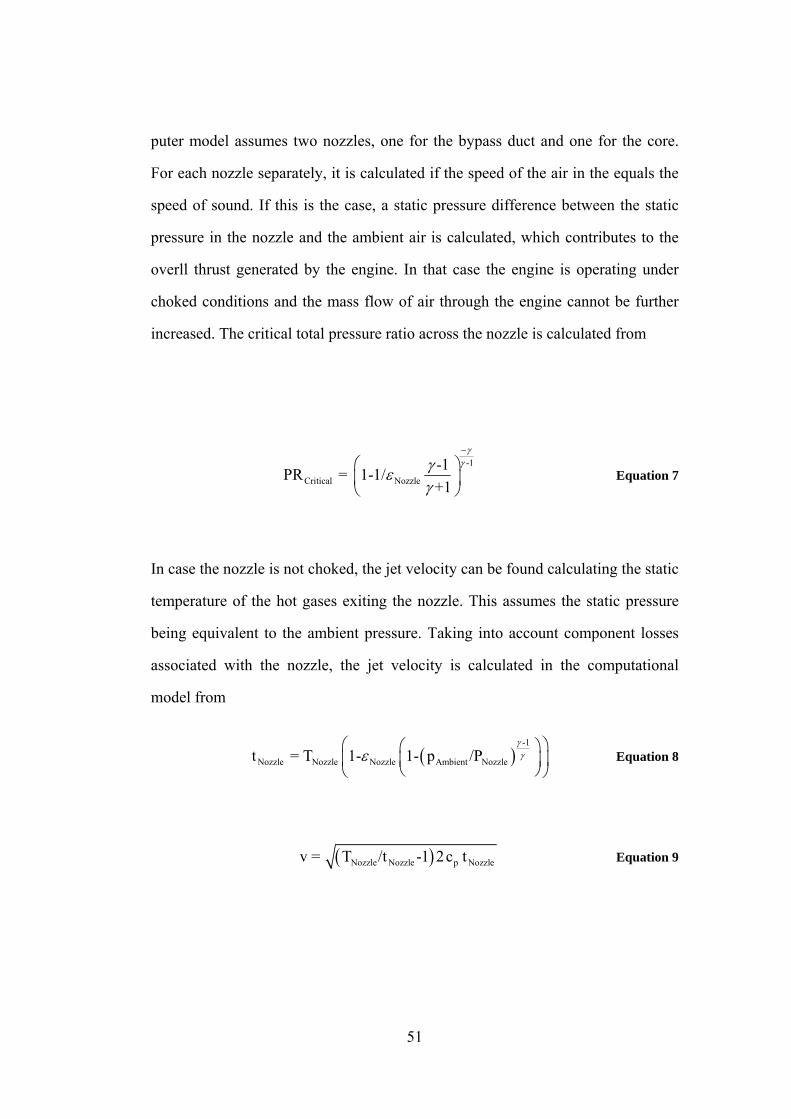
puter model assumes two nozzles, one for the bypass duct and one for the core.
For each nozzle separately, it is calculated if the speed of the air in the equals the
speed of sound. If this is the case, a static pressure difference between the static
pressure in the nozzle and the ambient air is calculated, which contributes to the
overll thrust generated by the engine. In that case the engine is operating under
choked conditions and the mass flow of air through the engine cannot be further
increased. The critical total pressure ratio across the nozzle is calculated from
-1
Critical Nozzle-1PR = 1-1/+1
γγγε
γ
−
⎛ ⎞⎜ ⎟⎝ ⎠
Equation 7
In case the nozzle is not choked, the jet velocity can be found calculating the static
temperature of the hot gases exiting the nozzle. This assumes the static pressure
being equivalent to the ambient pressure. Taking into account component losses
associated with the nozzle, the jet velocity is calculated in the computational
model from
( )-1
Nozzle Nozzle Nozzle Ambient Nozzle t = T 1- 1- p /Pγγε
⎛ ⎞⎛ ⎞⎜ ⎟⎜ ⎟
⎝ ⎠⎝ ⎠ Equation 8
( )Nozzle Nozzle p Nozzle v = T /t -1 2c t Equation 9
52
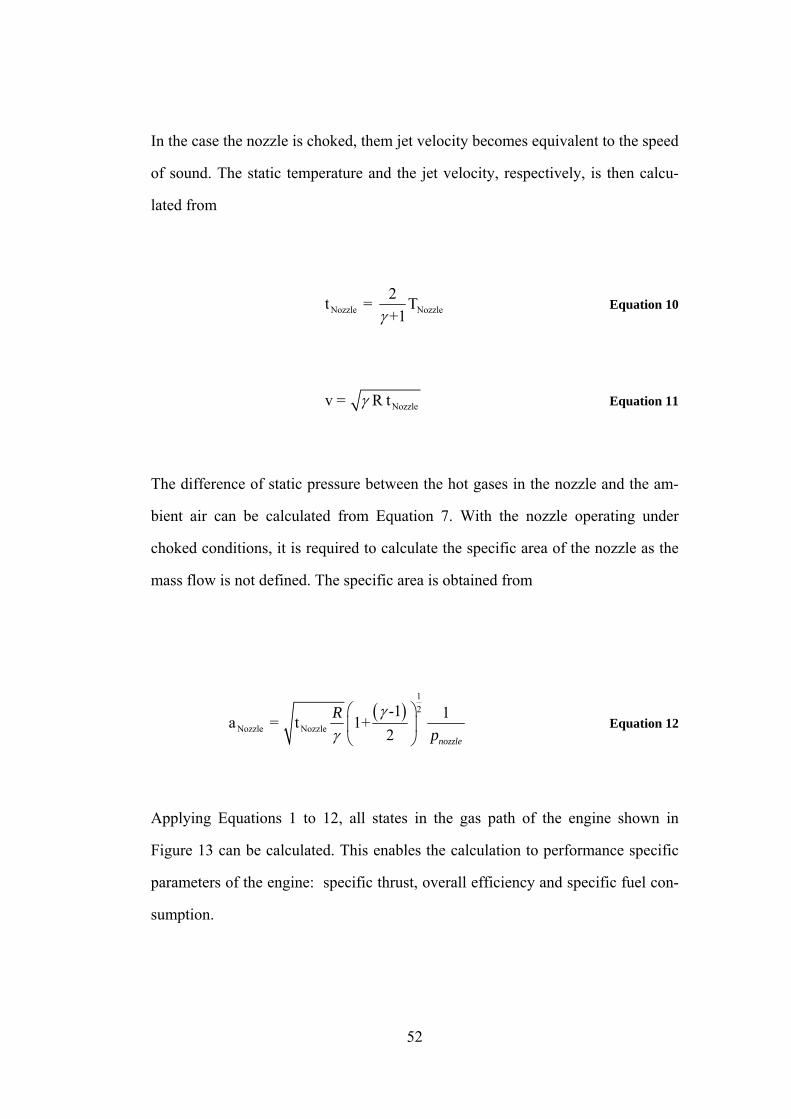
In the case the nozzle is choked, them jet velocity becomes equivalent to the speed
of sound. The static temperature and the jet velocity, respectively, is then calcu-
lated from
Nozzle Nozzle2t = T+1γ
Equation 10
Nozzlev = R tγ Equation 11
The difference of static pressure between the hot gases in the nozzle and the am-
bient air can be calculated from Equation 7. With the nozzle operating under
choked conditions, it is required to calculate the specific area of the nozzle as the
mass flow is not defined. The specific area is obtained from
( )12
Nozzle Nozzle
-1 1a = t 1+2 nozzle
Rp
γγ⎛ ⎞⎜ ⎟⎝ ⎠
Equation 12
Applying Equations 1 to 12, all states in the gas path of the engine shown in
Figure 13 can be calculated. This enables the calculation to performance specific
parameters of the engine: specific thrust, overall efficiency and specific fuel con-
sumption.

53
Specific thrust is the thrust produced by the engine for each unit of mass of air
passing through the engine. It is calculated from a momentum balance of the hot
air exiting the nozzles and the pressure difference of the air within and outside the
nozzles. The thrust for the bypass and core is calculated separately and combined
in one figure.
( ) ( )S Jet Ambient Nozzle Nozzle AmbientF = v - v +a p - p Equation 13
The overall efficiency is an indicator of how much of the chemical energy stored
in the fuel is converted into useful energy. Useful energy is the product of thrust
and velocity of the engine through the air it passes whereas the chemical energy
consumed is a product of fuel consumption and the energy stored for each mass
unit of fuel.
Ambient S0
v F= Combustor
p CombustorTotal
mc Tm
ηΔ
&
&
Equation 14
The specific fuel consumption indicates how much fuel is used for each unit of
thrust generated by the engine.

54
p Combustor Combustor
Total
c T m 1SFC = mFuel Sq F
Δ &
& Equation 15
In addition, entropy changes between the different stages were calculated to allow
a graphical representation of the cycle in form of a Temperature – Entropy dia-
gram. Entropy changes are calculated from
pT P = c log -R logT' P'
s ⎛ ⎞ ⎛ ⎞Δ ⎜ ⎟ ⎜ ⎟⎝ ⎠ ⎝ ⎠
Equation 16

55
4 Conventional Turbofan
The theoretical performance of a conventional turbofan was used as baseline en-
gine and comprises a design as outlined in the previous section. It consists of an
inlet, fan, compressor, bypass, combustor, turbines and nozzles. Certain technol-
ogy parameters and operating conditions were assumed as summarised below.
The altitude for which ambient conditions are calculated remained the same for all
calculations performed in this study. For longer range, turbofan-powered aircraft,
average cruise altitudes have remained fairly constant over the past 35 years at
approximately 10.5 – 11.5 km although some commercial aircraft have ceilings of
up to 13 km (Figure 15)38. Aircraft sometimes cruise below optimum design
cruise altitudes for reasons associated with air traffic control or severe weather
conditions, for example storms and clear air turbulence. Flying at lower cruise al-
titudes can significantly increase fuel burn depending on range and passenger
load. As for civil aircraft the cruise altitude is not expected to increase above 13
km over the next 50 years as a result of physical and cost limitations and aircraft
often fly lower than the design altitude, this study assumes 10 km throughout all
calculations.
At 10 km, the standard atmosphere model yields 223 K for ambient temperature
and 261 hPa39 for ambient pressure.
In terms of cruise speed, this study assumes Mach 0.85 for all calculations. This is
in alignment with cruise speeds observed for most commercial airliners powered
by turbofan engines, which is about 500 knots and equates to approximately Mach
0.85 (see Figure 16). A summary of the flight conditions is given in Table 2.

56
Figure 15: Cruise altitudes of commercial transport aircraft. Modern airliners’ cruise alti-
tude averages at approximately 10 km38.
Figure 16: Cruise speed for long range airliners, equating to approximately Mach 0.8538.
Flight condition parameters Value
Altitude 10,000 m
Mach Number (M) 0.85
Ambient Temperature 223 K
Ambient Pressure 261 hPa
Table 2: Flight conditions used in the computational model.

57
The isentropic and also polytropic component efficiencies used throughout this
study are summarised in Table 3. They represent state of the art technology levels
and were obtained from data available in the public domain and various discus-
sions with industry experts. Although different in a mathematical context, isen-
tropic efficiency and polytropic efficiency both denote the absorption of useful
work and define the ratio of actual and ideal work transfers. Assuming processes
to take place adiabatic, the ideal process would be isentropic – without increasing
the entropy of the system during the process. The ideal process compared to the
actual process defines the efficiency of the system. The useful work gained during
a process defined by a specific isentropic efficiency does not necessarily relate to
the same value if translated into polytropic efficiency although the difference in
value may not be vast.
In case of a compressor, the power required to compress air can be directly related
into the pressure difference of the air before and after the compression process, or
the pressure ratio. There is a theoretical maximum of the pressure ratio that can be
achieved in a compressor but in practice, the achievable pressure ratio will always
be below the theoretical maximum. The polytropic efficiency for compressors var-
ies with the pressure rise across the compression stage. In general, the higher the
desired pressure rise across the compression stage, the higher the associated effi-
ciency losses that occurs. In addition, axial flow compressors used in gas turbines
operate with varying efficiencies depending on the mass flow that passes through
the engine. For turbines, the effect is reversed. Turbines convert energy more effi-
ciently with increasing pressure ratios across the turbine stage.
In case of inlets or nozzles, the isentropic efficiency implies that kinetic energy is
inefficiently used. The kinetic energy could otherwise be used to increase the total

58
pressure in case of the engine inlet, or enhance the thrust of the engine in case of a
nozzle.
Component Efficiency (Polytropic) Value
Intake 0.99
Fan pressure compressor 0.88
Low pressure compressor 0.88
Low pressure turbine 0.92
High pressure turbine 0.92
Nozzles 0.99
Table 3: Component efficiencies, combustor pressure loss and cooling flow used in the com-
putational model.
The pressure loss that occurs during the combustor as a result of friction and due
to the momentum exchange during the combustion process is taken into account
during this study and is assumed to be 5% of the inlet pressure to the combustor.
The cooling flow extracted form the flow after the compression stage and is as-
sumed to be redirected to the flow after the combustor. The mixing of the hot and
cold gases is assumed to take place isentropically.
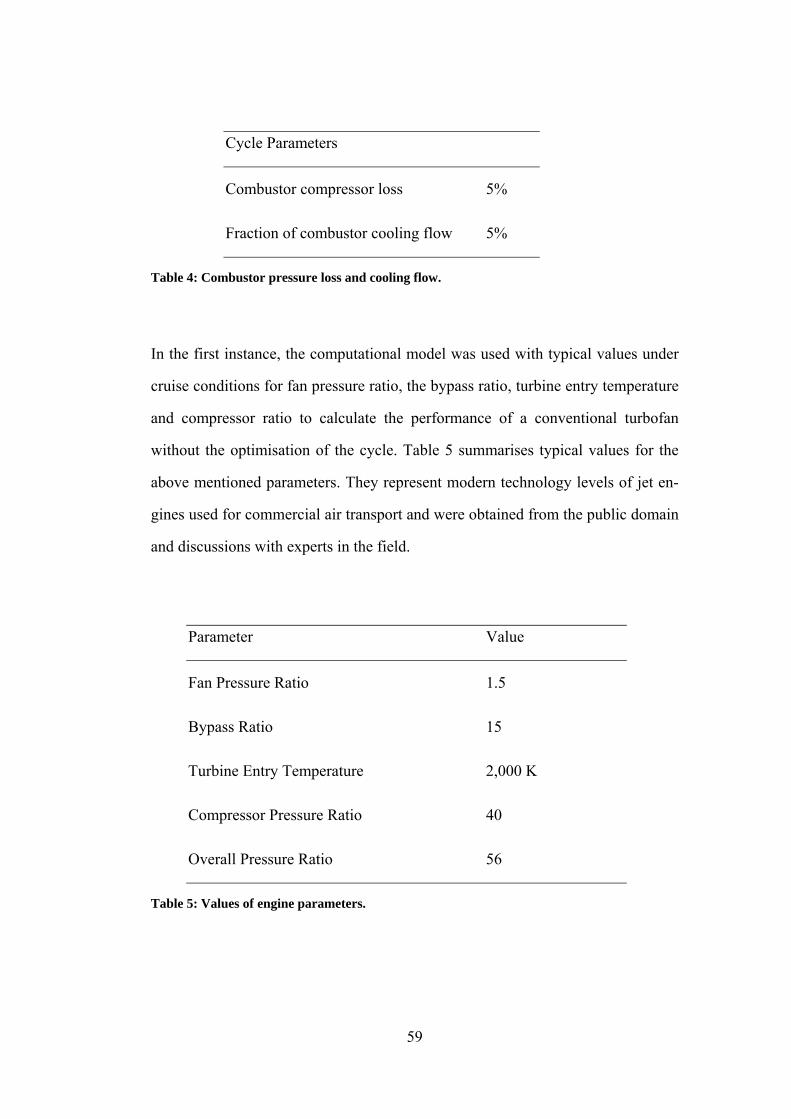
59
Cycle Parameters
Combustor compressor loss 5%
Fraction of combustor cooling flow 5%
Table 4: Combustor pressure loss and cooling flow.
In the first instance, the computational model was used with typical values under
cruise conditions for fan pressure ratio, the bypass ratio, turbine entry temperature
and compressor ratio to calculate the performance of a conventional turbofan
without the optimisation of the cycle. Table 5 summarises typical values for the
above mentioned parameters. They represent modern technology levels of jet en-
gines used for commercial air transport and were obtained from the public domain
and discussions with experts in the field.
Parameter Value
Fan Pressure Ratio 1.5
Bypass Ratio 15
Turbine Entry Temperature 2,000 K
Compressor Pressure Ratio 40
Overall Pressure Ratio 56
Table 5: Values of engine parameters.

60
The initial calculation yields a specific fuel consumption of 1.31 10-5 (kg/s)/N, a
specific thrust of 110.4 N/(kg/s) and overall efficiency of 0.45, which is in line
with the performance figures of modern, conventional turbofan engines40.
Figure 1 shows the calculated cycle on a temperature – entropy diagram. The
compression of the air results in an entropy increase and an increase of tempera-
ture. The temperature difference between ambient air and air entering the combus-
tor is 694K; the combustor delivery temperature is 950K compared to 256K ambi-
ent temperature. The temperature of the air leaving the turbine stages is 808K,
which is higher than the air entering the combustor. In the bypass, the temperature
increase due to fan compression is 29.7K. Both nozzles are choked and the exit
temperature of the air in the bypass nozzle is 309 m/s compared to 520 m/s for the
much hotter core air.
Performance Parameter Value
Specific Fuel Consumption 1.31 10-5 kg/s/N
Specific Thrust 110.4 N/(kg/s)
Overall Efficiency 0.45
Table 6: Performance results.

61
Figure 1: T-S diagram of a conventional turbo fan (bypass not shown). Dashed lines are iso-
bars.
4.1 Sensitivity Analysis
A sensitivity analysis was performed to calculate the relative change in perform-
ance for relative changes in the engine parameters based on results of the initial
calculation. The engine parameters, fan pressure ratio, the bypass ratio, turbine
entry temperature and compressor ratio, were varied by ±10% at a time while the
other parameters were held constant and the resulting performance was recorded.
62
Relative changes in engine performance due to the variations are shown in Table
7.
A 10% change in fan pressure ratio has the biggest effect on the performance of
the engine. The overall efficiency increases by 5.4% for a 10% increase in fan
pressure ratio and decreases by 15.2% for a 10% reduction in fan pressure ratio.
The specific fuel consumption is affected adversely and increases by 18.0% for a
10% decrease in fan pressure ratio and decreases by 5.1% for a 10% increase in
fan pressure ratio. The specific thrust comes down by 12.6% if the fan pressure
ratio is reduced by 10% as the bypass mass flow is contributing less propulsive
force and increases by 2.4% for a 10% increase in fan pressure ratio.
The cycle performance is least sensitive for changes in the compressor pressure
ratio where changes of less than 2% were recorded for a 10% change in compres-
sor pressure ratio in both directions. The specific thrust is marginally affected and
increases by 1.3% in both directions.
A 10% increase in bypass ratio had a beneficial effect on engine performance as it
resulted in a 3.2% increase in overall efficiency and 5.6% decrease in specific fuel
consumption. The opposite would occur for a 10% decrease in bypass ratio. The
specific thrust increases by 6.1% for a 10% decrease in bypass ratio but comes
down by 5.6% for a 10% increase in bypass ratio.
An increase of 10% in turbine entry temperature resulted in a 7.6% decrease of the
overall efficiency of the cycle. For the Brayton cycle and its derivatives, analysis
predicts an increase in overall efficiency for increasing cycle temperature. How-
ever, results of the sensitivity analysis suggest the opposite. This means that the
combination of the engine parameters used in this calculation does not result in
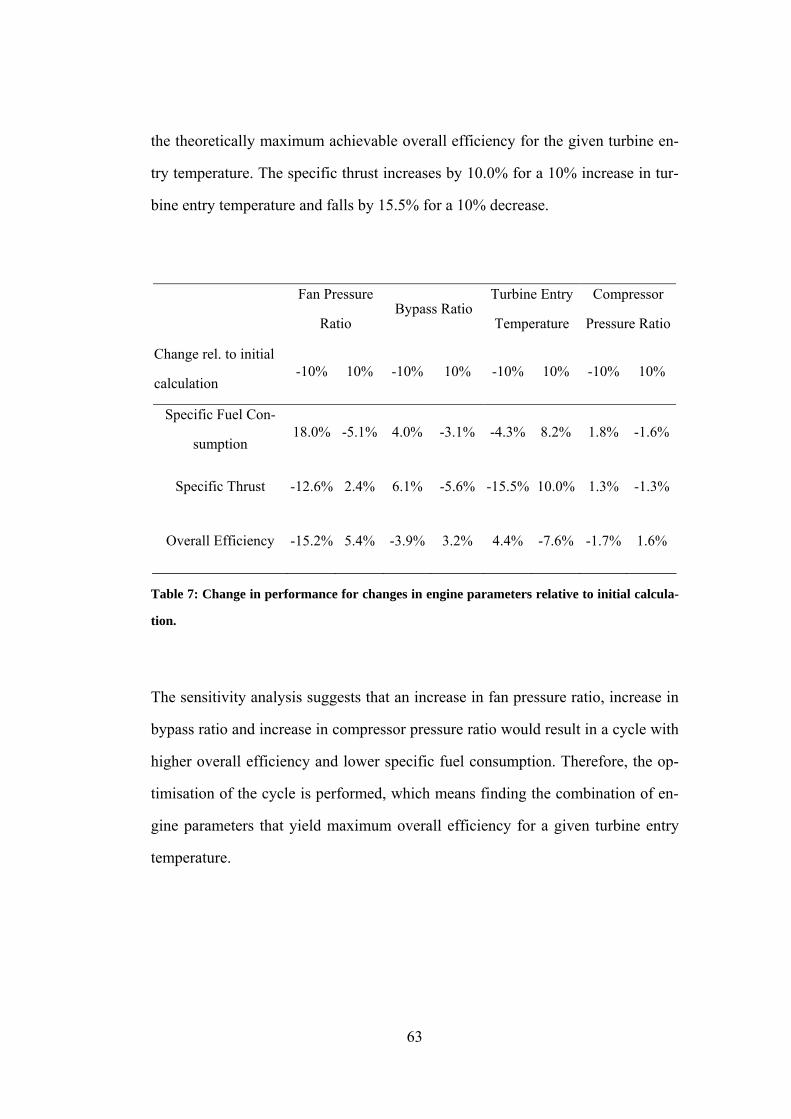
63
the theoretically maximum achievable overall efficiency for the given turbine en-
try temperature. The specific thrust increases by 10.0% for a 10% increase in tur-
bine entry temperature and falls by 15.5% for a 10% decrease.
Fan Pressure
Ratio Bypass Ratio
Turbine Entry
Temperature
Compressor
Pressure Ratio
Change rel. to initial
calculation -10% 10% -10% 10% -10% 10% -10% 10%
Specific Fuel Con-
sumption 18.0% -5.1% 4.0% -3.1% -4.3% 8.2% 1.8% -1.6%
Specific Thrust -12.6% 2.4% 6.1% -5.6% -15.5% 10.0% 1.3% -1.3%
Overall Efficiency -15.2% 5.4% -3.9% 3.2% 4.4% -7.6% -1.7% 1.6%
Table 7: Change in performance for changes in engine parameters relative to initial calcula-
tion.
The sensitivity analysis suggests that an increase in fan pressure ratio, increase in
bypass ratio and increase in compressor pressure ratio would result in a cycle with
higher overall efficiency and lower specific fuel consumption. Therefore, the op-
timisation of the cycle is performed, which means finding the combination of en-
gine parameters that yield maximum overall efficiency for a given turbine entry
temperature.

64
4.2 Optimisation
MATLAB was used to find the combination of cycle parameters resulting in the
theoretically lowest possible specific fuel consumption. A medium scale algo-
rithm was chosen, which is as part of the MATLAB command ‘fmincon’ and
which attempts to find a constrained minimum of a scalar function of several vari-
ables starting at an initial estimate. This is generally referred to as constrained,
nonlinear optimisation, or also nonlinear programming. The medium-scale algo-
rithm used in this study incorporates a sequential quadratic programming method.
In this method, the function solves a quadratic programming sub-problem at each
iteration and an estimate of the Hessian of the Lagrangian is updated at each itera-
tion41,42. A line search is performed using a merit function similar to that described
in references 43, 44 and 45. The quadratic programming sub-problem is solved using
an active set strategy46.
A set of optimisation parameters was defined used by both the medium-scale and
large-scale algorithms. They limit function evaluations, define termination toler-
ance and set the minimum and maximum change of the function variables (the
engine parameters). The objective of the optimisation was to find a set of engine
parameters for a given turbine entry temperature that yield the lowest possible
specific fuel consumption. By definition, the specific fuel consumption should
have a value greater than 0 and the magnitude of its sensitivity to changes in en-
gine parameters is comparable to the magnitude of changes in the engine parame-
ters as seen in the sensitivity analysis. A 10% change in the engine parameters, for
example in bypass ratio, yielded in a comparable, relative change of the specific
fuel consumption. Hence, the specific fuel consumption of an optimised cycle
should be in the range of 0 – 10-5 and the difference in terms of specific fuel con-
65
sumption between two optimised cycles should be within that range. A termina-
tion tolerance of 1E-10 was set which gives sufficient margin as differences in
terms of specific fuel consumption between two optimised cycles are expected to
be in the range of several per cent. The table below summarises all optimisation
parameters used in this study. In case that the optimisation terminated due to
maximum iterations or function evaluations or meaningless results were gener-
ated, necessary adjustments were made and the other parameters and constraints
were reviewed.
Optimisation constraints for the engine parameters were defined as outlined in
Table 8. In case the optimisation terminated due to constrain violations, the con-
straints were reviewed and the optimisation repeated. The fan pressure ratio was
constraint to values between 1 and 2. Values lower than one have no meaning as
the fan has the purpose to accelerate the air in the bypass. The pressure ratio
across a fan is typically in the range of 1.2 - 1.6 as higher values become difficult
to achieve without fan performances losses unless several fan stages are utilised.
The constraints for compressor pressure ratio were 2 - 200 and bypass ratio were 5
- 100. Compressor ratios of about 50 can be found in modern turbofan engines
whereas bypass ratios are about 15. Larger bypass ratios would indicate alterna-
tive propulsor technology such as open rotors or distributed propulsion47. If the
optimisation termination was due to constraint violation, results were reviewed
and the optimisation repeated if necessary.

66
Parameter Value
Max. iterations 500
Max. function evaluations 1E5
Termination tolerance of function value 1E-10
Termination tolerance on constraint violation 1E-10
Termination tolerance on x 1E-10
Max. change in variables 0.1
Min. change in variables 1E-10
Table 8: Optimiser parameters.
Variables Constraints (lower, upper)
Fan Pressure Ratio 1 – 2
Compressor Pressure Ratio 2 – 200
Bypass Ratio 5 – 100
Table 9: Optimisation constraints

67
The turbine entry temperature was held fixed during optimisation since the maxi-
mum achievable overall efficiency increases with increasing temperature. In the
first instance, the turbofan cycle was optimised and results compared to initial re-
sults as described in Section 4. The optimisation took 38 iterations until the mag-
nitude of the directional derivative in the search direction was less than 2 times
the termination tolerance of the function value as specified in Table 8. All subse-
quent optimisations in this thesis took comparable iterations to terminate because
the termination tolerance on the function value was exceeded. Figure 17 shows the
development of the function value (specific fuel consumption) for each iteration
step.
1.1
1.2
1.3
1.4
1.5
1.6
1.7
1 3 5 7 9 11 13 15 17 19 21 23 25 27 29 31 33 35 37 39
Iteration
Func
tion
Valu
e
Figure 17: Function value for each optimisation iteration.

68
The cycle optimised for minimum specific fuel consumption with a turbine entry
temperature of 2,000K has a fan pressure ratio of 1.26, a bypass ratio of 23.7 and
a compressor ratio of 84. The calculated fan pressure ratio is well within what is
achievable with current fan technology and even below what is current practice.
The bypass ratio of 23.7 is, however, exceeding what is achievable with conven-
tional turbofan technology and indicates the requirement for alternative propulsor
technology. The calculated compressor pressure ratio of 84 is very high for cur-
rent standards. Higher pressures result in smaller turbomachinery and the effi-
ciency losses associated with blade tip clearances. Compared to the performance
of the non optimised cycle, the fan pressure ratio is 10% lower, the bypass ratio is
58% higher and the compressor pressure ratio is 110% higher as shown in Table
10.
Parameter Initial Value Optimised Cycle
Fan Pressure Ratio 1.4 1.26 (-10%)
Bypass Ratio 15 23.7 (+58%)
Turbine Entry Temperature 2,000 K 2,000 K
Compressor Pressure Ratio 40 84 (+110%)
Overall Pressure Ratio 56 106.3 (+90%)
Table 10: Values of engine parameters for initial cycle and optimised cycle.

69
Performance Parameter Initial Value Optimised Cycle
Specific Fuel Consumption [10-5 (kg/s)/N] 1.31 10-5 1.18 10-5 (-10%)
Specific Thrust [N/(kg/s)] 110.4 62.9 (-43%)
Overall Efficiency [-] 0.45 0.50 (+11%)
Table 11: Performance results for initial cycle and optimised cycle.
In terms of performance, the theoretical performance of the optimised cycle is in-
dicates a 10% reduction in terms of specific fuel consumption, a 43% decrease in
terms of specific thrust and a 11% increase in terms of overall efficiency. Table 11
summarises the results of the optimised cycle compared to initial results.
The optimisation of the cycle was repeated for a range of turbine entry tempera-
tures. The turbine entry temperature was varied from 1,700K to 2,200K in 100K
steps and results recorded as summarised in Table 12. The calculated bypass ratios
range from 18.2 to 27.5 and increases for higher values of turbine entry tempera-
ture. A similar trend is visible for the compressor pressure ratio which ranges
from 53.5 to 110.2, whereas the fan pressure ratio resulting in minimum specific
fuel consumption is independent of turbine entry temperature with a value of 1.26.
In terms of performance, higher turbine entry temperatures result in more fuel ef-
ficient cycles ranging from 47% to 52% whereas the impact on specific thrust is
relatively low (from 63.3 down to 62.8 N/(kg/s)).
It should be noted that although the different cycles represent a 2 spool turbofan
configuration, the actual engines that would operate with the particular cycles
would be very different. A higher bypass ratio is resulting in a larger engine di-
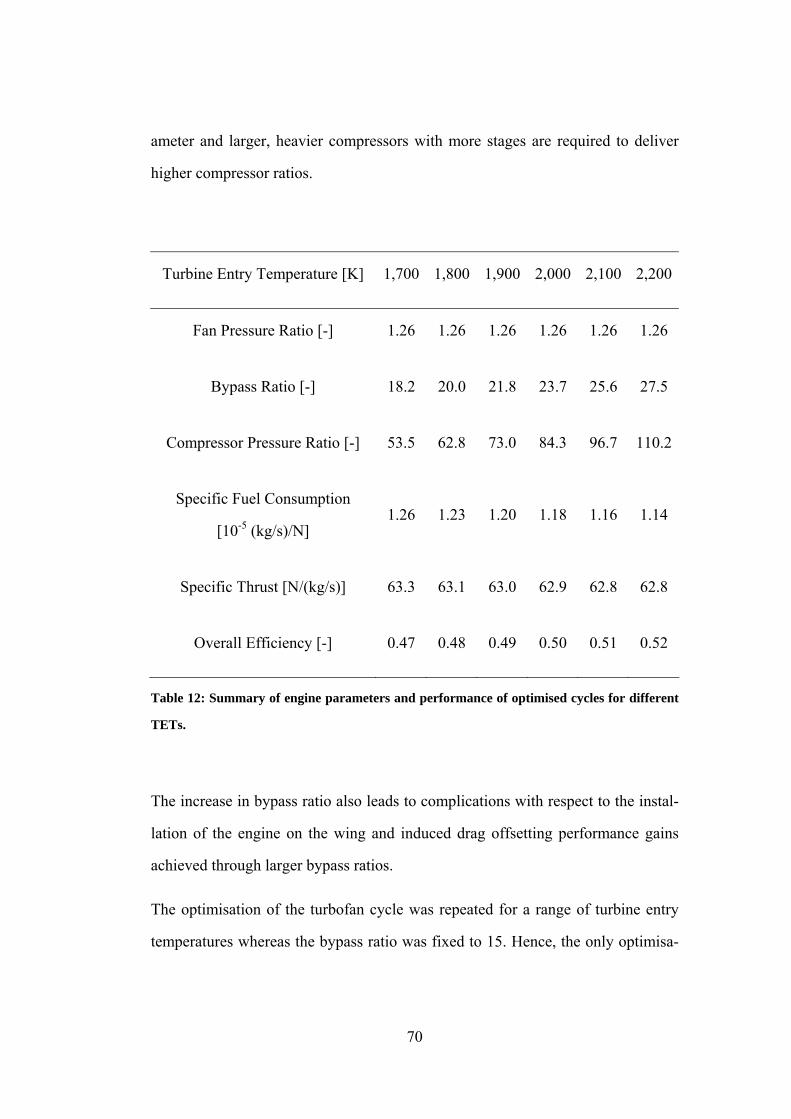
70
ameter and larger, heavier compressors with more stages are required to deliver
higher compressor ratios.
Turbine Entry Temperature [K] 1,700 1,800 1,900 2,000 2,100 2,200
Fan Pressure Ratio [-] 1.26 1.26 1.26 1.26 1.26 1.26
Bypass Ratio [-] 18.2 20.0 21.8 23.7 25.6 27.5
Compressor Pressure Ratio [-] 53.5 62.8 73.0 84.3 96.7 110.2
Specific Fuel Consumption
[10-5 (kg/s)/N] 1.26 1.23 1.20 1.18 1.16 1.14
Specific Thrust [N/(kg/s)] 63.3 63.1 63.0 62.9 62.8 62.8
Overall Efficiency [-] 0.47 0.48 0.49 0.50 0.51 0.52
Table 12: Summary of engine parameters and performance of optimised cycles for different
TETs.
The increase in bypass ratio also leads to complications with respect to the instal-
lation of the engine on the wing and induced drag offsetting performance gains
achieved through larger bypass ratios.
The optimisation of the turbofan cycle was repeated for a range of turbine entry
temperatures whereas the bypass ratio was fixed to 15. Hence, the only optimisa-
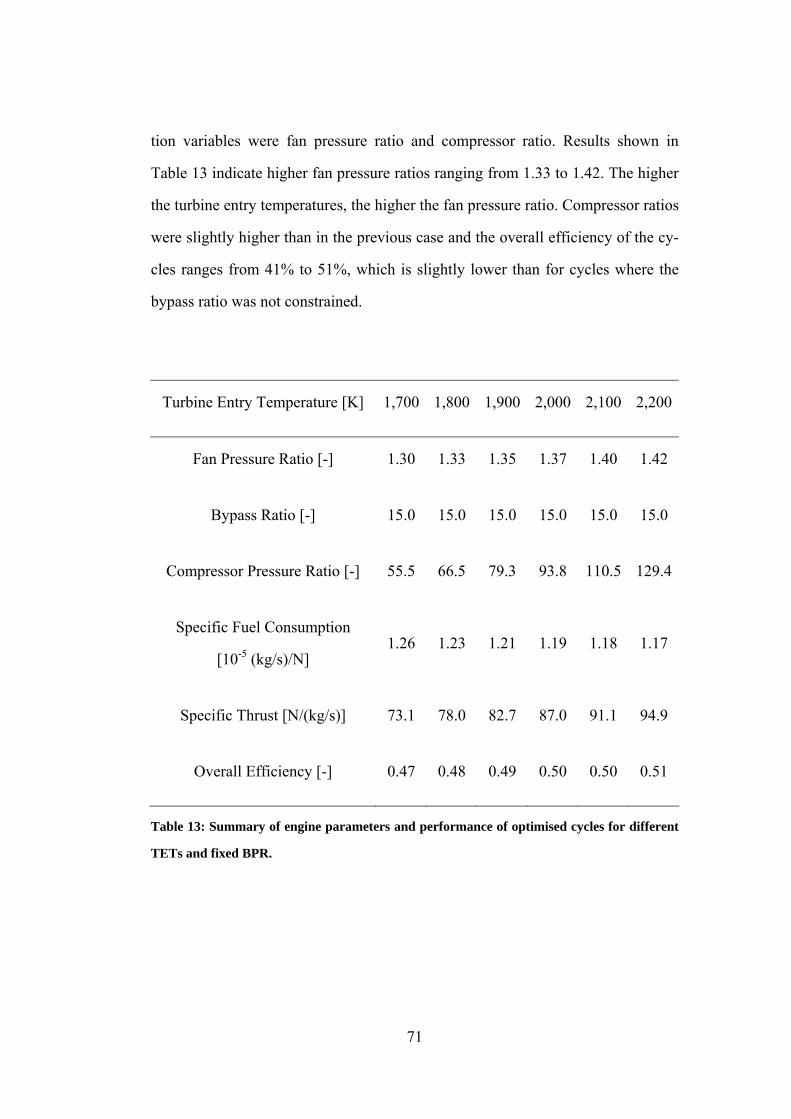
71
tion variables were fan pressure ratio and compressor ratio. Results shown in
Table 13 indicate higher fan pressure ratios ranging from 1.33 to 1.42. The higher
the turbine entry temperatures, the higher the fan pressure ratio. Compressor ratios
were slightly higher than in the previous case and the overall efficiency of the cy-
cles ranges from 41% to 51%, which is slightly lower than for cycles where the
bypass ratio was not constrained.
Turbine Entry Temperature [K] 1,700 1,800 1,900 2,000 2,100 2,200
Fan Pressure Ratio [-] 1.30 1.33 1.35 1.37 1.40 1.42
Bypass Ratio [-] 15.0 15.0 15.0 15.0 15.0 15.0
Compressor Pressure Ratio [-] 55.5 66.5 79.3 93.8 110.5 129.4
Specific Fuel Consumption
[10-5 (kg/s)/N] 1.26 1.23 1.21 1.19 1.18 1.17
Specific Thrust [N/(kg/s)] 73.1 78.0 82.7 87.0 91.1 94.9
Overall Efficiency [-] 0.47 0.48 0.49 0.50 0.50 0.51
Table 13: Summary of engine parameters and performance of optimised cycles for different
TETs and fixed BPR.

72
A direct comparison between optimised cycles operating with a turbine entry tem-
perature of 2,000K but different bypass ratio is given in Table 14. Notable is the
relatively marginal difference in terms of overall engine efficiency of 0.7%. This
indicated that in the absence of very high bypass ratio propulsor technology, it
would be more beneficial to in crease the fan pressure ratio and compressor pres-
sure ratio. This would result in an increase in overall efficiency not much below
what is theoretically be achievable with very high bypass ratio propulsors.
Also notable are the relatively high compressor pressure ratios, which are beyond
what is current practice but could for example be achieved with combustion proc-
esses where the pressure is further increased, such as pulse detonation or internal
volume combustion.
With a fair understanding of the theoretically achievable fuel consumption of a
conventional, 2 spool turbofan engine, next sections cover the optimisation and
performance calculation of engine designs that incorporate unconventional archi-
tectures.
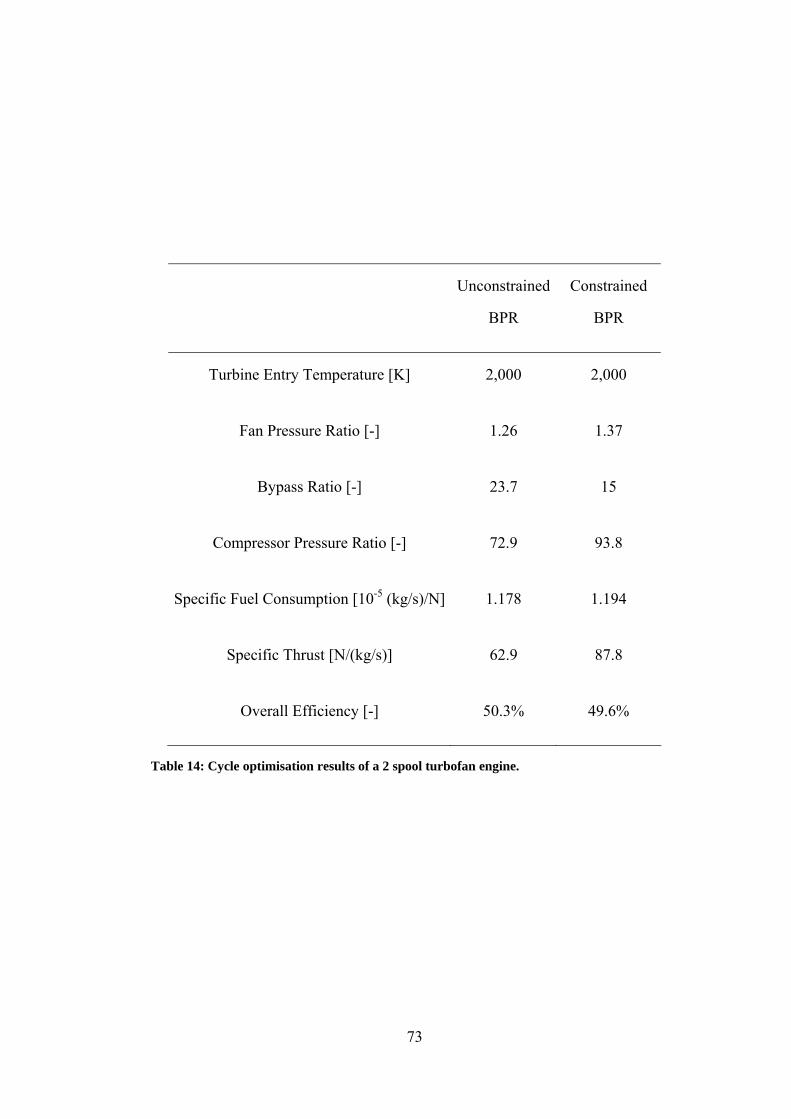
73
Unconstrained
BPR
Constrained
BPR
Turbine Entry Temperature [K] 2,000 2,000
Fan Pressure Ratio [-] 1.26 1.37
Bypass Ratio [-] 23.7 15
Compressor Pressure Ratio [-] 72.9 93.8
Specific Fuel Consumption [10-5 (kg/s)/N] 1.178 1.194
Specific Thrust [N/(kg/s)] 62.9 87.8
Overall Efficiency [-] 50.3% 49.6%
Table 14: Cycle optimisation results of a 2 spool turbofan engine.

74
5 Wave Rotor Technology
5.1 Introduction
The turbine blades of the high pressure turbine stage experience high temperatures
from the hot air delivered directly from the combustor. The blades are cooled with
bleed air and there are practical limits to the temperatures that can be endured by
turbine blades. This limit is the main driver of the cycle temperatures found in
modern turbo fan engines. Peak cycle temperatures, and hence the overall effi-
ciency of engines, can only be increased if more temperature resistant materials or
better cooling techniques are developed for the turbine blades.
However, the wave rotor could comprise a viable solution to increase the overall
pressure ratio and combustor temperature without exposing the turbine blades to
higher temperatures. Note that the combustor is susceptible of enduring higher
temperatures than turbine blades due to the application of more effective cooling
techniques and materials that can be used because of its geometry and dimensions.
Wave rotors are non-steady flow pressure exchange devices based on wave proc-
esses. A wave rotor acts as a compressor and turbine without blades; between the
wave rotor’s ‘compressor’ and ‘turbine’ is a steady flow combustor.
In its most common form, the wave rotor is an array of cylindrically arranged
tubes in the form of a drum as depicted in Figure 18.
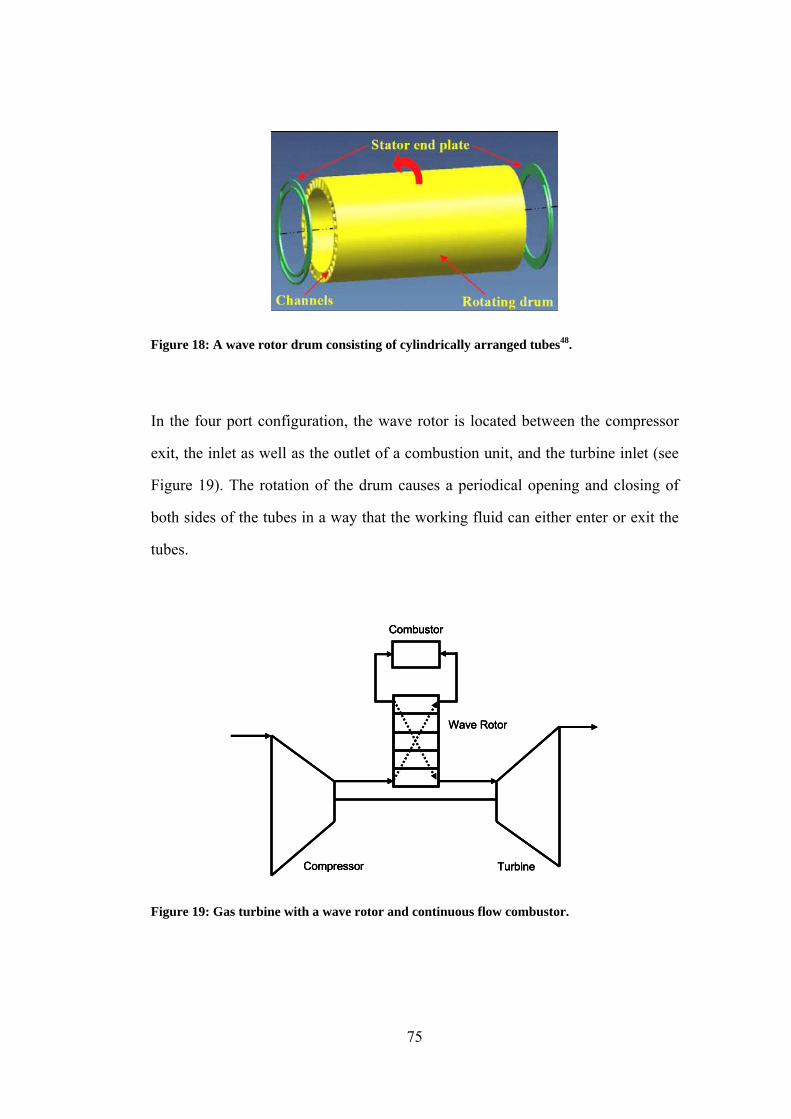
75
Figure 18: A wave rotor drum consisting of cylindrically arranged tubes48.
In the four port configuration, the wave rotor is located between the compressor
exit, the inlet as well as the outlet of a combustion unit, and the turbine inlet (see
Figure 19). The rotation of the drum causes a periodical opening and closing of
both sides of the tubes in a way that the working fluid can either enter or exit the
tubes.
Combustor
Wave Rotor
Compressor Turbine
Combustor
Wave Rotor
Compressor Turbine
Combustor
Wave Rotor
Compressor Turbine
Figure 19: Gas turbine with a wave rotor and continuous flow combustor.

76
5.2 Process
A fundamental description of a wave rotor is given in Figure 20. In the first step,
air from the compressor stages enters the tubes of the wave rotor. Through the ro-
tation of the drum, the ports of the tubes become connected with the outlet of the
combustor containing high pressure gas. This causes compression of the low pres-
sure air via shock waves. The rotation of the drum causes the opening of the end
of the tube with the cold, compressed air with the combustor inlet and, in effect,
the cold, compressed air enters the combustor. That leaves the tube with the gas
that was delivered by the combustor at elevated temperature and pressure.
Through further rotation of the drum, the tube is now connected with the exit lead-
ing to the turbine and the hot and compressed gas leaves the tube to drive the tur-
bine. Further rotation of the drum causes the opening of one end of the drum to
allow air from the compression stages entering the tube and the cycle begins
again. Through the arrangement of several tubes in a drum as shown in Figure 18,
the mass flow through the wave rotor is determined through the rotational speed,
the number of tuber and their diameter and length. All three are designed to match
the shock wave patterns within the tubes.

77
Figure 20: Cyclic operation of a four port wave rotor (simplified wave diagram)49. Note that
the tube is travelling upwards in the diagram and the velocity of the tube is in accordance
with the shock wave patterns that occur through the opening and closing of the tube ends.
The general advantage of wave rotor topping becomes apparent in a temperature-
entropy diagram given in Figure 21, showing both a conventional and topped cy-
cle. It is apparent that both cycles operate with the same turbine entry temperature
and overall pressure ratio achieved in the turbomachinery (excluding the wave
rotor). In both cycles, the temperature of the gas delivered to the high pressure
turbine stage is the same. However, the output work of the wave rotor topped cy-
cle can be expected to be higher due to the pressure gain in the wave rotor and
higher peak cycle temperatures.

78
FanSplitter
CompressorSplitter
1
3
5
8
9
11
Ambient
Inlet
HighPressureTurbine
LowPressureTurbine
Nozzle
Tem
pera
ture
Entropy
Combustor
51
52
10
Pressure Gain
Turbine InletTemperature
EnhancedPowerOutput
Wave RotorCompression
Wave RotorExpansion
Figure 21: Schematic T-S diagrams for a gas turbine baseline engine (dashed) and the addi-
tional wave rotor stages50. Cooling air not shown.
Inta
ke
Fan Compressor
SplitterMixerSplitter
WaveRotor
Noz
zle
Noz
zle
Turb
ine
1Ambient
2 3
12
4
7
5 6
9
10 11
13
Turbine
8
Combustor52 51
Inta
ke
Fan Compressor
SplitterMixerSplitter
WaveRotor
Noz
zle
Noz
zle
Turb
ine
1Ambient
2 3
12
4
7
5 6
9
10 11
13
Turbine
8
Combustor52 51
Figure 22: Graphical representation of a gas turbine cycle with wave rotor technology.

79
Assuming compression of the cold air entering the wave rotor to take place adia-
batically, the temperature rise during the compression process is given by
1
51
551 5
11
compression
PP
T T
γγ
η
−⎛ ⎞⎛ ⎞⎜ ⎟−⎜ ⎟⎜ ⎟⎝ ⎠= +⎜ ⎟
⎜ ⎟⎜ ⎟⎜ ⎟⎝ ⎠
Equation 17
where T51 in the temperature of the compressed air leaving the wave rotor and en-
ter the combustor. The practically achievable internal pressure ratio of wave rotors
can be found in the literature, which also gives values for the isentropic efficiency
of the compression process. The values are based on experimental data and com-
putational fluid dynamics calculations.
As for the compression process, the expansion process in the wave rotor can be
assumed to take place adiabatically. With the isentropic efficiency for the expan-
sion process known, the temperature change across the expansion process can be
calculated from
( )
1
52exp
6521
652
exp6
1 1
ansion
ansion
PPT
T PP
γγ
γγ
η
η
−
−
⎛ ⎞⎜ ⎟⎝ ⎠=
⎛ ⎞− −⎜ ⎟⎝ ⎠
Equation 18
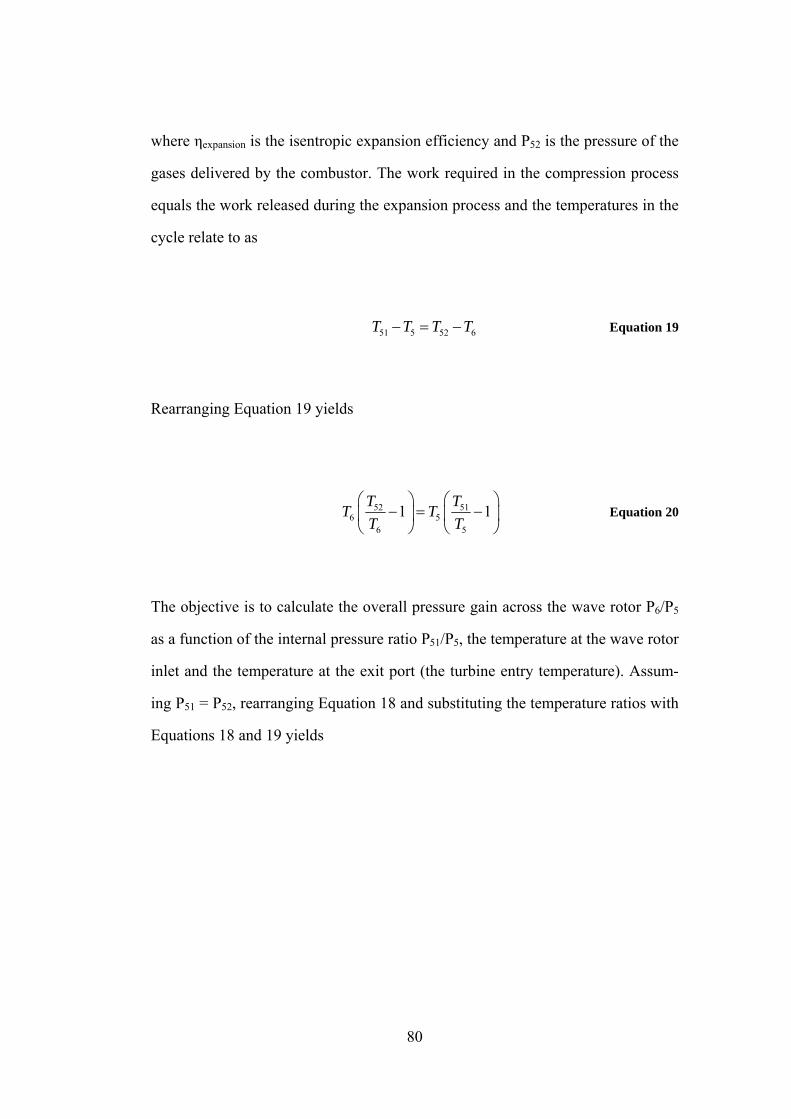
80
where ηexpansion is the isentropic expansion efficiency and P52 is the pressure of the
gases delivered by the combustor. The work required in the compression process
equals the work released during the expansion process and the temperatures in the
cycle relate to as
51 5 52 6T T T T− = − Equation 19
Rearranging Equation 19 yields
52 516 5
6 5
1 1T TT TT T
⎛ ⎞ ⎛ ⎞− = −⎜ ⎟ ⎜ ⎟
⎝ ⎠ ⎝ ⎠ Equation 20
The objective is to calculate the overall pressure gain across the wave rotor P6/P5
as a function of the internal pressure ratio P51/P5, the temperature at the wave rotor
inlet and the temperature at the exit port (the turbine entry temperature). Assum-
ing P51 = P52, rearranging Equation 18 and substituting the temperature ratios with
Equations 18 and 19 yields

81
1 1
exp 5 51
exp 6 56 51
15 5
5 51
6 5
11 1
11 1
ansion
ansion compression
compression
T PT P
P PP P
T PT P
γγ γγ
γγ
ηη η
η
− −
−
⎛ ⎞⎛ ⎞− ⎛ ⎞⎜ ⎟⎜ ⎟− −⎜ ⎟⎜ ⎟⎜ ⎟⎝ ⎠⎜ ⎟⎜ ⎟⎝ ⎠= ⎜ ⎟⎛ ⎞⎜ ⎟⎛ ⎞⎜ ⎟+ −⎜ ⎟⎜ ⎟⎜ ⎟⎜ ⎟⎝ ⎠⎜ ⎟⎝ ⎠⎝ ⎠
Equation 21
where T5 is the inlet temperature to the wave rotor, and T6 is the outlet tempera-
ture of the wave rotor. The pressure loss in the combustor is assumed to be cov-
ered by the compression and expansion efficiencies calculated from experimental
data.
Knowing the peak cycle temperature T52 and the temperature to the combustor
T51, which can be calculated from Equations 18 and 19, the heat added to the air
in the combustor and hence the fuel flow can be calculated from Equation 5,
whereas ΔTcombustor is the temperature difference between T52 and T51.
5.3 Technology Parameters
The technology parameters of the wave rotor, which are particularly the efficien-
cies of the compression and expansion processes as well as the internal pressure
ratio, can be obtained from experiments and computational fluid dynamics calcu-
lations. These parameters were obtained in laboratories and are available in the
literature. Figure 23 shows the theoretical pressure rise versus the temperature ra-
tio across the wave rotor calculated form Equation 21. It has been accepted that
experiments confirm the underlying theoretical description of wave rotor perform-
ance which is used in this study.

82
Figures for achievable wave rotor internal pressure ratio and isentropic efficien-
cies can be found in the literature with PR51/5 = 1.8 and ηcompression = ηexpansion =
0.8351. These are performance characteristics derived from current experimental
wave rotors. It is assumed that with adequate efforts in research and development,
these characteristics might be found in commercially applicable wave rotors in the
10 years time frame.
Further development of the wave rotor has the potential to further increase the
achievable internal pressure ratio. It is presumed that advanced wave rotors can
achieve internal pressure ratios of up to PR51/5 = 3.6 due to the presence of
stronger shock waves.
As compression and expansion efficiencies generally decrease as the shock waves
become stronger, ηcompression = ηexpansion are assumed to remain at 0.83 for the char-
acteristics of an advanced wave rotor. It is assumed that commercially applicable
wave rotors could have these characteristics in the 25 years time frame.

83
Figure 23: Pressure ratio across the wave rotor as function of temperature ratio calculated
from Equation 1852 and experimental data.
5.4 Optimisation
The computational model described in Chapter 2 was amended to calculate the
performance of a hybrid wave-rotor turbofan engine. Therefore, the conventional
combustor in the computational model was replaced by a code representing the
wave-rotor. The underlying mathematics in the code are based on Equations 17 to
21.
Four sets of optimisations were carried out whereas the only fixed cycle parameter
within a given set was the turbine entry temperature, ranging from 1700K to
2,200K. In two sets the bypass ratio was unconstrained with the only difference
between the sets in the internal pressure ratio of the wave rotor; and in the other

84
two sets the bypass ratio was constrained to 15 with the only difference in the in-
ternal pressure ratio of the wave rotor.
As described in the previous section, the internal pressure ratio of the wave rotor
was 1.8 and 3.6, whereas expansion efficiency and compression efficiency was
held constant in all calculations. Table 15 summarises the wave rotor parameters
used in the optimisations.
Short term Advanced
Internal Pressure Ratio 1.8 3.6
Expansion Efficiency 0.83 0.83
Compression Efficiency 0.83 0.83
Table 15: Wave rotor parameters for the computational model.
The first set of optimisations was performed without constraining the bypass ratio.
Results show that the fan pressure ratio remains at 1.26 for the entire turbine entry
temperature range, which is consistent with results of previous calculations where
the bypass ratio was not constrained. The bypass ratio increases from 25.2 to 38.0
with higher turbine entry temperature. The compressor pressure ratio ranges from
24.8 to 46.0 whereas optimising the cycle for higher turbine entry temperatures
results in higher compressor ratios. Values for compressor ratio are significantly
below that of the conventional turbofan cycles studied in the previous chapter as
the wave rotor substitutes the high pressure compressor stages to some extend.
The overall efficiency of the cycles ranges from 44% to 48%, which is lower than

85
for the conventional turbofan cycles. Changes in specific thrust are marginal and
range from 62.9 to 62.5 (kg/s)/N, which is comparable to the conventional turbo-
fan cycles where the bypass ratio was unconstrained during optimisation. Table
16 summarises the results of this set of optimisations.
Turbine Entry Temperature [K] 1,700 1,800 1,900 2,000 2,100 2,200
Fan Pressure Ratio [-] 1.26 1.26 1.26 1.26 1.26 1.26
Bypass Ratio [-] 25.2 27.7 30.2 32.8 35.4 38.0
Compressor Pressure Ratio [-] 24.8 28.4 32.4 36.6 41.1 46.0
Specific Fuel Consumption
[10-5 (kg/s)/N] 1.35 1.32 1.29 1.26 1.24 1.22
Specific Thrust [N/(kg/s)] 62.9 62.8 62.7 62.6 62.5 62.5
Overall Efficiency [-] 0.44 0.45 0.46 0.47 0.48 0.48
Table 16: Summary of engine parameters and performance of optimised, hybrid wave rotor
cycles for different TETs with an internal wave rotor pressure ratio of 1.8.
A second set of optimisations was carried out with a higher internal wave rotor
pressure ratio of 3.8 and results are given in Table 17. The fan pressure ratio re-
mains at 1.26 whereas higher values are calculated for the bypass ratio, ranging
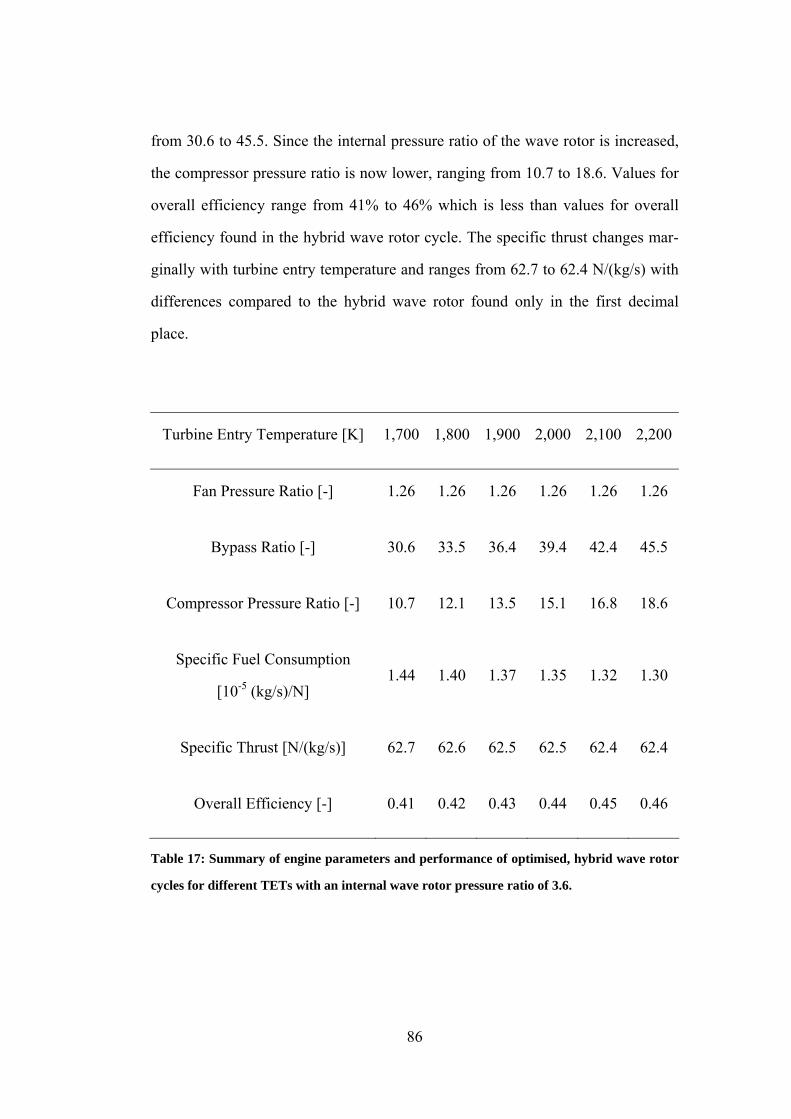
86
from 30.6 to 45.5. Since the internal pressure ratio of the wave rotor is increased,
the compressor pressure ratio is now lower, ranging from 10.7 to 18.6. Values for
overall efficiency range from 41% to 46% which is less than values for overall
efficiency found in the hybrid wave rotor cycle. The specific thrust changes mar-
ginally with turbine entry temperature and ranges from 62.7 to 62.4 N/(kg/s) with
differences compared to the hybrid wave rotor found only in the first decimal
place.
Turbine Entry Temperature [K] 1,700 1,800 1,900 2,000 2,100 2,200
Fan Pressure Ratio [-] 1.26 1.26 1.26 1.26 1.26 1.26
Bypass Ratio [-] 30.6 33.5 36.4 39.4 42.4 45.5
Compressor Pressure Ratio [-] 10.7 12.1 13.5 15.1 16.8 18.6
Specific Fuel Consumption
[10-5 (kg/s)/N] 1.44 1.40 1.37 1.35 1.32 1.30
Specific Thrust [N/(kg/s)] 62.7 62.6 62.5 62.5 62.4 62.4
Overall Efficiency [-] 0.41 0.42 0.43 0.44 0.45 0.46
Table 17: Summary of engine parameters and performance of optimised, hybrid wave rotor
cycles for different TETs with an internal wave rotor pressure ratio of 3.6.

87
A subsequent set of optimisations was performed where the bypass ratio was con-
strained to 15. Table 18 summarises results where the internal wave rotor pressure
ratio is set to 1.8. The resulting range of fan pressure ratios have much higher val-
ues than in any of the previous calculations, ranging from 1.43 to 1.64. The com-
pressor pressure ratio ranges from 25.1 to 49.3, which is lower than for compres-
sor ratios found in conventional turbofan cycles calculated in previous sections.
The overall efficiency of the cycles ranges from 43% to 45%. The specific thrust
is higher by a factor of 1.5 to 2 compared the hybrid wave rotor cycles where the
bypass ratio was not constrained during optimisation.
Turbine Entry Temperature [K] 1,700 1,800 1,900 2,000 2,100 2,200
Fan Pressure Ratio [-] 1.43 1.47 1.51 1.56 1.60 1.64
Bypass Ratio [-] 15.0 15.0 15.0 15.0 15.0 15.0
Compressor Pressure Ratio [-] 25.1 29.1 33.4 38.2 43.5 49.3
Specific Fuel Consumption
[10-5 (kg/s)/N] 1.38 1.35 1.34 1.32 1.31 1.30
Specific Thrust [N/(kg/s)] 97.7 105.1 112.3 119.3 126.1 132.7
Overall Efficiency [-] 0.43 0.44 0.44 0.45 0.45 0.45
Table 18: Summary of engine parameters and performance of optimised, hybrid wave rotor
cycles for different TETs with an internal wave rotor pressure ratio of 1.8 and constrained
bypass ratio of 15.

88
In the last set of cycle optimisations, the bypass ratio was constrained to 15 and
the internal wave rotor pressure ratio was set to 3.6, indicating advanced wave ro-
tor technology. Table 18 summarises the results of this set of optimisations. The
fan pressure ratio exceeds those of the previous set where the internal wave rotor
compressor ratio was set to 1.8. The values for fan pressure ratio in this set range
from 1.55 to 1.84, which again indicates that conventional fan technology may not
be applicable for this set of cycles and other solutions would be required to build
the engine around this set of cycles. Since the internal wave rotor pressure ratio is
higher than in the previous set, the compressor pressure ratio has lower values
ranging from 9.6 to 15.5. The overall efficiency of the optimised cycles in this set
ranges from 40% to 41%, which is lower than for the hybrid wave rotor cycles
where the bypass ratio was unconstrained during optimisation. The specific thrust
is highest amongst all hybrid wave rotor cycles and ranges from 117.8 to 161.2
N/(kg/s). With relatively low values for the compressor pressure ratio and high fan
pressure ratios, engines based on this cycle would be very compact and could be
used where axial flow compressors are not feasible due to constraints given be
small dimensions.
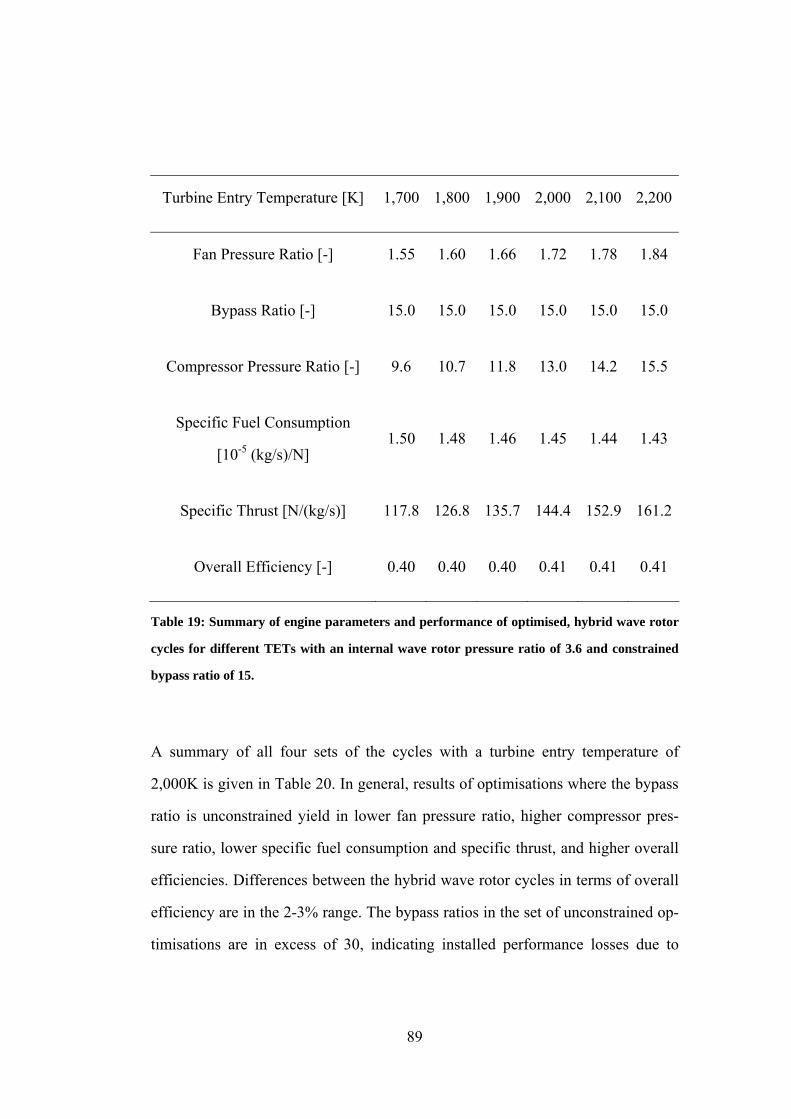
89
Turbine Entry Temperature [K] 1,700 1,800 1,900 2,000 2,100 2,200
Fan Pressure Ratio [-] 1.55 1.60 1.66 1.72 1.78 1.84
Bypass Ratio [-] 15.0 15.0 15.0 15.0 15.0 15.0
Compressor Pressure Ratio [-] 9.6 10.7 11.8 13.0 14.2 15.5
Specific Fuel Consumption
[10-5 (kg/s)/N] 1.50 1.48 1.46 1.45 1.44 1.43
Specific Thrust [N/(kg/s)] 117.8 126.8 135.7 144.4 152.9 161.2
Overall Efficiency [-] 0.40 0.40 0.40 0.41 0.41 0.41
Table 19: Summary of engine parameters and performance of optimised, hybrid wave rotor
cycles for different TETs with an internal wave rotor pressure ratio of 3.6 and constrained
bypass ratio of 15.
A summary of all four sets of the cycles with a turbine entry temperature of
2,000K is given in Table 20. In general, results of optimisations where the bypass
ratio is unconstrained yield in lower fan pressure ratio, higher compressor pres-
sure ratio, lower specific fuel consumption and specific thrust, and higher overall
efficiencies. Differences between the hybrid wave rotor cycles in terms of overall
efficiency are in the 2-3% range. The bypass ratios in the set of unconstrained op-
timisations are in excess of 30, indicating installed performance losses due to
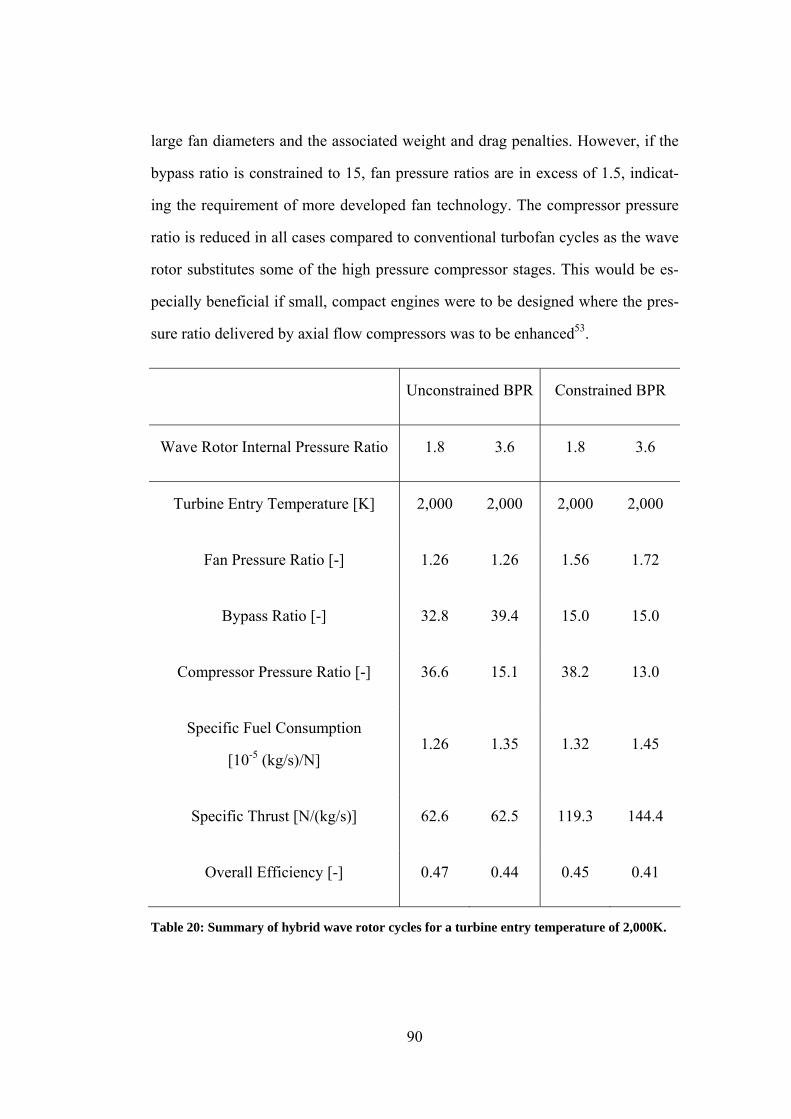
90
large fan diameters and the associated weight and drag penalties. However, if the
bypass ratio is constrained to 15, fan pressure ratios are in excess of 1.5, indicat-
ing the requirement of more developed fan technology. The compressor pressure
ratio is reduced in all cases compared to conventional turbofan cycles as the wave
rotor substitutes some of the high pressure compressor stages. This would be es-
pecially beneficial if small, compact engines were to be designed where the pres-
sure ratio delivered by axial flow compressors was to be enhanced53.
Unconstrained BPR Constrained BPR
Wave Rotor Internal Pressure Ratio 1.8 3.6 1.8 3.6
Turbine Entry Temperature [K] 2,000 2,000 2,000 2,000
Fan Pressure Ratio [-] 1.26 1.26 1.56 1.72
Bypass Ratio [-] 32.8 39.4 15.0 15.0
Compressor Pressure Ratio [-] 36.6 15.1 38.2 13.0
Specific Fuel Consumption
[10-5 (kg/s)/N] 1.26 1.35 1.32 1.45
Specific Thrust [N/(kg/s)] 62.6 62.5 119.3 144.4
Overall Efficiency [-] 0.47 0.44 0.45 0.41
Table 20: Summary of hybrid wave rotor cycles for a turbine entry temperature of 2,000K.

91
However, the specific fuel consumption of the conventional turbofan cycles exam-
ined earlier on is not matched by the hybrid wave rotor. This is due to the less ef-
ficient compression and expansion processes that take place inside the wave rotor
and cannot be offset by the benefits associated with higher peak cycle tempera-
tures.

92
6 Pulse Detonation
6.1 Introduction
Constant volume combustion offers a pressure increase during combustion and
lower fuel consumption as no volumetric work is carried out during the combus-
tion process. It can be modelled as isochoric, reversible process. With the ideal
gas model, the heat energy added to a closed system at constant volume can be
calculated from
( )2
2 1 2 11
0
in vq u u p dV c T T
=
= − + = −∫ Equation 22
where the integral denotes volumetric work, which is zero if the combustion proc-
ess occurs under isochoric conditions. Technologies that have been identified to
enable constant volume combustion within turbofan engines include pulse detona-
tion or internal combustion cycles.
Pulse detonation is a non-steady flow quasi constant volume combustion process.
As opposed to deflagrations, detonations are supersonic combustion waves.
Across a detonation front, the pressure increases while the specific volume de-
creases. A detonation taking place in a tube that is closed at one end will leave
hot, pressurised gas behind. In its simplest form, a pulse detonation engine is a
tube where one end is repeatedly opened and closed while a combustible gas is

93
ignited. Hot, pressurised gas exits the tube at its open end shortly after ignition
takes place. A wide variety of applications have been proposed for pulse detona-
tion engines. Due to the high specific impulse of the exhaust gas, thrust-
generating pulse detonation engines exhibit much higher fuel consumption than
turbojets in the low Mach number regime. However, pulse detonation engines
would outperform turbojets above Mach numbers of about 3.5. An application of
pulse detonation engines for subsonic, commercial airliners is hence less attractive
from an economical point of view.
However, pulse detonation engines could be used in hybrid mode to increase the
performance of conventional aero engines54 55, which is investigated in this study.
In the ultimate embodiment of this concept, the pulse detonation engine takes the
place of the combustor and, depending on the overall design, a set of high pres-
sure compressor stages (see Figure 24). The air leaving the high pressure com-
pressor stage enters a pulse detonation tube, which delivers hot gases at increased
pressure to the turbine. Combining pulse detonation with conventional aero en-
gine technology would hence enable higher turbine delivery pressure without the
need to increase the turbine entry temperature.
Pulse Detonation
Compressor Turbine
Pulse Detonation
Compressor Turbine
Figure 24: Hybrid Aero Engine with Pulse Detonation Technology.

94
The detonation is understood to be an exothermic reaction of components within a
medium whereas the reaction front expands at a speed that causes the formation of
a shock wave in front of it. A detonation that occurs within a tube causes a pres-
sure increase across the detonation front while the specific volume decreases. The
detonation process within a tube is depicted in Figure 25.
Valve
Products Reactants
Detonation
Expansion Wave
Pre
ssur
e
Pressure GainP1
P2
P3
Valve
Products Reactants
Detonation
Expansion Wave
Pre
ssur
e
Pressure GainP1
P2
P3
Figure 25: Detonation propagating from the closed end of a tube56.
The cycle of a pulse detonation engine is shown in Figure 26: a closed tube is
filled with an air/fuel mixture, which is ignited at the closed end of the tube (deto-
nation initiation). The resulting detonation wave propagates towards the exit of
the tube (detonation propagation). When the detonation wave reaches the open
end of the tube, the products expand outside the tube (blow-down). A diffracted

95
shock and a reflected wave are created. The tube is left with reactants and the
valve opens allowing air to enter the tube (purge) supported by the reverberating
wave pattern. The valve closes when the tube is eventually filled with air and re-
actants (fuel fill) and the cycle begins again. During a cycle, thrust is generated as
long as the pressure inside the tube on the thrust surface is greater than the atmos-
pheric pressure. Experimental pulse detonation engines typically operate at fre-
quencies of 50-100 Hz.
Reactants
Detonation Front
A
C
Detonation Front
B
Reflected Characteristic
Decaying Shock
D
Burned Products
Air
E
Products
Shock WaveValve Open
F
AirReactants
Shock Wave
Products
G
Reactants Reactants
H
Air
Figure 26: Schematic of a pulse detonation cycle56.
96
A detonation tube can be fully purged or partially purged of the gases left behind
the reaction. For a fully purged tube, the tube is left with fresh air only after the
purge process, whereas a partially purged tube is left with both air and hot gases
from the previous cycle.
Since relatively little work has been done on pulse detonation hybrid engines,
their geometry is still a matter of debate. Most likely, the hybrid pulse detonation
is an array or cylindrically arranged tubes. To open and close the tubes at their
inlet, the tubes are either rotating and become obscured via a static inlet port, or
alternatively, the tubes are static and a plate is rotating in front of the tubes which
would have the same effect.
It should be noted that the output flow of a pulse detonation engine is unsteady
and exhibits strong wave patterns. This would impact the stator and rotor blades
of the turbine, whereas possible implications are not investigated sufficiently to
date. The turbine would experience a wide range of inlet conditions, and turbine
technology would very likely have to be adapted to these new requirements.
Since the exhaust of a pulse detonation engine is pulsating, its nozzle would have
to be adjusted with the operational frequency to achieve best possible perform-
ance. Since this would require probably significant technological effort, it is ques-
tionable whether best possible performance will ever be achievable. Hence, real
pulse detonation engines may always underperform when compared to predictions
of theoretical models.
Figure 27 represents a developed view of a multi tube pulse detonation engine.
The vertical direction represents the time dependent location of the rotating tubes.
Air enters the tubes, which are closed due to the rotation, and is mixed with fuel.

97
Detonation initiation occurs through an igniter once the tube is closed and the ex-
panded gases leave the tubes via the exhaust port resembling the geometry of a
wave rotor engine.
Rotation
Inle
t Por
t
Igniter
Exh
aust
Por
t
Air
AirAir
AirReactants
ReactantsReactants
ReactantsProducts
ProductsProducts
ProductsProductsProducts
ProductsProducts
Figure 27: Schematic layout of the pulse detonation engine57
6.2 Process
The general advantage of the hybrid pulse detonation engine becomes apparent in
a T-S diagram given in Figure 28 for both the Humphrey and Brayton cycle. The
Humphrey cycle comprises constant volume combustion and approximates the
hybrid pulse detonation cycle whereas the Brayton cycle is an approximation of
the thermodynamic cycle of conventional turbofan engines with a continuous flow
combustor.

98
It is apparent that both cycles operate with the same turbine entry temperature but
different pressure ratios. In both cycles, the same amount of heat is added to the
air prior to expansion in the turbine stages. However, the work output of a hybrid
pulse detonation cycle is higher than a conventional engine with the same cycle
parameters due to the pressure gain in the pulse detonator. This consequently al-
lows the hybrid pulse detonator cycle to operate with a higher thermal efficiency.
Tem
pera
ture
Entropy
Pressure Gain
Turbine InletTemperature
EnhancedPowerOutput
Humphrey CycleBrayton Cycle
Figure 28: Comparison between the Humphrey and Brayton cycle.
The performance of a hybrid pulse detonation engine is subject to the performance
of the pulse detonation process itself. The determining parameter is the pressure
gain during the combustion process, which has been subject to numerous studies
conducted in the laboratory or computational fluid dynamics simulations. Through
99
extrapolation of the experimental data, the theoretical prediction of a pulse deto-
nation engine becomes possible.
As in the earlier sections, a quasi steady flow analysis is used to calculate the
thermodynamic performance of a pulse detonation engine. A literature research
has helped to derive a mathematical description and the model used herein has the
underlying assumption that the effect of wave interactions can be neglected or
corrected58. Even though such analysis provides insights into the thermodynamic
aspects, it is accompanied with uncertainties.
The overall pressure ratio across a pulse detonation engine can be calculated from
a semi empirical approach59. The pressure rise across one tube of the pulse deto-
nation engine is calculated from the thermodynamic relation for adiabatic com-
pression
15
6
CTPRT
γγ −⎛ ⎞
= ⎜ ⎟⎝ ⎠
Equation 23
where HR denotes the ratio of the enthalpy of the working gas at the inlet and the
outlet of the pulse detonation engine. The technology parameter C in Equation 21
denotes the efficiency of the process and is obtained from a curve fit through re-
sults of CFD simulations, which are based on the following assumptions:
- The process is adiabatic and non-viscid.
- The flow inside the tube contains a combination of reactant or product
only.
100
- Both reactants and products are perfect gases with the same properties.
- The valves close instantaneously.
Other simplifying assumptions were made but are not mentioned here. Different
values for C can be found in the literature, which denote how effectively the pres-
sure gain is achieved in the pulse detonation cycle.
The purge fraction is the fraction of time when purge air is flowing through the
tube inlet to the total valve open time. At the beginning of a cycle, a certain
amount of air has passed through the tube of which the purge air does not remain
inside the tube when the detonation takes place. The total amount of air passing
through the tube is
Re tanAir ac ts Purgem m m= + Equation 24
where mAir denotes the total amount of air passing through the tube during one
cycle, mReactants denotes the amount of air left in the tube after the purge process
and mPurge denotes the amount of air passing through tube not being part of the
detonation process. Equation 22 assumes that the density of the reactant air that
includes the fuel is the same as for pure air entering the pulse detonation engine.
The purge fraction pf is the ratio of purge air passing through the tube to the total
amount of air passing through the tube
Purge
Air
mpf
m= Equation 25
101
The temperature increase across the pulse detonation engine is an average of the
total amount of air passing through and includes the purge air. Hence, the heat en-
ergy added just to the air that is left in the tube after the purge process at the be-
ginning of the cycle is defined by
( ) ( )Re tan6 51
ac tsp fuel net
m c T T m qpf
− =−
Equation 26
In order to calculate the pressure increase across the pulse detonation engine,
Equation 24 is rearranged and yields
( ) ( )( )5 0
6 5
1 1 11
T q pfT AFR RT
γγ
= + − −+
Equation 27
where AFR is the air-to-fuel ratio and T5 is the temperature of the air entering the
PDE at the beginning of the cycle. Together with Equation 21, the theoretical
pressure gain across a pulse detonation engine can now be calculated for a given
inlet and exit temperature.
The two unknown parameters for the calculation of the pulse detonation engine
are the parameter C and the purge fraction pf. From the above equations it be-
comes apparent that higher values of C and lower values for the purge fraction are
desirable to achieve a high pressure increase in the pulse detonation engine. Also,
a higher value for the purge fraction implies a higher cycle time and hence a lower
102
frequency with which the pulse detonation engine operates. Therefore, there is
another reason to operate pulse detonation engines with low purge fraction as
higher frequencies are desirable to allow larger mass flows through the engine.
Since this technology is still in its infancy, it is assumed that significant research
into pulse detonation technology will be carried out to allow the commercial ap-
plication of pulse detonation engines. In the long term, this research will eventu-
ally enable pulse detonation engines to operate with a low purge fractions. The
purge fraction of experimental pulse detonation engines is quoted with different
values in the literature and ranges from 0.1 to 0.7. This study assumes a purge
fraction of 0.1, which is the lowest figure that that was found in the literature.
Values for the technology parameter C found in the literature range from 0.105 to
0.12. Higher values for C enable higher pressure ratios as shown in Figure 29.
Therefore, this study assumes that pulse detonation engines will be available in
the long term that have the performance characteristic equivalent to C = 0.12,
which has already been achieved in the laboratory15. Table 21 summarises typical
values for purge fraction and technology parameter C and shows which vales have
been chosen in this study.

103
1
2
3
1 3 5 7Temperature Ratio
Pres
sure
Rat
ioC = 0.12C = 0.105
Figure 29: Pressure Ratio as a function of temperature ratio across a pulse detonator (see
Equation 27).
Parameter Purge fraction [-] C [-]
Typical values 0.10 - 0.2058, 0.7059 0.10558, 0.1259
Used in this study 0.1 0.12
Table 21: Typical values for purge fraction and the technology parameter C.
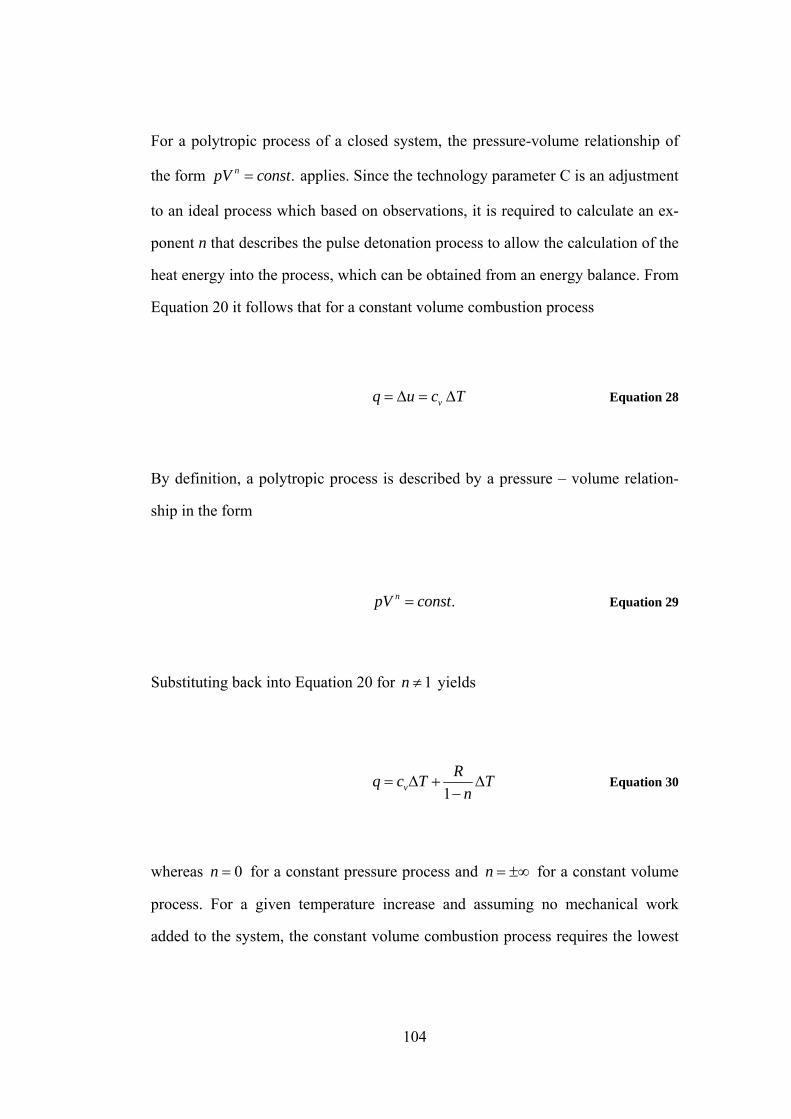
104
For a polytropic process of a closed system, the pressure-volume relationship of
the form .npV const= applies. Since the technology parameter C is an adjustment
to an ideal process which based on observations, it is required to calculate an ex-
ponent n that describes the pulse detonation process to allow the calculation of the
heat energy into the process, which can be obtained from an energy balance. From
Equation 20 it follows that for a constant volume combustion process
vq u c T= Δ = Δ Equation 28
By definition, a polytropic process is described by a pressure – volume relation-
ship in the form
.npV const= Equation 29
Substituting back into Equation 20 for 1n ≠ yields
1vRq c T T
n= Δ + Δ
− Equation 30
whereas 0n = for a constant pressure process and n = ±∞ for a constant volume
process. For a given temperature increase and assuming no mechanical work
added to the system, the constant volume combustion process requires the lowest

105
amount of heat energy to achieve the temperature increase. On the other end, for a
constant pressure combustion process
v pq c T R T c T= Δ + Δ = Δ Equation 31
For an unknown process such as pulse detonation, n is to be determined in order
to calculate the heat energy into the process. With Equation 21 it is possible to
calculate an exponent n that describes the pulse detonation process and it follows
that with
1 1nC
nγ
γ=
− − Equation 32
the polytropic exponent becomes
1Cn
Cγ
γ γ=
− + Equation 33
For 1.4γ = and the technology factor 0.12C = , the polytropic exponent 1n ≈ − .
Hence the energy required to achieve a temperature increase TΔ becomes

106
2vRq c T T= Δ + Δ Equation 34
From this follows that for the pulse detonation process the energy required to
achieve a certain temperature change lies somewhere half way between the con-
stant volume and the constant pressure combustion process.
6.3 Optimisation
The computational model was modified and the combustor stage substituted to
simulate the pressure gain achieved through the pulse detonation engine core.
Therefore, equations in the previous section were used and incorporated in the
model.
Furthermore, changes were made to calculate the fuel flow. From equations 28
and 30 it follows that
11
fuelv
air net
m R Tc Cm qC
γγ γ
⎛ ⎞⎜ ⎟ Δ⎜ ⎟= +⎜ ⎟−⎜ ⎟− +⎝ ⎠
&
& Equation 35
The graphical representation of the hybrid turbofan pulse detonation engine is
given in Figure 28.
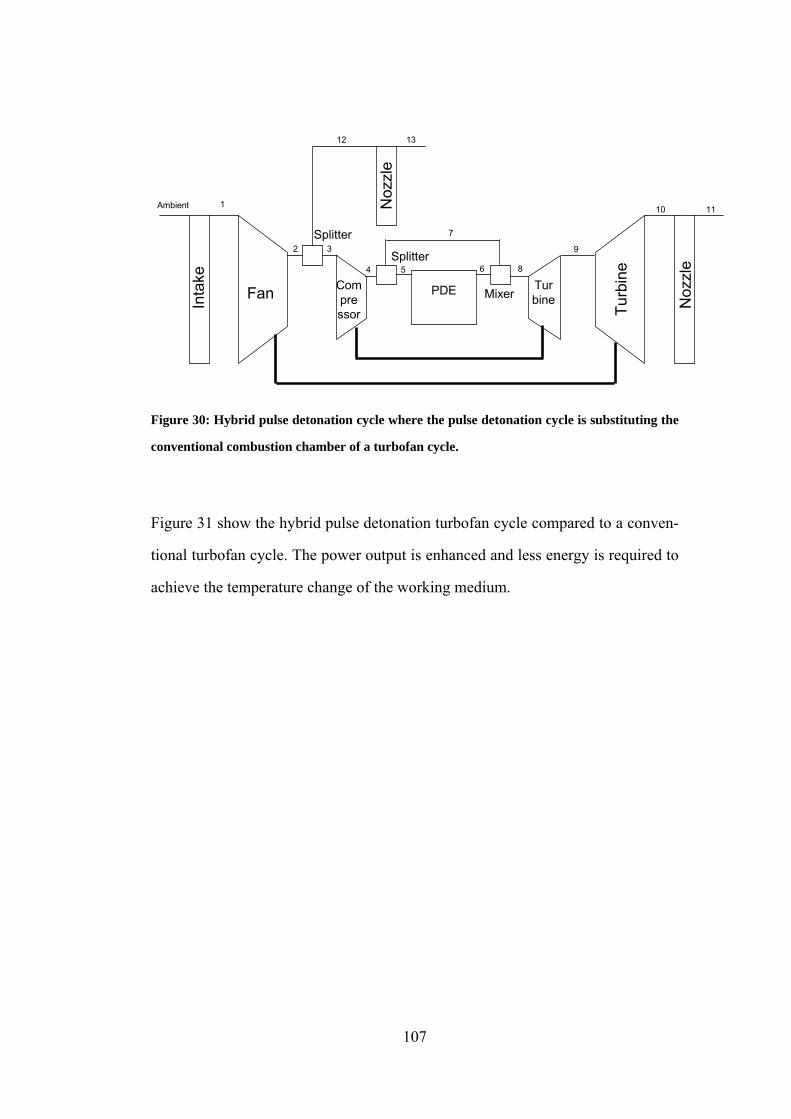
107
Inta
ke
Fan Compressor
Splitter
Mixer
Splitter
PDE
Noz
zle
Noz
zle
Turb
ine
1Ambient
2 3
12
4
7
5 6
9
10 11
13
Turbine
8
Figure 30: Hybrid pulse detonation cycle where the pulse detonation cycle is substituting the
conventional combustion chamber of a turbofan cycle.
Figure 31 show the hybrid pulse detonation turbofan cycle compared to a conven-
tional turbofan cycle. The power output is enhanced and less energy is required to
achieve the temperature change of the working medium.
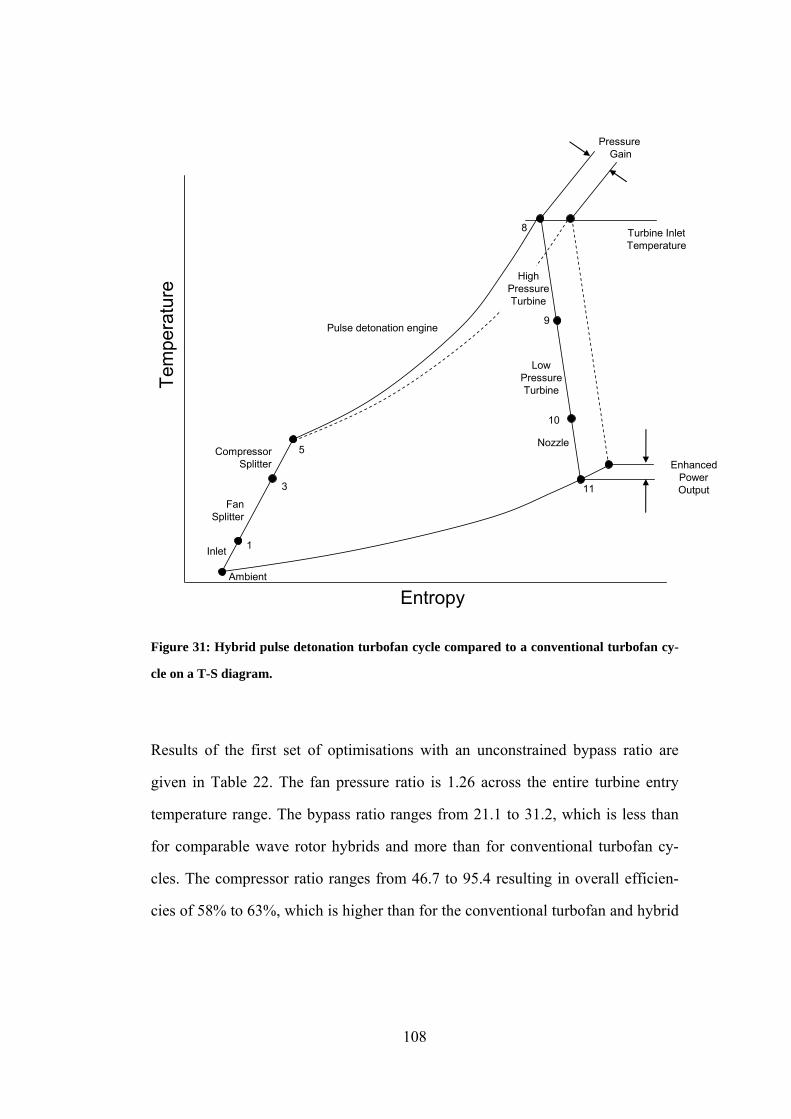
108
FanSplitter
CompressorSplitter
1
3
5
8
9
11
Ambient
Inlet
HighPressureTurbine
LowPressureTurbine
Nozzle
Tem
pera
ture
Entropy
Pulse detonation engine
10
Pressure Gain
Turbine InletTemperature
EnhancedPowerOutput
Figure 31: Hybrid pulse detonation turbofan cycle compared to a conventional turbofan cy-
cle on a T-S diagram.
Results of the first set of optimisations with an unconstrained bypass ratio are
given in Table 22. The fan pressure ratio is 1.26 across the entire turbine entry
temperature range. The bypass ratio ranges from 21.1 to 31.2, which is less than
for comparable wave rotor hybrids and more than for conventional turbofan cy-
cles. The compressor ratio ranges from 46.7 to 95.4 resulting in overall efficien-
cies of 58% to 63%, which is higher than for the conventional turbofan and hybrid
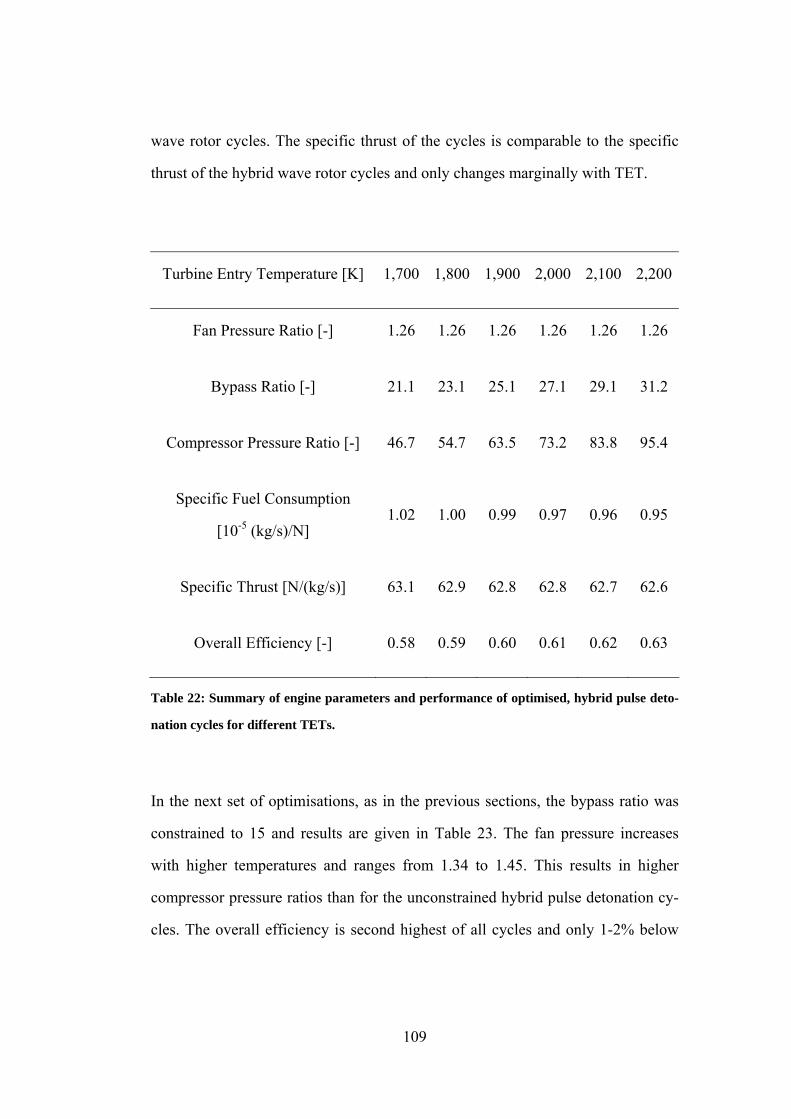
109
wave rotor cycles. The specific thrust of the cycles is comparable to the specific
thrust of the hybrid wave rotor cycles and only changes marginally with TET.
Turbine Entry Temperature [K] 1,700 1,800 1,900 2,000 2,100 2,200
Fan Pressure Ratio [-] 1.26 1.26 1.26 1.26 1.26 1.26
Bypass Ratio [-] 21.1 23.1 25.1 27.1 29.1 31.2
Compressor Pressure Ratio [-] 46.7 54.7 63.5 73.2 83.8 95.4
Specific Fuel Consumption
[10-5 (kg/s)/N] 1.02 1.00 0.99 0.97 0.96 0.95
Specific Thrust [N/(kg/s)] 63.1 62.9 62.8 62.8 62.7 62.6
Overall Efficiency [-] 0.58 0.59 0.60 0.61 0.62 0.63
Table 22: Summary of engine parameters and performance of optimised, hybrid pulse deto-
nation cycles for different TETs.
In the next set of optimisations, as in the previous sections, the bypass ratio was
constrained to 15 and results are given in Table 23. The fan pressure increases
with higher temperatures and ranges from 1.34 to 1.45. This results in higher
compressor pressure ratios than for the unconstrained hybrid pulse detonation cy-
cles. The overall efficiency is second highest of all cycles and only 1-2% below

110
the overall efficiencies of the hybrid pulse detonation cycles where the bypass ra-
tio was unconstrained during the optimisation. The calculated compressor pres-
sure ratio is ranging from 51.4 to 125.0, which would be a very high value for ax-
ial flow compressors based on current designs. The specific thrust varies from
80.5 to 100.5 N/(kg/s) with increasing turbine entry temperature, which is lower
than for the hybrid wave rotor cycles where bypass ratios were constrained during
optimisation but higher than for the conventional turbofan where bypass ratios
were constrained during optimisation.
Turbine Entry Temperature [K] 1,700 1,800 1,900 2,000 2,100 2,200
Fan Pressure Ratio [-] 1.34 1.36 1.39 1.41 1.43 1.45
Bypass Ratio [-] 15.0 15.0 15.0 15.0 15.0 15.0
Compressor Pressure Ratio [-] 51.4 62.3 74.8 89.3 106.0 125.0
Specific Fuel Consumption
[10-5 (kg/s)/N] 1.03 1.02 1.00 0.99 0.98 0.98
Specific Thrust [N/(kg/s)] 80.5 85.1 89.4 93.4 97.1 100.5
Overall Efficiency [-] 0.57 0.58 0.59 0.60 0.60 0.61
Table 23: Summary of engine parameters and performance of optimised, hybrid pulse deto-
nation cycles for different TETs and constrained bypass ratio.

111
A summary of results is given in Table 24 where the main differences between the
cycles where the bypass ratio was constrained and unconstrained become appar-
ent. In case of the bypass ratio being unconstrained during optimisation and a tur-
bine entry temperature of 2,000K, the optimisation yields a fan pressure ratio of
1.26, a bypass ratio of 27.1 and a compressor pressure ratio of 73.2. This combi-
nation of parameters results in an overall efficiency of the hybrid pulse detonation
cycle of 61%. Constraining the bypass ratio to 15 during optimisation results in a
slightly lower overall efficiency of 60%, which is one percent point less in abso-
lute terms. However, a larger fan pressure ratio of 1.41 is required as well as a
higher compressor pressure ratio of 89.3, indicating a larger, possibly heavier
compressor. In terms of specific thrust, the cycle with the lower bypass ratio
would require about two third of the mass flow through the engine of the cycle
with the higher bypass ratio to deliver the same propulsive force.

112
Unconstrained
BPR
Constrained
BPR
Turbine Entry Temperature [K] 2,000 2,000
Fan Pressure Ratio [-] 1.26 1.41
Bypass Ratio [-] 27.1 15.0
Compressor Pressure Ratio [-] 73.2 89.3
Specific Fuel Consumption [10-5 (kg/s)/N] 0.97 0.99
Specific Thrust [N/(kg/s)] 62.8 93.4
Overall Efficiency [-] 0.61 0.60
Table 24: Summary of hybrid pulse detonation cycles for a turbine entry temperature of
2,000K.
113
Internal Combustion
6.4 Introduction
The reciprocating engine consists of one or more contracting chambers where the
working fluid is compressed, heated and expanded in discontinuous manner.
Unlike axial flow machines, reciprocating engines perform the underlying ther-
modynamic cycle in finite time intervals and convert quasi linear motion into ro-
tary motion.
The working cycle of the reciprocating engine includes the introduction of either
already hot and pressurised gas into the chamber, compression of the gas through
the volumetric contraction of the chamber, heating of the gas by means of ignition
of fuel or through the exchange of heat, and volumetric expansion of the chamber
whereby the motion that occurs through the expansion of the chamber is utilised
to extract mechanical energy from the cycle.
The compression and expansion process is quasi isentropic since the compression
and work extraction is not achieved through the diversion of the gas flow with the
aid of blades. Due to the cyclic operation of the reciprocating engine, the high
temperature and pressure of the gases, and the conversion from rotary to linear
motion, more durable and robust designs typically makes the reciprocating engine
heavier than the gas turbine.
In practice, the reciprocating engine in the form of an internal combustion engine
typically consists of an array of cylindrical chambers where the movement of a
114
piston inside the chamber compresses working gas that has entered the chamber
through a valve. The power to compress the working gas is either delivered from
the momentum in the piston of the foregoing cycle or from the expansion of hot
gases within another cylinder that is part of the array. Fuel is injected into the
compressed working gas, which combines with the oxygen of the working gas
exothermically while the piston movement results in the volumetric expansion of
the chamber. In case the mixing of the air with fuel takes place before entering the
internal combustion engine, than the temperature of the reactant during compres-
sion should not exceed its ignition temperature. This can be overcome with more
sophisticated, direct injection techniques, where fuel is added and ignited when
the air is compressed. While the chamber is in contracted, the working gas is
heated through the rapid combustion of fuel. During the subsequent expansion of
the gases, mechanical power is extracted from the process through the linear mo-
tion of the cylinder. The motion is converted into rotational motion through a
crank mechanism. The extracted energy is used to compress the working gas dur-
ing the following cycle. Surplus, rotational power can drive the propulsive unit
such as a propeller or fan.
The gap between the piston and the chamber walls is very narrow to avoid the
working gas leaking during the process, which causes frictional losses. Also, the
crankshaft mechanism and the presence of a gearbox usually requires energy that
is extracted from the output power of the cycle and reduces its overall efficiency.
Furthermore, limited ability to control the combustion of the reactant after fuel is
added to the air can result in short periods of constant pressure combustion that
has an impact on the cycle efficiency.

115
The Otto cycle incorporated constant volume combustion while the piston is not
moving and has contracted the cylinder whereas Diesel engine is usually refers to
a piston engine where the combustion of the fuel occurs under quasi constant pres-
sure when the piston is in motion. The Diesel cycle has a lower thermal efficiency
than the Otto cycle at a given compression ratio. Other reciprocating engine de-
signs include the Wankel engine, the steam engine or the Stirling engine. The
Wankel design facilitates chambers contracting and expanding solely through ro-
tating parts in the absence of pistons and engine has been developed throughout
the 21st century and found its application with car manufacturers. A Wankel en-
gine incorporating constant volume combustion may provide advantages over the
piston design in a hybrid turbofan configuration Figure 35.
The Stirling engine incorporates heat exchangers and different temperature levels
through which the working fluid is cyclically heated and cooled. The result is a
linear motion of pistons resulting in the contraction and expansion of the working
gas which is pumped between the heat exchangers. The working gas is contained
within the engine and is not exchanged with its surroundings. Approximating the
Carnot cycle, Stirling engines allow operation with high thermal efficiency. They
found their application in various niches ranging from marine engines to computer
chip cooling but would not be technically feasible in hybrid turbofan configura-
tion as the working fluid remains inside the contracting chamber and the heat
transfer is facilitated through heat exchangers.
Steam engines are the oldest form of reciprocating engines. The working fluid is
steam obtained from heating water, which can be pressurised prior to entering a
steam generator. The steam is used to move a piston in a cylinder but rotary de-
signs exist as well. The steam engine came out of fashion in the early 20th century
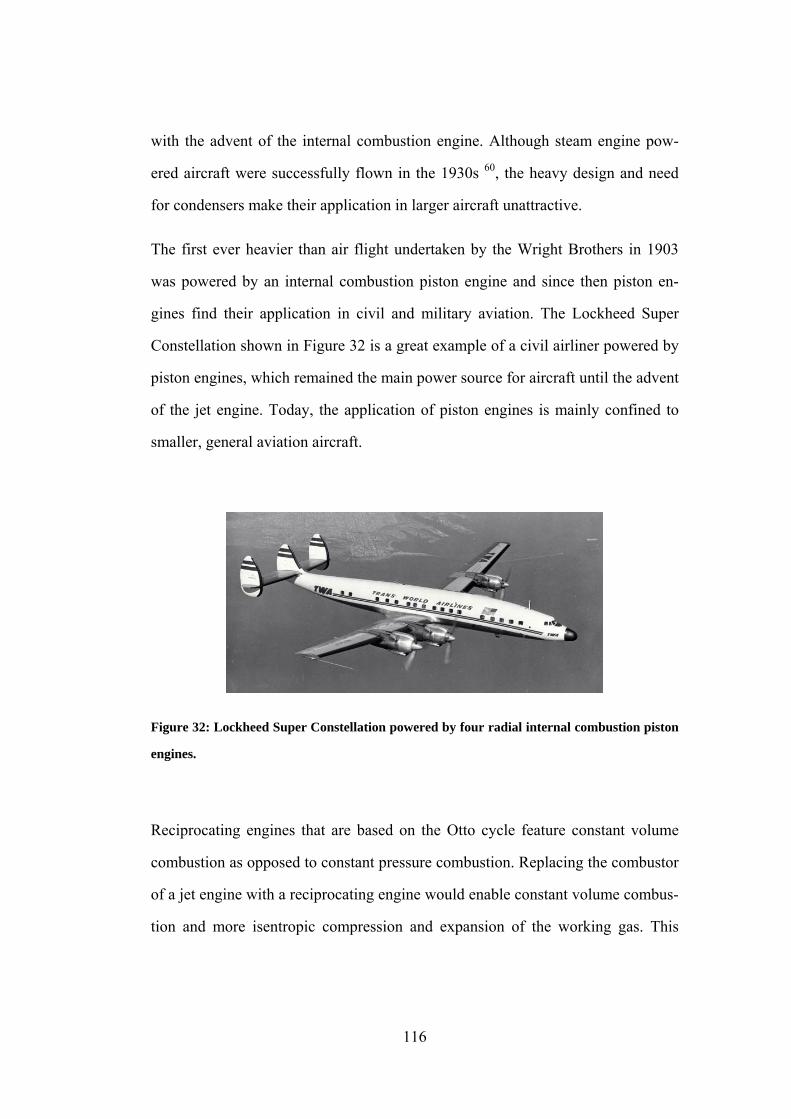
116
with the advent of the internal combustion engine. Although steam engine pow-
ered aircraft were successfully flown in the 1930s 60, the heavy design and need
for condensers make their application in larger aircraft unattractive.
The first ever heavier than air flight undertaken by the Wright Brothers in 1903
was powered by an internal combustion piston engine and since then piston en-
gines find their application in civil and military aviation. The Lockheed Super
Constellation shown in Figure 32 is a great example of a civil airliner powered by
piston engines, which remained the main power source for aircraft until the advent
of the jet engine. Today, the application of piston engines is mainly confined to
smaller, general aviation aircraft.
Figure 32: Lockheed Super Constellation powered by four radial internal combustion piston
engines.
Reciprocating engines that are based on the Otto cycle feature constant volume
combustion as opposed to constant pressure combustion. Replacing the combustor
of a jet engine with a reciprocating engine would enable constant volume combus-
tion and more isentropic compression and expansion of the working gas. This

117
combined enables cycles with higher thermodynamic efficiency which, in theory,
reduces fuel consumption.
The first aircraft engine combining axial flow and reciprocating components was
the Napier Nomad I and Napier Nomad II, which have been developed and tested
in the 1950s. The Napier Nomad I consisted of a compressor and turbine driving a
propeller, and a internal combustion engine in between driving a second, counter
rotating propeller. The air was compressed in two stages and intercooled. A com-
bustion chamber is reheating the air before it enters the turbine stage. The Napier
Nomad II was as much simpler design, consisting of a compressor and a turbine
with an internal combustion engine in between. The internal combustion engine
was driving a propeller, whereas the propeller shaft is connected to the turbine
shaft through a hydraulic clutch. Even though the engines passed flight tests, they
never entered into production. Figure 33 shows the layout of the Napier Nomad II
engine.

118
Figure 33: Napier Nomad II engine layout (top) and photography (bottom) incorporating
constant volume combustion.
The most straight forward design would be a two shaft turbofan engine where the
combustor is replaced with an internal combustion engine where no mechanical
shaft power is extracted. The internal combustion engine would deliver hot, pres-
surised gas to the turbine. The schematic in Figure 34 depicts this configuration.
Figure 34: Two shaft turbofan configuration with an internal combustion engine in its core
acting as gas generator and allowing constant volume combustion.

119
A more integrated design would have advantages in terms of compactness and
weight as shown in Figure 35. Here, a Wankel type engine has replaced the con-
ventional combustor in a high bypass ratio turbofan.
Figure 35: Rotary engine topped gas turbine61.
A variation would be the shaft of the internal combustion engine driving the com-
pressor unit, which would eliminate the high pressure turbine stage. Whilst this
configuration would allow the extraction of mechanical energy through the inter-
nal combustion stage, there would be a mismatch between the high shaft speed of
the compressor stage and the lower shaft speed of the internal combustion engine
requiring a gear box with high gear ratio adding to the weight of the engine. Such
configuration is depicted in Figure 36.

120
Figure 36: Two shaft turbofan configuration with internal combustion stage is driving the
compressor.
A third alternative would be the configuration shown in Figure 37 where the in-
ternal combustion stage is driving the fan. The turbine shaft would be connected
to the compressor. This design could avoid the need for a gearbox as the internal
combustion stage shaft speed is more aligned with the rotational speed of the fan.
However, this configuration would only be feasible is the two stages operated in
parallel as shown in Figure 33 as the two shafts collide or other, less conventional
designs were developed. The author proposes an exoskeletal design as depicted in
Figure 38 where the compressor and turbine stage rotate outside the internal com-
bustion engine. This configuration facilitates the replacement of the combustor
with an internal combustion engine driving a fan.
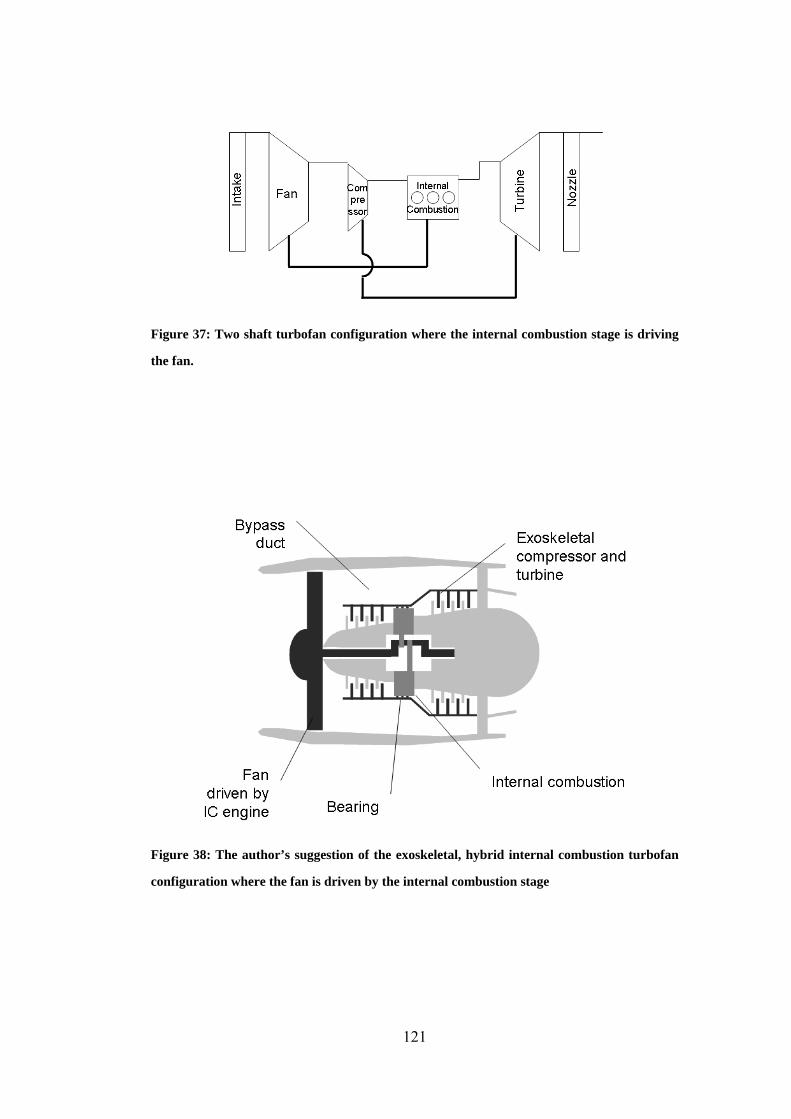
121
Figure 37: Two shaft turbofan configuration where the internal combustion stage is driving
the fan.
Figure 38: The author’s suggestion of the exoskeletal, hybrid internal combustion turbofan
configuration where the fan is driven by the internal combustion stage
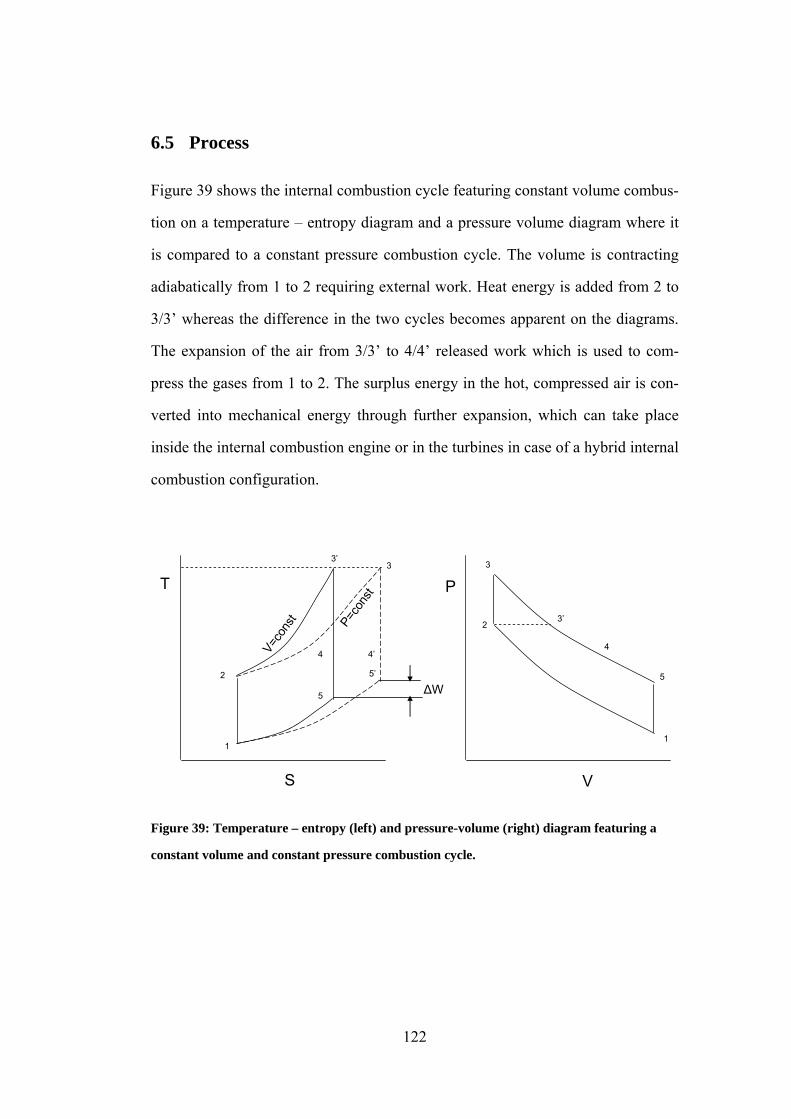
122
6.5 Process
Figure 39 shows the internal combustion cycle featuring constant volume combus-
tion on a temperature – entropy diagram and a pressure volume diagram where it
is compared to a constant pressure combustion cycle. The volume is contracting
adiabatically from 1 to 2 requiring external work. Heat energy is added from 2 to
3/3’ whereas the difference in the two cycles becomes apparent on the diagrams.
The expansion of the air from 3/3’ to 4/4’ released work which is used to com-
press the gases from 1 to 2. The surplus energy in the hot, compressed air is con-
verted into mechanical energy through further expansion, which can take place
inside the internal combustion engine or in the turbines in case of a hybrid internal
combustion configuration.
T
S
V=co
nst P=co
nst
ΔW
P
V
1
2
3
5
3
1
2
5
3’
3’
5’
44
4’
Figure 39: Temperature – entropy (left) and pressure-volume (right) diagram featuring a
constant volume and constant pressure combustion cycle.

123
The least complex configuration is where the internal combustion engine acts
purely as gas generator to deliver high temperature and pressure gas to the turbine
stage of a turbofan (see Figure 40). Compressed air from the compressor stage
enters the cylinders of the internal combustion engine where it is further com-
pressed. Combustion at constant volume facilitates reduced fuel consumption and
subsequent expansion delivers shaft power solely used for the compression of the
air entering the internal combustion stage.
Inta
ke
Fan Compressor
Splitter
Mixer
Splitter
Noz
zle
Noz
zle
Turb
ine
1Ambient
2 3
12
4
7
5 6
9
10 11
13
Turbine
8
IC Engine
Figure 40: Turbofan engine with internal combustion engine replacing the conventional
combustor. The internal combustion engine facilitates constant volume combustion and de-
livers high temperature and pressure gas to the turbine stage. No mechanical work is ex-
tracted from the internal combustion engine shaft.
Figure 40 depicts such layout in a flow diagram and Figure 41 shows the cycle on
a temperature – entropy diagram in comparison with a conventional cycle. Al-
though both cycles operating with the same turbine entry temperature, the cycle

124
featuring constant volume combustion delivers more useful power to propel the
aircraft and hence increase the cycle efficiency.
FanSplitter
CompressorSplitter
1
3
5
8
9
11
Ambient
Inlet
HighPressureTurbine
LowPressureTurbine
Nozzle
Tem
pera
ture
Entropy
ConstantVolume
Combustion
51
52
10
Pressure Gain
Turbine InletTemperature
EnhancedPowerOutput
PistonCompression
Figure 41: Temperature – Entropy diagram showing the conventional turbofan cycle
(dashed) versus a conventional turbofan cycle with an internal combustion engine in its core
(5-51-52-6). The turbine cooling flow is not shown in this diagram to avoid confusion and 6 is
not displayed.
Knowing the delivery temperature and pressure to the internal combustion engine,
the temperature and pressure rise during the compression of the air by the cylinder
is determined by compression ratio VR, which is the ratio of the volume of the
chamber defined by the cylinder and the piston before and after the compression

125
of the air. Assuming an isentropic and adiabatic process, the temperature rise of
the air during the compression can be obtained from
151 5T T VRγ −= Equation 36
Hence, the pressure increase during the compression interval of the internal com-
bustion engine is defined by
1
5151 5
5
TP PT
γγ−
⎛ ⎞= ⎜ ⎟
⎝ ⎠ Equation 37
The resulting temperature just after ignition of the compressed air in the cylinder
is defined externally and the resulting pressure increase due to combustion at con-
stant volume can be calculated from
5252 51
51
TP PT
= Equation 38
The temperature at the exit of the internal combustion stage is defined by the work
required to compress the air during the beginning of the cycle. Taking into ac-
count component efficiency losses for example due to the friction between the pis-
tons and the cylinder walls or the crankshaft mechanism, it can be obtained from
126
( )51 56 52
losses
T TT T
ε−
= − Equation 39
where ε accounts for internal losses associated with mechanical work in the inter-
nal combustion engine for example the crankshaft or friction between the piston
and cylinder. Assuming isentropic and adiabatic expansion of the gases, the pres-
sure of the gas at the exit of the internal combustion engine can be calculated from
16
6 5252
TP PT
γγ −⎛ ⎞
= ⎜ ⎟⎝ ⎠
Equation 40
With the pressures and temperatures known at each point of the theoretical cycle,
the energy into the cycle required and hence the fuel flow is calculated from
( )6 5fuel v
air net
m c T Tm q
−=
&
& Equation 41
With the value for cv being lower than cp by a factor equal to γ, the fuel required
to achieve a desired temperature increase is less in case of the constant volume
combustion process than in case of the constant combustion process.

127
6.6 Computational Model
The computational model was modified to calculate the performance of a turbofan
where the combustor is substituted with an internal combustion engine as shown
in Figure 40. In order to be consistent with previous calculations, the turbine entry
temperature was held constant for all calculations. Therefore, Equation 37 was
rearranged and the peak cycle temperature is hence dependent on compression
ratio and turbine entry temperature.
This leads to the question of what the peak cycle temperature is and if it is techni-
cally feasible and meaningful. The inlet and outlet temperature to the internal
combustion cycle as well as the compression ratio determine the peak cycle tem-
perature. In hybrid configuration, the inlet temperature to the internal combustion
engine varies with the compression pressure ratio, which ranges approximately
between 20 and 100. The resulting compressor exit temperatures range from 775K
to 1,310K. This enables plotting the peak cycle temperature of the internal com-
bustion cycle against compression ratio as shown in Figure 42. A can be seen, the
resulting peak cycle temperatures range from 2,000K to 3,315K and increase with
compression ratio and higher inlet temperatures.

128
2,000
2,200
2,400
2,600
2,800
3,000
3,200
3,400
1.0 2.0 3.0 4.0 5.0
Compression Ratio [-]
Peak
Cyc
le T
empe
ratu
re [K
]1,310K775K
Figure 42: Peak cycle temperature for a hybrid internal combustion engine cycle for differ-
ent inlet temperatures (1,310K and 775K) and compression ratios. The IC outlet tempera-
ture is 2,000K.
The pressure ratio over the internal combustion cycle, which denotes the pressure
increase of the air at the inlet and the outlet to the internal combustion cycle, is
also a function of the compression ratio and the inlet temperature. The depend-
ency can be seen in Figure 43. For a given outlet temperature, the pressure ratio
increases with increasing compression ratio and decreases with higher inlet tem-
peratures. This indicates that relatively low compressor discharge temperatures
resulting from relatively low compressor pressure ratios in combination with
modest compression ratios in the internal combustion engine enable high overall
pressure ratios. If the compression ratio is determining the weight and dimension

129
of the internal combustion engine in a way that higher compression ratios yield
heavier and bulkier designs with larger cylinders, then a combination of relatively
low compressor ratios and low compression ratio would be beneficial regarding
engine weight.
0.00
1.00
2.00
3.00
4.00
5.00
6.00
7.00
1.0 2.0 3.0 4.0 5.0
Compression Ratio [-]
Pres
sure
Rat
io P
06/P
05 [-
]
1,310K775K
Figure 43: Pressure ratio inlet to outlet of an IC cycle in a hybrid cycle for different inlet
temperatures (1,310K and 775K) to the IC cycle and compression ratios. The IC outlet tem-
perature is 2,000K.
The optimisation of the hybrid cycle was carried out with a compression ratio of
three in all sets and mechanical losses of 10%. The outlet temperature of the inter-
nal combustion engine was varied from 1,700K to 2,000K. As in previous sec-
tions, the optimisation of the cycle was carried out in two sets, whereas the bypass

130
ratio was set to 15 in one set. Results for the first set of optimisations are given in
Table 25. The fan pressure ratio in all cases was 1.26 as in previous calculations.
The bypass ratio of the cycles ranges from 37.2 to 52.4, which is higher than in
any of the cycles in previous sections. The compressor pressure ratio of the cycles
is between 13.4 and 24.6. The overall efficiency of the cycles ranges from 82% to
85%, which is higher than in any of the previous cycles.
Turbine Entry Temperature [K] 1,700 1,800 1,900 2,000 2,100 2,200
Fan Pressure Ratio [-] 1.26 1.26 1.26 1.26 1.26 1.26
Bypass Ratio [-] 37.2 40.2 43.2 46.3 49.3 52.4
Compressor Pressure Ratio [-] 13.4 15.3 17.4 19.6 22.0 24.6
Specific Fuel Consumption
[10-5 (kg/s)/N] 0.72 0.72 0.71 0.70 0.70 0.69
Specific Thrust [N/(kg/s)] 62.5 62.4 62.4 62.3 62.3 62.3
Overall Efficiency [-] 0.82 0.83 0.83 0.84 0.85 0.85
Table 25: Summary of engine parameters and performance of optimised, hybrid internal
combustion engine cycles for different TETs.
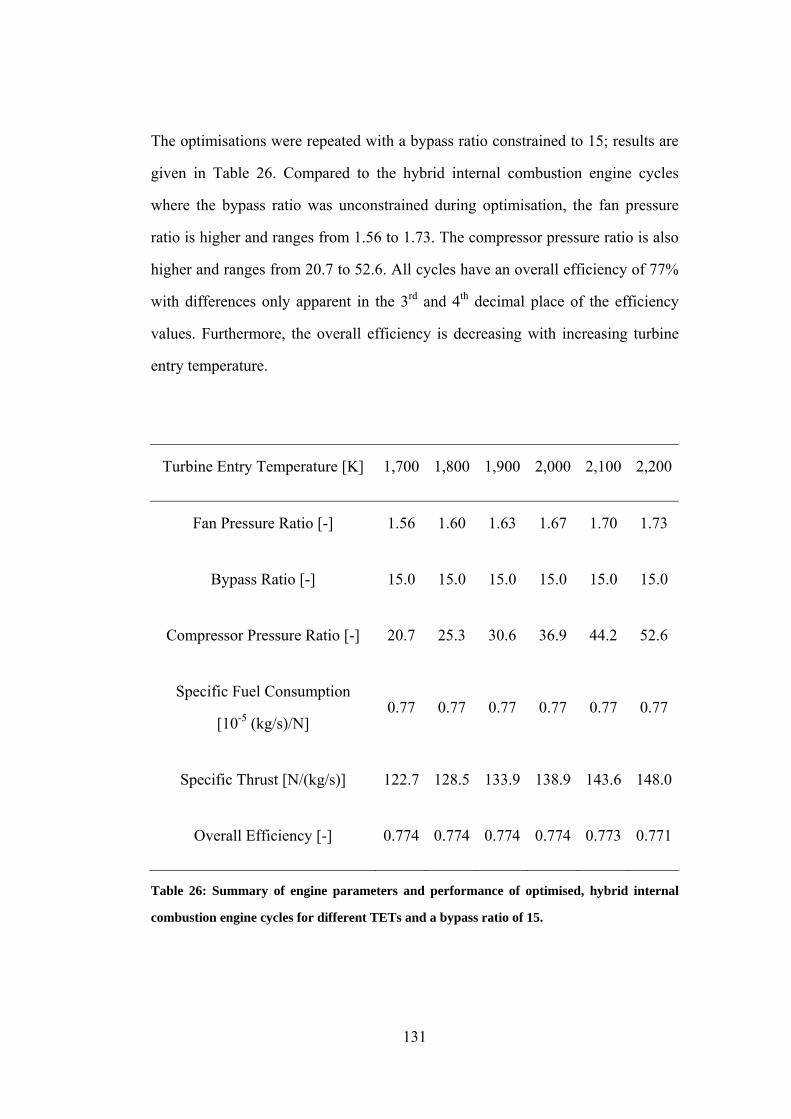
131
The optimisations were repeated with a bypass ratio constrained to 15; results are
given in Table 26. Compared to the hybrid internal combustion engine cycles
where the bypass ratio was unconstrained during optimisation, the fan pressure
ratio is higher and ranges from 1.56 to 1.73. The compressor pressure ratio is also
higher and ranges from 20.7 to 52.6. All cycles have an overall efficiency of 77%
with differences only apparent in the 3rd and 4th decimal place of the efficiency
values. Furthermore, the overall efficiency is decreasing with increasing turbine
entry temperature.
Turbine Entry Temperature [K] 1,700 1,800 1,900 2,000 2,100 2,200
Fan Pressure Ratio [-] 1.56 1.60 1.63 1.67 1.70 1.73
Bypass Ratio [-] 15.0 15.0 15.0 15.0 15.0 15.0
Compressor Pressure Ratio [-] 20.7 25.3 30.6 36.9 44.2 52.6
Specific Fuel Consumption
[10-5 (kg/s)/N] 0.77 0.77 0.77 0.77 0.77 0.77
Specific Thrust [N/(kg/s)] 122.7 128.5 133.9 138.9 143.6 148.0
Overall Efficiency [-] 0.774 0.774 0.774 0.774 0.773 0.771
Table 26: Summary of engine parameters and performance of optimised, hybrid internal
combustion engine cycles for different TETs and a bypass ratio of 15.

132
A direct comparison of hybrid internal combustion cycles where the bypass ratio
was unconstrained during optimisation and where it was constrained to 15 is given
in Table 27. The difference in fan pressure ratio is significant, indicating that al-
ternative propulsion technology may be required for hybrid constant volume com-
bustion cycles with high bypass ratios. In the unconstrained case, the bypass ratio
is 46.3, which is several times that of conventional turbofans. Again, alternative
propulsion technologies such as open rotors would be required to achieve this by-
pass ratio. The compressor pressure ratio of the cycle where the bypass ratio was
unconstrained during optimisation is 19.6 compared to 36.9 in the constrained
case. This suggests that larger, relatively heavier compressors are required if the
bypass ratio is kept low. In terms of specific fuel consumption and overall effi-
ciency, better performance is theoretically achievable where the bypass ratio was
unconstrained during optimisation but both cycles would outperform any of the
other cycles previously described by far in theory. There is a 7% difference in
terms of overall efficiency between both cycles. In terms of specific thrust, about
half the propulsive force per mass unit of air passing through the engine can be
obtained in case of the cycle with the higher bypass ratio compared to the cycle
where the bypass ratio was constrained during optimisation.

133
Unconstrained
BPR
Constrained
BPR
Turbine Entry Temperature [K] 2,000 2,000
Fan Pressure Ratio [-] 1.26 1.67
Bypass Ratio [-] 46.3 15.0
Compressor Pressure Ratio [-] 19.6 36.9
Specific Fuel Consumption [10-5 (kg/s)/N] 0.70 0.77
Specific Thrust [N/(kg/s)] 62.3 138.9
Overall Efficiency [-] 0.84 0.77
Table 27: Summary of hybrid internal combustion cycles for a Turbine Entry Temperature
of 2,000K.

134
Summary
Results of the optimisations of the two spool turbofan, hybrid wave rotor, hybrid
pulse detonation and hybrid internal combustion cycle are summarised in this
chapter to allow a direct comparison. The below figures help to understand the
performance and cycle parameters calculated in the previous chapters whereas
each point indicates a cycle optimised for minimum specific fuel consumption.
Figure 44 and Figure 45 show results for the cycles where the bypass ratio was
unconstrained during optimisation. Each set of cycles comprises turbine entry
temperatures ranging from 1,700K to 2,200K. The overall efficiency is increasing
with increasing turbine entry temperature for each set of cycles. The fan pressure
ratio of cycles was calculated to be 1.26 in all cases regardless of turbine entry
temperature.
Best possible fuel performance of all sets is achieved with the hybrid internal
combustion engine. The overall efficiency exceeds 80%, which is achieved
through constant volume combustion and more efficient compression and expan-
sion processes facilitated by the internal combustion engine. The specific thrust is
also lowest of all cycles as a result of the relatively high bypass ratios exceeding
37. These high bypass ratios would be possible if alternative fan technology was
used. The compressor pressure ratio is amongst the lowest of all cycles, remaining
below 25 even for a turbine entry temperature of 2,200K.
The second most fuel efficient cycle is the hybrid pulse detonation cycle with
overall efficiencies around 60%. The specific thrust is higher than for the hybrid
internal combustion engine and the hybrid wave rotor cycles, which is due to the

135
relatively low bypass ratios only undercut by the conventional turbofan cycle. The
compressor pressure ratio of the hybrid pulse detonation cycles becomes relatively
high for higher turbine entry temperatures and ranges from 40 and 100, which
would indicate the need for relatively heavy compressors.
0.3
0.4
0.5
0.6
0.7
0.8
62 62.5 63 63.5Specific Thurst [N/(kg/s)]
Ove
rall
Effic
ienc
y [-]
TurbofanWave RotorAdvanced Wave RotorPulse DetonationInternal Combustion Engine
Figure 44: Overall efficiency and specific thrust of optimised cycles. TET is increasing from
left to right (1,700K to 2,200K) within a given set.
Two sets of optimisations were carried out for the hybrid wave rotor cycles,
whereas the hybrid advanced wave rotor cycles in based on a more advanced
wave rotor design facilitating higher pressure ratios in the wave rotor. The hybrid
wave rotor has a larger internal pressure ratio than the hybrid advanced wave ro-
tor. Results suggest that hybrid wave rotor cycles are the least fuel efficient hybrid
cycles studied in this thesis even with inferior performance compared to what is
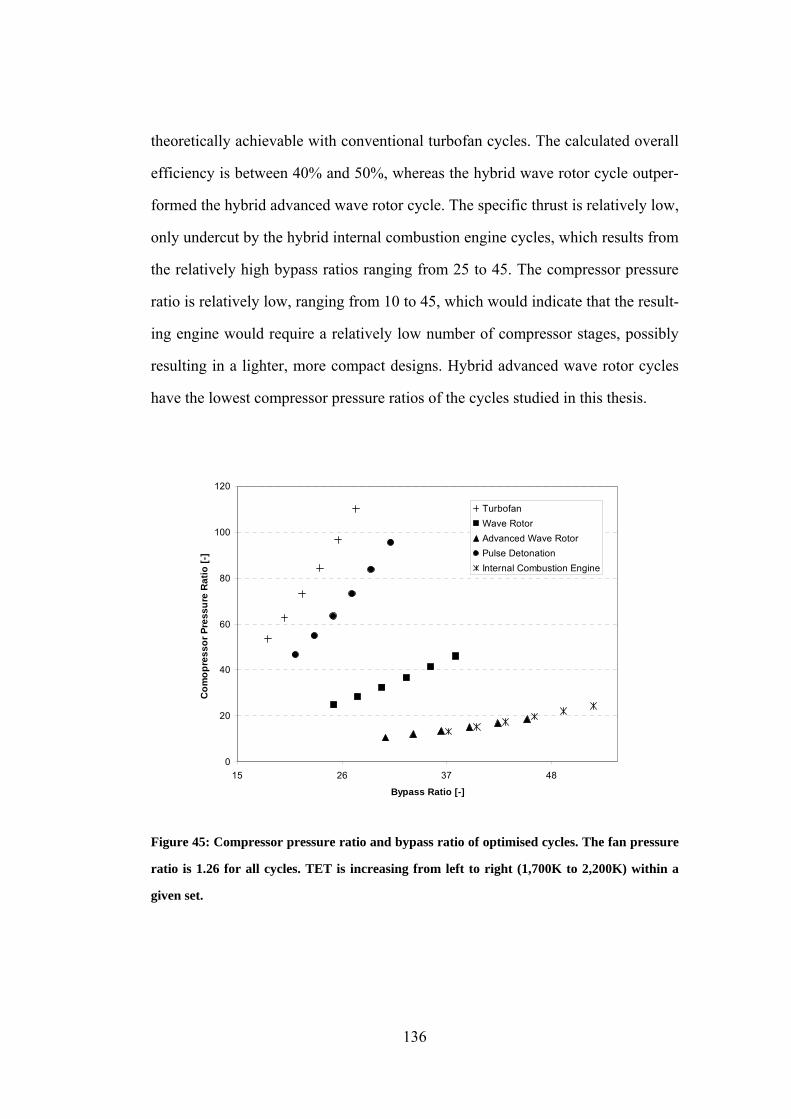
136
theoretically achievable with conventional turbofan cycles. The calculated overall
efficiency is between 40% and 50%, whereas the hybrid wave rotor cycle outper-
formed the hybrid advanced wave rotor cycle. The specific thrust is relatively low,
only undercut by the hybrid internal combustion engine cycles, which results from
the relatively high bypass ratios ranging from 25 to 45. The compressor pressure
ratio is relatively low, ranging from 10 to 45, which would indicate that the result-
ing engine would require a relatively low number of compressor stages, possibly
resulting in a lighter, more compact designs. Hybrid advanced wave rotor cycles
have the lowest compressor pressure ratios of the cycles studied in this thesis.
0
20
40
60
80
100
120
15 26 37 48
Bypass Ratio [-]
Com
opre
ssor
Pre
ssur
e R
atio
[-]
TurbofanWave RotorAdvanced Wave RotorPulse DetonationInternal Combustion Engine
Figure 45: Compressor pressure ratio and bypass ratio of optimised cycles. The fan pressure
ratio is 1.26 for all cycles. TET is increasing from left to right (1,700K to 2,200K) within a
given set.

137
In order to avoid the challenges, weight and drag associated with high bypass ra-
tios, the optimisations were repeated where the bypass ratio was fixed to 15. The
design variables were fan pressure ratio and compressor pressure ratio only. Al-
though the calculated values for the overall efficiencies of the optimised cycles
were lower in general, a similar trend could be found with respect to which type
of cycles are more fuel efficient.
The most fuel efficient cycles are the hybrid internal combustion engine cycles
with overall efficiencies exceeding 75%, followed by hybrid pulse detonation
(about 60%), conventional turbofans (about 50%), hybrid wave rotors and ad-
vanced wave rotors (40%-50%). Lower bypass ratios imply that less air is passing
through the engine to generate the thrust. The specific thrust of the cycles with
lower bypass ratios is about half the specific thrust compared to the previous cy-
cles, which would indicate that the mass flow is reduced by half to obtain the
same thrust. Since mass flow and inlet diameter are directly related, half the mass
flow would imply engines diameters being smaller by a factor of 2 . The hybrid
advanced wave rotor cycles have the highest specific thrust, followed by the hy-
brid internal combustion engine and the hybrid wave rotor engine. The hybrid
pulse detonation engine and conventional turbofan cycle have the lowest specific
thrust of the cycles studied in this thesis.
As opposed to the optimisations where the bypass ratio was unconstrained, the fan
pressure ratio varies for the different cycles as depicted in Figure 46 ranging from
1.30 to 1.85. This is higher than for all the cycles where the bypass ratio was un-
constrained during optimisation where the fan pressure ratio is 1.26 in call cases.
In general, it was observed that hybrid cycles have higher fan pressure ratios than
conventional turbofans cycles. The fan pressure ratio is highest for the hybrid ad-

138
vanced wave rotor cycles ranging from 1.55 to 1.85 and probably exceeding limits
of what is achievable with current fan technology. The fan pressure to the hybrid
internal combustion cycles range from 1.56 to 1.73 and are more feasible consid-
ering state of the art fan technology. Hybrid wave rotor cycles are followed by
hybrid pulse detonation cycles in terms of fan pressure ratio whereas turbofan cy-
cles exhibit lowest fan pressure ratios. This order is equivalent to that observed for
specific thrust as higher fan pressure ratios increase the thrust per mass unit of air
passing through the engine.
0.3
0.4
0.5
0.6
0.7
0.8
60 80 100 120 140 160
Specific Thurst [N/(kg/s)]
Ove
rall
Effic
ienc
y [-
]
TurbofanWave RotorAdvanced Wave RotorPulse DetonationInternal Combustion Engine
Figure 46: Overall efficiency and specific thrust of optimised cycles (bypass ratio is 15). TET
is increasing from left to right (1,700K to 2,200K) within a given set.
In general, the cycles where the bypass ratio was constrained during optimisation
have higher compressor ratios than the cycles where the bypass ratio was uncon-
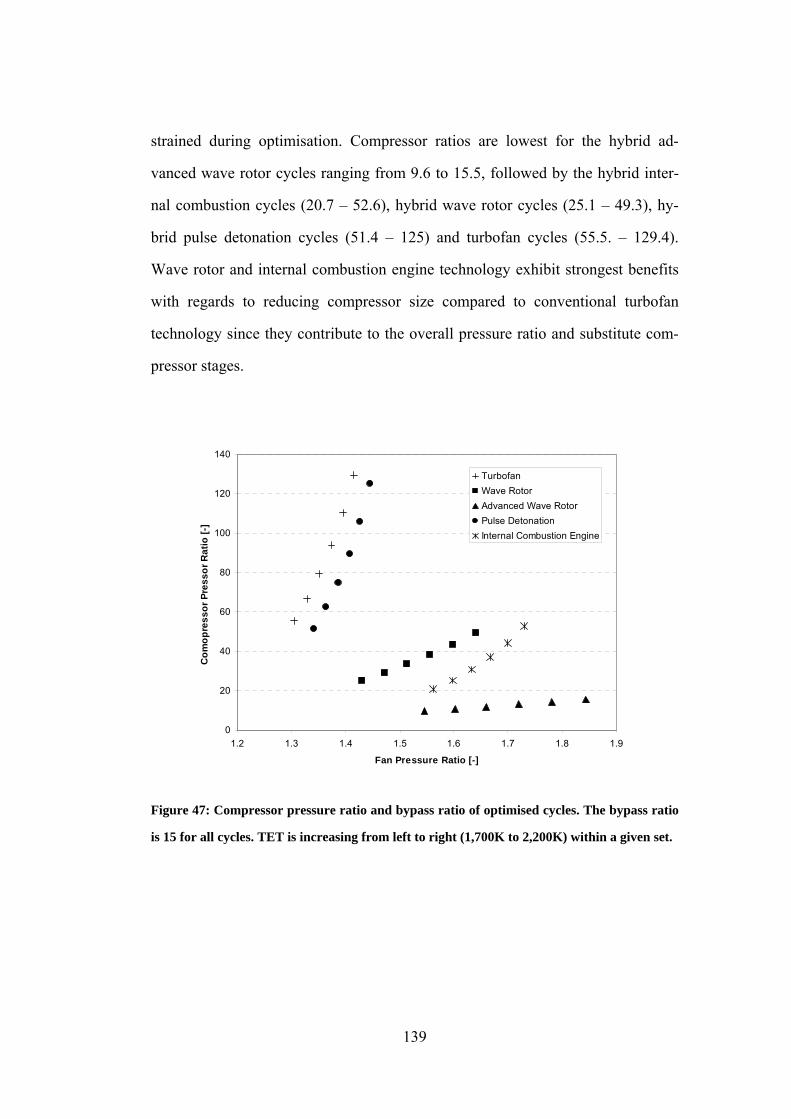
139
strained during optimisation. Compressor ratios are lowest for the hybrid ad-
vanced wave rotor cycles ranging from 9.6 to 15.5, followed by the hybrid inter-
nal combustion cycles (20.7 – 52.6), hybrid wave rotor cycles (25.1 – 49.3), hy-
brid pulse detonation cycles (51.4 – 125) and turbofan cycles (55.5. – 129.4).
Wave rotor and internal combustion engine technology exhibit strongest benefits
with regards to reducing compressor size compared to conventional turbofan
technology since they contribute to the overall pressure ratio and substitute com-
pressor stages.
0
20
40
60
80
100
120
140
1.2 1.3 1.4 1.5 1.6 1.7 1.8 1.9
Fan Pressure Ratio [-]
Com
opre
ssor
Pre
ssor
Rat
io [-
]
TurbofanWave RotorAdvanced Wave RotorPulse DetonationInternal Combustion Engine
Figure 47: Compressor pressure ratio and bypass ratio of optimised cycles. The bypass ratio
is 15 for all cycles. TET is increasing from left to right (1,700K to 2,200K) within a given set.

140
6.7 Estimating Installed Performance
The results of the previous calculations suggest that the cycle parameters in terms
of fan pressure ratio, compressor pressure ratio and bypass ratio are often in ex-
cess of what is achievable with state of art engine technology. Compressor pres-
sure ratios exceeding 60 will p4obably be difficult to achieve at current technol-
ogy level. Maximum fan pressure ratios of high bypass turbofans are in the range
of 1.6 beyond which alternative propulsor technology would probably be applica-
ble. Bypass ratios exceeding 15 are not common in modern turbofan engines and
efficiency advantages due to bypass ratios beyond 20 are offset due to increased
weight and drag. Hence, another set of optimisations was performed with addi-
tional constraints introduced. The Turbine Entry Temperature was set to 2,000 K
in all calculations. The constrains were set to values that were thought to be
achievable with current engine technology and are shown in Table 28. As previ-
ously stated, the cycle of a particular engine typically varies during a flight mis-
sion with changing throttle setting and ambient conditions and parameters given
here should be considered as average values.
Parameter Upper Limit
Fan Pressure Ratio 1.5
Bypass Ratio 15
Compressor Pressure Ratio 60
Table 28: Optimisation constraints for engine parameters.

141
Results of the additional calculations are summarised in Table 29. In all cases, the
calculated fan pressure ratio is either close or equal to the constraint set for the
optimisation whereas the bypass ratio is equal to the constraint in all cases. The
resulting specific thrust ranges from 102.7 – 122.5 N/(kg/s). This allows the as-
sumption that the engines incorporating the cycles would be of approximately
same inlet diameter and produce the same net thrust.
Turbofan Wave Rotor
Advanced Wave Rotor
Pulse Detonation
Internal Combustion
Turbine Entry Temperature [K] 2,000 2,000 2,000 2,000 2,000
Fan Pressure Ra-tio [-] 1.46 1.50 1.50 1.49 1.50
Bypass Ratio [-] 15.0 15.0 15.0 15.0 15.0
Compressor Pres-sure
Ratio [-] 60.0 48.6 26.0
60.0
(26.0) 60.0
Specific Fuel Consumption [10-
-5 (kg/s)/N] 1.21 1.33 1.54
1.00
(1.11) 0.79
Specific Thrust [N/(kg/s)] 102.7 113.0 129.3
108.3
(127.2) 122.5
Overall Efficiency [-] 0.49 0.45 0.39
0.59
(0.53) 0.75
Table 29: Results for cycle optimisations with constraints.

142
The only significant differences can be found in terms of compressor pressure ra-
tio. The hybrid wave rotor cycles have lower compressor pressure ratios than the
other cycles, indicating the wave rotor would substitute some of the compressor
stages. The number of stages substituted depends on the pressure ratio across a
single stage. Assuming a pressure ratio of 1.3 across a single compressor stage,
about 1-2 stages could be saved compared to the conventional turbofan case in
case of the hybrid wave rotor and 3-4 stages could be saved if the advanced wave
rotor was used. Depending on the weight per stage, this would result in a shorter
and lighter compressor. However, considering the overall number of stages, this
could only result in a small weight saving in absolute terms. For example in order
to achieve an overall pressure ratio of 60 the total amount of compressor stages
would be 16 if the pressure ratio per stage was 1.3 and saving 3 out of 16 stages
would mean saving 20% of the overall amount of stages in the compressor unit.
This would not necessarily mean that the resulting hybrid advanced wave rotor
engine was 20% lighter or more compact than a comparable turbofan since the
wave rotor would be added to the overall design and the conventional combustor
is not replaced by the wave rotor. The overall weight difference depends on the
difference in weight and dimensions of the wave rotor compared to the stages it
replaces. In the literature, the weight of a particular turbofan engine is believed to
increase if the wave rotor is not substituting compressor stages of the engine it is
built into. The added weight to an engine due to the wave rotor is estimated to be
23%62. Assuming that the wave rotor does not result in a longer engine, which is
theoretically possible if it is placed inside (or outside) the tubular combustor, and
assuming that each compressor stage saved would result in a 6.4% weight saving
of the total engine, then the hybrid advanced wave rotor would weigh 2.6% more
than the comparable turbofan. This would almost be offset by the compressor

143
stages saved if the wave rotor was substituting compressor stages (based on the
assumptions before).
In case of the hybrid pulse detonation cycle, the compressor ratio yielding maxi-
mum overall efficiency is 60, which is the same as for the conventional turbofan
cycle and suggests that no weight benefits are achievable since no compressor
stages are replaced. The calculated fan pressure ratio is 1.49 (compared to 1.46 for
the turbofan) and the bypass ratio 15, which is the constraint that was set in the
optimisation. The overall efficiency of the cycle is 59%, considerably higher than
for the conventional turbofan of 49%. Since the pulse detonation cycle is not sub-
stituting compressor stages as opposed to the wave rotor, the weight of the hybrid
engine would increase compared to the conventional turbofan. Since the pulse
detonation engine has a geometry similar to the wave rotor, it would be reasonable
to assume that both devices have a similar weight. However, the wave rotor en-
gine does not replace the continuous flow combustor whereas the pulse detonation
does replace the combustor. Assuming that the combustor of a conventional turbo-
fan engine represents 10% of the engine weight and that a geometry similar to the
wave rotor increases the weight of a turbofan by 23%, it is reasonable to assume
that the total weight increase of a hybrid pulse detonation engine would be 13%. If
the pulse detonation engine was replacing compressor stages than it could be as-
sumed that the weight penalty would change. It was previously calculated that the
hybrid advanced wave rotor cycle has a compressor pressure ratio of 26 which
would mean that 3-4 compressor stages are replaced. Applying the same assump-
tions to the hybrid pulse detonation engine, than the weight difference compared
to the conventional turbofan would be -7.4%. However, the performance of this
engine would be different. In an additional calculation, the performance of such

144
cycle was calculated and is given in brackets in Table 29. The overall efficiency
of the hybrid pulse detonation cycle is 53% as opposed to 59%.
The cycle parameters resulting of the optimisation of the hybrid internal combus-
tion cycle are equivalent to the constraints as can be seen in Table 29. The cycle
overall efficiency is highest of all cycles and with a value of 75%. The efficiency
results from high cycle temperatures in the internal combustion unit, the increased
overall pressure ratio and the mode of combustion at constant volume. Depending
on how the internal combustion engine is integrated with the turbofan, the weight
of the hybrid internal combustion engine changes compared to the conventional
turbofan. The key indicator for the size of an internal combustion engines is dis-
placement. Engine displacement is the volume that is displaced by all pistons in-
side the cylinders of an internal combustion engine in a cycle from top dead centre
to bottom dead centre excluding the combustion chamber. If the compression ratio
is known, the volume displaced by one cylinder during one cycle is
11DV VVR
⎛ ⎞= −⎜ ⎟⎝ ⎠
Equation 42
where V is the volume of the cylinder when the piston is at the top dead centre at
the beginning of the cycle. The volume V required to accommodate the mass of
air m at pressure P and temperature T can be derived from the ideal gas model
mRTVP
= Equation 43

145
If the rotational speed, or cycle speed, of the internal combustion engine is know,
then the mass of air in the cylinders during one cycle can be calculated from
mmn
=&
Equation 44
where m& is the average mass flow through the internal combustion engine and n
the rotational speed in cycles per time unit. Since the mass flow through a turbo-
fan is given as the sum of both the bypass and the engine core mass flow, in case
of a hybrid internal combustion engine the mass flow m& can be calculated from
1TotalmmBPR
=+&
& Equation 45
where Totalm& is the total mass flow through the hybrid turbofan engine. Combining
equations 40 to 43, the total displacement volume of the internal combustion en-
gine is calculated from
5
5
11
(1 )
Total
D
m RTVRV
nP BPR
⎛ ⎞−⎜ ⎟⎝ ⎠=+
&
Equation 46

146
Note that Equation 44 is valid only for a one stroke internal combustion engine.
The displacement volume calculated in Equation 44 would have to be multiplied
with the number of strokes during one cycle.
Assuming a total mass flow through the engine of 1,000 kg/s, which is compara-
ble to that of a modern turbofan engine for mid size, long-haul aircraft, a rota-
tional speed of 3,000 min-1, which is typical for modern automobile engines and
1940s piston propeller engines, an inlet temperature to the internal combustion
engine of 1,000 K and inlet pressure of 30 bar, which are typical combustor inlet
conditions, a bypass ratio of 15 indicating high bypass ratio turbofan technology,
and a compression ratio of 3, the displacement volume of a hybrid internal com-
bustion engine can be calculated to be 79.7 litres. The parameters are summarised
in Table 30. In comparison, the displacement volumes of high performance piston
propeller engines of the 1940s era range from 30 to 50 litres63. One of the most
powerful piston aero engines built in the 1930/1940s was the Napier Sabre, a Brit-
ish 24 cylinder, liquid cooled engine. With a displacement volume of 36.7 litres,
the engine dry weight was 1,070 kg64, which included a gearbox. Linear scaling to
79.7 litres displacement volume would yield 2,327 kg as an approximation for the
weight of an internal combustion engine substituting the combustor of a turbofan
with a mass flow of 1,000 kg/s.

147
RPM [min-1] 3,000
Total Mass Flow [kg/s] 1,000
R [J(kg K)-1] 287
Inlet Temperature [K] 1,000
Inlet Pressure [bar] 30
Bypass Ratio [-] 15
Compression Ratio [-] 3
Table 30: Parameters for the calculation of the displacement volume of an internal combus-
tion engine.
The dry weight of a modern mid size, long haul turbofan engine approximates to
about 5,444 kg65. Adding the weight of the turbofan and the internal combustion
engine together would yield a total weight of 7,771 kg of which the internal com-
bustion engine would contribute 30%.The increase in weight from the conven-
tional to the hybrid configuration would thus be 43%. This would not include
weight savings associated with the replaced combustor and compression stages of
the turbofan, improved design and manufacturing techniques of the internal com-
bustion engine, new materials, or the absence of a gear. Table 31 shows the gain
in weight of the resulting engine if a piston engine with a state of the art turbofan

148
were merged compared to the turbofan engine alone. The different columns and
rows show scenarios where weight can be saved of either the turbofan or the pis-
ton engine prior to the hypothetical merge. Based on the assumption that replacing
the combustor would result in a 10% weight saving and the internal combustion
engine would be 10% lighter than aircraft piston engine designs of the 1940s, the
resulting hybrid internal combustion engine would be 28% heavier than the com-
parable turbofan.
Weight savings turbofan →
Weight savings piston en-
gine
↓
0% -10% -20% -30%
0% 43% 33% 23% 13%
-10% 38% 28% 18% 8%
-20% 34% 24% 14% 4%
-30% 30% 20% 10% 0%
Table 31: Wight of the resulting engine if a scaled version of a 1940s piston engine with a
state of the art turbofan were merged. Hypothetical weight changes prior to the merge
shown in the left hand column and top row.
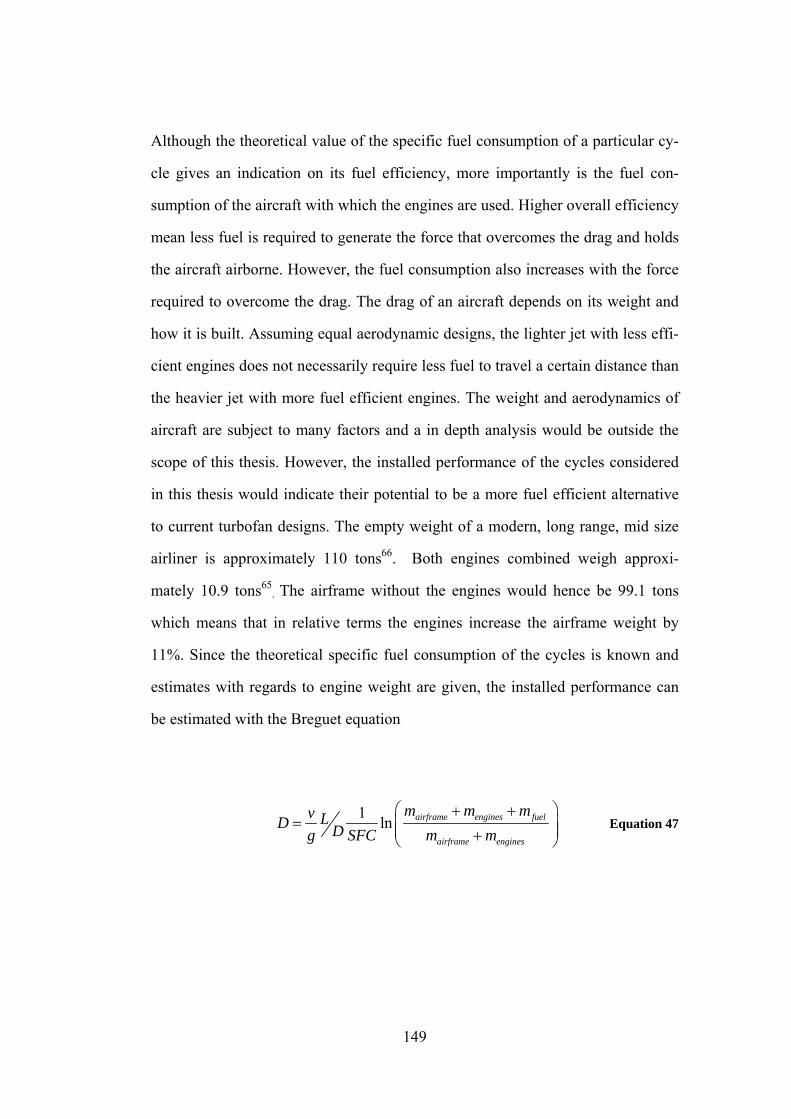
149
Although the theoretical value of the specific fuel consumption of a particular cy-
cle gives an indication on its fuel efficiency, more importantly is the fuel con-
sumption of the aircraft with which the engines are used. Higher overall efficiency
mean less fuel is required to generate the force that overcomes the drag and holds
the aircraft airborne. However, the fuel consumption also increases with the force
required to overcome the drag. The drag of an aircraft depends on its weight and
how it is built. Assuming equal aerodynamic designs, the lighter jet with less effi-
cient engines does not necessarily require less fuel to travel a certain distance than
the heavier jet with more fuel efficient engines. The weight and aerodynamics of
aircraft are subject to many factors and a in depth analysis would be outside the
scope of this thesis. However, the installed performance of the cycles considered
in this thesis would indicate their potential to be a more fuel efficient alternative
to current turbofan designs. The empty weight of a modern, long range, mid size
airliner is approximately 110 tons66. Both engines combined weigh approxi-
mately 10.9 tons65. The airframe without the engines would hence be 99.1 tons
which means that in relative terms the engines increase the airframe weight by
11%. Since the theoretical specific fuel consumption of the cycles is known and
estimates with regards to engine weight are given, the installed performance can
be estimated with the Breguet equation
1 ln airframe engines fuel
airframe engines
m m mv LD Dg SFC m m⎛ ⎞+ +
= ⎜ ⎟⎜ ⎟+⎝ ⎠ Equation 47

150
where D is the distance c is the aircraft speed, g g the gravitational acceleration,
LD the lift to drag ratio and m denotes mass or weight. The Breguet equation
assumes continuous climb and constant lift to drag ratio. If the engine weight is
expressed in relative terms compared to the airframe weight without engines, rear-
ranging Equation 47 yields
1 1g SFCD
Lvfuel engineD
aircraft airframe
m me
m m
⎡ ⎤ ⎛ ⎞⎢ ⎥= − +⎜ ⎟⎜ ⎟⎢ ⎥ ⎝ ⎠⎣ ⎦
Equation 48
Assuming that the airframe weight would not be affected by the difference in en-
gine design or engine weight, Equation 48 will enable to calculate the block fuel
consumption of the cycles investigated in this thesis. The aircraft speed was as-
sumed to be 255 m/s and the distance travelled 15,000 km; a lift to drag ratio of
20 was chosen resembling state of the art technology.
A summary of the results is given in Table 32. Taking the turbofan engine as ref-
erence point, the less fuel efficient and heavier hybrid wave rotor cycles would
result in a higher block fuel consumption of 14% and 34%, respectively. The hy-
brid pulse detonation cycles result in net fuel savings. Theoretically 19% could be
saved with the heavier version whereas 11% could be saved with the lighter de-
sign. The hybrid internal combustion engine offers greatest block fuel savings
even though the weight of the engine is assumed to increase by 28%. If the as-
sumptions hold then 37% could be saved in terms of block fuel consumption. It
should be noted that an increasing ratio of block fuel weight to airframe weight

151
indicates heavier structures to carry the fuel weight, which is not taken into ac-
count in this study.
TurbofanHybrid
Wave Ro-tor
Hybrid Advanced Wave Ro-
tor
Hybrid Pulse
Detona-tion (a)
Hybrid Pulse
Detona-tion (b)
Hybrid Internal
Combus-tion
SFC [10-5 (kg/s)/N] 1.21 1.33 1.54 1.00 1.11 0.79
Engine weight change compared
to turbofan 0% +17.9% +2.6% +13.0% -7.4% +28.0%
Engine weight in % of airframe
weight 11.0% 13.0% 11.3% 12.4% 10.2% 14.1%
Ratio block fuel weight to air-frame weight
0.46 0.53 0.62 0.38 0.41 0.29
Block fuel con-sumption change relative to turbo-
fan
0% +14% +34% -19% -11% -37%
Table 32: Comparison of installed performance of the engine cycles.

152
6.8 Technology Readiness
An internationally adapted scale to assess the stage at which a certain technology
has arrived is the Technology Readiness Level (TRL) scale developed by the Na-
tional Aeronautics and Space Administration (NASA) in the Unites States of
America. It is a measure adapted by many of the world's major companies and
agencies to assess the maturity of evolving technologies including materials,
components, devices, etc prior to incorporating that technology into a system or
subsystem. A new technology that is first invented or conceptualised is not neces-
sarily suitable for immediate application. Instead, new technologies are usually
subject to further development, refinement, and application under increasingly
realistic circumstances. Once the technology is sufficiently proven, it can be in-
corporated into an existing system or subsystem. A description of the NASA TRL
scale can be found in the Appendix. It ranges from one to nine whereas one de-
notes the least advances stage and nine the stage where the actual system is 'flight
proven' through successful mission operations.
Wave rotor technology has only been tested in a laboratory environment in an
aviation context where the concept has been proven successfully. Technology
similar to the wave rotor is used for supercharging automotive engines. Although
the basic technological elements are in place, the validation of wave rotors applied
in a turbofan environment remains relatively ‘low-fidelity’. More research is re-
quired on mechanical integrity issues, sealing and diffuser designs. Since some of
these aspects are becoming part of current research activities, the technology
readiness level of wave rotors is valued at 4 to 5.

153
As for the wave rotor, the pulse detonation engine is confined to laboratory re-
search only. The pulse detonation concept has been applied for the direct propul-
sion of unmanned air vehicles in the 1940s and a manned test aircraft has success-
fully been flown more recently in 200867. Pulse detonation cycles suited for the
application in turbofan engines have been investigated and analytical results and
prediction were proven by experiments. Although basic pulse detonators are be-
coming more frequently assessed in a more integrated system environment, ex-
periments remain somewhat simplistic compared to the eventual system. Hence
the technological readiness level of pulse detonators is valued at 3 to 4.
The hybrid internal combustion engine is more advanced than the wave rotor or
pulse detonation engine. Both, piston and gas turbine engines have been exten-
sively developed and manufactured in the past and have become machines deeply
integrated with the modern society. The Napier Nomad engine developed in the
1950s was an engine incorporating both axial flow turbomachinery and piston
technology. It was successfully tested in flight and can be attributed to a technol-
ogy readiness level of 9. Since the nearest equivalent to the hybrid internal com-
bustion engine has been tested more than sixty years before this thesis was writ-
ten, the technology readiness level of the integration of an internal combustion
engine with a modern turbofan engine is downgraded. Although the hybrid inter-
nal combustion engine consists of already existing parts, it will require further in-
tensive development and can hence be considered as TRL 6 to 7.
154
7 Conclusions
The dream of flight has led to the development of an advanced, ever increasing air
transport industry. The jet engine was an important facilitator and a disruptive
technology at the time when it was first developed. In the light of global warming,
the projected shortage of primary energy resources and the associated socio eco-
nomical consequences, it becomes important to enhance the sustainability of avia-
tion by improving the fuel efficiency of aircraft. As we are approaching the limits
of conventional turbofan technology and smaller, incremental improvements in
engine technology require increasing investments, new technologies of more dis-
ruptive character are sought that offer a safe, reliable, practical and low risk alter-
native. This thesis compares the potential for hybrid aircraft engine cycles to re-
duce fuel consumption of passenger aircraft and contributes to developing a
roadmap for more sustainable aviation.
A one dimensional engine performance model was developed to calculate the key
performance parameters of thermodynamic cycles to allow a comparison of hy-
brid cycles with a conventional turbofan cycle. The model is based on simplifying
assumptions to make relative comparisons rather than producing accurate predic-
tions.
The baseline cycle is a turbofan cycle consisting of a fan driven by the low pres-
sure turbine, a compressor driven by the high pressure turbine, a bypass duct, a
wave rotor and a continuous flow combustor. The bypass duct separates the core
mass flow and bypass mass flow after the fan stage.

155
The wave rotor can be understood as an additional shaft consisting of a compres-
sor and a turbine where the pressure exchange is based on wave processes. In be-
tween the flow is a continuous flow combustor. In the absence of blades, the wave
rotor allows higher peak cycle temperatures that are usually limited by the mate-
rial properties and cooling techniques applied for turbine blades
The pulse detonation cycle facilitates combustion whereas the pressure is in-
creased during the combustion process. Replacing the continuous flow combustor
in a conventional turbofan engine, the hybrid pulse detonation cycle allows higher
pressures and, together with the more advanced combustion process, facilitates
lower fuel consumption.
The internal combustion cycle enables constant volume combustion similar to a
one stroke Otto cycle. As in case of the hybrid pulse detonation cycle, the internal
combustion engine is replacing the conventional combustor. Higher pressures and
temperatures in combination with constant volume combustion enable significant
fuel savings.
The technical feasibility of the physical engines is based on the assumption that
technology currently operated under laboratory conditions or applied in different
fields can be scaled suitable for the application in hybrid turbofan engines.
The cycles were optimised where the objective was to adjust the design parame-
ters to obtain a cycle operating with maximum possible efficiency. The design pa-
rameters were bypass ratio, fan pressure ratio and compressor pressure ratio. All
other engine parameters and gas properties were constant throughout all calcula-
tions. In an additional set of calculations the theoretical performance of engine
cycles was calculated whereas design variables were constrained during optimisa-
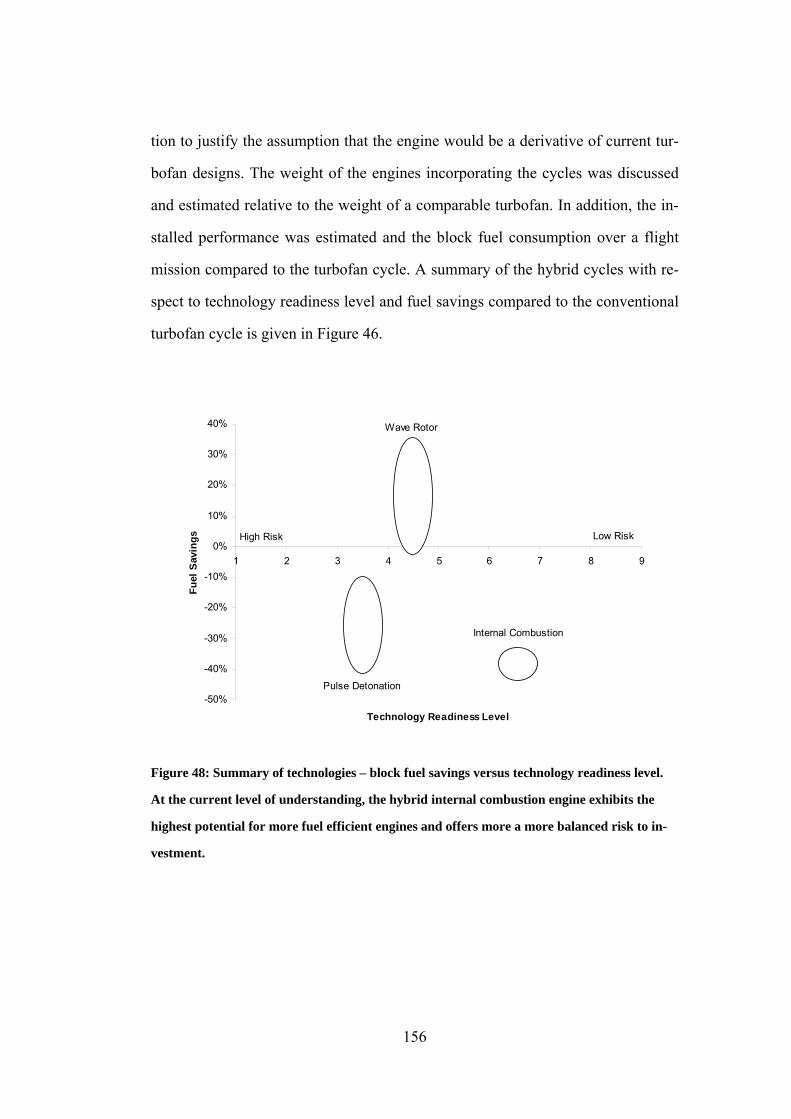
156
tion to justify the assumption that the engine would be a derivative of current tur-
bofan designs. The weight of the engines incorporating the cycles was discussed
and estimated relative to the weight of a comparable turbofan. In addition, the in-
stalled performance was estimated and the block fuel consumption over a flight
mission compared to the turbofan cycle. A summary of the hybrid cycles with re-
spect to technology readiness level and fuel savings compared to the conventional
turbofan cycle is given in Figure 46.
-50%
-40%
-30%
-20%
-10%
0%
10%
20%
30%
40%
1 2 3 4 5 6 7 8 9
Technology Readiness Level
Fuel
Sav
ings
Wave Rotor
Pulse Detonation
Internal Combustion
High Risk Low Risk
Figure 48: Summary of technologies – block fuel savings versus technology readiness level.
At the current level of understanding, the hybrid internal combustion engine exhibits the
highest potential for more fuel efficient engines and offers more a more balanced risk to in-
vestment.
157
According to the results, the most promising hybrid engine cycle with regards to
fuel efficiency is the theoretical hybrid internal combustion cycle. The low spe-
cific fuel consumption of the hybrid internal combustion engine stems from the
high overall pressure ratio and maximum cycle temperature in combination with
constant volume combustion. Even though the weight of the hybrid engine is ex-
pected to increase compared to the conventional turbofan engine, the efficiency
gains prevail and the block fuel consumption in installed configuration is expected
to decrease significantly. The results of this study suggest the reduction in block
fuel consumption can be as high as 37% compared to a conventional turbofan cy-
cle. The technical challenges that need to be overcome in building an engine run-
ning on this cycle are the weight and dimensions of the internal combustion en-
gine since the mass flow through a turbofan engine for a long range airliner would
require large displacement volumes. New design approaches to combine axial
flow technology with internal combustion engine technology are hence sought.
Hybrid internal combustion engines operating with high bypass ratios or relatively
high fan pressure ratios would offer the highest efficiency improvements, which
indicated the requirement for novel propulsor technologies. A possible solution is
the application of distributed propulsion where the thrust is generated by a large
number of fans integrated with the fuselage. This enables very high bypass ratios
but requires further development in power transmission technology such as super-
conductivity. Since a vast pool of experience and knowledge in designing internal
combustion engines is available and a flying prototype of an aero engine based on
axial flow technology consisting of a piston engine core was already tested in the
mid 1950s, risks and investment associated with this technology would be more
balanced compared to less developed technologies. An industry as regulated and
risk averse as aircraft manufacturers68 would welcome this feature in particular.

158
Future research should be directed at engine integration methods whereas distrib-
uted propulsion may offer high synergies since the hybrid internal combustion cy-
cle offers greatest advantages with high bypass ratios. The interaction of non con-
tinuous flow devices with continuous flow technology may yield challenges that
require additional work which will help to develop a better understanding of the
physical design of the engine. This will enable design point and off design point
performance analysis and allow a better assessment of the environmental com-
patibility with respect to other emissions than carbon dioxide.
The hybrid pulse detonation cycle offers better fuel efficiency than the conven-
tional turbofan cycle due to higher peak cycle temperature and a combustion
process based on wave interaction that enables a pressure gain during the combus-
tion of fuel. Depending on the overall configuration, the overall pressure ratio of
the cycle can be increased or alternatively compressor stages are replaced. A de-
crease in overall engine weight can be expected if the pulse detonation is replac-
ing compressor stages; the opposite is true if the pulse detonation engine is ap-
plied to boost the overall pressure ratio. However, in both cases the specific fuel
consumption can be expected to decrease compared to a conventional turbofan
cycle due to higher cycle efficiencies. Under installed conditions, the better per-
formance of the cycle with higher overall pressure ratios allows higher block fuel
savings even though the engine can be expected to be heavier. It is calculated that
19% saving can be achieved if the pulse detonation engine is used to increase the
overall pressure ratio whereas the reduction would be 11% if it was replacing
compressor stages. This assumes that the performance of pulse detonation engines
found in the laboratory can be applied on a larger scale. Compared to the hybrid
internal combustion engine, relatively lower bypass ratios and fan pressure ratios

159
are required to obtain the fuel savings, which would indicate less advanced pro-
pulsor technology would be required. The author could not find any suggestion in
the public domain that a hybrid pulse detonation engine was ever tested. A
manned vehicle directly powered by a pulse detonation engine was successfully
tested recently where thrust is directly generated by the pulse detonation engine.
Compared to the internal combustion cycles, the technology readiness is far below
that of internal combustion cycles. The technical feasibility of the hybrid pulse
detonation engine depends on the ability to combine discontinuous flow with axial
flow turbomachinery and if forecasted performance can be achieved in scaled up
versions.
The least fuel efficient cycles studied in this thesis are the hybrid wave rotor cy-
cles, which have higher specific fuel consumption than conventional turbo fan cy-
cles. The reason is that combustion occurs in a continuous flow combustion cham-
ber equivalent to that of a conventional turbofan cycles. In addition, the compres-
sion and expansion of the air in the wave rotor is less efficient compared to axial
flow turbomachinery. The wave hybrid wave rotor engine would very likely also
suffer from a weight increase compared to a conventional turbofan engine. Infe-
rior performance in combination with an engine weight increase indicates higher
block fuel consumption. An increase of up to 34% was calculated compared to the
conventional turbofan cycle. However, if the compression and expansion effi-
ciency of the wave rotor could be improved, substitution of compressor stages
would possibly yield in a much compacter engine. This would be especially bene-
ficial for smaller engines where less efficient compressors are used and turbine
cooling techniques are limited. As for pulse detonation engines, the wave rotor
engine has only been tested under laboratory conditions or for the purpose of su-
160
percharging piston engines but not in a hybrid turbofan context. However, re-
search is more advanced and the wave rotor found its application in the automo-
tive industry so that risk and investment would be more balanced. More research
directed at improving the compression and expansion efficiency of the wave rotor
cycle will help to understand if the hybrid wave rotor cycle has a potential for an
application in smaller engines.
It should be noted that results presented in this study are best estimates to support
in decision making processes for further research and are subject to uncertainties
due to the nature of this study. However, even if the theoretical cycles outlined in
this thesis cannot be achieved with a physical design, it can be expected that an
engine running on a cycle deviating from the ideal cycle calculated in this thesis
would still be a promising alternative to existing axial flow and continuous com-
bustor technology. The uncertainties arise due to manifold reasons. Firstly, it is
assumed that the actual engine can be built around the cycles and it should also be
noted that the cycle of a particular engine varies over the flight envelope so the
cycles here provide a snapshot of an engine operating during cruise conditions;
secondly, engine weights used to calculate block fuel savings are not derived from
physical designs but first estimates; and thirdly, block fuel calculations do not
take into account aerodynamic aspects or airframe weight differences for the dif-
ferent cycles and only consider the cruise component of a mission with constant
climb.
The hybrid pulse detonation cycle and the hybrid internal combustion cycle theo-
retically offer significant block fuel savings compared to the conventional turbo-
fan cycles if the assumptions made in this study hold or come close to what is ac-
tually achievable. Of these two cycles, the hybrid internal combustion cycle can

161
potentially offer higher fuel savings and is based on technology that has been
tested outside the laboratory and developed and applied extensively in aviation
and other contexts.
---

162
Appendix
A1: NASA TRL Scale
The NASA technology readiness level (TRL) scale is a systematic metric and as-
sessment system to evaluate and compare the maturity of particular technologies.
The scale ranges from one to nine and a brief description of each technology
readiness level is provided below. They comprise an estimate of the investment
costs involved69.
TRL 1: Basic principles observed and reported
This is the lowest “level” of technology maturation and is the level at which scien-
tific research begins to be translated into applied R&D.
Cost to Achieve: Very low “unique” cost (the investment cost is borne by scien-
tific research programs).
TRL 2: Technology concept and/or application formulated
Once basic physical principles are observed, then at the next level of maturation
practical applications are identified. At this level, the application is still specula-
tive and there is no experimental proof.
Cost to Achieve: Very low “unique” cost (the investment cost is borne by scien-
tific research programs).
163
TRL 3: Analytical and experimental critical function and/or characteristic
proof of concept
At this stage, active R&D is initiated to set the technology into an appropriate
context and laboratory based studies are undertaken to physically validate whether
or not the analytical predictions are correct. These studies and experiments consti-
tute “proof of concept” validation of the applications/concepts defined at TRL 2.
Cost to Achieve: Low “unique” cost (technology specific).
TRL 4: Component and/or breadboard validation in a laboratory environ-
ment
Following successful “proof of concept” work (undertaken at TRL 3), basic tech-
nological elements must be integrated to establish that the system will work to-
gether to achieve concept-enabling levels of performance. The validation is rela-
tively “low-fidelity” compared to the eventual system.
Cost to Achieve: Low-to-moderate “unique” cost (technology specific, but proba-
bly several factors greater than the investment required for TRL 3).
TRL 5: Component and/or breadboard validation in a relevant environment
At TRL 5, the fidelity of the component / breadboard being tested has to increase
significantly. The basic technological elements must be integrated with reasonably
164
realistic supporting elements so that the total applications can be tested in a realis-
tic environment.
Cost to Achieve: Moderate “unique” cost (technology specific, but probably sev-
eral factors greater than the investment required for TRL 4).
TRL 6: System/subsystem model or prototype demonstration in a relevant
environment (ground or space)
TRL 6 is a major step from TRL 5. At TRL 6, a representative model or prototype
system, which would go well beyond discrete component level bread-boarding,
would be tested in a relevant environment (ground or space). The demonstration
might represent an actual system application, or it might only be similar to the
planned application, but using the same technologies.
Cost to Achieve: Technology and demonstration specific (a fraction of TRL 7 if
on ground but similar if space is required).
TRL 7: System prototype demonstration in a space environment
TRL 7 is a significant step from TRL 6 and requires an actual system prototype
demonstration in a space environment. The driving purposes for achieving this
level of maturity are to ensure system engineering and development management
confidence (more than that required for R&D purposes). TRL 7 would normally
only be performed in cases where technology and/or subsystem application is mis-
sion critical and relatively high risk.

165
Cost to Achieve: Technology and demonstration specific (a significant fraction of
TRL 8 cost).
TRL 8: Actual system completed and “flight qualified” through test and
demonstration (ground or space)
By definition all technologies being applied in actual systems go through TRL 8.
In almost all cases, this level is the end of true “system development” for most
technology elements.
Cost to Achieve: Mission specific (typically the highest cost for a new technol-
ogy).
TRL 9: Actual system “flight proven” through successful mission operations
By definition all technologies being applied in actual systems go through TRL 9.
In almost all cases, this level is the end of the last “bug fixing” aspects of true
“system development”. TRL 9 does not include planned product improvement of
ongoing or reusable systems. Such technology upgrades would start over at the
appropriate level in the TRL system
Cost to Achieve: Mission specific (less than TRL 8).

166
References
1 Sagan, C., The Dragons of Eden – Speculations on the evolution of human intelligence, Ballen-
tine Books, New York, 1977.
2 Lehman, M., This high man; the life of Robert H. Goddard, New York, Farrar, Straus 1963
3 Gibran, K., The Prophet, Pan Books. April 1991.
4 Needham, R., volume 4, part 1.
5 Freud, S., The Future of an Illusion, chapters 3 and 4, 1927.
6 Becker, E., The Denial of Death, 1973.
7 Davies, P., Other Worlds, May 1997.
8 Dawkins, R., The Selfish Gene, 1976.
9 Feifel, H., The Meaning of Death, chapter 6, 1959.
10 Maslow, The Need to Know, pp. 118-119
11 Greenacre, The Fetisch and the Transitional Object, Psychoanalytical Study of the child, 1969,
24:161-162.
12 “Fear of Flying”, A special report on air travel, The Economist, 16 June 2007.
13 Niedzballa, H. A. and Schmitt, D., Comparison of the specific energy demand of aeroplanes and
other vehicle systems, Aircraft Design 4, 2001, 163-178.
14 Ameyugo G., and Noppel F., From three to zero and beyond: clean propulsion for civil aviation,
Whittle Reactionaries 2007, Institution of Mechanical Engineers, 2007.
15 Whittle, I., The dawn of the jet age, in Whittle 2007, Cranfield University, 2007.

167
16Lee, J. J., Lukachki, S. P., Waitz, I. and Schafer, A., Historical and Future Trends in Aircraft
Performance, Cost, and Emissions. Annu. Rev. Energy Environ. 2001, 26:167-200.
17 Howse, M., 2004, Aero gas turbines – an ever-changing engineering challenge, 3 February 2004
Whittle lecture, Royal Aeronautical Society, 2004.
18 Penner, E. J., Aviation and the global atmosphere, Special Report, Intergovernmental Panel on
Climate Change, November 2001.
19 Zimbrick, R. A. and Colehour, J. L., Investigations of Very High Bypass Ratio Engines for Sub-
sonic Transports, Journal of Propulsion and Power, 1990, vol. 6, no. 4, pp. 490.
20 Hoheisel, H., Aerodynamic Aspects of Engine-Aircraft Integration of Transport Aircraft, Aero-
space Science and Technology, 1997, no 7, 475-487.
21 Torenbeek et al, Innovative configurations and advanced concepts for future civil aircraft,
Greener by design ,Von Karman Institute, June 2005.
22 Air Travel – Greener by Design Annual Report 2007 – 2008, Royal Aeronautical Society, 2008.
23 McMasters, J. H., From Farther, Faster, Higher to Leaner, Meaner, Greener – Future Directions
in Airplane Design in the New Century, AIAA 2003-553, 41st Aerospace Sciences Meeting and
Exhibit, 6-9 January 2003.
24 Solomon, S., Qin, D., Manning, M., Chen, Z., Marquis, M., and Averyt, K. B., Climate Change
2007: The Physical Science Basis. Contribution of Working Group I to the Fourth Assessment
Report of the Intergovernmental Panel on Climate Change, 2007.
25 Singh, R., Civil aerospace propulsion: the challenge of the environment, presented at the 6th
International Defence and Aerospace Exhibition, Aero India, 2007.
26 Schumann, U., Formation, Properties and Climate Effects of Contrails, Comptes Rendus Phy-
sique, Vol. 6, 2005.

168
27 Noppel, F. and Singh, R., “Contrail and Cirrus Cloud Avoidance Technology,” Journal of Air-
craft, Vol. 44, No. 5, 2007, pp. 1721–1726.
28 Cazenave, A. and Llovel, W., Annu. Rev. Mar. Sci. 2010. 2:145–73.
29 Battisti1, D.S. Naylor, R. L., Science, Vol 323, January 2009.
30 Data from http://data.giss.nasa.gov/gistemp/graphs/Fig.A2.txt following the methodology out-
lined by Hansen, J., et al. (2006) "Global temperature change". Proc. Natl. Acad. Sci. 103: 14288-
14293.
31World Energy Outlook 2010, International Energy Agency, November 2010.
32 Marland, G., T.A. Boden, and R. J. Andres, Global, Regional, and National CO2 Emissions.
Carbon Dioxide Information Analysis Center, Oak Ridge National Laboratory, United States De-
partment of Energy, 2007.
33 Statistical Review of World Energy 2010, British Petroleum, 2010.
34 The World Factbook 2009. Washington, DC: Central Intelligence Agency, 2009.
35 http://inflationdata.com/Inflation/images/charts/Oil/Inflation_Adj_Oil_Prices_Chart.htm.
36 Superfreakonomics, Levitt, S. D. and Dubner, S. J., William Morrow, 2009.
37 Seidel, J. A., Sehra, A. K., Colantonio, R. O., NASA Aeropropulsion Research: Looking For-
ward, TM-2001-211087, ISABE, July 2001.
38 J. E., Lister, D. H., Griggs, D. J., Dokken, D. J., McFarland, M.., Aviation and the atmosphere,
Special Report, IPCC, 1999.
39 International Standard Atmosphere in Thermodynamic and Transport Properties of Fluids, SI
Units, 5th Edition, Gogers & Mayhew.
40 Turbofan data, Department of Power and Propulsion, Cranfield University, 2005.

169
41 Fletcher, R. and M.J.D. Powell, A Rapidly Convergent Descent Method for Minimization,
Computer Journal, Vol. 6, pp. 163-168, 1963.
42 Goldfarb, D., A Family of Variable Metric Updates Derived by Variational Means, Mathematics
of Computing, Vol. 24, pp. 23-26, 1970.
43 Han, S.P., A Globally Convergent Method for Nonlinear Programming, Vol. 22, Journal of Op-
timization Theory and Applications, p. 297, 1977.
44 Powell, M.J.D., A Fast Algorithm for Nonlinearly Constrained Optimization Calculations, Nu-
merical Analysis, ed. G.A. Watson, Lecture Notes in Mathematics, Springer Verlag, Vol. 630,
1978.
45 Powell, M.J.D., The Convergence of Variable Metric Methods For Nonlinearly Constrained
Optimization Calculations, Nonlinear Programming 3, Academic Press, 1978.
46 Gill, P.E., W. Murray, and M.H. Wright, Practical Optimization, London, Academic Press,
1981.
47 Ameyugo, G. and Singh, R., Advanced Cycles for Distributed Propulsion”. ISABE-2007-1154,
Proceedings 18th International Symposium on Airbreathing Machines, Beijing, 2007.
48 P. Akbari, R. Nalim, N. Mueller. Performance Enhancement of Microturbine Engines Topped
with Wave Rotors. Journal of Engineering for Gas Turbines and Power. 128. Jan 2006.
49 Foa, J. V., Elements of Fight Propulsion. John Whiley & Sons, Inc, New York and London,
1960.
50 Welch, G. E. and Jones, S. M. and Paxson, D. E. Wave Rotor-Enhanced Gas Turbine Engine.
NASA Technical Memorandum 106998, AIAA-95-2799, 1995.
51 Wilson, J. and Paxson, D. E., Jet Engine Performance Enhancement Through Use of a Wave
Rotor Topping Cycle, NASA Technical Memorandum 4486, 1993.

170
52 Marthur, A., A Brief Review on the GE Wave Engine Program (1958-1963). Proc. Of the 1985
ONR/NAVAIR Wave Rotor Research and Technology Workshop, Report NPS-67-85-008, Naval
Postgraduate School, Monterey, CA, May, 1985.
53 Dempsey, E., Akbari, P., Muller, N., Nalim, R., Optimum Application of Four-Port Wave Ro-
tors for Gas Turbine Enhancement, ISABE 2005-1214, Proceedings Symposium for Air Breathing
Engines, 2005.
54 Sehra, A. K. and Whitlow, W., Propulsion and power for 21st century aviation, Progress in
Aerospace Sciences 40, 199-235, 2004.
55 Maclin, H. et al, Fifty years down, fifty years to go, AIAA 2003-2788, Proceedings International
Air and Space Symposium and Exposition, 14-17 July 2003.
56 E. Wintenberger and J.E. Shepherd, “Detonation Waves and Pulse Detonation Engines” Presen-
tation Ae103, January 27, 2004.
57 Akbari, P. and Nalim, R., Analysis of Flow Processes in Detonative Wave Rotors and Pulse
Detonation Engines, AIAA 2006-1236, January 2006.
58 J. Goldmeer, V. Tangirala, A. Dean., “System-Level Performance Estimation of a Pulse Detona-
tion Based Hybrid Engine”, Journal of Engineering for Gas Turbines and Power, January 2008.
59 Paxson, D. E, “Performance Evaluation Method For Ideal Air-breathing Pulse Detonation En-
gines,” Journal of Propulsion and Power, 20 (5), October 2004.
60 Brown, R., Popular Science Monthly, Vol 123, No 1, July 1933
61 J. Whurr, Otto Cycle Core Turbofan Concepts, MSc Thesis, Cranfield University, UK, 1995
62 R. C. Taussig, “Wave Rotor Turbofan Engines for Aircraft,” ed. Sladky, J. F., Jr., Machinery for
Direct Fluid-Fluid Energy Exchange, The American Society of Mechanical Engineers, 1984.
63 Jane's Fighting Aircraft of World War II. London. Studio Editions Ltd, 1998.
171
64 Lumsden, A., British Piston Aero Engines and Their Aircraft, The Crowood Press Ltd, First
Edition.
65 Trent 1000, Rolls-Royce, VCOM13797, Issue 4, August 2008.
66 Boeing 787 Airport Compatibility Brochure, Boeing, December 2009.
67 Norris, G., Pulse Power: Pulse Detonation Engine-powered Flight Demonstration Marks Mile-
stone in Mojave, Aviation Week & Space Technology, Vol. 168, No. 7, 2008, pp. 60.
68 The Economist, March 12 – 18, p89:90, April 2011.
69 John C. Mankins, “Technology Readiness Levels”, A. White Paper, April 6, 1995. URL:
http://www.hq.nasa.gov/office/codeq/trl/trl.pdf.