cracking behavior of steel fiber-reinforced concrete...
TRANSCRIPT
ACI Structural Journal/May-June 2013 481
Title no. 110-S38
ACI STRUCTURAL JOURNAL TECHNICAL PAPER
ACI Structural Journal, V. 110, No. 3, May-June 2013.MS No. S-2011-199.R1 received July 29, 2011, and reviewed under Institute
publication policies. Copyright © 2013, American Concrete Institute. All rights reserved, including the making of copies unless permission is obtained from the copyright proprietors. Pertinent discussion including author’s closure, if any, will be published in the March-April 2014 ACI Structural Journal if the discussion is received by November 1, 2013.
Cracking Behavior of Steel Fiber-Reinforced Concrete Members Containing Conventional Reinforcementby Jordon R. Deluce and Frank J. Vecchio
Uniaxial tension tests were conducted on 12 plain reinforced concrete (RC) and 48 large-scale steel fiber-reinforced concrete (SFRC) specimens, each containing conventional longitudinal reinforcement, to study their cracking and tension-stiffening behavior. The test parameters included fiber volumetric content, fiber length and aspect ratio, conventional reinforcement ratio, and steel reinforcing bar diameter. “Dog-bone” tension tests and bending tests were also performed to quantify the tensile proper-ties of the concrete. It was found that the cracking behavior of SFRC was significantly altered by the presence of conventional reinforcement. Crack spacings and crack widths were influenced by the reinforcement ratio and bar diameter of the conventional reinforcing bar, as well as by the volume fraction and aspect ratio of the steel fiber. Details and results of the experimental investiga-tion are provided and discussed.
Keywords: crack spacing; crack spacing formulation; crack width; steel fiber; stiffness; strength; tension; tension stiffening; test.
INTRODUCTIONThe concept of using discrete fibers to improve the perfor-
mance of brittle materials has existed since ancient times, with evidence showing that the ancient Egyptians used straw to improve the cracking behavior of sun-dried mud bricks used in construction (Mansour et al. 2007). Today, the use of steel fibers is becoming increasingly common in the construction industry, with fibers gaining recognition as a reinforcement that can be mixed directly into concrete to improve the tensile behavior and cracking characteristics of this brittle material. In addition, studies have shown that conventional shrinkage and temperature reinforcement can be reduced—and in many cases, eliminated—with the addition of fibers to concrete. While the addition of fibers does not appear to reduce the inherent shrinkage characteristics of the concrete, in sufficient volumes, the fibers can give the material improved cracking characteristics (Susetyo 2009). Fibers can also significantly improve the structural behavior of a member, enhancing post-cracking tensile behavior characteristics and crack control. For example, studies have shown that steel fibers can be used to significantly reduce the amount of transverse shear reinforcement in beams while maintaining the required shear resistance (Casanova et al. 1997).
Several parameters affect the tensile behavior of steel fiber-reinforced concrete (SFRC); primary factors include the volumetric fiber content, fiber geometry, fiber tensile strength, and strength of the concrete matrix. Increasing the fiber content directly increases the number of indi-vidual fibers present in the concrete matrix; an increase in fiber content from 0.5 to 1.0% has been found to increase the direct tensile strength from 1.1 to 1.3 times that of plain concrete and the toughness from 1.8 to 2.7 times that of plain concrete (Shah and Rangan 1971). Using fibers with a high aspect ratio allows for a more efficient use of the material
because each individual fiber can attain larger stresses and thus resist higher loads. However, it must be ensured that the ultimate strength of the fibers is sufficient to avoid rupture. Also, while an increase in the aspect ratio of the fibers does not enhance the cracking strength of concrete, it does improve the post-cracking tensile strength and toughness of the composite material (Shah and Rangan 1971).
The addition of steel fibers has a significant effect on the tensile stress-strain behavior of concrete. In typical dosages, the material exhibits strain-softening behavior, albeit with significantly greater toughness and energy absorp-tion capacity than a plain concrete of the same strength. In addition, the ability of fibers to aid in the transmission of loads across cracks leads to smaller crack widths than with plain concrete; if conventional steel reinforcing bars are present, multiple cracking can occur with crack spac-ings significantly less than with conventional reinforced concrete (RC). Conversely, if the fiber content of an SFRC is sufficiently high, strain-hardening behavior can develop, in which multiple closely spaced cracks will form in the composite with or without the presence of conventional steel reinforcing bars. This results in post-cracking stresses equal to or larger than the cracking stress and greatly enhanced ductility (Chao et al. 2009).
Much research has been performed to investigate the cracking characteristics of SFRC, but only a limited number of specimens containing both steel fibers and conventional steel reinforcing bars (collectively referred to as R/SFRC) have been tested. Abrishami and Mitchell (1997) tested two R/SFRC specimens containing 1.0% of 30 mm (1.18 in.) hooked-end steel fibers by volume. Noghabai (2000) tested three R/SFRC specimens containing 1.0% of 30 mm (1.18 in.) hooked-end steel fibers or 6 mm (0.24 in.) steel microfibers by volume. Bischoff (2003) tested four R/SFRC specimens containing 0.78% of 50 mm (1.97 in.) hooked-end steel fibers by volume, and these were subjected to both monotonic and cyclic loading. While the data generated by these investigations are valuable, the parameters investigated were of limited range.
The research program presented herein sets out to test a comprehensive number of R/SFRC specimens with substan-tially varied parameters to expand the database of test results for this material. The subsequent objective is to study and better quantify the material’s post-cracking characteristics,

482 ACI Structural Journal/May-June 2013
ACI member Jordon R. Deluce is currently employed at Morrison Hershfield Ltd. in Vancouver, BC, Canada. He received his MASc from the Department of Civil Engi-neering at the University of Toronto, Toronto, ON, Canada, in 2011. His research interests include nonlinear analysis and performance assessment of reinforced concrete structures, shear effects in reinforced concrete, and the tensile behavior and cracking characteristics of steel fiber-reinforced concrete.
Frank J. Vecchio, FACI, is a Professor of civil engineering at the University of Toronto. He is a member of Joint ACI-ASCE Committees 441, Reinforced Concrete Columns, and 447, Finite Element Analysis of Concrete Structures. He received the ACI Structural Research Award in 1998, the ACI Structural Engineering Award in 1999, and the Wason Medal for Most Meritorious Paper in 2011. His research inter-ests include advanced constitutive modeling, assessment and rehabilitation of concrete structures, and response under extreme load conditions.
particularly in regard to crack widths and crack spacings, leading to improved design formulations.
RESEARCH SIGNIFICANCEThis paper describes an experimental program in which RC
and R/SFRC specimens were tested under uniaxial tension. The effect of various parameters were investigated, including
fiber content, length, aspect ratio, reinforcing bar diameter, and reinforcement ratio. Although tests like these have been performed previously to a limited extent, none have been as comprehensive in terms of the number of specimens tested or the parameters considered. The results of this investigation can be used to develop improved formulations for crack spac-ings, crack widths, and tension-stiffening behavior of SFRC.
EXPERIMENTAL INVESTIGATIONThis experimental program was designed so that a compre-
hensive database of uniaxial tension tests of RC and R/SFRC could be generated. Special consideration was given to cracking and tension-stiffening behavior. The parameters of the study included fiber content Vf, fiber length lf, fiber aspect ratio lf/df, conventional reinforcement ratio rs, and reinforcing bar diameter db. A total of 12 uniaxial tension RC and 48 uniaxial tension R/SFRC specimens were tested in this program in addition to numerous material tests to quantify the behavior of the concretes used in the different test series. Complete details of the experimental program and the full experimental results are provided by Deluce (2011).
Uniaxial tension RC and R/SFRC test specimen configurations
A total of six test series were cast and tested: one nonfi-brous control series (PC) and five series containing steel fibers (refer to Table 1). Three types of hooked-end steel fibers were used in this experimental program in varied volumetric contents. For Series FRC1, FRC2, and FRC3, fibers 30 mm (1.18 in.) long and 0.38 mm (0.015 in.) in diam-eter were added to the concrete for volumetric contents of 0.5%, 1.0%, and 1.5%, respectively; the fibers had a manu-facturer-specified rupture strength of 2300 MPa (334 ksi). Test Series FRC4 contained 1.5% steel fibers by volume, in which the fibers were 30 mm (1.18 in.) long and 0.55 mm (0.022 in.) in diameter with a specified tensile strength of 1100 MPa (160 ksi). Test Series FRC5 also contained 1.5% steel fibers by volume, with fibers 50 mm (1.97 in.) long and 1.05 mm (0.041 in.) in diameter and with a speci-fied tensile strength of 1000 MPa (145 ksi).
Each RC and R/SFRC test specimen consisted of a concrete prism, square in cross section and 1000 mm (39.4 in.) in length, cast around a single deformed steel reinforcing bar that was 1500 mm (59.1 in.) in length, such that 250 mm (9.84 in.) of the bar protruded from each end of the concrete section for gripping in the testing rig (refer to Fig. 1). The square concrete cross sections varied from 50 x 50 mm (1.97 x 1.97 in.) to 200 x 200 mm (7.87 x 7.87 in.), while the deformed steel reinforcing bar sizes varied from 10M to 30M (Canadian bar sizes). The properties of the reinforcing bars used in this experimental program are reported in Table 2, and the geometric configurations of the specimens are noted in Table 3. The combinations of concrete cross sections and reinforcing bar sizes used generated reinforcement ratios ranging from 1.33 to 4.00%, which simulate a range of struc-tural configurations found in practice. Although it is common to have reinforcement ratios less than 1.33% in practice, it was not practical to do so in this test program because the transfer of loads across cracks by fibers would make it diffi-cult to yield the reinforcing bar within the concrete section before it ruptured outside of the concrete section.
It must also be noted that each RC and R/SFRC test spec-imen configuration was repeated in a duplicate specimen (the two specimens for each configuration were differenti-
Table 1—Fiber parameters of concretes used
Concrete type Vf, % lf, mm df, mm lf /df sfu, MPa
PC 0.0 — — — —
FRC1 0.5 30 0.38 79 2300
FRC2 1.0 30 0.38 79 2300
FRC3 1.5 30 0.38 79 2300
FRC4 1.5 30 0.55 55 1100
FRC5 1.5 50 1.05 48 1000
Notes: 1 mm = 0.0394 in.; 1 MPa = 145 psi.
Fig. 1—Conventionally reinforced direct tension specimen: (a) instrumentation and dimensions; and (b) test setup.

ACI Structural Journal/May-June 2013 483
ated as S1 and S2). Because tension tests are prone to scatter in their results, the duplicate specimens were meant to be a measure of the degree of variation between test results.
Material testsA number of material tests were conducted to quantify the
material behavior of the concretes used in the RC and R/SFRC direct tension tests. Standard tests on 150 x 300 mm (6.0 x 12.0 in.) concrete cylinders were conducted to obtain a measure of the compressive strength of the material. These values were also used as a measure from which other material properties, such as the modulus of elasticity, could be esti-mated. In addition to cylinder tests, free shrinkage prism tests were conducted to estimate the restrained shrinkage within the RC and R/SFRC specimens. In the direct tension RC and R/SFRC specimens, restrained shrinkage effects were significant because both the free shrinkage strains and reinforcement ratios were quite high. From the free shrinkage strains, the shrinkage-induced offset strain could be calcu-lated, which was necessary for the conversion of observed specimen elongations to net concrete strains. The shrinkage-induced offset strain was the total strain of a convention-ally reinforced RC or R/SFRC specimen immediately prior to testing, which took into account the shrinkage of the concrete as well as the restraining action of the reinforcing bar. Given the conventional reinforcement ratio and free shrinkage strain of concrete, this offset strain was calcu-lated using the principles of equilibrium (Deluce 2011). The cylinder compressive strengths and free shrinkage strains can be found in Table 3.
Because the primary focus of this experimental investiga-tion was the tension response of the RC and R/SFRC speci-mens, it was advantageous to perform additional material tests related to measures of the direct and flexural tensile strengths of the concretes used. The flexural tensile strength tests were performed on beams 150 x 150 mm (6.0 x 6.0 in.) in cross section and 533 mm (21.0 in.) in length. The span length was 450 mm (18.0 in.). Two types of bending tests were performed. The first consisted of a four-point loading configuration, with the points spaced at 150 mm (6.0 in.). The second consisted of a three-point loading system with a 25 mm (1.0 in.) deep notch cut at midspan. The notch was instrumented with a linear variable differential transformer (LVDT) on each side of the beam to obtain plots of stress versus crack mouth opening displacement; summary plots are provided by Deluce (2011). The modulus of rupture values for these beam tests are reported in Table 4 for values at initial cracking and at peak load. It should be noted that the peak tensile stresses observed in the PC specimens were larger than some of those observed in the FRC specimens. This was because the plain concrete mixture had inherently higher compressive and tensile strength than the SFRC mixtures used in the study. Although the addition of steel
Table 2—Properties of steel reinforcing bars
Reinforcing bar As, mm2 db, mm Es, GPa fy, MPa Esh, GPa esh, × 10–3 fult, MPa eult, × 10–3
10M 100 11.3 199 442 3.78 27.0 564 164.0
20M-1* 300 19.5 194 456 3.63 21.2 592 144.2
20M-2* 300 19.5 188 525 3.93 17.3 653 111.6
30M 700 29.9 187 376 3.97 11.0 558 177.0*20M bars came from two different production heats. Notes: 1 mm = 0.0394 in.; 1 MPa = 145 psi; 1 mm2 = 0.00155 in.2; 1 GPa = 145 ksi.
Table 3—Geometric properties, compressive strength, and free shrinkage strain of specimens
Specimen nameb,
mmReinforcing
bar type rs, % fc′, MPaec,shr, × 10–3
PC-50/10-S1,S2 50 10M 4.00 91.8 –0.31
PC-80/10-S1,S2 80 10M 1.56 91.7 –0.31
PC-100/20-S1,S2 100 20M-1 3.00 92.2 –0.31
PC-150/20-S1,S2 150 20M-1 1.33 92.6 –0.38
PC-150/30-S1,S2 150 30M 3.11 91.9 –0.31
PC-200/30-S1,S2 200 30M 1.7595.0S1 95.6S2 NA
FRC1-50/10-S1,S2 50 10M 4.0087.2S1 93.3S2 –0.55
FRC1-80/10-S1,S2 80 10M 1.56 79.2 –0.60
FRC1-100/20-S1,S2 100 20M-1 3.00 91.4 –0.54
FRC1-150/20-S1,S2 150 20M-1 1.33 81.8 –0.60
FRC1-150/30-S1,S2 150 30M 3.11 55.8 NA
FRC1-200/30-S1,S2 200 30M 1.7562.1S1 69.4S2
–0.55S1 –0.49S2
FRC2-50/10-S1,S2 50 10M 4.00 57.8 NA
FRC2-80/10-S1,S2 80 10M 1.56 57.5 NA
FRC2-100/20-S1,S2 100 20M-1 3.00 58.1 NA
FRC2-150/20-S1,S2 150 20M-1 1.33 45.2 –0.83
FRC2-150/30-S1,S2 150 30M 3.11 55.0 –0.76
FRC2-200/30-S1,S2 200 30M 1.7559.4S1 63.4S2
NAS1 –0.63S2
FRC3-50/10-S1,S2 50 10M 4.0052.0S1 52.6S2 –0.83
FRC3-80/10-S1,S2 80 10M 1.5652.6S1 53.2S2 –0.83
FRC3-100/20-S1,S2 10020M-1S1 20M-2S2 3.00 62.0 –0.78
FRC3-150/20-S1,S2 150 20M-1 1.33 62.0 –0.78
FRC3-150/30-S1,S2 150 30M 3.11 46.0 –0.81
FRC3-200/30-S1,S2 200 30M 1.75 63.1 –0.77
FRC4-150/20-S1,S2 150 20M-2 1.33 52.8 –0.71
FRC4-150/30-S1,S2 150 30M 3.11 32.5 –0.77
FRC4-200/30-S1,S2 200 30M 1.75 46.5 –0.72
FRC5-150/20-S1,S2 150 20M-1 1.33 78.8 –0.42
FRC5-150/30-S1 150 30M 3.11 77.0 –0.49
FRC5-200/30-S1,S2 200 30M 1.75 70.3 –0.40S1: Value refers to Specimen S1. S2: Value refers to Specimen S2. Notes: 1 mm = 0.0394 in.; 1 MPa = 145 psi; NA is not available.

484 ACI Structural Journal/May-June 2013
fibers improved the ductility of the material, only when they were introduced to the mixture in sufficient quantity to allow strain hardening to occur did the tensile strengths become larger than those observed for plain concrete.
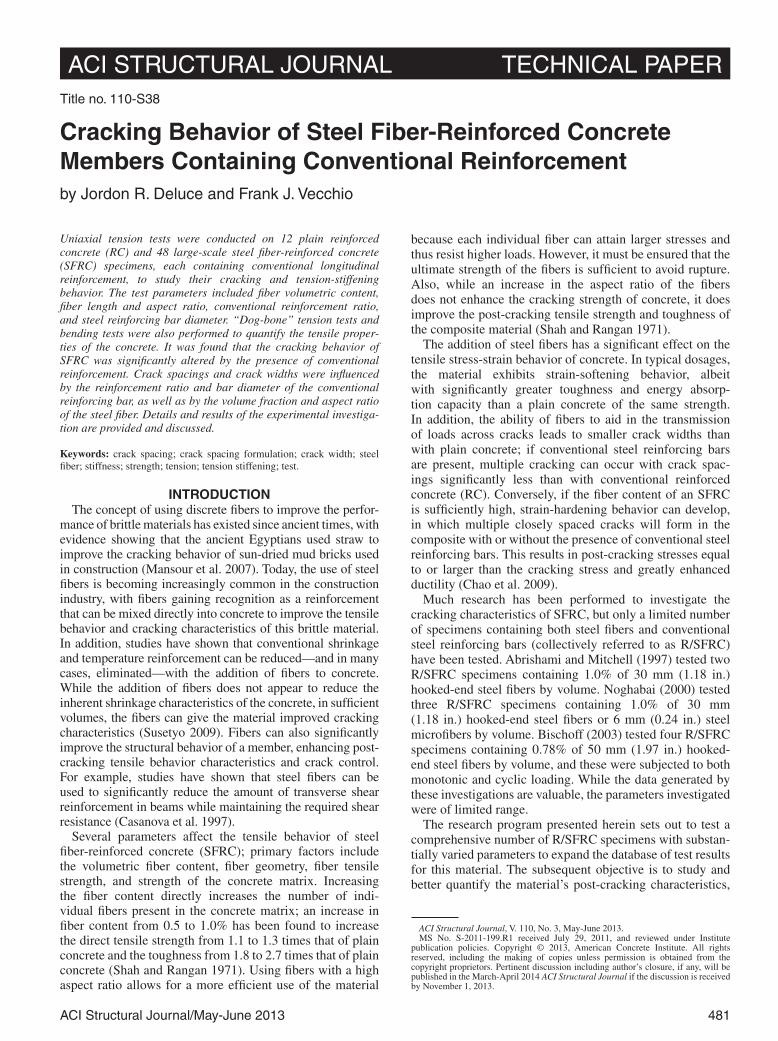
In addition to the indirect flexural tensile strength tests, uniaxial tension “dog-bone” tests were also performed. These test specimens contained no conventional steel reinforcement and were 500 mm (19.7 in.) in total length with a reduced cross section of 100 x 70 mm (3.94 x 2.76 in.) over a length of 200 mm (7.87 in.). Each “dog-bone” spec-imen was instrumented with four LVDTs to obtain a load-elongation plot of the response. A 245 kN (55 kip) MTS universal testing machine was used, and the specimens were fixed to the testing machine using rotating joints to mini-mize bending moments. “Dog-bone” specimens were cast for each type of SFRC. The test setup is shown in Fig. 2.
Table 4 reports the values of stress and strain at cracking, the peak values of stress and strain (if greater than those at cracking), and the initial modulus of elasticity of the speci-mens. It can be seen from Table 4 that the mechanical prop-erties of several specimens were identical; this was because concrete from a single batch would be used to fabricate multiple specimens.
Uniaxial tension RC and R/SFRC test setup and instrumentation
Each RC and R/SFRC test specimen was instrumented with four LVDTs. One LVDT was located on each side of the specimen so that differences in the readings of the various LVDTs allowed for the determination of unintended flexural effects. A gauge length of 950 mm (37.4 in.) was used for the LVDTs.
Table 4—Concrete tensile properties of specimens
Specimen name
Bending tests “Dog-bone” tests
fr,crack, MPa fr,peak, MPa ft′, MPa et′, × 10–3 ftu, MPa etu, × 10–3 Ect, GPa
PC-50/10-S1,S2 5.90 — NA NA NA NA NA
PC-80/10-S1,S2 5.90 — NA NA NA NA NA
PC-100/20-S1,S2 6.83 — NA NA NA NA NA
PC-150/20-S1,S2 6.83 — NA NA NA NA NA
PC-150/30-S1,S2 5.90 — NA NA NA NA NA
PC-200/30-S1,S2 7.24S1; 6.77S2 —S1; —S2 NA NA NA NA NA
FRC1-50/10-S1,S2 5.12 5.76 NA NA NA NA NA
FRC1-80/10-S1,S2 4.28 5.48 3.62 0.141 — — 42.5
FRC1-100/20-S1,S2 NA NA 3.28 0.137 — — 33.9
FRC1-150/20-S1,S2 6.00 9.60 NA NA NA NA NA
FRC1-150/30-S1,S2 NA NA 3.85 0.121 — — 41.4
FRC1-200/30-S1,S2 4.28S1; 5.12S2 5.48S1; 5.76S2 3.62S1; NAS2 0.141S1; NAS2 —S1; NAS2 —S1; NAS2 42.5S1; NAS2
FRC2-50/10-S1,S2 5.63 10.43 3.41 0.185 3.66 0.583 26.5
FRC2-80/10-S1,S2 5.63 10.43 3.41 0.185 3.66 0.583 26.5
FRC2-100/20-S1,S2 5.63 10.43 3.41 0.185 3.66 0.583 26.5
FRC2-150/20-S1,S2 5.64 7.22 NA NA NA NA NA
FRC2-150/30-S1,S2 NA NA 3.26 0.142 3.29 0.673 34.2
FRC2-200/30-S1,S2 5.63S1; 5.48S2 10.43S1; 7.18S2 3.41S1; 3.56S2 0.185S1; 0.201S2 3.66S1; —S2 0.583S1; —S2 26.5S1; 27.5S2
FRC3-50/10-S1,S2 6.54 8.30 3.12 0.127 3.14 0.591 33.0
FRC3-80/10-S1,S2 6.54 8.30 3.12 0.127 3.14 0.591 33.0
FRC3-100/20-S1,S2 5.64 7.28 3.40 0.242 4.35 3.621 26.7
FRC3-150/20-S1,S2 5.64 7.28 3.40 0.242 4.35 3.621 26.7
FRC3-150/30-S1,S2 6.54 8.30 3.12 0.127 3.14 0.591 33.0
FRC3-200/30-S1,S2 5.94 7.72 NA NA NA NA NA
FRC4-150/20-S1,S2 4.93 5.46 2.90 0.244 — — 22.1
FRC4-150/30-S1,S2 4.25 4.74 2.58 0.210 2.64 0.493 20.1
FRC4-200/30-S1,S2 5.01 7.10 3.16 0.204 3.24 0.266 23.3
FRC5-150/20-S1,S2 6.25 8.69 3.15 0.148 — — 29.6
FRC5-150/30-S1 4.61 6.09 3.06 0.129 — — 35.3
FRC5-200/30-S1,S2 NA NA 3.37 0.123 — — 45.8
S1: Value refers to Specimen S1. S2: Value refers to Specimen S2. Notes: 1 MPa = 145 psi; 1 GPa = 145 ksi; NA is not available.
ACI Structural Journal/May-June 2013 485
For testing, the specimens were loaded vertically into a 1000 kN (225 kip) capacity MTS universal testing machine, and the protruding steel reinforcing bar from both ends of the specimens were gripped. The specimens were loaded in tension at a rate of 0.0015 mm/s (59 × 10–6 in./s) up to the observance of the first crack, after which the loading rate was increased to 0.0025 mm/s (98 × 10–6 in./s). The loading rate was gradually increased to 0.004 mm/s (157 × 10–6 in./s) prior to the yielding of the reinforcing bar. After the onset of reinforcing bar yielding, the loading rate was increased to 0.040 mm/s (1.57 × 10⁻³ in./s). The load was transmitted using flat grips for the 10M and 20M reinforcing bars and with V-grips for the 30M bars.
In a typical test, loading was paused at periodic load stages to mark crack locations, measure crack widths with a crack width comparator, and take photographs. The first load stage occurred at the observance of the first crack, while the second and third stages occurred prior to reinforcing bar yielding. The fourth stage was taken at the onset of reinforcing bar yielding within the concrete region of the specimen, while the fifth and sixth stages were taken at points farther into the region of plastic behavior. Occasion-ally, specimens were precracked due to shrinkage; if this was the case, the shrinkage cracks were measured and marked as an additional load stage at the start of the test.
TEST RESULTSTypical specimen behavior
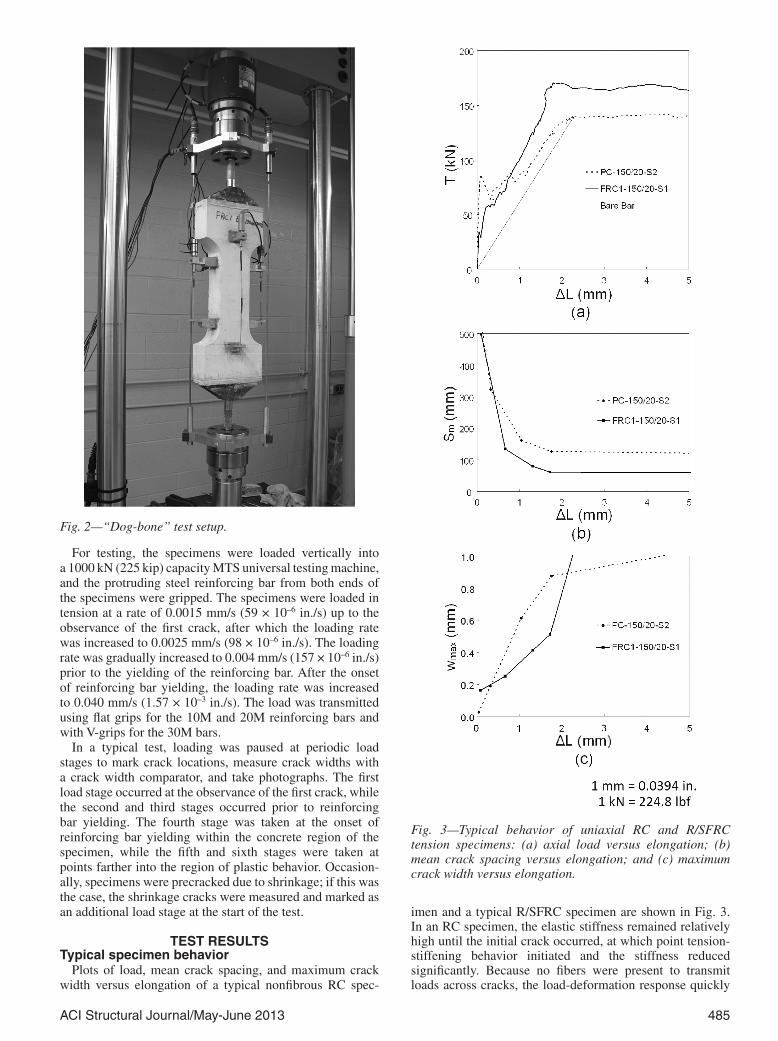
Plots of load, mean crack spacing, and maximum crack width versus elongation of a typical nonfibrous RC spec-
Fig. 2—“Dog-bone” test setup.
Fig. 3—Typical behavior of uniaxial RC and R/SFRC tension specimens: (a) axial load versus elongation; (b) mean crack spacing versus elongation; and (c) maximum crack width versus elongation.
imen and a typical R/SFRC specimen are shown in Fig. 3. In an RC specimen, the elastic stiffness remained relatively high until the initial crack occurred, at which point tension-stiffening behavior initiated and the stiffness reduced significantly. Because no fibers were present to transmit loads across cracks, the load-deformation response quickly

486 ACI Structural Journal/May-June 2013
approached that of the bare bar and the maximum load was limited by the yield strength of the bare steel reinforcing bar (refer to Fig. 3(a)). Numerous transverse tensile cracks developed over the course of the tension-stiffening behavior regime as the mean crack spacing gradually decreased (refer to Fig. 3(b)). However, once the steel reinforcing bar began to yield, the strains tended to concentrate at one or two domi-nant cracks, causing the widths of these dominant cracks to increase rapidly (refer to Fig. 3(c)).
In a typical R/SFRC specimen, the uncracked response was similar to that of a nonfibrous specimen. However, it must be noted that the SFRC used in this experimental program experienced particularly large shrinkage strains because of the large quantity of chemical admixtures and supplementary cementitious materials used in the mixture. This caused the apparent cracking load to decrease relative to that of a nonfi-brous concrete specimen. In addition, the shrinkage strains caused the apparent elongations relating to the onset of
cracking and the onset of plastic behavior to decrease, shifting the load-elongation curve to the left (refer to Fig. 3(a)). Note that these initial shrinkage effects are accounted for in the following sections of this paper by including the shrinkage-induced offset strain, calculated from the shrinkage strains measured in the free-shrinkage prisms.
The tension-stiffening behavior of the R/SFRC specimens was more pronounced than that of the RC specimens; thus, the post-cracking reduction in load-carrying capacity was significantly more gradual for R/SFRC than in the RC speci-mens. In addition, the presence of steel fibers allowed the ultimate load of the specimen to not be limited by the yield strength of the reinforcing bar, and forces larger than that that would cause reinforcing bar yielding were routinely seen. In fact, for some specimens with small reinforcement ratios, the reinforcing bar extending from the concrete section at the ends of the specimen would rupture prior to the yielding of the reinforcing bar within the concrete section because the additional load-carrying capacity provided by the fibers was greater than the difference between the yield load and rupture load of the reinforcing bar. However, for the vast majority of specimens in which yielding occurred within the concrete section, the specimen deformations tended to concentrate at one or two cracks post-yield.
Transverse cracks developed through the tension-stiff-ening phase of behavior. The transverse cracks in the R/SFRC specimens were significantly more numerous and closely spaced than those of the RC specimens because of the ability of SFRC to transmit loads across cracks (refer to Fig. 3(b)). In the service range of specimen behavior, the maximum crack widths exhibited by the R/SFRC specimens were significantly lower than those for nonfibrous concrete (refer to Fig. 3(c)). However, the post-yield localization of deformations at cracks was more pronounced in the R/SFRC specimens than in those not containing fibers. This is because once crack widths progressed beyond a certain threshold, fibers began to pull out, and the ability of the fibers to bridge the cracks began to decrease. This essentially caused the weakest section of the specimen to become even weaker, ensuring further local yielding of the reinforcing bar at this crack location. However, once the strain in the reinforcing bar progressed to the strain-hardening regime, the increased load-carrying capacity of the bar overcame the loss of the fibers in some instances and increased the resis-tance of the section at the first dominant crack to the point that localization began to occur at a second dominant crack. Some splitting cracks were detected in both the R/SFRC and RC specimens; however, these were determined to have little effect on the tensile behavior of the specimens.
Observed trends in behaviorAs the geometric and material parameters were varied
with different specimens, the effect of these parameters on the cracking behavior could be investigated. Table 5 presents the mean crack spacings at the onset of stabilized cracking and the maximum crack widths just prior to the yielding of the reinforcing bar for each RC and R/SFRC specimen. Figure 4 shows the effect of varying reinforcement ratio and reinforcing bar diameter on the mean crack spacing and maximum crack width of the nonfibrous PC specimens. It can be seen from Fig. 4(a) and (b) that as the conventional reinforcement ratio increased, the mean crack spacing and maximum crack width decreased at a given net concrete strain. This occurred because an RC member with a large
Table 5—Test results: cracking behavior
Specimen
Sm, mm wmax, mm
S1 S2 S1 S2
PC-50/10 50 48 0.163 0.175
PC-80/10 98 97 0.488 0.313
PC-100/20 100 102 0.475 0.425
PC-150/20 134 126 0.575 0.613
PC-150/30 121 144 0.438 0.450
PC-200/30 155 146 0.563 0.600
FRC1-50/10 42 37 0.188 0.175
FRC1-80/10 46 47 0.225 0.188
FRC1-100/20 55 51 0.238 0.263
FRC1-150/20 61 59 0.513 0.238
FRC1-150/30 65 67 0.500 0.400
FRC1-200/30 79 69 0.538 0.675
FRC2-50/10 41 37 0.425 0.275
FRC2-80/10 45 44 0.300 0.238
FRC2-100/20 31 36 0.363 0.288
FRC2-150/20 70 53 0.325 0.188
FRC2-150/30 53 44 0.388 0.163
FRC2-200/30 55 61 0.200 0.575
FRC3-50/10 38 34 0.325 0.188
FRC3-80/10 40 39 0.200 0.238
FRC3-100/20 46 37 0.588 0.550
FRC3-150/20 64 49 0.613 0.538
FRC3-150/30 59 52 0.363 0.188
FRC3-200/30 49 66 0.438 0.313
FRC4-150/20 88 75 0.388 0.325
FRC4-150/30 62 59 0.388 0.225
FRC4-200/30 89 87 0.200 0.338
FRC5-150/20 76 61 0.363 0.525
FRC5-150/30 68 NA 0.250 NA
FRC5-200/30 85 75 0.488 0.363
Notes: 1 mm = 0.0394 in.; NA is not available.

ACI Structural Journal/May-June 2013 487
Fig. 4—Effect of reinforcing ratio and reinforcing bar diameter on mean crack spacing and maximum crack width for PC specimens (Vf = 0.0%): (a) effect of reinforcement ratio on mean crack spacing; (b) effect of reinforcement ratio on maximum crack width; (c) effect of reinforcing bar diameter on mean crack spacing; and (d) effect of reinforcing bar diameter on maximum crack width.
amount of reinforcing steel generates less stress in its reinforcing bars when it transfers the concrete load across cracks. A lower stress in the reinforcing bar at a crack loca-tion translates to a shorter development length and thus shorter crack spacings, as well as a lower strain at the crack and thus smaller crack widths.
Figures 4(c) and (d) demonstrate the effect of changing the reinforcing bar diameter on the mean crack spacing and maximum crack width. The specimen configurations in these figures were chosen because while the reinforcing bar size varied, the reinforcement ratio remained rela-tively uniform. It can be seen that the mean crack spacing and maximum crack width increased as the reinforcing bar diameter increased. This occurred because as the bar size increases for a given reinforcement ratio, the ratio of cross-sectional bar perimeter to bar area decreases. Because the development length is a function of the cross-sectional bar perimeter, if the reinforcement ratio remains unchanged, larger bars require a longer development length to develop the localized stress in the reinforcing bar at a crack location. This translates into the larger crack spacings and widths seen in Fig. 4(c) and (d).
Figure 5 demonstrates the effect of reinforcement ratio and reinforcing bar diameter on the mean crack spacings and maximum crack widths of the FRC1 specimens containing
0.5% steel fibers, which were 30 mm (1.18 in.) long and 0.38 mm (0.015 in.) in diameter. The same trends observed in Fig. 4 for RC specimens were again evident in the SFRC specimens: as the reinforcement ratio increased, the mean crack spacings and maximum crack widths decreased; and while the bar diameter increased for a given reinforcement ratio, the mean crack spacings and maximum crack widths increased as well. The same mechanisms that caused this behavior in the nonfibrous PC specimens also influenced the behavior of the R/SFRC specimens.
Figure 6 demonstrates the effect of varying the fiber content and fiber type on the cracking behavior of the R/SFRC specimens. Figures 6(a) and (b) demonstrate the effect of varying the fiber content on the mean crack spacing and maximum crack width, respectively. It can be seen from Fig. 6(a) that as the fiber content increased, the mean crack spacing decreased. It can also be seen from Fig. 6(b) that as the fiber content increased, the maximum crack width decreased. These two tendencies occurred because as the fiber content increased, more fibers were available to transmit loads across cracks in the concrete. As the number of fibers bridging the crack increased, a larger load was maintained by the fibers across the crack, which reduced the load resisted by the conventional reinforcing bar. As the load resisted by the reinforcing bar decreased, a shorter development length

488 ACI Structural Journal/May-June 2013
Fig. 5—Effect of reinforcing ratio and reinforcing bar diameter on mean crack spacing and maximum crack width for FRC1 specimens (Vf = 0.5%, lf = 30 mm, df = 0.38 mm, lf/df = 79): (a) effect of reinforcement ratio on mean crack spacing; (b) effect of reinforcement ratio on maximum crack width; (c) effect of reinforcing bar diameter on mean crack spacing; and (d) effect of reinforcing bar diameter on maximum crack width.
Fig. 6—Effect of fiber parameters on mean crack spacing and maximum crack width: (a) effect of fiber-volume content Vf on mean crack spacing; (b) effect of fiber-volume content Vf on maximum crack width; (c) effect of fiber geometry on mean crack spacing; and (d) effect of fiber geometry on maximum crack width.

ACI Structural Journal/May-June 2013 489
was required and more closely spaced cracks could develop. The reduction in the reinforcing bar load caused by fibers also had the effect of decreasing the crack widths because as more fibers bridged a crack, the reinforcing bar experi-enced lower strains and, on average, the fibers experienced less slip, resulting in a smaller localized elongation at the crack location.
Figures 6(c) and (d) demonstrate the effect of changing the fiber type on the cracking behavior. These figures plot the averaged cracking behavior of: FRC3-200/30, which contained 1.5% of steel fibers 30 mm (1.18 in.) long, 0.38 mm (0.015 in.) in diameter (aspect ratio of 79), having a rupture strength of 2300 MPa (334 ksi); FRC4-200/30, which contained 1.5% of steel fibers 30 mm (1.18 in.) long, 0.55 mm (0.022 in.) in diameter (aspect ratio of 55), having a rupture strength of 1100 MPa (160 ksi); and FRC5-200/30, which contained 1.5% of steel fibers 50 mm (1.97 in.) long, 1.05 mm (0.041 in.) in diameter (aspect ratio of 48), having a rupture strength of 1000 MPa (145 ksi). It can be seen that for R/SFRC specimens, which had concretes that contained fibers of the same length but differing aspect ratios (FRC3 and FRC4), the specimens with the higher aspect ratio had smaller mean crack spacings and widths. This was because fibers that had the same length but differing aspect ratios had different ratios of cross-sectional perim-eter to area; although fibers that had a higher aspect ratio had a smaller diameter, there were a greater number of them in the concrete matrix as long as the fiber content remained constant. These smaller-diameter fibers required a shorter development length to achieve a relatively high fraction of their ultimate strength, which resulted in a more efficient use of fibers. Therefore, the total fiber load component was greater for those fibers that had a higher aspect ratio, and this reduced the stress and strain of the conventional reinforcing bars as well as the crack spacings and widths. It must also be noted that to achieve this higher fiber efficiency, the fiber strength must be sufficient to avoid rupture; in this experi-mental program, no fiber rupture was detected. It can also be seen from Fig. 6(c) and (d) that R/SFRC specimens that contained fibers of differing lengths but similar aspect ratios (FRC4 and FRC5) behaved quite similarly in regard to both mean crack spacing and maximum crack width. The inherent conclusion is that for a given aspect ratio, fiber length has little effect on the cracking behavior of the R/SFRC speci-mens. However, it should be noted that this observation may not remain true if the crack spacing is small enough for a single fiber to bridge multiple cracks.
Examination of crack spacing formulationsA number of crack spacing formulations for SFRC
can be found in literature. One of the most frequently used formulations was proposed by RILEM Committee TC 162 (Dupont and Vandewalle 2003). This model modi-fies the Eurocode 2 formulation for nonfibrous concrete by a factor that accounts for the reduction in mean crack spacing caused by increasing fiber aspect ratio
1 25050 0.25 b
meff f f
ds k k
l d
= + r (1)
where [50/(lf /df)] ≤ 1.0. The variable sm is the mean crack spacing of the specimen (mm); k1 is a factor accounting for the bond characteristics of reinforcing bars; k2 is a factor
accounting for strain gradient effects; db is the conventional reinforcing bar diameter (mm); reff is the effective reinforce-ment ratio of conventional reinforcing bar; lf is the fiber length (mm); and df is the fiber diameter (mm). The variable reff can be calculated as the ratio of the cross-sectional area of the embedded tension reinforcement to the cross-sectional area of the effective embedment zone of concrete in tension, which extends from the longitudinal reinforcing bars to a distance of 7.5db in all directions. The factor k1 can be taken as 0.8 for deformed reinforcing bars and 1.6 for smooth bars. The factor k2 can be calculated from the following equation
( )1 22
12k
e + e=
e (2)
where e1 and e2 are the largest and smallest tensile strains in the specimen, respectively.
The primary weakness of this model is that it does not consider the effect of the volumetric fiber content; whether the fiber content is 0.1% or 5.0%, the prediction for mean crack spacing remains constant.
An alternative crack spacing model was proposed by Moffatt (2001), modifying the Eurocode 2 crack spacing formulation by a factor that reduces the crack spacing based on the ratio of the post-cracking residual stress of SFRC to the cracking stress
1 250 0.25 1b resm
eff cr
d fs k k
f
= + − r (3)
where fres is the post-cracking residual concrete stress (MPa); fcr is the cracking stress of the concrete (MPa); and the other terms are as defined for Eq. (1). Note that this formulation is only applicable to strain-softening materials.
Although the post-cracking residual stress fres can be easily determined from standard material tests, the prediction of this value without tests is not straightforward. Therefore, its use in the prediction of behavior or for design purposes is not recommended unless the post-cracking residual stress is known with confidence.
Plots of the crack spacings predicted by the RILEM TC 162 and Moffatt (2001) Models against those observed in this experimental program are presented in Fig. 7(a) and (b), respectively. It is evident that neither model predicts the crack spacings adequately, and an improved formulation is required. Current work is progressing in this regard.
CONCLUSIONSThe observations made through this experimental program
have led to the following conclusions:1. Steel fibers added to concrete reinforced with conven-
tional reinforcing bars improve the cracking characteristics and tension-stiffening behavior of the material compared to nonfibrous RC.
2. Steel fibers can increase the post-yield load-carrying capacity of a uniaxial concrete tension member reinforced with conventional reinforcement to levels significantly higher than the bare-bar yield load.
3. An increase in fiber content tends to decrease the mean crack spacings and maximum crack widths of SFRC reinforced with conventional steel reinforcing bars.

490 ACI Structural Journal/May-June 2013
Fig. 7—Results of common crack spacing formulations for R/SFRC: (a) RILEM TC 162; and (b) Moffatt (2001).
4. An increase in fiber aspect ratio tends to decrease the mean crack spacings and maximum crack widths of SFRC reinforced with conventional steel reinforcing bars.
5. An increase in reinforcement ratio of the conven-tional steel reinforcing bar decreases the mean crack spacings and maximum crack widths of both SFRC and nonfibrous concrete.
6. For a given reinforcement ratio, an increase in the conventional reinforcing bar diameter increases the mean crack spacings and maximum crack widths of both SFRC and nonfibrous concrete.
7. Fiber length does not appear to play a significant role in the post-cracking behavior of SFRC containing conventional reinforcing bars, provided that the crack spacing is not so short that a fiber bridges multiple cracks.
8. The currently available crack spacing models are not adequate for calculating the mean crack spacing of R/SFRC members. Improved formulations are required.
ACKNOWLEDGMENTSThis project was funded by the National Sciences and Engineering
Research Council of Canada (NSERC) under the Engage Grant program, with Bekaert Canada Ltd. being the industrial collaborator. The authors would like to gratefully acknowledge the funding provided by NSERC. In addition, generous material donations were made by N.V. Bekaert S.A., Sika Canada Inc., Holcim Canada Inc., Dufferin Aggregates, and BASF Canada. This project was part of a collaborative program undertaken jointly with the University of Brescia; their participation is also gratefully acknowledged.
NOTATIONAs = cross-sectional area of conventional steel reinforcing bars in
tension memberb = specimen widthdb = conventional reinforcing bar diameterdf = fiber diameterEct = tensile modulus of elasticity of concreteEs = modulus of elasticity of steelEsh = initial strain-hardening modulus of elasticity of steelfc′ = peak concrete compression cylinder strengthfcr = concrete cracking stressfr,crack = flexural tensile stress at onset of crackingfres = post-cracking residual tensile stressfr,peak = maximum post-cracking flexural tensile stressft′ = concrete cracking stressftu = maximum post-peak concrete tensile stressfult = ultimate strength of steelfy = yield strength of steelk1 = factor accounting for effect of bond characteristics of conven-
tional reinforcing bars on cracking behaviork2 = factor accounting for strain gradient effects on cracking behaviorlf = fiber length
sm = mean stabilized crack spacingsm,exp = experimentally observed stabilized mean crack spacingsm,pred = predicted stabilized mean crack spacingT = tensile forceVf = volumetric fiber contentwmax = maximum crack widthDL = elongatione1 = largest tensile stress through specimen cross sectione2 = smallest tensile stress through specimen cross sectionecf = net concrete strainec,shr = concrete free-shrinkage strainesh = strain at onset of strain-hardening behavior of steelet′ = concrete cracking strainetu = strain corresponding to maximum post-peak concrete tensile stresseult = strain corresponding to ultimate strength of steelreff = effective reinforcement ratiors = conventional reinforcement ratiosf = fiber rupture strength
REFERENCESAbrishami, H. H., and Mitchell, D., 1997, “Influence of Steel Fibers on Tension
Stiffening,” ACI Structural Journal, V. 94, No. 6, Nov.-Dec., pp. 769-776.Bischoff, P. H., 2003, “Tension Stiffening and Cracking of Steel Fiber-
Reinforced Concrete,” Journal of Materials in Civil Engineering, ASCE, V. 15, No. 2, Apr., pp. 174-182.
Casanova, P.; Rossi, P.; and Schaller, I., 1997, “Can Steel Fibers Replace Transverse Reinforcements in Reinforced Concrete Beams?” ACI Materials Journal, V. 94, No. 5, Sept.-Oct., pp. 341-354.
Chao, S. H.; Naaman, A. E.; and Parra-Montesinos, G. J., 2009, “Bond Behavior of Reinforcing Bars in Tensile Strain-Hardening Fiber-Reinforced Cement Composites,” ACI Structural Journal, V. 106, No. 6, Nov.-Dec., pp. 897-906.
Deluce, J., 2011, “Cracking Behaviour of Steel Fibre Reinforced Concrete Containing Conventional Steel Reinforcement,” MASc thesis, University of Toronto, Toronto, ON, Canada, 506 pp., www.civ.utoronto.ca/vector/theses.html.
Dupont, D., and Vandewalle, L., 2003, “Calculation of Crack Widths with the s-e Method,” Test and Design Methods for Steel Fibre Reinforced Concrete: Background and Experiences—Proceedings of the RILEM TC162-TDF Workshop, RILEM Technical Committee 162-TDF, Bochum, Germany, pp. 119-144.
Mansour, A.; Srebic, J.; and Burley, B. J., 2007, “Development of Straw-Cement Composite Sustainable Building Material for Low-Cost Housing in Egypt,” Journal of Applied Sciences Research, V. 3, No. 11, pp. 1571-1580.
Moffatt, K., 2001, “Analyse de Dalles de Pont avec Armature Réduite et Béton de Fibres Metalliques,” MScA thesis, École Polytechnique de Montréal, Montréal, QC, Canada, 248 pp. (in French)
Noghabai, K., 2000, “Behavior of Tie Elements of Plain and Fibrous Concrete and Varying Cross Sections,” ACI Structural Journal, V. 97, No. 2, Mar.-Apr., pp. 277-285.
Shah, S. P., and Rangan, B. V., 1971, “Fiber Reinforced Concrete Prop-erties,” ACI Journal, V. 68, No. 2, Feb., pp. 126-137.
Susetyo, J., 2009, “Fibre Reinforcement for Shrinkage Crack Control in Prestressed, Precast Segmental Bridges,” PhD dissertation, University of Toronto, Toronto, ON, Canada, 532 pp., www.civ.utoronto.ca/vector/theses.html.