crack growth behavior of titanium alloys1 · pdf filecrack growth behavior of titanium alloys1...
TRANSCRIPT

CRACK GROWTH BEHAVIOR OF TITANIUM ALLOYS1
T. Goswami
Mechanical Engineering Department, Arkansas Tech University, Russellville, AR 72801
Abstract
Fatigue crack growth behavior of Ti-6Al-4V and Ti-10V-2Fe-3Al has been presented under laboratory
air, high-humidity and elevated temperature environments. Constant amplitude tests were conducted with
several stress ratios (R= 0.05, 0.3, 0.4 and 0.7) at laboratory air and high-humidity environments for both
materials and several temperatures were studied at R=0.1 for Ti-6Al-4V alloy. Conventionally forged Ti-
6Al-4V and Ti-10V-2Fe-3Al alloys processed to solution treated and over aged condition were studied.
Fatigue crack growth was found to exhibit two regimes known as Stage I and II, respectively. An
increase in stress ratio and temperature lowered the transitional stress intensity factor range where Stage I
transitioned to Stage II (Paris region). Higher stress ratio (R=0.7) accelerated the fatigue crack growth
rates from 3 to 6 times higher than (R=0.05) tests. However, higher temperature 345ºC influenced the
crack growth rates only marginally. An empirical correlation equation was developed and validated to
predict transitional stress intensity factor for a number of materials. Distinct transition in crack growth
behaviors was recorded for each stress ratio, temperature, and environment. These results are presented in
this paper.
Key-words: Fatigue, Fatigue Crack Propagation, Stress Intensity Factor, α−β, Elevated Temperature.
1 This paper is dedicated to Professor William J. Plumbridge, Materials Engineering Department, Open
University, Milton Keynes, England, on his 60th birthday in September 2001.

2
Introduction
A number of studies are found in the literature (1-11) describing the fatigue crack growth behavior of Ti-
6Al-4V alloy and establishing microstructure – property correlations. With increased attention given to
high cycle fatigue (12) being one of the potential failure modes in military aircraft engine disks and
blades made of titanium alloys, room and elevated temperature fatigue crack propagation (FCP) behavior
is studied further. A limited number of studies are reported on the S-N fatigue or fatigue crack growth
behavior of Ti-10V-2Fe-3Al alloy, which is used in the aircraft structures. Damage tolerance
characteristics of these materials are important in life assessment of engine and aircraft structural parts.
Therefore, this paper presents data and comments on the fatigue crack growth behavior of both materials.
Since a major percent of component life is spent in nucleation and growth of a crack to a detectible size
(1), crack growth studies are conducted both in Stage I (low ranges of da/dN and ∆K) and Stage II, where
a linear fit can be applied to the (Paris region) crack growth data. In this paper fatigue crack growth data
are presented revisiting the mechanisms of FCP in Stage I (where crack growth behavior is dependent on
microstructure) and transition of FCP from structure sensitive region (Stage I) to structure insensitive
region (Stage II) under different stress ratios (R), laboratory-air, high-humidity and elevated temperature
environments. Twelve middle-tension (MT) tests were conducted at room temperature for each material
Ti-6Al-4V and Ti-10V-2Fe-3Al alloys and 16 compact tension specimens were tested at elevated
temperatures for Ti-6Al-4V alloy only.
The mechanics of FCP in Ti-6Al-4V is structure sensitive at the low ranges of Mode I stress intensity
factor range. This behavior is presented in the literature in terms of Stage I behavior occurring under
specific microstructures and α−β packet size (9-11). Reversed plastic zone at the crack tip has been
related with α−β packet size (9-11) and as long as the former was smaller than latter, Stage I prevailed in
the FCP behavior and once exceeded the Stage II FCP took place, Fig. 1. Additional parameters added to
test matrix here are four temperatures, four stress ratios, high humidity and lab-air environments and FCP
mechanisms in Ti-6Al-4V and Ti-10V-2Fe-3Al investigated.
3
Material and Experiment
Ti-6Al-4V
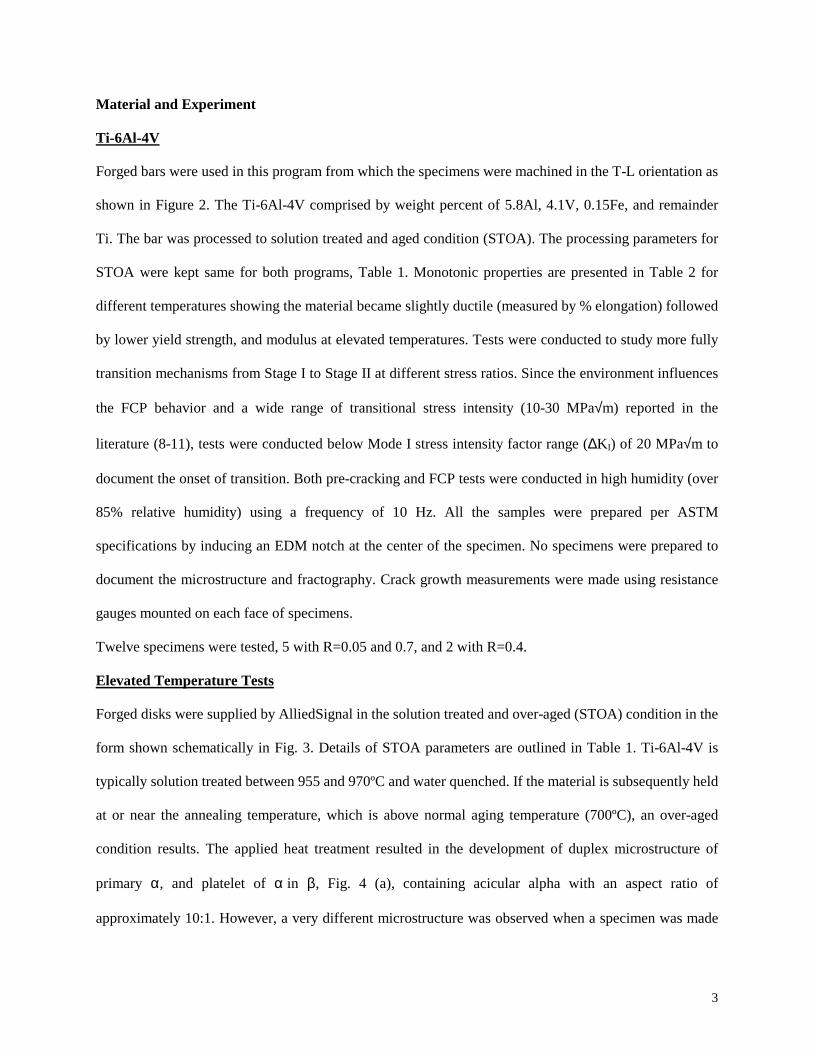
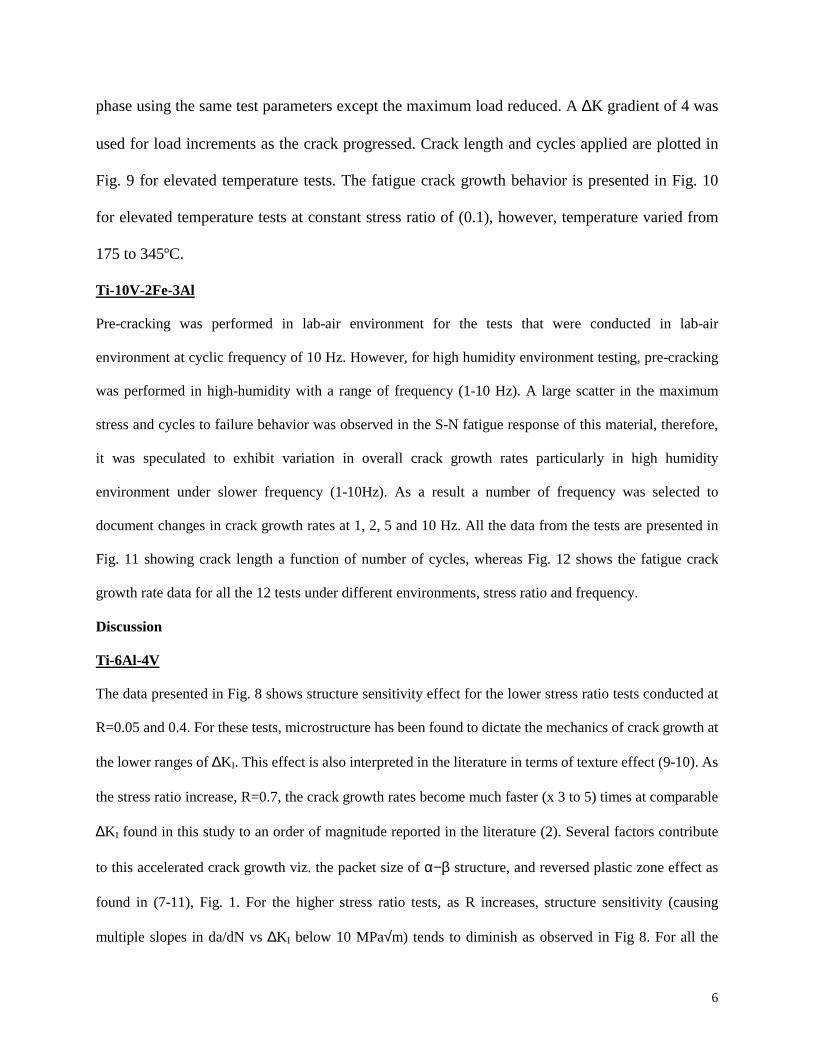
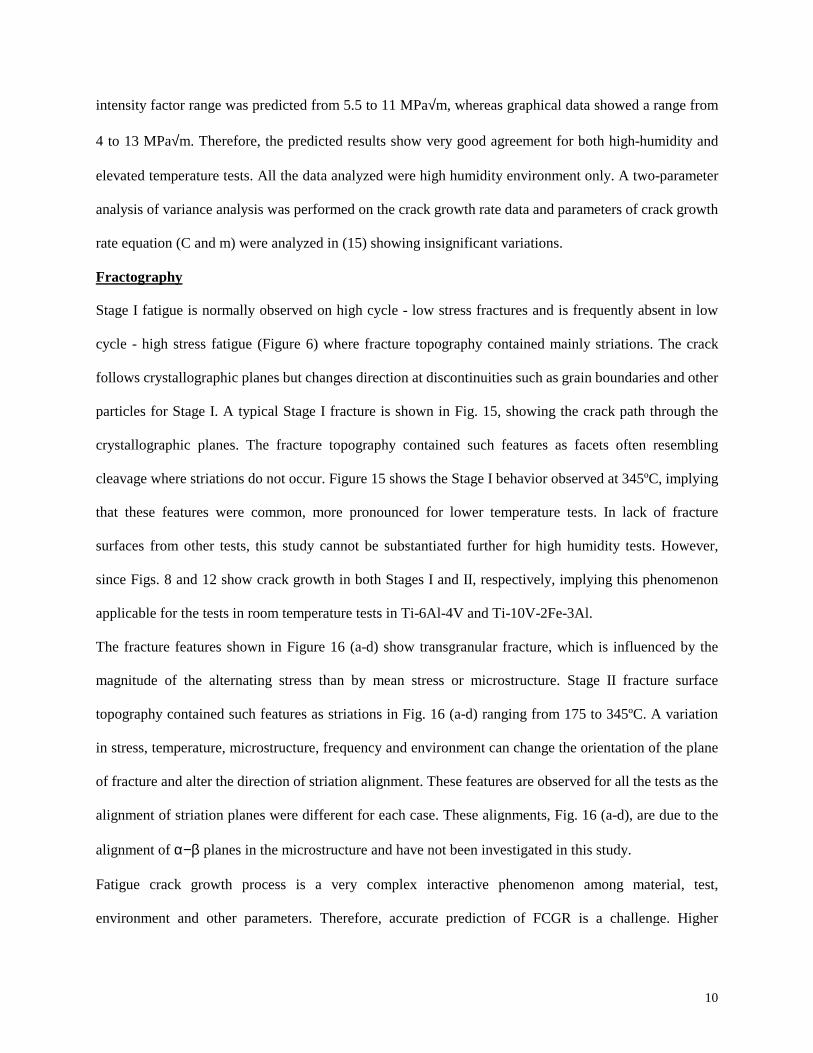
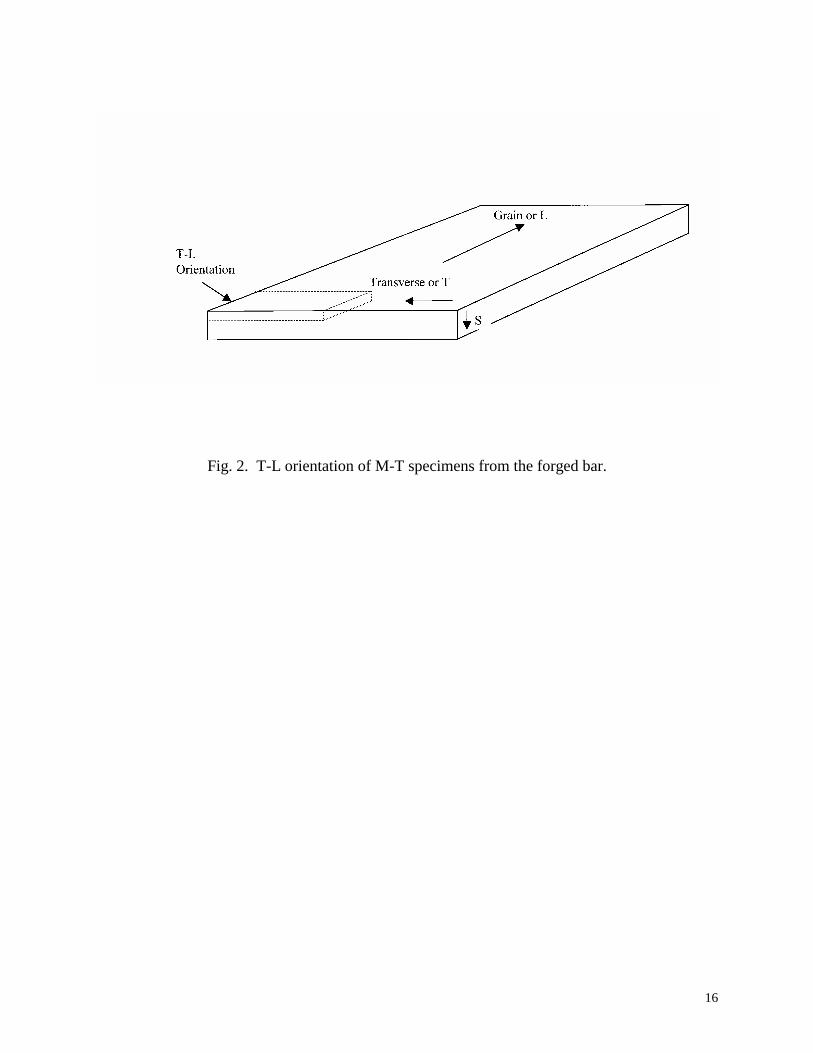
Forged bars were used in this program from which the specimens were machined in the T-L orientation as
shown in Figure 2. The Ti-6Al-4V comprised by weight percent of 5.8Al, 4.1V, 0.15Fe, and remainder
Ti. The bar was processed to solution treated and aged condition (STOA). The processing parameters for
STOA were kept same for both programs, Table 1. Monotonic properties are presented in Table 2 for
different temperatures showing the material became slightly ductile (measured by % elongation) followed
by lower yield strength, and modulus at elevated temperatures. Tests were conducted to study more fully
transition mechanisms from Stage I to Stage II at different stress ratios. Since the environment influences
the FCP behavior and a wide range of transitional stress intensity (10-30 MPa√m) reported in the
literature (8-11), tests were conducted below Mode I stress intensity factor range (∆KI) of 20 MPa√m to
document the onset of transition. Both pre-cracking and FCP tests were conducted in high humidity (over
85% relative humidity) using a frequency of 10 Hz. All the samples were prepared per ASTM
specifications by inducing an EDM notch at the center of the specimen. No specimens were prepared to
document the microstructure and fractography. Crack growth measurements were made using resistance
gauges mounted on each face of specimens.
Twelve specimens were tested, 5 with R=0.05 and 0.7, and 2 with R=0.4.
Elevated Temperature Tests
Forged disks were supplied by AlliedSignal in the solution treated and over-aged (STOA) condition in the
form shown schematically in Fig. 3. Details of STOA parameters are outlined in Table 1. Ti-6Al-4V is
typically solution treated between 955 and 970ºC and water quenched. If the material is subsequently held
at or near the annealing temperature, which is above normal aging temperature (700ºC), an over-aged
condition results. The applied heat treatment resulted in the development of duplex microstructure of
primary α, and platelet of α in β, Fig. 4 (a), containing acicular alpha with an aspect ratio of
approximately 10:1. However, a very different microstructure was observed when a specimen was made

4
from a different area (flange area), Fig 4 (b). This microstructure, Fig. 4 (b), contains slightly distorted,
coarse, plate like alpha grains with randomly equiaxed alpha grains (light) in beta phase (seen dark), with
an aspect ratio of 10:1. Specimens were machined such a way that the loading was in the radial direction,
whereas the crack growth occurred in longitudinal direction, representative of actual stress distribution in
an engine disk from the blade attachment root or from bolt-holes. The dimensions of the CT specimens
used for the tests were in conformance with ASTM E-647-88. A DCPD system was used to record the
crack growth of CT specimens and procedure reported elsewhere (13-14).
Sixteen CT specimens were tested in this program, eight from each disk and each test was duplicated.
Specimens numbering 1 and 2 represent Disk I and 3-4 Disk II, respectively. It is likely that variations in
the data may arise from locations from where specimens were machined, product form (disk and bar),
forging ratio (different % volume reduction ratio) used for bar and disks, and methods used to monitor
crack growth. These variations are recognized to play a part in FCP yet the data generated were compared
to derive trends in behavior and conclusions drawn.
Tests were continued with the (crack length to specimen width ratio, a/W) of 0.24 to 0.7 within the range
specified in ASTM E-647-88. Fatigue crack growth rates were calculated from incremental measurements
of crack growth as follows:
dadN
=(a - a )
( N - N )i+1 i
i+1 i
The incremental crack growth rates were correlated with ∆K values derived from the mean of the crack
growth interval, (a i+1 +a i)/2.
Ti-10V-2Fe-3Al
Forged bars were used in this program. Specimens were machined in the T-L orientation as shown in Fig.
2. The material comprised of 9.38% V, 1.81% Fe and 3.26% Al by weight percent meeting the minimum
requirements of specifications (AMS-4986). Monotonic properties are presented in Table 2 at room
temperature conditions. The microstructure of Ti-10V-2Fe-3Al contained lamellar α with a small amount
of equiaxed α in an aged β matrix. A typical microstructure is shown in Fig. 5. Twelve tests were

5
conducted, 7 at lab-air environment with 10 Hz frequency and stress ratio (R=0.05, 0.3, 0.7), whereas 5
tests were conducted at high humidity environment using frequency (1, 2, 5 and 10) Hz. No specimen was
prepared to document the microstructure and/or study fracture surfaces. Crack growth measurements were
made using resistance gauges mounted on each face of specimens.
Results
Ti-6Al-4V
A few S-N type fatigue tests were conducted on Ti-6Al-4V at elevated temperatures. Strain accumulation
response as a result of those load controlled tests are presented in Fig. 6 for room temperature, 175, 230,
and 290°C. At the same cycles to failure (400 cycles) the strain accumulated at room temperature was
0.004, whereas at 290°C, 0.0055 (Fig. 6), which is over 35% higher, meaning higher strain accumulation
and reduced life. This may indicate the low cycle fatigue performance of Ti-6Al-V is susceptible where
cyclic plasticity dominates in the mechanism of failure.
Pre-cracking was performed with sinusoidal waveform at 10 Hz in a high humidity environment. Stress
ratio varied from 0.05 to 0.7 for the tests. Each specimen was pre-cracked 6 mm on the MT specimen 101
mm wide and 6.25 mm thick on the average. The crack propagated typically to a length of 45-46 mm,
where ∆KI was 13-16 MPa√m, and cycles applied ranged from one-fifth of a million to nearly 7 millions.
These details are shown in Fig. 7 for all the 12 tests. The number of cycles to pre-crack the specimen
varied from a few hundred thousand cycles to several million cycles as illustrated in Figure 7.
Environment for all the tests was high humidity for both pre-cracking and fatigue crack growth phase.
Fatigue crack growth behavior of Ti-6Al-4V alloy is presented in Figure 8. The data presented in
Figure 8 shows the da/dN and ∆KI for various stress ratios. All the data were below ∆K of 20
MPa√m to show the two stages in crack growth and capture the onset of transition. Pre-cracking
was performed with sinusoidal waveform at 20 Hz using a stress ratio (R) of 0.1. Each specimen
was allowed to pre-crack up to 1.5 mm (7.5 mm notch depth) for the pre-cracking part. Upon the
specified pre-crack length was achieved, the specimens were tested for fatigue crack growth
6
phase using the same test parameters except the maximum load reduced. A ∆K gradient of 4 was
used for load increments as the crack progressed. Crack length and cycles applied are plotted in
Fig. 9 for elevated temperature tests. The fatigue crack growth behavior is presented in Fig. 10
for elevated temperature tests at constant stress ratio of (0.1), however, temperature varied from
175 to 345ºC.
Ti-10V-2Fe-3Al
Pre-cracking was performed in lab-air environment for the tests that were conducted in lab-air
environment at cyclic frequency of 10 Hz. However, for high humidity environment testing, pre-cracking
was performed in high-humidity with a range of frequency (1-10 Hz). A large scatter in the maximum
stress and cycles to failure behavior was observed in the S-N fatigue response of this material, therefore,
it was speculated to exhibit variation in overall crack growth rates particularly in high humidity
environment under slower frequency (1-10Hz). As a result a number of frequency was selected to
document changes in crack growth rates at 1, 2, 5 and 10 Hz. All the data from the tests are presented in
Fig. 11 showing crack length a function of number of cycles, whereas Fig. 12 shows the fatigue crack
growth rate data for all the 12 tests under different environments, stress ratio and frequency.
Discussion
Ti-6Al-4V
The data presented in Fig. 8 shows structure sensitivity effect for the lower stress ratio tests conducted at
R=0.05 and 0.4. For these tests, microstructure has been found to dictate the mechanics of crack growth at
the lower ranges of ∆KI. This effect is also interpreted in the literature in terms of texture effect (9-10). As
the stress ratio increase, R=0.7, the crack growth rates become much faster (x 3 to 5) times at comparable
∆KI found in this study to an order of magnitude reported in the literature (2). Several factors contribute
to this accelerated crack growth viz. the packet size of α−β structure, and reversed plastic zone effect as
found in (7-11), Fig. 1. For the higher stress ratio tests, as R increases, structure sensitivity (causing
multiple slopes in da/dN vs ∆KI below 10 MPa√m) tends to diminish as observed in Fig 8. For all the

7
tests conducted in high humidity, the transition of structure sensitive to structure insensitive mode (Stage
I to Stage II, Fig. 1) was found to be lower than the tests conducted in laboratory air environment (7-11).
The transitional ∆K was found to be from 3 to 10 MPa √m, also found in some studies in literature and
higher within 30 MPa √m summarized in (8-9). Elevated temperature tests show distinct regions where
Stage I and II exist and transition effects. High humidity in pre-cracking phase has been found to initiate
pits from where cracking was observed in high strength aluminum alloys, Fig. 13 for 7075-T76511. A
pronounced texture and/or microstructure effect is exhibited for this material at lower stress ratios, Fig.
14. However, as the R became higher (0.7) the transitional ∆KI reduced considerably. Figure 14 also
shows the pronounced crack acceleration at the Stage I with low ∆KI. Corrosion, as found in aluminum
alloys, may be one of the contributing factors for accelerated crack growth in Ti-6Al-4V that lowers the
transitional ∆KT for Stage I phase at higher R ratios (e.g., R=0.7). Further discussion is provided in the
section below.
Elevated Temperature Tests
Crack growth rates vary from 10-8 to 10-5 (m/cycle), Fig. 10, within the range of Mode I stress intensity
factor 10 to 53 MPa√m. Straight line fits for the data were determined within the range of crack growth
rates from 10-8 to 10-6 m/cycle, representative of linear or power law regime. The parameters of Paris
equation, da/dN = C (∆KI) m (slope of linear line, m and material parameter, C), for each disk are
presented in (15), for all temperatures for both the disks. A two-parameter analysis of variance method
was used to correlate the disk-to-disk variation in crack growth rates and appeared to be very small (15).
Also FCP rates obtained in this study for elevated temperature tests were compared with other studies (3-
4, 6, 8) in (15). A marginal variation was observed for different studies (3-4, 6, 8, 15). Figure 10 shows
variation in the crack growth rates occurring from different specimens from two disks. It is evident from
Fig. 10 that crack growth rates within the mid-range (>10-7 m/cycle), no substantial influence of
temperature has been observed. Crack propagation rate at 345ºC was slightly higher than room
temperature test. This may be a result of lower strength high ductility exhibited by Ti-6Al-4V at high

8
temperatures. Similar results were reported for Ti-6Al-4V and other Ti-8Al-1Mo-1V at elevated
temperatures (1-3). The transition of Stage I cracking to II occurred for all the cases above 10 MPa√m (1-
3, 7-10).
Elevated temperature, axial push-pull tests show the strain accumulation under load control tests a
function of temperature, Fig. 6. Cyclic plasticity increased as the temperature increased resulting in lower
life in low cycle regime. However, for high cycle regime, under fatigue crack growth tests, for the same
final crack length the number of cycles were in a range of 2 for all the tests. Tests conducted on disk II
were showing higher cycles (x2) for propagating the same crack length at all temperatures. These
distributions (a-N, Fig. 9) were same for all temperatures selected in this study. However, when plotted in
terms of da/dN and ∆K, no significant scatter was observed, Fig. 10. The temperatures selected were
within typical working range of gas turbine engine compressor disks (fan disks) below creep-fatigue
range and no interactions of creep, fatigue and/or oxidation observed (see section on Fractography). It is
also speculated that temperature range from 175 to 345°C is not within the ageing temperatures where
material may show some changes occurring as a result of exposure time and/or cycles by diffusion
controlled mechanisms. A few cavities were observed for 290-345°C tests showing some interaction
effects. Some effects are expected to occur in “short crack” propagation due mainly to different
mechanisms by which the crack propagates in that regime and/or near threshold for the long crack growth
(da/dN below 10-8 m/cycle). The mechanisms in higher crack growth rates as presented in this paper were
transgranular, striations dominated mainly in the Stage II. Only a small area of crystallographic crack
growth was observed indicating Stage I cracking. Further studies of these discrepancies will be analyzed
by using Kmax parameter as proposed by Vasudevan et, al. (17).
Ti-10V-2Fe-3Al
Figure 11 shows that number of cycles to grow the same crack length in lab-air environment is much
higher, of the order of a magnitude or more, than high humidity environment. At low frequency, 1 and 2
Hz, the number of fatigue cycles needed to grow the same crack length was 10 to 15 times lower than the

9
test conducted at higher stress ratio, R=0.7 at 10Hz. The data when plotted in terms of crack growth rate
and Mode I stress intensity factor range, Fig. 12, a significant scatter was observed between R=0.05, 0.3,
and 0.7 and frequency. Below crack growth rates 10-8 m/cycle, the lower stress ratio tests conducted in
lab-air, distinct Stage I and II regions with bilinear slopes were documented. However, as the stress ratio
increased, the bi-linearity diminished for higher R=0.7 tests. In those tests only one slope could be
observed, Fig. 12. For damage tolerance analysis the scatter in the data, as presented in Fig. 12, uses tools
to collapse the data and multiple slopes determined to perform the crack growth analysis. The crack
growth rates for higher stress ratio tests were from 4 to 5 times higher than low stress ratios viz. 0.05 and
0.3. These variations are consistent with similar tests conducted for Ti-6Al-4V and do not show
significant influence of either the low frequency, lab-air or high-humidity environment and stress ratio,see
Figs. 8, 10, 12 and 14.
Each region, Stage I and II, has distinct fracture features. For the materials studied in this paper, the
structural sensitivity in the crack growth rates occurs for stress intensity factor below 10 MPa√m beyond
this point (7 MPa√m in the case of Ti-10V-2Fe-3Al) the crack growth process is independent of
microstructure. The slope of the crack growth rate curve in Stage I regime is higher than the Stage II
regime, drawn schematically in Figure 1. This behavior has been interpreted in terms of cyclic plastic
zone becoming equal to the α−β packet size. This point also describes the boundaries within which
structural sensitivity occurs. In the literature, several expressions have been proposed empirically (7-11)
describing cyclic plastic zone in aluminum and titanium alloys.
A number of aluminum and titanium alloys used in aircraft structures was analyzed by the author in a
separate effort (18) and the correlations were made with the following equations.
Reversed plastic zone = 0.5 [∆KI / Fty]2
Whereas, transition point was at (∆KT) = 2.8 Fty (d)0.5
These expressions were verified with the materials used in this paper (Figs. 8, 10, 12, and 14) and other
materials from 2XXX, 6XXX and 7XXX series aluminum alloys for over 200 tests. The transitional stress
10
intensity factor range was predicted from 5.5 to 11 MPa√m, whereas graphical data showed a range from
4 to 13 MPa√m. Therefore, the predicted results show very good agreement for both high-humidity and
elevated temperature tests. All the data analyzed were high humidity environment only. A two-parameter
analysis of variance analysis was performed on the crack growth rate data and parameters of crack growth
rate equation (C and m) were analyzed in (15) showing insignificant variations.
Fractography
Stage I fatigue is normally observed on high cycle - low stress fractures and is frequently absent in low
cycle - high stress fatigue (Figure 6) where fracture topography contained mainly striations. The crack
follows crystallographic planes but changes direction at discontinuities such as grain boundaries and other
particles for Stage I. A typical Stage I fracture is shown in Fig. 15, showing the crack path through the
crystallographic planes. The fracture topography contained such features as facets often resembling
cleavage where striations do not occur. Figure 15 shows the Stage I behavior observed at 345ºC, implying
that these features were common, more pronounced for lower temperature tests. In lack of fracture
surfaces from other tests, this study cannot be substantiated further for high humidity tests. However,
since Figs. 8 and 12 show crack growth in both Stages I and II, respectively, implying this phenomenon
applicable for the tests in room temperature tests in Ti-6Al-4V and Ti-10V-2Fe-3Al.
The fracture features shown in Figure 16 (a-d) show transgranular fracture, which is influenced by the
magnitude of the alternating stress than by mean stress or microstructure. Stage II fracture surface
topography contained such features as striations in Fig. 16 (a-d) ranging from 175 to 345ºC. A variation
in stress, temperature, microstructure, frequency and environment can change the orientation of the plane
of fracture and alter the direction of striation alignment. These features are observed for all the tests as the
alignment of striation planes were different for each case. These alignments, Fig. 16 (a-d), are due to the
alignment of α−β planes in the microstructure and have not been investigated in this study.
Fatigue crack growth process is a very complex interactive phenomenon among material, test,
environment and other parameters. Therefore, accurate prediction of FCGR is a challenge. Higher

11
temperature and aggressive environment may reduce greatly the crack growth resistance of a material.
Cyclic cleavage results in an aggressive environment, whereas secondary cracks and voids form as the
temperature increased. Secondary cracks often reduce the state of stress at the tip of a dominating and
advancing crack offering crack growth resistance as the test temperature increased. However, there are
competition mechanisms among secondary cracks, secondary cracks interacting with the primary crack,
and these processes interacting with the material properties at high temperature is very difficult to
interpret and quantify. Some voids were observed at 290 and 345ºC as shown in the fractographs Fig. 17
which may provide linking media for the advancing crack. These voids appeared to have been occurred at
the boundaries between α platelets in the β indicative of triple point effect aided by a mismatch in
ductility, localized slip promoting grain boundary sliding, and/or temperature effects (creep). Whether or
not the voids were temperature effects is beyond the scope of this paper.
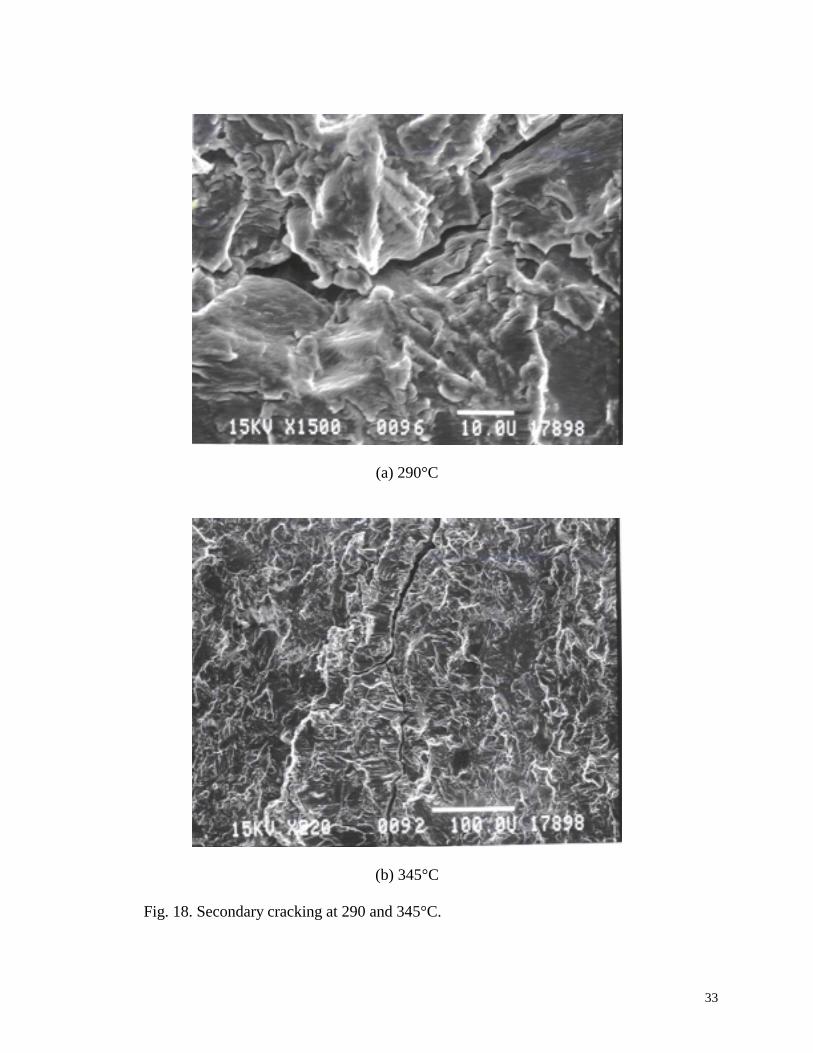
Secondary cracks documented in this paper are shown in Fig 18 (a-b). In the Stage II of the fatigue crack
growth region. In that area fine fracture features were seen compared to the early stages of crack growth
process where fracture surface features were very rough showing cleavage, crack path changes and crack
growth rate interacting with microstructure. Room temperature crack growth process was dictated by the
nature of the α−β grain, and distribution of alpha platelets in beta grain, in which cyclic cleavage was
more deleterious and increased FCR rates. For higher temperature tests (at 345ºC) cavity formed that may
indicate a temperature effect. At some point towards the end of Stage II, in Stage III, dimples were
observed and fracture was by intergranular mode as shown in Fig. 19. These features were similar to that
reported in (1-3, 10).

12
Conclusion
The fatigue crack growth rates were a function of test parameters used under lab-air, high humidity and
elevated temperature environments. Low frequency (1-2 Hz), high stress ratio (R=0.7) tests accelerated
the fatigue crack growth rates from 4 to 6 times than high frequency (10 Hz), low stress ratio tests
(R=0.05). Each combination of test parameters (stress ratio, environment, and frequency) showed a
distinct trend in crack growth rate behavior. However, transition mechanisms in both alloys were a
function of environment in which tests were performed. High humidity and elevated temperature reduced
the stress intensity range where Stage I transitioned to Stage II. This was also influenced by stress ratio.
At higher stress ratio, R=0.7, the transition phenomenon diminished in high humidity environment for
both materials. Cyclic plastic zone size calculated empirically was found to predict transitional stress
intensity factor satisfactorily for a number of aluminum (2XXX, 6XXX and 7XXX series alloys) and
titanium alloys (Ti-6Al-4V and Ti-10V-2Fe-3Al).
Tests conducted at elevated temperatures showed bilinear slopes in the crack growth rates showing
distinct Stage I and II, respectively. Complex interactions of environment, microstructure, and test
parameters were not as significant at lower temperatures and stress ratios. However, more secondary
cracks and cavities formed at 20 Hz at or above 290ºC and had a mixed effect on fatigue crack growth
rates as secondary cracks may have reduced the stress intensity at the crack tip of a dominating crack and
voids may have accelerated the growth of main dominating crack, needs to be investigated further.

13
References
1. J.A. Hall, Int. J. Fatigue, 19, 1, 1997, pp. S23-S37.
2. J.E. Petit, W. Berata, and B. Bouchet, Scripta Metall. 26, pp. 1889-94.
3. G.C. Salivar, and J.E. Heive, Eng. Fract. Mech. 32, 5, 1989, pp. 807-17.
4. G.C. Salivar, and F.K. Haake Eng. Fract. Mech. 37, 3, pp.505-17.
5. L.S. Vesier, and S.D. Antolovitch, Eng. Fract. Mech. 37, 4, 1990, pp. 753-75.
6. M.D. Raizenne, AGARD SMP SC-33, Engine disk test programme fatigue crack growth rate data
and modeling cases for Ti-6Al-4V, IMI 685 and Ti-17. National Research Council of Canada,
LTR-ST-1785, Nov. 1990.
7. A. Zeghloul, and J. Petit, Fat. Fract. Engeg. Mater. Struct. 8, 4, 1985, pp. 341-48.
8. T. Ogawa, Y. Hayashi, K. Tokaji, and M. Hirose, Fatigue crack growth of Ti-6Al-4V at elevated
temperatures, Japanese Society of Materials Science.
9. G.R. Yoder, L.A. Cooley and T.W.Crooker, Metall. Trans. 11A, 1979, pp. 805-816.
10. D. Eylon, J.A. Hall, Metall. Trans. 8A, 1977, pp. 981-90.
11. R.J.H. Wanhill, R. Galatolo, and C.E.W. Looije, Int. J. Fatigue, 11, 6, 1989, pp. 407-16.
12. B.A. Cowles, Int. J. Fracture, 1996, pp. 1-16.
13. N. Ramchandran, N. Arakere, and T. Goswami, High Temp. Mater. Processes, 19, 5, 2000, pp.
357-370.
14. R.O. Ritchie, Technical Report, “Crack growth monitoring: some considerationson the electrical
potential method” Dept. Metall. Mater. Sc., University of Cambridge, 1972.
15. N. Arakere, J. Krohn, T. Goswami and N. Ramchandran, High temperature fatigue crack growth
behavior of Ti-6Al-4V, in print, High Temperature Materials and Processes, 2001.
16. T. Goswami, Long crack transition mechanisms in Ti-6Al-4V alloy, submitted to Materials
Science and Engineering, 2001.
17. A. K. Vasudevan, K. Sadananda, and G. Glinka, Critical parameters for fatigue damage, I. J.
Fatigue, in Print, 2001.
18. T. Goswami and G. E. Gentry, Jr. Unpublished work at Cessna Aircraft Company, 1995.

14
Table 1. Parameters of solution treated and over-aged condition for Ti-6Al-4V
Solution treat 960°C
Water quench Room temperature
Overage 700ºC, for 2 hours, air cool
Table 2. Mechanical properties of Titanium alloys.
Temperature ºC Yield strength
MPa
Young Modulus
GPa
% elongation
Ti-6Al-4V
Room 813 120 12.4
175 800 110 17.1
230 772 109 18.7
290 760 100 20
Ti-10V-2Fe-3Alª
Room 1073* - 6
Note: a, The material met the minimum properties required by specification AMS 4986.
*, Average of three tests.

Fig. 1. Schematic representation
da/dN
Stage I
Stage II
∆KT
15
of Stage I and II crack growth behaviors in titanium alloys.
Stress intensity factor range
16
Fig. 2. T-L orientation of M-T specimens from the forged bar.

17
Fig. 3. Schematic view of disk forging and specimen lay-out.
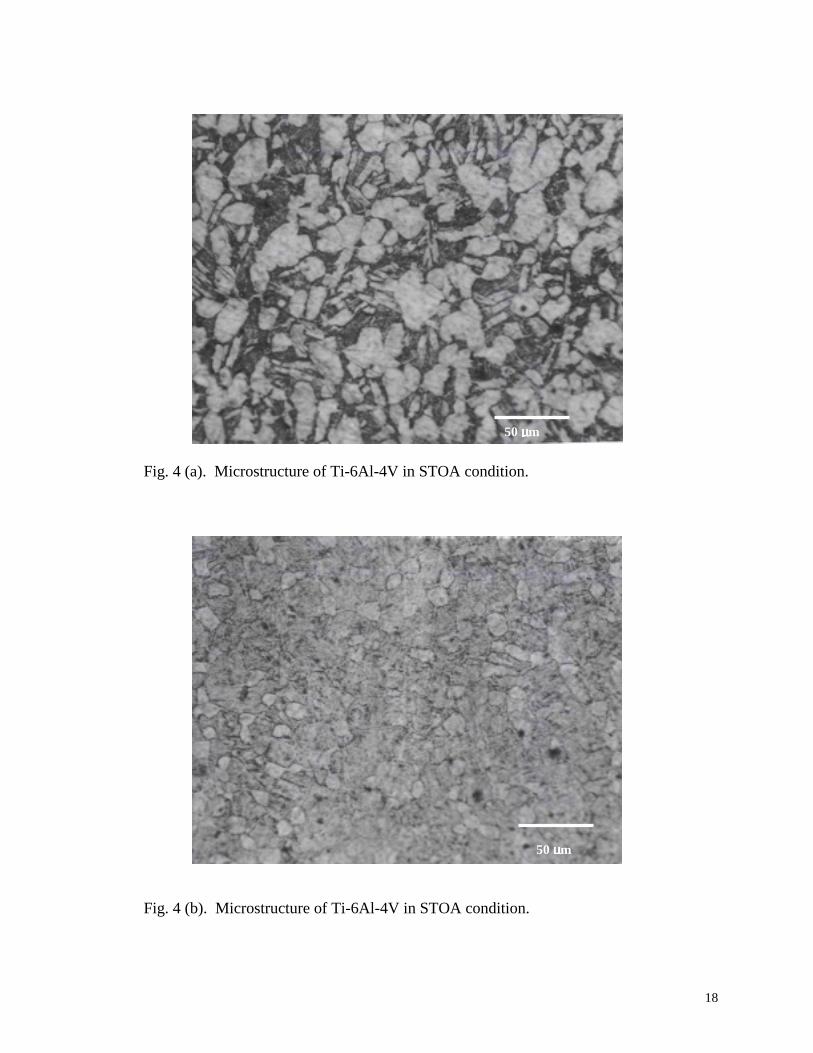
Fig. 4 (a). Microstructure of Ti-6Al-4V in STOA condi
50 µµµµm
Fig. 4 (b). Microstructure of Ti-6Al-4V in STOA cond
50 µµµµmtion.
ition.
50 µµµµm18

19
Fig. 5. Microstructure of Ti-10V-2Fe-3Al. Note: This figure may not stay in the final submission as I only have digital image.50 µµµµm
50 µm

20
Strain
Fig. 6. Strain accumulation in Ti-6Al-4V alloy at room temperature, 175, 230 and 290°C.

21
0
0.01
0.02
0.03
0.04
0.05
0.06
1.00E+05 1.00E+06 1.00E+07
Cycles
Cra
ck le
ngth
(m)
R=0.05R=0.4R=0.4R=0.7R=0.7R=0.05R=0.7R=0.7R=0.7R=0.05R=0.05R=0.05
Fig. 7. Crack length versus number of cycles for Ti-6Al-4V high humidity tests.

22
1.00E-10
1.00E-09
1.00E-08
1.00E-07
1.00E-06
1 10 100
Delta K (MPa m^1/2)
da/d
N (m
/cyc
le)
R=0.05 R=0.4 R=0.4 R=0.7 R=0.7 R=0.05 R=0.7 R=0.7 R=0.7 R=0.05 R=0.05 R=0.05
Fig. 8. Crack propagation behavior of Ti-6Al-4V in high humidity environment.

23
Fig. 9. Crack length versus number of cycles of Ti-6Al-4V at elevated temperature.

24
Fig. 10. Elevated temperature fatigue crack propagation behavior in Ti-6Al-4V alloy.

25
0.01
0.02
0.03
0.04
0.05
0.06
0.07
0.08
0.09
0.1
1000 10000 100000 1000000 10000000
Cycles
Cra
ck le
ngth
(m)
Lab-air, R=0.3,10 Hz Lab-air, R=0.05, 10 Hz Hi-humidity, R=0.7, 10 Hz Hi-humidity, R=0.05, 2 HzLab-air, R=0.3, 10 Hz Lab-air, R=0.7, 10 Hz Hi-humidity, R=0.3, 5 Hz Hi-humidity, R=0.7, 1 HzLab-air, R=0.05, 10 Hz Lab-air, R=0.7, 10 Hz Hi-humidity, R=0.05, 5 Hz Lab-air, R=0.3, 10 Hz
Fig. 11. Crack length versus number of cycles for Ti-10V-2Fe-3Al alloy.

26
1.00E-09
1.00E-08
1.00E-07
1.00E-06
1.00E-05
1 10 100
Delta K (Mpam^1/2)
da/d
N (m
/cyc
le)
Lab-air, R=0.3,10 Hz Lab-air, R=0.05, 10 Hz Hi-Humidity, R=0.7, 10 Hz Hi-humidity, R=0.05, 2 HzLab-air, R=0.3, 10 Hz Lab-air, R=0.7, 10 Hz Hi-humidity, R=0.3, 5 Hz Hi-humidity, R=0.7, 1 HzLab-air, R=0.05, 10 Hz Lab-air, R=0.7, 10 Hz Hi-humidity, R=0.05, 5 Hz Lab-air, R=0.3, 10 Hz
Fig. 12. Crack propagation behavior of Ti-10V-2Fe-3Al under different test parameters.
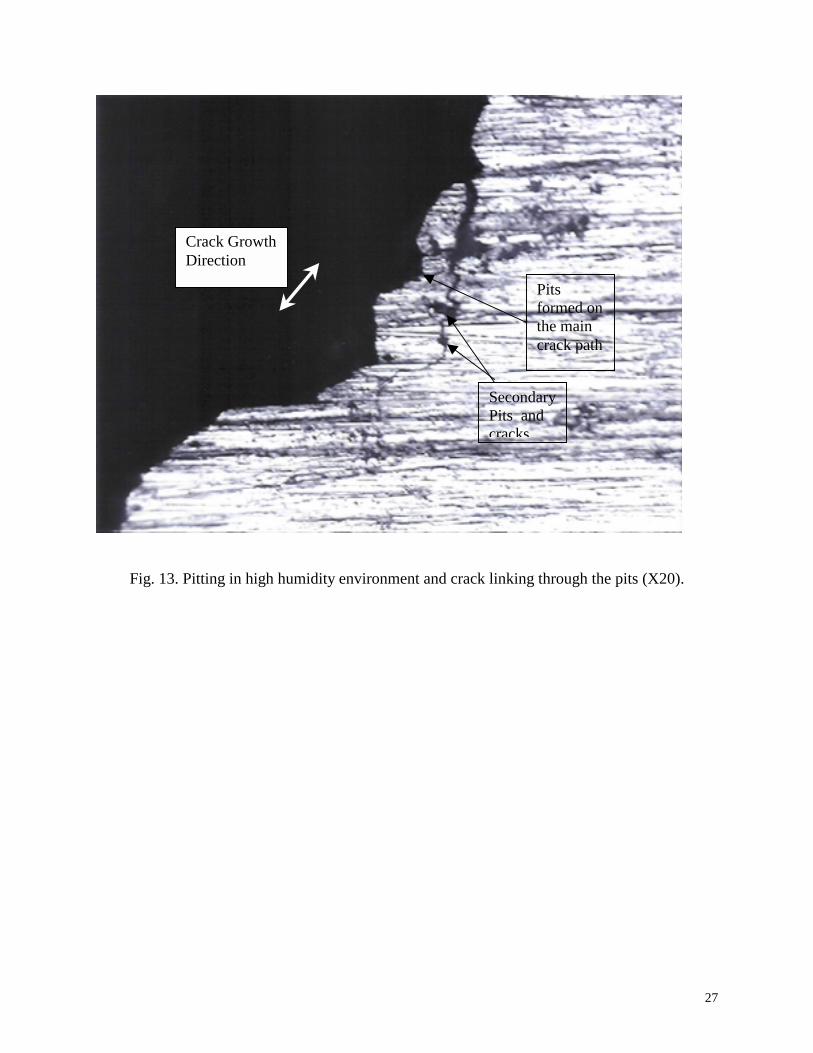
Fig. 13. Pitting in high humidity environment and crack
Pits formed on the main crack path
Crack Growth Direction
Secondary Pits and cracks
27
linking through the pits (X20).

28
1.00E-09
1.00E-08
1.00E-07
1.00E-06
1.00E-05
1.00E-04
1 10 100
Delta K
da/d
N (m
/cyc
le)
R=0.05 R=0.05 R=0.05 R=0.7 R=0.7 R=0.7 R=0.05
Fig. 14. Fatigue crack propagation behavior of aluminum alloy 7075-T76511.

29
Fig. 15. Fractographic features of Stage I crack propagation.
5 µµµµm

30
(a) 175°C
(b) 230°C

31
(c) 290°C
(d) 290°C
Fig. 16. Fractographic features of Stage II crack propagation (striations) at various temperatures.

32
Fig. 17. Voiding in Ti-6Al-4V at 345°C.
33
(a) 290°C
(b) 345°C
Fig. 18. Secondary cracking at 290 and 345°C.

34
Fig. 19. Intergranular fracture and dimples on the fracture surface indicating overloading failure at 345°C.