p2infohouse.org · cr/71038final cam oct-01 335 resource production issues overview background it...
TRANSCRIPT

334CR/71038Final CAM Oct-01
Scenario Analysis
4
Policy Options
5
Conclusions & Recommendations
6
Benefit and Impact Analysis
7
Table of Contents
Identification of Options
Background & Objectives
Executive Summary
3
1
0
Baseline Use of Biomass2
•• Resource ProductionResource Production• Fossil Chain Baselines• Biopower Options• Biofuel Options• Bioproduct Options

335CR/71038Final CAM Oct-01
Resource Production Issues Overview Background
It is critical for the success of bioenergy and bioproduct industries tomaintain or improve soil, surface water, and ecosystem quality.• The quality of soil is impacted by:
– Increased soil carbon generally results in positive impacts on soil nutrients, erosion,and soil structure
– Soil nutrients could be removed by erosion and harvest if not managed– Erosion is one of the greatest threats to long term soil productivity
- Leads to a loss of adequate depth of rooting, water retention and nutrient rich surface layers– Compaction and loss of soil cover increase nitrification rates, damages soil structure,
increases runoff, and decreases water storage
• Management of run-off (e.g. water with nitrate, phosphorous, pesticides, andherbicides) so that nearby surface water supplies are unaffected
• Landscape diversity is necessary to maintain regional plant and animal speciesdiversity and ecosystem health
• Especially where public lands are being converted to biomass production,adaptation of production methods may be required to allow multi-purpose land-use
• Poor management practices could seriously reduce public acceptance ofbiomass

336CR/71038Final CAM Oct-01
Resource Production Utilizing Current Agricultural Lands
1 This is a work in progress by Oak Ridge National Laboratory (ORNL)
Proper management of agricultural residue collection is key to maintainsoil quality and to avoid erosion and increased runoff contamination.• Sufficient residues must be left on the field to maintain soil carbon
– The fraction of residues that must be left on the field varies from site to site– Soil carbon balances are being taken into account in many agricultural crop residue
feedstock analyses
• Erosion control must be maintained with agricultural residue collection– Erosion models and field data identify amounts of residues that must be left on the
field to significantly reduce impact on highly erosive sites– Agricultural crop residue feedstock analyses are applying erosion factors and are
excluding lands with high erosion indices from residue collection1
• Soil compaction can occur with agricultural residue collection if not properlymanaged– Harvesting and collection equipment and practices must minimize passes and soil
compaction
• Agricultural residue collection offers potential benefit in the reduction ofairborne particulates by decreasing the frequency of in-field residue burns
• Leaving residues for soil carbon and erosion protection can minimize run-offcontamination concerns

337CR/71038Final CAM Oct-01
Converting traditional crop lands into energy crop production couldincrease soil carbon and nutrients.• Extensive rooting systems and litter of some energy crops can increase soil
carbon compared to traditional crops– Perennial grasses were found to replace 23% of soil carbon lost during decades of
prior tillage1
• Studies have found soil carbon increases after three growing seasons on sitesplanted with short rotation wood crops2 (SRWC) and switchgrass compared totraditional crops3
• Energy crop nutrients removed through runoff and harvesting are somewhatless compared to traditional crops1
• Energy crop harvest timing can conserve soil nutrients– After the growing season, plant nutrients can translocate to the roots and are not
removed with harvest
1 Mann, L. and V. Tolbert (2000). “Soil Sustainability in Renewable Biomass Plantings”, Royal Swedish Academy of Sciences 2000, Ambio Vol. 29, no. 8.2 Short rotation woody crops such as sweetgum, sycamore, and cottonwood.3 Tolbert, V., et al. (2000). “Increasing below-ground carbon sequestration with conversion of agricultural lands to production of bio-energy crops”, New
Zealand Journal of Forestry Science, Vol. 30, p. 138-149.
Resource Production Converting Current Agricultural Lands Soil Carbon & Nutrients

338CR/71038Final CAM Oct-01
• New plantings of woody energy crops (such as poplar) and bunchgrasses(such as switchgrass) can result in levels of erosion similar to tilled agriculturalfields
• Using cover crops can reduce erosion by 64% during the early years of standdevelopment2– However, competition by cover crops could reduce growth3
– Different cover crops and management practices may reduce potential competition2
• Erosion after the second year of energy crop establishment are as low as orlower than losses with no-till corn1
• Energy crops should reduce compaction due to fewer equipment passesannually and over the energy crop lifetime
1 Mann, L. and V. Tolbert (2000). “Soil Sustainability in Renewable Biomass Plantings”, Royal Swedish Academy of Sciences 2000, Ambio Vol. 29, no. 8.2 Malik, R.K., et al. (2000). “Use of Cover Crops in Short Rotation Hardwood Plantations to Control Erosion”, Biomass and Bioenergy, Vol. 18, p. 479-487.3 There is a work in progress to investigate this issue, see note 2.
Resource Production Converting Current Agricultural Lands Erosion & Compaction
Energy crop production can have erosion concerns unless precautions aretaken.

339CR/71038Final CAM Oct-01
• Converting traditional cropland to energy crops can result in reduced nitrate,phosphorous, pesticides, and herbicides1 in runoff– In field studies, subsurface herbicide transport did not occur and off-site chemical
transport was minimal compared with traditional crops2
• Willow, poplar, and grasses have been used to remove nutrients and metalcontaminates from waste water, historical agricultural applications, andcontaminated shallow groundwater
• Surveys have shown that breeding birds and small mammals use hybridpoplars and short-rotation woody crops more extensively than traditional rowcrops3
– However, use was lower than in surrounding forested areas and habitat sensitive birdsdid not use the energy crop plantings
• Establishing energy crops adjacent to diverse land use and providing within itplanting diversity can increase their quality and use for wildlife
1 Mann, L. and V. Tolbert (2000). “Soil Sustainability in Renewable Biomass Plantings”, Royal Swedish Academy of Sciences 2000, Ambio Vol. 29, no. 8.2 Tolbert, V.R. (2000). “Ensuring Environmentally Sustainable Production of Dedicated Biomass Feedstocks”. Bioenergy 2000. The Ninth Biennial Bioenergy
Conference, October 15-19, 2000.2 Lindberg, J.E, et al. (1998). “Determining Biomass Crop Management Strategies to Enhance Habitat Value for Wildlife”. Bioenergy ‘98, Vol. II, p. 1322-1332.
Resource Production Converting Current Agricultural Lands Run-off & Biodiversity
Converting traditional crop lands into energy crop production could resultin benefits of reduced runoff contamination and improved biodiversity.

340CR/71038Final CAM Oct-01
Less productive, erosive, or degraded agricultural lands are anticipated tobe used initially for energy crop production.• The potential for environmental impacts from site preparation and production
on these lands is greater and the yields probably less than on more productivelands
• However, environmental gains and benefits, especially in soil quality andcarbon storage, are expected1
• Minimizing environmental impacts through proper management practices willbe required
• Management practices will need to be site and energy crop or residue specific
1 Tolbert, V.R. (2000). “Ensuring Environmentally Sustainable Production of Dedicated Biomass Feedstocks”. Bioenergy 2000. The Ninth Biennial BioenergyConference, October 15-19, 2000.
Marginal lands need to be carefully managed to realize net benefits fromenergy crop production.
Resource Production Utilizing Marginal Lands
341CR/71038Final CAM Oct-01
• Residue collection as a means to combat uncontrolled forest fires couldpotentially reduce:– Unwanted air borne particulates– Habitat destruction– Animal and human fatalities
• Proper management is required in order to reap net benefits– Residue collection on steep slopes or highly erosive soils could result in erosion– Increased soil compaction could occur if additional equipment is required– Soil carbon could be lost if excessive removal occurs
• Residue collection management can benefit biodiversity with increased habitatand structural diversity
Resource Production Utilizing Forest Lands
Forest residue collection must be managed properly to prevent erosion andrealize benefits from fire prevention.

342CR/71038Final CAM Oct-01
Resource Production Summary
Bioenergy and bioproducts industries could provide environmentalbenefits, provided careful management practices are implemented.• Agricultural residue collection must be managed properly to maintain and/or
improve soil quality (e.g. organic matter, nutrients, and soil stability) and avoidincreased runoff contamination
• Converting traditional crop lands into perennial energy crop production couldyield net benefits in increased soil carbon and nutrients– Energy crop production can have erosion concerns unless managed properly– Reduced runoff contamination and improved biodiversity are additional potential
benefits
• Marginal lands need to be carefully managed to realize net benefits fromenergy crop production
• Forest residue collection must be managed properly to prevent erosion andrealize benefits from fire prevention
• Several areas of additional research are necessary to assess the potentialenvironmental impacts and benefits of bioenergy and bioproducts industries– The information currently available is based on smaller scale studies– Studies at larger scale are needed to validate results and determine landscape scale
effects

343CR/71038Final CAM Oct-01
Several areas of additional research are necessary to assess the potentialbenefits and impacts of bioenergy and bioproducts industries.• Effects of energy crop production on marginal lands with comparison to
existing practices needs more quantification– Larger scale studies may be required– Development of appropriate management practices for different crops and sites are
required
• Long term studies on energy crop effects on soil and water quality are needed• Site-specific erosion factors1 and collection equipment effects on soil
compaction need to be analyzed for agricultural and forest residue collection• Agricultural residue collection effects on run-off contamination needs to be
evaluated– Additional studies are needed for the residue amount needed for sufficient soil quality
and maintenance of soil carbon
• Forest residue collection effects on biodiversity needs to be evaluated– Additional studies are needed for the residue amount needed for sufficient soil quality
and maintenance of soil carbon
1 This is a work in progress for agricultural residue collection by ORNL.
Resource Production Data Gaps

344CR/71038Final CAM Oct-01
Scenario Analysis
4
Policy Options
5
Conclusions & Recommendations
6
Benefit and Impact Analysis
7
Table of Contents
Identification of Options
Background & Objectives
Executive Summary
3
1
0
Baseline Use of Biomass2
• Resource Assessment•• Fossil Chain BaselinesFossil Chain Baselines• Biopower Options• Biofuel Options• Bioproduct Options

345CR/71038Final CAM Oct-01
Throughout the report, each potential fuel/power/product was analyzed ona “value chain” basis: from plantation/collection site to the market of use.
Fossil Chain Baselines Analytical Approach Value Chain Analysis
Value Chain Analysis:• Considers all steps involved in production and use of biomass energy, fuels and products• Incorporates multiplicative effects in value chain• Allows for detailed analysis of each module and consideration of a range of combinations• Considers all energy inputs into the value chain, including secondary not tertiary inputs; i.e. energy used to
produce diesel for trucks is included but energy use to make the trucks or the refinery is not included
End-useMarketingDistributionProduction/ConversionBiomass TransportBiomass Production
Energy InCapital Expense
Operating Expense
Energy In
Emissions Out Emissions Out
Energy InCapital Expense
Operating Expense
Emissions Out
Energy InCapital Expense
Operating Expense
Emissions Out
Energy InCapital Expense
Operating Expense
Emissions Out
Energy InCapital Expense
Operating Expense
Emissions Out
Biopower, all pieces, including energy losses of transmission and distribution(but not investment costs of transmission and distribution)
Biofuels, “well to wheel” analysis, not including vehicle retrofit costs
Bioproducts, up to primary processing plant-gate
A life cycle analysis was not part of the scope of this study.

346CR/71038Final CAM Oct-01
Fossil Chain Baselines Electricity Generation Value Chain Analysis
The complexity of the biopower market predicted the use of three distinctbaselines for the comparison fossil alternative.
Exploration&Production
FuelTransport
Coal Rankine Electricity Natural gas GTCC Grid Average Electricity
• Emissions are associated withcoal mining based on 1987U.S. Coal Industry Statisticsand DeLuchi, November 1993,based on DoC Census
• Coal bed methane releasedduring mining is included inemissions (90% vented; 10%used for fuel)
• Emissions are associated withextracting the natural gas fromthe well head and associatedemissions from processing ofthe gas (e.g. removal of inerts,recoverable products (NGLs,LPG), and removal ofimpurities)
• No gas flaring or ventingincluded. Gas flaringassociated with oil productionassigned to fuels production
• Emissions are associated witha transportation mix of ship(18%), rail (65%), and truck(15%); transportation mix basedon DeLuchi; total transportamount from 2000 data
ElectricityGeneration
• Coal Rankine power productionwith a HHV efficiency of 32.9%
• Did not include steam (heat)production credit
• Transmission & distributionenergy losses of 7.2%
• Emissions associated withnational average pipeline fornatural gas. Based on totalnatural gas supply since this isthe amount shipped throughU.S. pipelines annually.
• Natural gas-fired GTCC powerproduction with a HHVefficiency of 54.0%
• Transmission & distributionenergy losses of 7.2%
• Emissions are based on that fromcoal, natural gas, and nucleargenerated power
• Transmission & distribution energylosses of 7.2%
Coal
Oil
Gas
Other
Nuclear
Other Non-fossil
51.8
2.4
16.1
0.8
18.4
10.4
% Mix Efficiency
32.2%
32.6%
32.9%
32.5%
32.5%
32.5%

347CR/71038Final CAM Oct-01
Fossil Chain Baselines Petroleum Transportation Fuels Value Chain Analysis
Biofuels were compared to a gasoline fuel chain or a diesel petroleumchain depending on engine use (spark versus compression ignition).
Exploration&Production
Raw OilTransport
Gasoline Petroleum Diesel
• Petroleum extraction from Petroleum Extraction - 1987 DoC Census Data adjusted by DeLuchi (1993)including Alaska and Lower 48 Production
• Includes natural gas flared during production. The natural gas is flared or used as fuel onsite• Segment efficiency 95.8%
• Emissions are associated with shipping crude oil within Lower 48 and from Alaska to Lower 48 and shipping ofoil imported into United States.
• Modes of transport included pipeline, barge, tanker, train, and truck• Includes evaporative losses; segment efficiency of 99.1%
FuelProduction
• Includes refining from petroleum for gasolineproduction with a segment efficiency of 87.8%
• Includes refining from petroleum for gasoline productionwith a segment efficiency of 94.8%
FuelDistribution
• Includes emissions associated with transportof the gasoline to the bulk terminal by acombination of pipeline; tanker and barge;truck transport to the bulk plant and trucktransport to the fueling stations
FuelMarketing
• Includes energy usage at fueling stations andevaporative losses
• Includes emissions associated with transport of the dieselto the bulk terminal by a combination of pipeline; tankerand barge; truck transport to the bulk plant and trucktransport to the fueling stations
• Includes energy usage at fueling stations and evaporativelosses
Vehicle Use• Use in spark ignition vehicle with 15.7%
efficiency• Emissions are set to ULEV standards
• Use in CIE vehicle with 16.9% efficiency• Emissions are set to ULEV standards• Particulate matter set to 100,000 mile durability standards
for new 2001-2003 Model Year TLEV vehicles

348CR/71038Final CAM Oct-01
Fossil Chain Baselines Industrial Intermediates Value Chain Analysis
Two proxies of petroleum products were used for a high level comparison:methanol from natural gas and LPG from petroleum.
Exploration &Production
Raw FuelTransport
Methanol from Natural Gas LPG from Petroleum
• Petroleum extraction from Petroleum Extraction -1987 DoC Census Data adjusted by DeLuchi (1993)including Alaska and Lower 48 Production
• Includes natural gas flared during oil production• Segment efficiency 95.8%
• Emissions are associated with shipping crude oilwithin Lower 48 and from Alaska to Lower 48 andshipping of oil imported into United States.
• Modes of transport included pipeline, barge, tanker,train, and truck
• Includes evaporative losses; segment efficiency of99.1%
PrimaryProductManufacture
• Methanol synthesis from synthesis gas madefrom natural gas with segment efficiency of66.5%
• Includes refining from petroleum for LPG productionwith a segment efficiency of 95.3%
• Emissions are associated with extracting thenatural gas from the well head and associatedemissions from processing of the gas (e.g.removal of inerts, recoverable products(NGLs, LPG), and removal of impurities)
• Emissions associated with national averagepipeline for natural gas. Based on TotalNatural Gas Supply since this is the amountshipped through U.S. pipelines annually.
349CR/71038Final CAM Oct-01
Fossil Chain Baselines Bioenergy & Bioproducts Fuel Chain Analysis Scope of Analysis
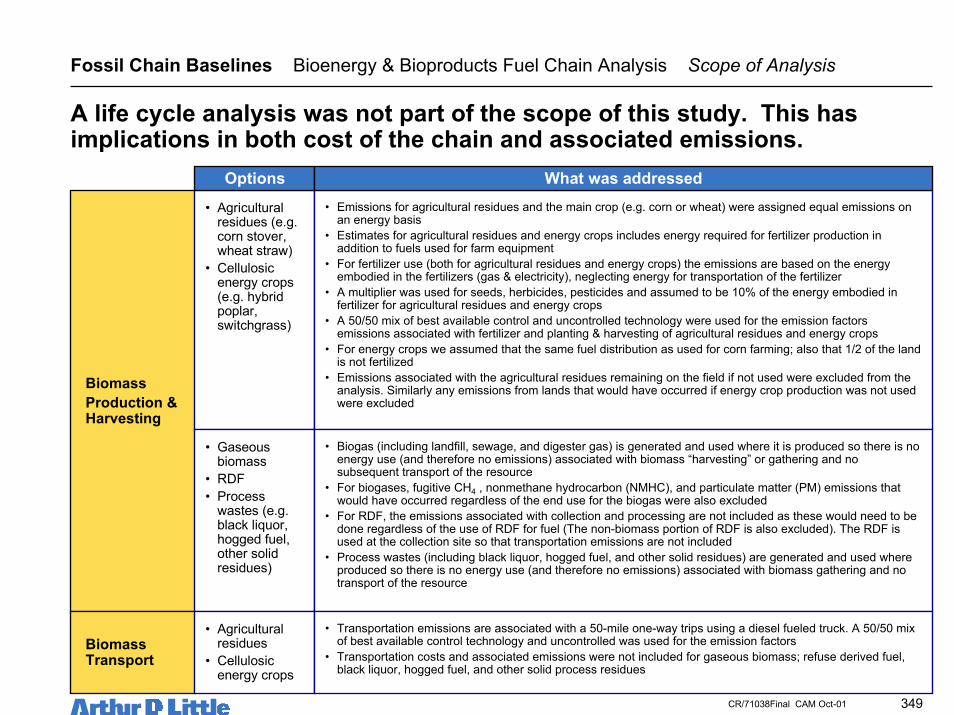
BiomassProduction &Harvesting
• Agriculturalresidues (e.g.corn stover,wheat straw)
• Cellulosicenergy crops(e.g. hybridpoplar,switchgrass)
Options• Emissions for agricultural residues and the main crop (e.g. corn or wheat) were assigned equal emissions on
an energy basis• Estimates for agricultural residues and energy crops includes energy required for fertilizer production in
addition to fuels used for farm equipment• For fertilizer use (both for agricultural residues and energy crops) the emissions are based on the energy
embodied in the fertilizers (gas & electricity), neglecting energy for transportation of the fertilizer• A multiplier was used for seeds, herbicides, pesticides and assumed to be 10% of the energy embodied in
fertilizer for agricultural residues and energy crops• A 50/50 mix of best available control and uncontrolled technology were used for the emission factors
emissions associated with fertilizer and planting & harvesting of agricultural residues and energy crops• For energy crops we assumed that the same fuel distribution as used for corn farming; also that 1/2 of the land
is not fertilized• Emissions associated with the agricultural residues remaining on the field if not used were excluded from the
analysis. Similarly any emissions from lands that would have occurred if energy crop production was not usedwere excluded
What was addressed
• Gaseousbiomass
• RDF• Process
wastes (e.g.black liquor,hogged fuel,other solidresidues)
• Biogas (including landfill, sewage, and digester gas) is generated and used where it is produced so there is noenergy use (and therefore no emissions) associated with biomass “harvesting” or gathering and nosubsequent transport of the resource
• For biogases, fugitive CH4 , nonmethane hydrocarbon (NMHC), and particulate matter (PM) emissions thatwould have occurred regardless of the end use for the biogas were also excluded
• For RDF, the emissions associated with collection and processing are not included as these would need to bedone regardless of the use of RDF for fuel (The non-biomass portion of RDF is also excluded). The RDF isused at the collection site so that transportation emissions are not included
• Process wastes (including black liquor, hogged fuel, and other solid residues) are generated and used whereproduced so there is no energy use (and therefore no emissions) associated with biomass gathering and notransport of the resource
BiomassTransport
• Agriculturalresidues
• Cellulosicenergy crops
• Transportation emissions are associated with a 50-mile one-way trips using a diesel fueled truck. A 50/50 mixof best available control technology and uncontrolled was used for the emission factors
• Transportation costs and associated emissions were not included for gaseous biomass; refuse derived fuel,black liquor, hogged fuel, and other solid process residues
A life cycle analysis was not part of the scope of this study. This hasimplications in both cost of the chain and associated emissions.

350CR/71038Final CAM Oct-01
Biopower
• Resources–Biogases (e.g.landfill,sewage, &digester gases)
–Agriculturalresidues
–Energy Crops–RDF–Black liquor–Hogged fuel–Other solidresidues
• Technologiesincluded:
–Rankine cycle–Gas turbine–Gas turbinecombined cycle
–Integratedgasificationcombined cycle
–Internalcombustionengine
–Fuel cell
Options• CO2 emissions from the utilization of the biomass itself are assumed to be zero (closed-loop
carbon cycle)• Biogas (including landfill, sewage, & digester gas), RDF, black liquor, hogged fuel, and other
solid residues are generated and used where it is produced so there is no energy use (andtherefore no emissions) associated with transport. Fugitive CH4, NMHC, & PM emissions thatwould have occurred regardless of the end use were also excluded
• Grid-sited options (e.g. utilization of landfill gas, co-firing with coal) include the effects oftransmission & distribution energy losses
• Most biomass is relatively low in sulfur and therefore no controls are used. For selectedfeedstocks that are higher in sulfur, such as black liquor, sulfur control technology was used
• Fuel cell emissions of SO2 are effectively zero, as the fuel must be scrubbed free of sulfur toavoid poisoning of the fuel cell stack
• NOx emissions estimates are consistent with typical controls (e.g., dry low NOx combustion forgas turbines, lean burn technology for internal combustion engines)
• For co-firing with coal it is assumed that each percentage point of biomass co-firing (on aenergy basis) results in a 2 percentage point decrease in overall NOx for direct firing and a 4percentage point decrease for gasification co-firing (the latter is consistent with the use of thebiomass as a reburn technology)
• For co-firing with coal it is assumed that methane, NMHC and CO emissions are the same perBTU of fuel consumed as for the baseline coal plant, so that differences in emissions per kWhare related to differences in efficiency
• For biomass co-firing with coal, the co-firing is assumed to reduce PM emissions based on therelative ash content of biomass and coal
• Methane, NMHC emissions are generally uncontrolled emissions consistent with current goodpractices for combustion (e.g., dry low NOx combustion for gas turbines, lean burn technologyfor internal combustion engines)
• PM emissions are generally controlled emissions consistent with current good practices (e.g.,electrostatic precipitators)
• CO emissions are generally uncontrolled emissions consistent with current good practices forcombustion (e.g., dry low NOx combustion for gas turbines, lean burn technology for internalcombustion engines)
What was addressed
Closed-loop carbon cycle was assumed (net zero biomass CO2 emissions)for biopower.
Fossil Chain Baselines Bioenergy & Bioproducts Fuel Chain Analysis Scope of Analysis

351CR/71038Final CAM Oct-01
Biofuels
• Agriculturalresidues
• Energy Crops• Corn• Technologies
included:–Ethanolproduction fromcorn
–Ethanolproduction fromcellulosics
–Fischer-Tropsch dieselproduction fromagriculturalresidues orenergy crops
Options• CO2 emissions from the utilization of the biomass itself or its end product (i.e. the produced
fuel) are assumed to be zero (closed-loop carbon cycle)• Carbon dioxide and sulfur dioxide emission are based upon the elemental composition of the
fuel and the chain efficiency• For fuel manufacture, emissions within the plant gate are assumed to be from best available
control technology. The exception is any vehicles used to move the biomass within the plantgate. These vehicles are assumed to be fueled with petroleum-diesel and have 50/50 emissionsassociated with a mix of uncontrolled and best available control technology
• All grid electricity used for manufacture of the fuel used a grid average mix for emissionsestimation
• Emissions are included for distribution of the fuel to depot stations and transport to retailstations. Evaporative losses are included for retail marketing of the fuel
• Emissions are associated with the biomass portion of the fuel only for blending applications• The vehicle emissions are based on that the vehicle is designed to meet the emission standard
(ULEV), regardless of the fuel used. Regulated emissions for each fuel are set by the relevantemission standards
– NOx, CO, and nonmethane hydrocarbon standards are set by the 50,000 mile durabilityULEV standards for 2001-2006 Model Year for all passenger car’s and light-duty trucks (0-3750 lbs LVW)
– Particulate matter for compression ignition engines are the 100,000 mile durabilitystandards for new 2001-2003 Model Year TLEV passenger cars and light duty trucks
– Methane emissions are calculated from correlations based on the amount on nonmethanehydrocarbon emissions
– The effect of ethanol as an oxygenate on emissions in the vehicle was not taken intoaccount
What was addressed
Closed-loop carbon cycle was assumed (net zero biomass CO2 emissions)for biofuel use. Regulated emissions used ULEV standards.
Fossil Chain Baselines Bioenergy & Bioproducts Fuel Chain Analysis Scope of Analysis

352CR/71038Final CAM Oct-01
Bioproducts
• Agriculturalresidues
• Energy Crops• Seed oils• Corn• Technologies
included:–Fermentation–Oil Splitting oflipids
–Hightemperaturepyrolysis
–Syngas basedprocesses
Options
• The biobased chemicals value chains were analyzed up to the wholesale level. Thus we did notanalyze the potential impacts of changes in product design and usage. The implicit assumptionwas that the biobased chemicals would have comparable performance. For example, anyincreases or decreases in the weight of the final products could impact transportation costs ofthe products, or change energy use in the use of the product.
• Also, energy use and emissions impacts associated with the end of the life of the chemical isnot considered. We expect that on balance, the impact of this limitation will be neutral, sincesome bio-based chemicals will perform better, while others will perform less well. Thus carbonincorporated in the product is considered as sequestered
• For primary product manufacture, emissions within the plant gate are assumed to be from bestavailable control technology. The exception is any vehicles used to move the biomass within theplant gate. These vehicles are assumed to be fueled with petroleum-diesel and have 50/50emissions associated with a mix of uncontrolled and best available control technology
• All grid electricity used for manufacture of the primary product used a grid average mix foremissions estimation
• For fermentation based processes utilizing glucose; we included the comparable emissions togrow and transport the raw corn but did not include the emissions associated with making theglucose from starch in a wet or dry corn mill
• Similarly for oil seed based materials; the emissions were assessed for the processing of theseed oil to make the product but did not include the upstream emissions associated withgrowing the plant, harvesting the seed, transporting the seed, and recovering the raw oil fromthe seed
• Fugitive emissions from biomass stockpiles on the plant site or fugitive emissions associatedwith unused crop or resource materials were excluded
What was addressed
Products were analyzed up to wholesale level. The carbon in thebioproduct was treated as if it were “sequestered” carbon.
Fossil Chain Baselines Bioenergy & Bioproducts Fuel Chain Analysis Caveats

353CR/71038Final CAM Oct-01
Scenario Analysis
4
Policy Options
5
Conclusions & Recommendations
6
Benefit and Impact Analysis
7
Table of Contents
Identification of Options
Background & Objectives
Executive Summary
3
1
0
Baseline Use of Biomass2
• Resource Assessment • Fossil Chain Baselines•• Biopower OptionsBiopower Options• Biofuel Options• Bioproduct Options

354CR/71038Final CAM Oct-01
Biopower Impacts Analysis Air Emission Impact
Air emissions (in gm/kWh delivered) were evaluated for the biopoweroptions retained in the screening process.• Greenhouse gas and priority pollutants were evaluated
– Carbon dioxide (CO2)– Sulfur dioxide (SO2)– Nitrogen oxides (NOx)– Methane (CH4)– Non-methane hydrocarbons (NMHC)– Particulate matter (PM)– Carbon monoxide (CO)
• CO2 emissions from the biomass power generation step of the fuel chain wereassumed to be zero (closed-loop carbon cycle)– CO2 emissions occur when other fuels and materials (e.g., chemical fertilizers) are
used to grow, harvest, transport and process the biomass
• Results from the analyses can be found in tables in the Data Volume

355CR/71038Final CAM Oct-01
The nature of the biopower opportunities required the development ofseveral baselines in order to compare emissions benefits and impacts.
Existing Coal PowerPlants
• These biomass options have the specificimpact of displacing existing coal capacity
• Baseline emissions data developed fromDOE/EIA data as reported in the ElectricPower Annual 1998
Baseline Comments
• Direct combustion – co-firing biomassRankine cycle (with coal)
• Gasification – co-firing biomass Rankinecycle (with coal)
Applicable Biopower Options
New Gas-fired GasTurbine CombinedCycle Power Plants
(GTCC)
• These biomass options compete with othernew capacity, which is expected to bepredominantly natural gas fired GTCC
• Baseline emissions data developed by ArthurD. Little for new, state-of-the-art facilities
• Gasification – co-firing biomass GTCC(with natural gas)
• RDF Gasification• All biogas combustion options• Gasification of process wastes
Biopower Air Emission Impact Baseline Definition

356CR/71038Final CAM Oct-01
With the exception of methane and NMHC, most emissions fromconventional coal plants occur during the actual electricity generation step.
Biopower Air Emissions Baselines - Coal Rankine
1. The shown emissions reflects transmission and distribution energy losses of 7.2 percent.
Full Fuel Chain Air Emissions of Coal Rankine, All in Grams per kWh Delivered
0
200
400
600
800
1,000
1,200gm
CO
2 pe
r kW
h de
liver
edPower generationFuel TransportationFuel Production
0
1
2
3
4
5
6
7
gm S
O2
per k
Wh
deliv
ered
0.0
0.5
1.0
1.5
2.0
2.5
3.0
3.5
4.0
gm N
Ox
per k
Wh
deliv
ered
0.0
0.5
1.0
1.5
2.0
2.5
3.0
gm m
etha
ne p
er k
Wh
deliv
ered
CO2 SO2 NOx Methane

357CR/71038Final CAM Oct-01
Biopower Air Emissions Baselines - Coal Rankine
1. The shown emissions reflects transmission and distribution energy losses of 7.2 percent.
Full Fuel Chain Air Emissions of Coal Rankine, All in Grams per kWh Delivered
0.000
0.005
0.010
0.015
0.020
0.025
0.030
0.035gm
NM
HC p
er k
Wh
deliv
ered
Power generationFuel TransportationFuel Production
0.0
0.2
0.4
0.6
0.8
1.0
1.2
gm P
M p
er k
Wh
deliv
ered
0.00
0.02
0.04
0.06
0.08
0.10
0.12
0.14
0.16
gm C
O p
er k
Wh
deliv
ered
NMHC PM CO
With the exception of methane and NMHC, most emissions fromconventional coal plants occur during the actual electricity generation step.
358CR/71038Final CAM Oct-01
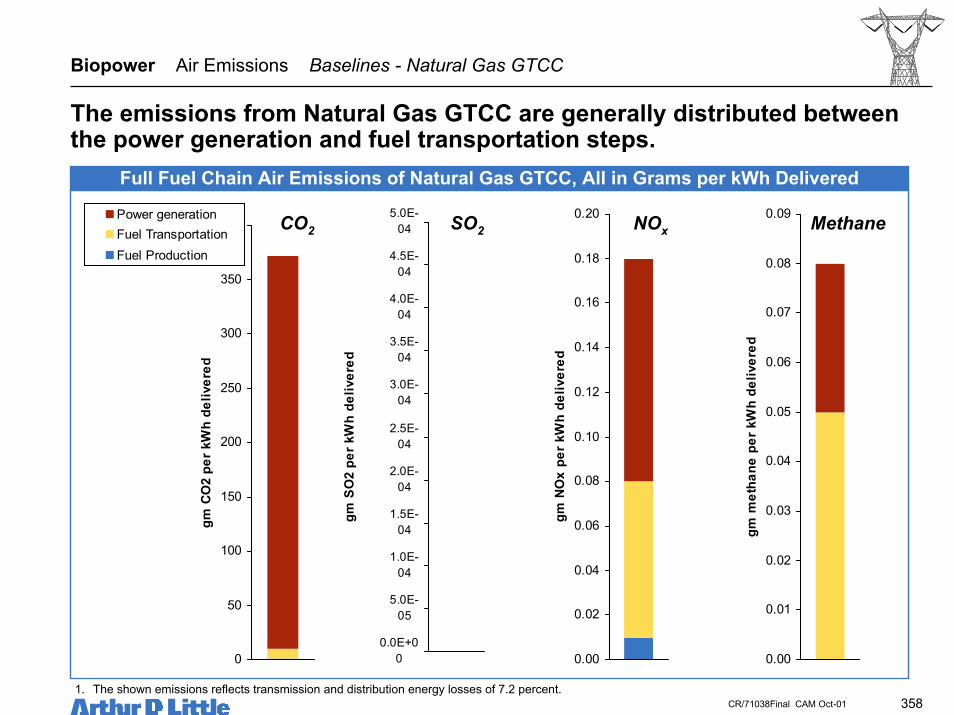
The emissions from Natural Gas GTCC are generally distributed betweenthe power generation and fuel transportation steps.
Biopower Air Emissions Baselines - Natural Gas GTCC
1. The shown emissions reflects transmission and distribution energy losses of 7.2 percent.
Full Fuel Chain Air Emissions of Natural Gas GTCC, All in Grams per kWh Delivered
0
50
100
150
200
250
300
350
400gm
CO
2 pe
r kW
h de
liver
edPower generationFuel TransportationFuel Production
0.0E+00
5.0E-05
1.0E-04
1.5E-04
2.0E-04
2.5E-04
3.0E-04
3.5E-04
4.0E-04
4.5E-04
5.0E-04
gm S
O2
per k
Wh
deliv
ered
0.00
0.02
0.04
0.06
0.08
0.10
0.12
0.14
0.16
0.18
0.20
gm N
Ox
per k
Wh
deliv
ered
0.00
0.01
0.02
0.03
0.04
0.05
0.06
0.07
0.08
0.09
gm m
etha
ne p
er k
Wh
deliv
ered
CO2 SO2 NOx Methane

359CR/71038Final CAM Oct-01
Biopower Air Emissions Baselines - Natural Gas GTCC
1. The shown emissions reflects transmission and distribution energy losses of 7.2 percent.
Full Fuel Chain Air Emissions of Natural Gas GTCC, All in Grams per kWh Delivered
0.000
0.005
0.010
0.015
0.020
0.025gm
NM
HC p
er k
Wh
deliv
ered
Power generationFuel TransportationFuel Production
0.000
0.005
0.010
0.015
0.020
0.025
gm P
M p
er k
Wh
deliv
ered
0.00
0.01
0.02
0.03
0.04
0.05
0.06
0.07
0.08
0.09
0.10
gm C
O p
er k
Wh
deliv
ered
NMHC PM CO
The emissions from Natural Gas GTCC are generally distributed betweenthe power generation and fuel transportation steps.

360CR/71038Final CAM Oct-01
Biopower Environmental Benefits Summary
Relative to the appropriate competitive power option, biopower typicallyoffers the greatest emissions benefits for CO2 and SO2.• In all cases CO2 reductions (per kWh) are significant, ranging from 65-100%• Except when compared to natural gas GTCC, biomass power results in significant SO2 reductions
(80-97%)– Biomass is generally much lower in sulfur than coal– In other processes (e.g. gasification) sulfur removal to very high levels is possible
• NOx benefits are more mixed, and generally are technology (versus fuel) dependent– Natural gas GTCC technology sets a very high standard for NOx (Low generation levels),– Biogas-fired GTCCs are expected to have similar NOx benefits depending upon the nitrogen content of the biogas– Biomass co-firing with coal has the potential for significant NOx benefits (e.g., 20% overall reduction for 10% co-
firing)– Reciprocating engines produce levels of NOx comparable to or greater than the grid average unless special control
equipment is used
• Emissions of CH4, non-methane hydrocarbons and carbon monoxide, are generally unaffected by theuse of biomass as a fuel with the exception of coal based power– Emissions of CH4 are reduced with biomass co-firing with coal by avoiding coal production emissions of methane
• Advanced biopower conversion technologies should produce particulate matter (PM) reductions– All technologies that convert landfill gas or other biogases produce less PM than the grid average– Co-firing biomass options do not produce PM reductions
• The solid waste and water effluent impact are expected to be moderate and manageable– Most biomass is low in ash and in most cases, the ash is non-toxic and can actually have value as fertilizer– Water effluents can contain suspended solids and biological oxygen demands but toxicity is not usually a serious
concern

361CR/71038Final CAM Oct-01
Assumptionsand
Methodology
• CO2 emissions from the utilization of the biomass itself are assumed to be zero (closed-loop carbon cycle)– CO2 emissions occur when other fuels and materials (e.g., chemical fertilizers, seeds, pesticides) are
used to grow, harvest, transport and process the biomass• Grid-sited options include the effects of transmission & distribution energy losses (i.e., results are shown
per kWh delivered)• Biogas (including landfill, sewage, and digester gas) is generated and used where it is produced so there
is no energy use (and therefore no CO2 emissions) associated with biomass production and transport• For RDF, the emissions associated with collection and processing are not included as these would need
to be done regardless of the use of RDF for fuel– The non-biomass portion of RDF is also excluded
Comments
• For agricultural residues and energy crops, many biomass fuel types are possible. Poplar is used here asan example of a woody biomass resource that would be grown as an energy crop
• For the remaining solid biomass feedstocks (e.g., switchgrass, corn stover), the range of total emissions(i.e., all value chain steps) is given on top of the detailed breakdown for poplar
Conclusions
• Biopower CO2 emissions are associated mainly with feedstock production (where applicable)– This is also generally true for the feedstocks for which only the totals are shown
• Biomass transport and handling are secondary sources of CO2 emissions• All grid-based biopower options produce significant (>65%) reductions in CO2 emissions, per kWh
delivered– The lowest levels of reductions are relative to natural gas GTCC power plants, but only for the
feedstocks with high production and transport related energy requirements• Onsite use of biomass produces even greater CO2 benefits, per kWh
– Reductions of 93-97% are possible, relative to a high efficiency gas-fired GTCC
All biopower options produce significant (65-80%) reductions in CO2emissions, per kWh delivered.
Biopower Air Emissions Carbon Dioxide

362CR/71038Final CAM Oct-01
0 10 20 30 40 50 60 70 80 90
Poplar Gasification Co-fire (w/coal)
Poplar Direct Co-fire (w/ coal)
Poplar Gasification Co-fire (w/NG)
RDF IGCC
Total CO2 Emissions (g/kWh delivered)
Fuel Production
Fuel Transportation
Power generation
Biopower CO2 emissions are associated mainly with biomass productionand secondarily with biomass handling on-site.
Biopower Air Emissions Carbon Dioxide
1. The shown emissions reflects transmission and distribution energy losses of 7.2 percent.2. Landfill gas options are not shown because new emissions of CO2 are zero.3. The biomass feedstocks used for gasification co-firing with natural gas were corn stover, wheat straw, woody biomass (poplar), and switchgrass; the
range shown reflects the full chains using these other feedstocks
Full Fuel Chain Air Emissions of Selected Biopower OptionsGrid Power Options — CO2 (g/kWh delivered)
184
220
30
36
13322
Emissions of a natural gas combined cycle plant = 371 g/kWh. Emissions of a coal fired plant = 1054 g/kWh
Range for all other feedstock options

363CR/71038Final CAM Oct-01
0 5 10 15 20 25 30
GTCC - Black Liquor
GTCC - Hogged Fuel & Bark
Direct Rankine - SolidResidues
Gasification ICE - SolidResidues
Gasification GT - SolidResidues
Total CO2 Emissions (g/kWh)
Fuel Production
Fuel Transportation
Power generation
As would be expected, all biopower options result in significant CO2reductions over the competing conventional options.
Biopower Air Emissions Carbon Dioxide
Full Fuel Chain Air Emissions of Selected Biopower OptionsOn Site Options — CO2 (g/kWh produced)
Process residues are generated and used onsite, so there are zeroemissions associated with “production” or transportation.
Emissions of a natural gas combined cycle plant = 371 g/kWh

364CR/71038Final CAM Oct-01
Assumptionsand
Methodology
• SO2 emissions occur both from the utilization of the biomass itself plus from the use of other fuels andmaterials (e.g., chemical fertilizers, pesticides), which are used to grow, harvest, transport and process thebiomass
• Grid-sited options include the effects of transmission & distribution energy losses (i.e., results are shownper kWh delivered)
• Biogas (including landfill, sewage and digester gas) is generated and used where it is produced so thereis no energy use (and therefore no SO2 emissions) associated with biomass production and transport
• For RDF, the emissions associated with collection and processing are not included as these would needto be done regardless of the use of RDF for fuel
– The non-biomass portion of RDF is also excluded
Comments
• For agricultural residues and energy crops, many biomass fuel types are possible. Poplar is used here asan example of a woody biomass resource that would be grown as an energy crop.
– For the remaining feedstocks (e.g., switchgrass, corn stover, wheat straw), the range of totalemissions (i.e., all value chain steps) is given on top of the detailed breakdown for poplar
• Most biomass is relatively low in sulfur and therefore no controls are used. For selected feedstocks thatare higher in sulfur, such as black liquor, sulfur control technology is used
Conclusions
• While significantly lower than coal SO2 emissions, biopower options do not offer superior SO2 emission toa natural gas GTCC, since natural gas is essentially a sulfur free fuel
• For landfill gas, all emissions are associated with the power generation step• For grid power using dedicated woody biomass feedstocks, emissions are split roughly equally between
biomass production and power generation• Biomass transport and handling add little SO2 emissions• Co-firing with coal options produce significant (75-97%) reductions in SO2 emissions, per kWh produced• Emissions of SO2 for onsite power options vary from about 0.04 g/kWh to 0.50 g/kWh, depending on the
fuel type and whether or not emissions control is used– Only the lowest levels of SO2 emissions, achievable only with sulfur control technology, approach the
levels of a natural gas GTCC• Fuel cell emissions of SO2 are effectively zero, as the fuel must be scrubbed free of sulfur to avoid
poisoning of the fuel cell stack
Biopower produces significant reduction in SO2 emissions relative to coal,but not to natural gas, a virtually sulfur-free fuel.
Biopower Air Emissions Sulfur Dioxide

365CR/71038Final CAM Oct-01
0.00 0.05 0.10 0.15 0.20 0.25 0.30 0.35 0.40
Poplar Direct Co-fire (w/ coal)
Poplar Gasification Co-fire (w/coal)
Poplar Gasification Co-fire (w/NG)
RDF IGCC
Landfill Gas GT
Landfill gas ICE
Landfill gas Rankine
Landfill gas GTCC
Total SO2 Emissions (g/kWh delivered)
Fuel Production
Fuel Transportation
Power generation
SO2 emissions from biopower depend strongly on the type of feedstockand whether or not emissions control is used (as it is with RDF IGCC).
1. The shown emissions reflects transmission and distribution energy losses of 7.2 percent.2. The biomass feedstocks used for co-firing options were corn stover, wheat straw, woody biomass (poplar), and switchgrass; the range shown reflects
the full chains using these other feedstocks
Full Fuel Chain Air Emissions of Selected Biopower OptionsGrid Power Options — SO2 (g/kWh delivered)
Biopower Air Emissions Sulfur Dioxide
Emissions of a natural gas combined cycle plant = <0.01 g/kWh. Emissions of a coal fired plant = 6.1 g/kWh
1.50.20
1.30.17
1.40.11
Range for all other feedstock options

366CR/71038Final CAM Oct-01
0.00 0.05 0.10 0.15 0.20 0.25 0.30 0.35 0.40 0.45 0.50
Digester gas - Fuel Cell
Sewage gas - ICE
Digester gas - ICE
Sewage gas - Rankine
Sewage gas - GTCC
Sewage gas - GT
Digester gas - GT
GTCC - Black Liquor
GTCC - Hogged Fuel
Direct Rankine - Solid Residues
Gasification ICE - Solid Residues
Gasification GT - Solid Residues
Total SO2 Emission (g/kWh)
Fuel Production
Fuel Transportation
Power generation
Biogases generally have higher sulfur content than solid biomass residues.
Full Fuel Chain Air Emissions of Selected Biopower OptionsOn Site Power Options — SO2 (g/kWh produced )
Biopower Air Emissions Sulfur Dioxide
Emissions of a natural gas combined cycle plant = <0.01 g/kWh.

367CR/71038Final CAM Oct-01
Assumptionsand
Methodology
• NOx emissions occur both from the utilization of the biomass itself plus from the use of other fuels and materials(e.g., chemical fertilizers), which are used to grow, harvest, transport and process the biomass
• Grid-sited options include the effects of transmission & distribution energy losses (i.e., results are shown per kWhdelivered)
• Biogas (including landfill, sewage, and digester gas) is generated and used where it is produced so there is noenergy use (and therefore no NOx emissions) associated with biomass production and transport
• For biomass co-firing with coal, the co-firing reduces the NOx emissions of the entire plant – all of these reductionsare credited to the biomass
• For RDF, the emissions associated with collection and processing are not included as these would need to be doneregardless of the use of RDF for fuel
– The non-biomass portion of RDF is also excluded
Comments
• For agricultural residues & energy crops, many biomass fuel types are possible. Poplar is used here as an exampleof a woody biomass resource that would be grown as an energy crop
– For the remaining feedstocks (e.g., switchgrass, corn stover, wheat straw), the range of total emissions (i.e., allvalue chain steps) is given on top of the detailed breakdown for poplar
• NOx emissions estimates are consistent with typical controls (e.g., dry low NOx combustion for gas turbines, leanburn technology for internal combustion engines)
• For co-firing with coal it is assumed that each percentage point of biomass co-firing results in a 2 percentage pointdecrease in overall NOx for direct firing and a 4 percentage point decrease for gasification co-firing (the latter isconsistent with the use of the biomass as a reburn technology)
Conclusions
• Biomass-only options do not result in lower NOx emissions relative to the natural gas GTCC baseline• However, biomass co-firing with coal has the potential to reduce NOx emissions for the entire plant
– Because these reduction are associated strictly with the act of co-firing, the result is negative NOx emissions forthe biomass, that are significant per kWh of biomass power produced
• The large natural gas GTCC baseline has the lowest emissions of NOx per BTU fuel consumed plus the highestefficiency, and therefore has the lowest per kWh emissions
• internal combustion engines typically have higher NOx emissions than other options, and at small scales, additionalexhaust cleanup technology is often not used (as has been modeled here), resulting in the highest NOx emissionsper kWh produced
• The results are similar for grid-sited and onsite power options• Fuel cell emissions of NOx are effectively zero, as NOx is a product of high-temperature combustion, which is absent
in the fuel cell
Biomass co-firing with coal yields substantial NOx savings, but most otheroptions are not better than a natural gas-fired GTCC.
Biopower Air Emissions Nitrogen Oxides

368CR/71038Final CAM Oct-01
In biomass co-firing with coal, the use of biomass has the potential toreduce considerably total plant NOx emissions.
Biopower Air Emissions Nitrogen Oxides – Grid Power
-10.0 -9.0 -8.0 -7.0 -6.0 -5.0 -4.0 -3.0 -2.0 -1.0 0.0 1.0 2.0
Poplar Direct Co-fire (w/ coal)
Poplar Gasification Co-fire (w/coal)
Poplar Gasification Co-fire (w/ NG)
RDF IGCC
Landfill gas ICE
Landfill gas Rankine
Landfill gas GT
Landfill gas GTCC
Total NOx Emissions (g/kWh delivered)
Fuel Production
Fuel Transportation
Power generation
Full Fuel Chain Air Emissions of Selected Biopower Options Grid Power— NOx (g/kWh delivered)
-8.1-8.9
-3.0-3.7
0.70.3
Emissions of a natural gas combined cycle plant = 0.2 g/kWh. Emissions of a coal fired plant = 3.7 g/kWh
Range for all other feedstock options
1. The shown emissions reflects transmission and distribution energy losses of 7.2 percent.2. The feedstocks used for the co-firing options were corn stover, wheat straw, woody biomass (poplar), and switchgrass; the range shown reflects the
full chains using these other feedstocks

369CR/71038Final CAM Oct-01
For onsite power options, an advantage for NOx does seem to be presentcompared to natural gas combined cycle technology.
Biopower Air Emissions Nitrogen Oxides – Onsite Power
0.0 0.5 1.0 1.5 2.0 2.5 3.0
Digester gas FC
Sewage gas ICE
Digester gas ICE
Sewage gas Rankine
Sewage gas GTCC
Sewage gas GT
Digester gas GT
GTCC-Black Liquor
GTCC-Hogged Fuel
Rankine-Solid Residues
ICE-Solid Residues
GT-Solid Residues
Total NOx Emissions (g/kWh)
Fuel Production
Fuel Transportation
Power generation
Full Fuel Chain Air Emissions of Selected Biopower OptionsOn Site Power — NOx (g/kWh produced)
Emissions of a natural gas combined cycle plant = 0.2 g/kWh.

370CR/71038Final CAM Oct-01
Assumptionsand
Methodology
• Methane emissions occur both from the utilization of the biomass itself plus from the use of other fuels and materials(e.g., chemical fertilizers), which are used to grow, harvest, transport and process the biomass
• Grid-sited options include the effects of transmission & distribution energy losses (i.e., results are shown per kWhdelivered)
• Biogas (including landfill, sewage, and digester gas) is generated and used where it is produced so there is no energyuse (and therefore no methane emissions) associated with biomass production and transport
– Fugitive CH4 emissions that would have occurred regardless of the end use for the biogas were also excluded• For biomass co-firing with coal, the co-firing is assumed to have no effect on overall methane emissions not counting
methane emission reductions from decreased use of coal• For RDF, the emissions associated with collection and processing are not included as these would need to be done
regardless of the use of RDF for fuel. (The non-biomass portion of RDF is also excluded)
Comments
• For agricultural residues & energy crops, many biomass fuel types are possible. Poplar is used here as an example ofa woody biomass resource that would be grown as an energy crop
– For the remaining feedstocks (e.g., switchgrass, corn stover, wheat straw), the range of total emissions (i.e., allvalue chain steps) is given on top of the detailed breakdown for poplar
• Methane emissions are generally uncontrolled emissions consistent with current good practices for combustion (e.g.,dry low NOx combustion for gas turbines, lean burn technology for internal combustion engines)
• For co-firing with coal it is assumed that biopower methane emissions are the same per BTU of fuel consumed as forthe baseline coal plant, so that differences in emissions per kWh are related to differences in efficiency
Conclusions
• With the exception of the internal combustion engine, biogas options generally should result in modest methaneemissions reduction relative to the baseline natural gas GTCC plant
– Internal combustion engine emissions could be lower than that shown here, if, for example, catalytic convertersare used to oxidize unburned hydrocarbons in the exhaust
• Because coal plants have inherently low emissions of methane, biomass co-firing with coal produces similarly lowlevels of methane emissions; when compared to full chain coal emissions; there is methane savings with co-firing withcoal
• The results are similar for grid-sited and onsite power options• Biomass-only gasification options are expected to produce less methane emissions than natural gas power plants
because methane typically constitutes approximately 10-20% by volume of the fuel gas• Fuel cell emissions of methane are effectively zero, as virtually all the methane is converted to hydrogen
– Any residual methane is then burned in a low-emissions burner to generate heat to run the fuel processor
Unlike CO2, SO2 and NOx, methane reduction is not as major anenvironmental driver for biomass power although reductions areaccomplished.
Biopower Air Emissions Methane

371CR/71038Final CAM Oct-01
Grid-sited biopower methane emissions are mainly an issue for biogasoptions such as landfill gas, particularly internal combustion engines.
Biopower Air Emissions Methane – Grid Power
0.00 0.02 0.04 0.06 0.08 0.10 0.12 0.14 0.16 0.18 0.20
Poplar Gasification Co-fire (w/coal)
Poplar Direct Co-fire (w/ coal)
Poplar Gasification Co-fire (w/ NG)
RDF IGCC
Landfill gas ICE
Landfill gas Rankine
Landfill gas GT
Landfill gas GTCC
Total Methane Emissions (g/kWh delivered)
Fuel Production
Fuel Transportation
Power generation
Full Fuel Chain Air Emissions of Selected Biopower OptionsGrid Power — CH4 (g/kWh delivered)
Emissions of a natural gas combined cycle plant = 0.079g/kWh. Emissions of a coal fired plant = 2.6 g/kWh
0.035 to 0.039
6.6
0.009 to 0.016
0.011 to 0.019
Range for all other feedstock options
1. The shown emissions reflects transmission and distribution energy losses of 7.2 percent.2. The feedstocks used for the co-firing options were corn stover, wheat straw, woody biomass (poplar), and switchgrass; the range shown reflects the
full chains using these other feedstocks

372CR/71038Final CAM Oct-01
Onsite biopower methane emissions are mainly an issue for biogas optionsand options utilizing internal combustion engines.
Biopower Air Emissions Methane – Onsite Power
0.00 0.02 0.04 0.06 0.08 0.10 0.12 0.14 0.16 0.18 0.20
Digester gas FC
Sewage gas ICE
Digester gas ICE
Sewage gas Rankine
Sewage gas GTCC
Sewage gas GT
Digester gas GT
GTCC-Black Liquor
GTCC-Hogged Fuel
Rankine-Solid Residues
ICE-Solid Residues
GT-Solid Residues
Total Methane Emissions (g/kWh)
Fuel Production
Fuel Transportation
Power generation
Full Fuel Chain Air Emissions of Selected Biopower OptionsOn Site Power — CH4 (g/kWh produced)
Emissions of a natural gas combined cycle plant = 0.079g/kWh.
1.9
6.6

373CR/71038Final CAM Oct-01
Assumptionsand
Methodology
• NMHC emissions occur both from the utilization of the biomass itself plus from the use of other fuels and materials(e.g., chemical fertilizers), which are used to grow, harvest, transport and process the biomass
• Grid-sited options include the effects of transmission & distribution energy losses (i.e., results are shown per kWhdelivered)
• Biogas (including landfill, sewage, and digester gas) is generated and used where it is produced so there is noenergy use (and therefore no NMHC emissions) associated with biomass production and transport
– Fugitive emissions that would have occurred regardless of the end use for the biogas were also excluded• For biomass co-firing with coal, the co-firing is assumed to have no effect on overall NMHC emissions• For RDF, the emissions associated with collection and processing are not included as these would need to be done
regardless of the use of RDF for fuel– The non-biomass portion of RDF is also excluded
Comments
• For agricultural residues & energy crops, many biomass fuel types are possible. Poplar is used here as an exampleof a woody biomass resource that would be grown as an energy crop
• For the remaining feedstocks (e.g., switchgrass, corn stover, wheat straw), the range of total emissions (i.e., all valuechain steps) is given on top of the detailed breakdown for poplar
• NMHC emissions are generally uncontrolled emissions consistent with current good practices for combustion (e.g.,dry low NOx combustion for gas turbines, lean burn technology for internal combustion engines)
• For co-firing with coal it is assumed that biopower NMHC emissions are the same per BTU of fuel consumed as forthe baseline coal plant, so that differences in emissions per kWh are related to differences in efficiency
Conclusions
• With the exception of the internal combustion engine, biogas options generally result in modest increases in NMHCemissions relative to the baseline natural gas GTCC plant
– internal combustion engine emissions could be lower than that shown here, if, for example, catalytic convertersare used to oxidize unburned hydrocarbons in the exhaust
• Because coal plants have inherently low emissions of NMHCs, biomass co-firing with coal produces similarly lowlevels of NMHC emissions
• The results are similar for grid-sited and onsite power options• Biomass-only gasification options are expected to produce higher NMHC emissions than natural gas power plants
because NMHCs can be found in higher levels in fuel gas than natural gas. The lower efficiencies also result inhigher per kWh emissions
• Fuel cell emissions of NMHCs are effectively zero, as virtually all the C2 and C3 NMHCs are converted to hydrogen– Any residual NMHCs are then burned in a low-emissions burner to generated heat to run the fuel processor
The situation with NMHCs is similar to that for methane – biomass does notyield significant reductions over the baseline.
Biopower Air Emissions Non-methane Hydrocarbons

374CR/71038Final CAM Oct-01
In cases where upstream steps are non-zero, they can be as important asthe power generation step
Biopower Air Emissions Non-methane Hydrocarbons – Grid Power
0.00 0.02 0.04 0.06 0.08 0.10 0.12 0.14 0.16 0.18 0.20
Poplar Gasification Co-fire (w/NG)
Poplar Gasification Co-fire (w/coal)
Poplar Direct Co-fire (w/ coal)
RDF IGCC
Landfill gas ICE
Landfill gas Rankine
Landfill gas GT
Landfill gas GTCC
Total NMHC Emissions (g/kWh delivered)
Fuel ProductionFuel TransportationPower generation
Full Fuel Chain Air Emissions of Selected Biopower OptionsGrid Power — NMHCs (g/kWh delivered)
Emissions of a natural gas combined cycle plant = 0.013 g/kWh. Emissions of a coal fired plant = 0.04 g/kWh
1.2
0.03 to 0.08
0.03 to 0.13
0.05 to 0.15
Range for all other feedstock options
1. The shown emissions reflects transmission and distribution energy losses of 7.2 percent.2. The feedstocks used for the co-firing options were corn stover, wheat straw, woody biomass (poplar), and switchgrass; the range shown reflects the
full chains using these other feedstocks

375CR/71038Final CAM Oct-01
For most onsite options, biomass does not offer benefits compared tonatural gas combined cycle technology.
Biopower Air Emissions Non-methane Hydrocarbons – Onsite Power
0.00 0.02 0.04 0.06 0.08 0.10 0.12 0.14 0.16 0.18 0.20
Digester gas FC
Sewage gas ICE
Digester gas ICE
Sewage gas Rankine
Sewage gas GTCC
Sewage gas GT
Digester gas GT
GTCC-Black Liquor
GTCC-Hogged Fuel
Rankine-Solid Residues
ICE-Solid Residues
GT-Solid Residues
Total NMHC Emissions (g/kWh)
Fuel Production
Fuel Transportation
Power generation
Full Fuel Chain Air Emissions of Selected Biopower OptionsOn Site Power — NMHCs (g/kWh produced)
Emissions of a natural gas combined cycle plant = 0.013 g/kWh.
1.2
1.1

376CR/71038Final CAM Oct-01
Assumptionsand
Methodology
• PM emissions occur both from the utilization of the biomass itself plus from the use of other fuels andmaterials (e.g., chemical fertilizers), which are used to grow, harvest, transport and process the biomass
• Grid-sited options include the effects of transmission & distribution energy losses (i.e., results are shownper kWh delivered)
• Biogas (including landfill, sewage, and digester gas) is generated and used where it is produced so thereis no energy use (and therefore no PM emissions) associated with biomass production and transport
– Fugitive emissions that would have occurred regardless of the end use for the biogas were alsoexcluded
• For biomass co-firing with coal, the co-firing is assumed to reduce PM emissions based on the relativeash content of biomass and coal
• For RDF, the emissions associated with collection and processing are not included as these would needto be done regardless of the use of RDF for fuel
– The non-biomass portion of RDF is also excluded
Comments
• For agricultural residues & energy crops, many biomass fuel types are possible. Poplar is used here as anexample of a woody biomass resource that would be grown as an energy crop
– For the remaining feedstocks (e.g., switchgrass, corn stover, wheat straw), the range of totalemissions (i.e., all value chain steps) is given on top of the detailed breakdown for poplar
• PM emissions are generally controlled emissions consistent with current good practices (e.g., ESPs)
Conclusions
• Gaseous combustion processes generally result in low levels of PM emissions, but not lower than thebaseline GTCC power plant
– Gasification-based options utilizing gas turbines and internal combustion engines must remove thePM prior to combustion to avoid damage to the power generation equipment
– Rankine cycle options would require exhaust after-treatment• PM emissions for biomass co-firing with coal vary significantly with the ash content of different types of
solid biomass feedstocks, but are generally lower than for coal, with averages 10% ash in the UnitedStates
• Fuel cells inherently produce negligible amounts of PM emissions, as any particulates would tend todamage to the fuel cell and the fuel processor (e.g., by clogging catalyst beds)
Biomass co-firing with coal can produce some PM reductions, butgenerally, biopower does not result in significant PM savings.
Biopower Air Emissions Particulate Matter (PM)

377CR/71038Final CAM Oct-01
As with conventional power, biopower PM emissions occur mainly at thepower plant and not in upstream steps of the fuel chain.
Biopower Air Emissions Particulate Matter – Grid Power
0.00 0.05 0.10 0.15 0.20 0.25 0.30
Poplar Gasification Co-fire (w/NG)
Poplar Gasification Co-fire (w/coal)
Poplar Direct Co-fire (w/ coal)
RDF IGCC
Landfill gas ICE
Landfill gas Rankine
Landfill gas GT
Landfill gas GTCC
Total Particulate Emissions (g/kWh delivered)
Fuel Production
Fuel Transportation
Power generation
Full Fuel Chain Air Emissions of Selected Biopower OptionsGrid Power — PM (g/kWh delivered)
Emissions of a natural gas combined cycle plant = 0.023 g/kWh. Emissions of a coal fired plant = 1.1 g/kWh
1.80.26
0.0630.035
1.50.22
Range for all other feedstock options
1. The shown emissions reflects transmission and distribution energy losses of 7.2 percent.2. The feedstocks used for the co-firing options were corn stover, wheat straw, woody biomass (poplar), and switchgrass; the range shown reflects the
full chains using these other feedstocks

378CR/71038Final CAM Oct-01
Biomass onsite power options are expected to produce higher PMemissions than natural gas combined cycle technology.
Biopower Air Emissions Particulate Matter – Onsite Power
0.00 0.02 0.04 0.06 0.08 0.10 0.12 0.14 0.16
Digester gas FC
Sewage gas ICE
Digester gas ICE
Sewage gas Rankine
Sewage gas GTCC
Sewage gas GT
Digester gas GT
GTCC-Black Liquor
GTCC-Hogged Fuel
Rankine-Solid Residues
ICE-Solid Residues
GT-Solid Residues
Total Particulate Emissions (g/kWh)
Fuel Production
Fuel Transportation
Power generation
Full Fuel Chain Air Emissions of Selected Biopower OptionsOnsite Power — PM (g/kWh produced)
Emissions of a natural gas combined cycle plant = 0.023 g/kWh

379CR/71038Final CAM Oct-01
Assumptionsand
Methodology
• CO emissions occur both from the utilization of the biomass itself plus from the use of other fuels andmaterials (e.g., chemical fertilizers), which are used to grow, harvest, transport and process the biomass
• Grid-sited options include the effects of transmission & distribution energy losses (i.e., results are shownper kWh delivered)
• Biogas (including landfill, sewage, and digester gas) is generated and used where it is produced so thereis no energy use (and therefore no CO emissions) associated with biomass production and transport
• For biomass co-firing with coal, the co-firing is assumed to have no effect on overall CO emissions• For RDF, the emissions associated with collection and processing are not included as these would need
to be done regardless of the use of RDF for fuel– The non-biomass portion of RDF is also excluded
Comments
• For agricultural residues & energy crops, many biomass fuel types are possible. Poplar is used here as anexample of a woody biomass resource that would be grown as an energy crop
– For the remaining feedstocks (e.g., switchgrass, corn stover, wheat straw), the range of totalemissions (i.e., all value chain steps) is given on top of the detailed breakdown for poplar
• CO emissions are generally uncontrolled emissions consistent with current good practices for combustion(e.g., dry low NOx combustion for gas turbines, lean burn technology for internal combustion engines)
• For co-firing with coal it is assumed that biopower CO emissions are the same per BTU of fuel consumedas for the baseline coal plant, so that differences in emissions per kWh are related to differences inefficiency
Conclusions
• With the exception of the internal combustion engine, gaseous combustion processes generally result inthe lowest levels of CO emissions, but not lower than the baseline GTCC power plant
– Gasification-based options utilizing gas turbines and internal combustion engines have somewhathigher levels of CO emissions than biogas options, due mainly to lower overall efficiency
• CO emissions for biomass co-firing with coal vary significantly with the different types of solid biomassfeedstocks, as a result of different upstream (feedstock production and transport) energy requirements
– Generally, emissions are roughly equal to or slightly higher than the baseline coal plant• Fuel cells inherently produce negligible amounts of CO emissions, as any residual CO in the fuel gas is
burned in a low-emissions burner to generated heat to run the fuel processor
CO emissions from power generation are highly technology dependant, butupstream emissions cannot be ignored for certain feedstocks.
Biopower Air Emissions Carbon Monoxide (CO)

380CR/71038Final CAM Oct-01
As with PM, the bulk of CO emissions occur in the power generation step.
Biopower Air Emissions Carbon Monoxide – Grid Power
0.00 0.05 0.10 0.15 0.20 0.25 0.30 0.35 0.40 0.45 0.50
Poplar Direct Co-fire (w/ coal)
Poplar Gasification Co-fire (w/NG)
Poplar Gasification Co-fire (w/coal)
RDF IGCC
Landfill gas ICE
Landfill gas Rankine
Landfill gas GTCC
Landfill gas GT
Total CO Emissions (g/kWh delivered)
Fuel ProductionFuel TransportationPower generation
Full Fuel Chain Air Emissions of Selected Biopower OptionsGrid Power — CO (g/kWh delivered)
Emissions of a natural gas combined cycle plant = 0.086 g/kWh. Emissions of a coal fired plant = 0.14 g/kWh
0.510.18
0.290.13
0.430.15
1.6
1. The shown emissions reflects transmission and distribution energy losses of 7.2 percent.2. The feedstocks used for the co-firing options were corn stover, wheat straw, woody biomass (poplar), and switchgrass; the range shown reflects the
full chains using these other feedstocks

381CR/71038Final CAM Oct-01
Onsite power does not seem to provide appreciable CO reduction benefitscompared to natural gas combined cycle technology.
Biopower Air Emissions Carbon Monoxide – Onsite Power
0.00 0.20 0.40 0.60 0.80 1.00 1.20 1.40 1.60 1.80
Digester gas FC
Sewage gas ICE
Digester gas ICE
Sewage gas Rankine
Sewage gas GTCC
Sewage gas GT
Digester gas GT
GTCC-Black Liquor
GTCC-Hogged Fuel
Rankine-Solid Residues
ICE-Solid Residues
GT-Solid Residues
Total CO Emissions (g/kWh)
Fuel Production
Fuel Transportation
Power generation
Full Fuel Chain Air Emissions of Selected Biopower OptionsOnsite Power — CO (g/kWh produced)
Emissions of a natural gas combined cycle plant = 0.086 g/kWh.

382CR/71038Final CAM Oct-01
In addition to air emissions, biomass power can produce solid wastes andwater effluent, but impacts are expected to be modest and manageable.
1 Biological Oxygen Demand, which is a measure of the potential of organic wastes to compete with aquatic life for dissolved oxygen
Biopower Solid Waste and Effluent Impacts
Solid Waste
• Ash production is the most significant solidwaste issue, since typical biomass fuelscontain 1-2 percent ash by weight, andsome contain as much as 15 percent
– Biomass ash is generally non-toxic andis capable of being used, and even sold,for beneficial purposes (e.g., fertilizer)
– Recovery and disposal costs andpermitting are considerations whenevaluating project economics, but theyhave not been included explicitly in theCOE calculations
• For biomass co-firing with coal, usingbiomass would reduce current rates of ashgeneration
• For MSW or RDF, solid waste managementwill be of particular concern, but new plantsshould be able to meet high standards forsolid waste management
Effluent Waste
• Effluent can originate from a number ofsources, but is usually preventable
– Effluent from wet scrubbers is typicallyfiltered and recycled, and the solids arede-watered for handling as solid wastes
– Most new plants utilize electrostaticprecipitators instead of wet scrubbers,eliminating effluent altogether
– Facilities may have to monitor or controlstorm and wash-down runoff, which maycontain substances leached frombiomass storage and handling areas
– Effluent can contain suspended solidsand BOD1, but toxicity is not usually aserious concern
• A more serious water-related issue is theexpected demand and runoff associatedwith large-scale energy crop production

383CR/71038Final CAM Oct-01
Direct biomass co-firing with coal is used as an illustration of the possibleenvironmental benefit of biomass power, if deployed aggressively.• Biomass co-firing with coal alone could result in a 6-fold increase in biopower
generation over the baseline of 56,000 GWh/year• Switchgrass was taken as an example as its potential use alone could almost
reach the aggressive goal (158 thousand GWh)• The total amount of available switchgrass was used to generate power by
directly co-firing with coal• The resulting emissions were ratioed to an equivalent of 170 thousand GWh
(the biopower aggressive goal) as a thought experiment• The resulting possible total benefit of co-firing provides an illustration of
potential environmental benefits of biopower• The biomass capacity was compared with the equivalent coal Rankine capacity
to estimate emissions reductions
Biopower Example Environmental Benefit

384CR/71038Final CAM Oct-01
At high levels of market penetration, biomass co-firing produces significantCO2 and SO2 reductions. Moreover, the total investment cost for CO2reductions is estimated to be a modest $30/ton.
Biopower Example Environmental Benefit
Carbon Dioxide Avoided per Year for170,000 GWh/yr with Co-firing of Biomass
0
20,000
40,000
60,000
80,000
100,000
120,000
140,000
160,000
180,000
200,000
Coal Rankine Co-fire w/ switchgrass
CO
2 pr
oduc
ed 1
,000
met
ric to
ns p
er y
ear
Power generationFuel TransportFuel Production
Sulfur Dioxide Avoided per Year for170,000 GWh/yr with Co-firing of Biomass
0
200
400
600
800
1,000
1,200
Coal Rankine Co-fire w/ switchgrassS
O2
prod
uced
(1,0
00 m
etric
tons
per
yea
r)
Power generationFuel TransportFuel Production
167 million metric tonsof CO2 avoided per year
895 thousand metric tonsof SO2 avoided per year
385CR/71038Final CAM Oct-01
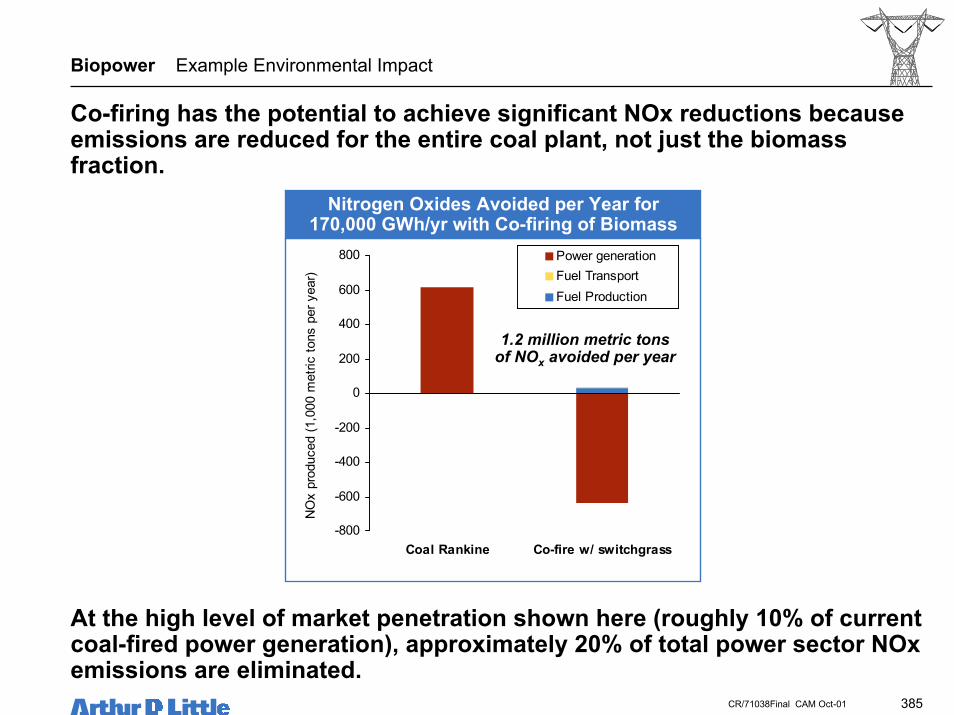
Co-firing has the potential to achieve significant NOx reductions becauseemissions are reduced for the entire coal plant, not just the biomassfraction.
Biopower Example Environmental Impact
Nitrogen Oxides Avoided per Year for170,000 GWh/yr with Co-firing of Biomass
-800
-600
-400
-200
0
200
400
600
800
Coal Rankine Co-fire w/ switchgrass
NO
x pr
oduc
ed (1
,000
met
ric to
ns p
er y
ear)
Power generationFuel TransportFuel Production
1.2 million metric tonsof NOx avoided per year
At the high level of market penetration shown here (roughly 10% of currentcoal-fired power generation), approximately 20% of total power sector NOxemissions are eliminated.

386CR/71038Final CAM Oct-01
The definition of regions is based by the Regional Biomass EnergyProgram.
Available biomass supply:41 million dry tons/year
Northwest
Available biomass supply:197 million dry tons/year
West
Available biomass supply:233 million dry tons/year
Great Lakes
Available biomass supply:52 million dry tons/year
Northeast
Available biomass supply:195 million dry tons/year
Southeast
Biopower Region Definitions

387CR/71038Final CAM Oct-01
The method of analysis has implications in the conclusions for possibleeconomic impact of accelerated biomass use for power.• We assumed that the capital investment associated with biomass production is
contained in the feedstock price• One weakness of this method is that it does not account for any additional
investment of equipment that is needed to collect the biomass not currentlyharvested
• The same thought experiment used to illustrate environmental benefits is usedhere to illustrate the possible impacts of accelerated biomass use usingbiomass co-firing with coal
• The investments shown produce a total of 170,000 GWh of electricity per yearusing switchgrass for direct co-firing in coal plants
Biopower Example Economic Impact

388CR/71038Final CAM Oct-01
For biomass co-firing, the single largest annual operating cost item isexpected to be the biomass fuel itself.
Biopower Example Economic Impact Rural Impact
1. Capital recovery assumptions are 13% per year for biomass transport investments and 15% for power plant investments.2. The feedstock cost of switchgrass is assumed to be $40 per ton (dry basis). The capital and operating costs of biomass production are incorporated into
this price.3. The investments shown produce a total of 170,000 GWh of electricity per year switchgrass co-firing with coal.
Co-firing of Switchgrass in Coal Plants –Maximum Annual Expenditures ($ million per year)
Rural Semi-Rural
$0
$1,000
$2,000
$3,000
$4,000
$5,000
$6,000
Biomass Production Biomass Transportation Power Generation
Mill
ion
Dol
lars
per
yea
r
BiomassFossil FuelNon-fuel O&MCapital Recovery

389CR/71038Final CAM Oct-01
0.00.51.01.52.02.53.03.54.04.55.05.56.0
BiomassProduction
BiomassTransport
Power Generation(net negative w/emission credit)
Leve
lized
cos
t of e
lect
ricity
ce
nt p
er k
Wh
0.0
0.5
1.0
1.5
2.0
2.5
3.0
3.5
4.0
4.5
5.0
BiomassFuel
PetroleumFuel
Non-fuelO&M
CapitalRecovery
EmissionCredit
Leve
lized
cos
t of e
lect
ricy
cent
per
kW
h
Value creation for electricity generation is primarily in the biomass fuel;emission credits could cover the cost of nonfuel O&M and capital recovery.
Biopower Economic Impact Rural Impact
Switchgrass Direct Co-Firing With CoalLevelized Cost of Electricity,
cent per kWh
1. Capital recovery cost per year are a 13% per year for biomass transport investment and 15% for power generation investment. The capital recovery forbiomass production is included in the price for biomass.
2. The fuel operating cost for biomass production is solely the cost of the biomass. The capital, non-fuel operating, and petroleum fuel costs in biomassproduction are incorporated into the price for biomass
3. The feedstock cost of switchgrass is $40 per dry ton
Switchgrass Direct Co-Firing With CoalLevelized Cost of Electricity,
cent per kWh
Rural Semi-Rural

390CR/71038Final CAM Oct-01
Biopower Market Potential Summary
Several biomass power options appear attractive and would generally notcompete directly with one another for biomass resources.• The most attractive near-term option overall appears to be biomass co-firing with coal
– At the macro level there do not appear to be any significant market limitations, but implementationwill require finding suitable power plants in close proximity to the biomass resource, which will bemainly conventional options such as wood, wood waste, crop residues and eventually, energycrops
• Utilization of various biogases appears similarly attractive as biomass co-firing with coal,although the total market potential is considerably smaller– Power generation is the most logical use for this resource
• The price premiums associated with the gasification of biomass co-firing with naturalgas-fired GTCC plants are somewhat higher than those for biomass co-firing with coal– At the macro level, the limitation appears to be GTCC capacity, not overall resource availability
• The gasification of refuse derived fuel (RDF) could be an attractive option for meeting thegoal of aggressive growth of biopower production– The main issues are the somewhat higher price premiums and overcoming the considerable public
resistance to increased use of municipal waste for energy, despite the growing problem with landfillspace
• Although the market appears limited, the gasification of process wastes (including theP&P industry) can be cost competitive and should therefore be exploited whenever it istechnically and economically feasible

391CR/71038Final CAM Oct-01
Biopower Overview of Market Potential for Biopower
Biomass co-firing with coal represents by far the largest opportunity – ifthe technical potential were fully exploited, co-firing alone would representa 6-fold increase in biomass power generation.
1. The bars represent using the entire resource to generate electricity with the most efficient technology.2. Biogas market includes use of landfill gas, digester, and sewage gas. The bar represents using the entire resource to generate electricity with an
efficiency of 32 percent which includes energy losses from transmission and distribution of 7.2 percent.3. Biomass co-firing with coal market is limited by coal capacity not resource capacity per region. The shown market is 15 percent of available coal plant
capacity in each region.4. The total market for biomass co-firing with natural gas market is capacity limited. The market shown is based on EIA estimates of new GTCC
installations in the 2000-2010 timeframe. The market shown is 15 percent of available new natural gas combined cycle capacity.5. RDF includes the use of gasified RDF in the most efficient technology available.6. Gasification of process wastes include black liquor, hogged fuel, and solid residues with the most efficient technology available.
Maximum Biopower Market (technical potential)
Aggressive Goal 170,000 GWh
Baseline = 56,000 GWh/yr
0
50,000
100,000
150,000
200,000
250,000
300,000
350,000
All Biogas Biomass Co-firing withcoal
Biomass Co-firing withNatural Gas
RDF Gasification of ProcessWastes
GW
h pe
r yea
r
TotalWesternSoutheastNorthwestNortheastGreat Lakes
392CR/71038Final CAM Oct-01
Scenario Analysis
4
Policy Options
5
Conclusions & Recommendations
6
Benefit and Impact Analysis
7
Table of Contents
Identification of Options
Background & Objectives
Executive Summary
3
1
0
Baseline Use of Biomass2
• Resource Assessment• Fossil Chain Baselines• Biopower Options•• Biofuel OptionsBiofuel Options• Bioproduct Options

393CR/71038Final CAM Oct-01
All fuel options are compared against a petroleum based fuel chain and aMTBE/reformulated gasoline fuel chain excluding state and federal taxes.
Biofuels Definitions for Benefits and Impacts Comparisons
PetroleumGasoline
Fuel Chain
• Ethanol chains are compared to petroleum gasoline chain using aspark ignition engine car
• A premium value of the ethanol (from increased octane or oxygenatecontent) was not taken
Baselinefor Emissions Comments
ReformulatedGasoline Fuel
Chain
• The baseline uses reformulated gasoline with 11% by volume MTBE• For blended ethanol fuels, only the biomass portion of the fuel is
shown in both the economics and environmental impact calculations• The cost and environmental impact of gasoline is not included• Spark ignition engines are used
OctaneBarrel
Valuation
• The value of blended ethanol was set according to its octane barrel value compared to gasoline• 1998-2000 petroleum marketing monthly data was used to assess a value of $0.28 per octane point per barrel of gasoline• The 2010 wholesale price of motor gasoline was $0.85 per gallon from EIA 2001 Energy Outlook• ADL assumed an average octane of 89 for the wholesale gasoline• Ethanol octane was a (R+M)/2 value of 113; MTBE (R+M)/2 value of 109.5• No further premiums were assigned for ethanol• MTBE average premium during the time period was 11 percent over its octane value• The price for MTBE is $41.4 to $46.0 per barrel ($0.99 to 1.09 per gal MTBE); EtOH octane price is $42.4/B or $1.01/gal
Pure or NeatEthanol
BlendedEthanol
PetroleumDiesel
Fuel Chain
• FT-Diesel chains are compared to petroleum diesel chain using acompression ignition engine vehicle
• A premium value of the biomass fuel was not takenFT-Diesel
• $0.91 per gallongasoline equivalent
• $21.4 per barrelcrude oil price
Value in Use
Based on its octanebarrel value, see
note belowEtOH: $1.01/galMTBE: $0.99 to
1.09/gal
• $0.83 per gallongasoline equivalent
• $21.4 per barrelcrude oil price

394CR/71038Final CAM Oct-01
The whole fuel chain was considered for the emission calculations. Vehicleefficiency has been taken into account.• Regulated emissions for each fuel are set by the relevant emission standards• Carbon dioxide and sulfur dioxide are based upon the elemental composition
of the fuel and the chain efficiency• NOx, CO, and nonmethane hydrocarbon standards are set by the 50,000 mile
durability ULEV standards for 2001-2006 Model Year for All passenger car’sand light-duty trucks (0-3750 lbs LVW)
• Particulate matter for compression ignition engines are the 100,000 miledurability standards for new 2001-2003 Model Year TLEV passenger cars andlight duty trucks
• Methane emissions are calculated from correlations based on the amount onnonmethane hydrocarbon emissions
• The effect of ethanol as an oxygenate on emissions in the vehicle was nottaken into account
Biofuels Air Emissions
The vehicle emissions are based on that the vehicle is designed to meet theemission standard (ULEV), regardless of the fuel used.

395CR/71038Final CAM Oct-01
The efficiency of pure ethanol fueled cars is enhanced over gasoline fueledengines. All other fuels have the same efficiency as its respective baseline.
Biofuels Vehicle Efficiencies
Vehicle EfficienciesEfficiency
Gasoline 15.7%Diesel 16.9%RFG 15.7%Pure Ethanol 17.3%FT Diesel 16.9%DME 16.9%Blended Ethanol 15.7%
Fuel Properties for ReferenceHHV of fuel,
GJ per million gallonsEquivalent in terms of gallons
of gasoline equivalent
Gasoline 129,072 1.0Ethanol 88,590 0.686Dimethyl ether 80,400 0.623FT Diesel 138,381 1.07

396CR/71038Final CAM Oct-01
Biofuels Emissions Summary
Biofuels can offer tremendous carbon dioxide reduction savings comparedto petroleum fuels even when used as primarily a blending agent.• Biofuels offer the only remotely affordable option to drastically reduce CO2 emissions from transportation fuel chains• When used as an oxygenate in RFG, ethanol could play a critical role in criteria pollutant emissions reduction• Without legislative protection of the clean fuel benefit of biofuels when used as a neat fuel, these benefits may be lost
in re-optimization of engines for power or cost• In all cases CO2 reductions (per mile driven) are significant, ranging from 65-95 percent
– The only net CO2 emissions are associated with biomass production and transport, and use of machinery at the processingplants for biomass handling
– Further improvements in biomass handling methods within the plant processing gate will reduce chain carbon dioxideemissions
• Even though biomass fuels are low in sulfur, net chain emissions are comparable with petroleum chains– The emissions associated with biomass production are for fertilizer use and petroleum fuels for harvesting– Transporting the biomass contributes negligible emissions (assuming 50-mile one-way trips on average)– Production of fuel, especially for ethanol, is associated with internal power generation which does not have sulfur control
- Lignin and waste streams are used for power generation with associated sulfur from water treatment, acidification, andbiomass sulfur itself
- Additional technology such as dual alkali technology could be employed with additional capital expense– Gasification based processes have lower sulfur emissions due to removal in processing steps and use of resulting low-sulfur
diesel and syngas as fuels internally
• The solid and water effluent waste is expected to be manageable– Solid wastes are expected to be biodegradable and usable as fuel (e.g. Cell mass)– Water will contain suspended solids and toxicity is not a serious concern– Water use for processing (especially for fermentation) may be a concern in arid or semi-arid regions

397CR/71038Final CAM Oct-01
Biofuels Emissions Summary
Emissions of NOx, methane, nonmethane hydrocarbons, particulate matter,and CO are comparable to that of petroleum derived fuels.• Depending on the conversion technology and feedstock, NOx, CH4, NMHC,
particulate matter and CO emissions can be comparable or higher• Vehicle related emissions will likely be governed by emission standards and be
mostly independent of fuel used• The predominate step which contributes emissions is the actual processing
step to make the fuel– Emissions are related to the use of petroleum fuels to handle the biomass within the
plant gate– Additional emissions are generated from combustion of waste gases and waste solids
for onsite power generation
• Increased use of state-of-the-art technology for biomass handling and internalpower generation will improve chain emissions further
The emissions in the vehicle end-use were assumed to meet the emissionstandard regardless of the fuel used.
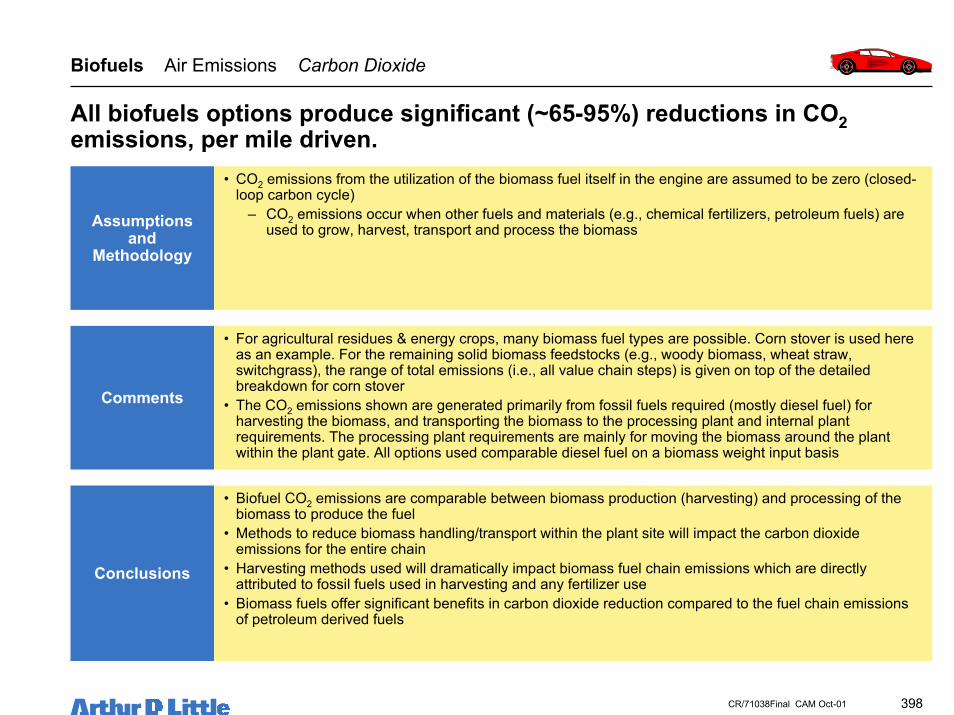
398CR/71038Final CAM Oct-01
Assumptionsand
Methodology
• CO2 emissions from the utilization of the biomass fuel itself in the engine are assumed to be zero (closed-loop carbon cycle)
– CO2 emissions occur when other fuels and materials (e.g., chemical fertilizers, petroleum fuels) areused to grow, harvest, transport and process the biomass
Comments
• For agricultural residues & energy crops, many biomass fuel types are possible. Corn stover is used hereas an example. For the remaining solid biomass feedstocks (e.g., woody biomass, wheat straw,switchgrass), the range of total emissions (i.e., all value chain steps) is given on top of the detailedbreakdown for corn stover
• The CO2 emissions shown are generated primarily from fossil fuels required (mostly diesel fuel) forharvesting the biomass, and transporting the biomass to the processing plant and internal plantrequirements. The processing plant requirements are mainly for moving the biomass around the plantwithin the plant gate. All options used comparable diesel fuel on a biomass weight input basis
Conclusions
• Biofuel CO2 emissions are comparable between biomass production (harvesting) and processing of thebiomass to produce the fuel
• Methods to reduce biomass handling/transport within the plant site will impact the carbon dioxideemissions for the entire chain
• Harvesting methods used will dramatically impact biomass fuel chain emissions which are directlyattributed to fossil fuels used in harvesting and any fertilizer use
• Biomass fuels offer significant benefits in carbon dioxide reduction compared to the fuel chain emissionsof petroleum derived fuels
All biofuels options produce significant (~65-95%) reductions in CO2emissions, per mile driven.
Biofuels Air Emissions Carbon Dioxide

399CR/71038Final CAM Oct-01
The end use CO2 emissions are zero for biomass fuels by a closed carbonbalance.
Carbon dioxide emissions are associated primarily with the production ofthe fuel.
Biofuels Air Emissions Carbon Dioxide
Air Emissions of Sample Fuel OptionsCO2 emissions, grams per mile driven
0 5 10 15 20 25 30
Neat corn ethanol
Neat ethanol from corn stover w/ next generationSSCF
Neat Fischer-Tropsch diesel from corn stover
Blended corn ethanol
Blended ethanol from corn stover w/ next generationSSCF
Total CO2 Emissions, gm per mile driven
Biomass ProductionBiomass TransportationFuel productionFuel DistributionFuel MarketingVehicle End Use
Emissions of a gasoline fuel chain = 369 gm per mile drivenEmissions of a reformulated gasoline fuel chain = 339 gm per mile drivenEmissions of a petroleum diesel fuel chain = 318 gm per mile driven
(48-137)
Range for all other feedstock options
(43-124)
(39-120)
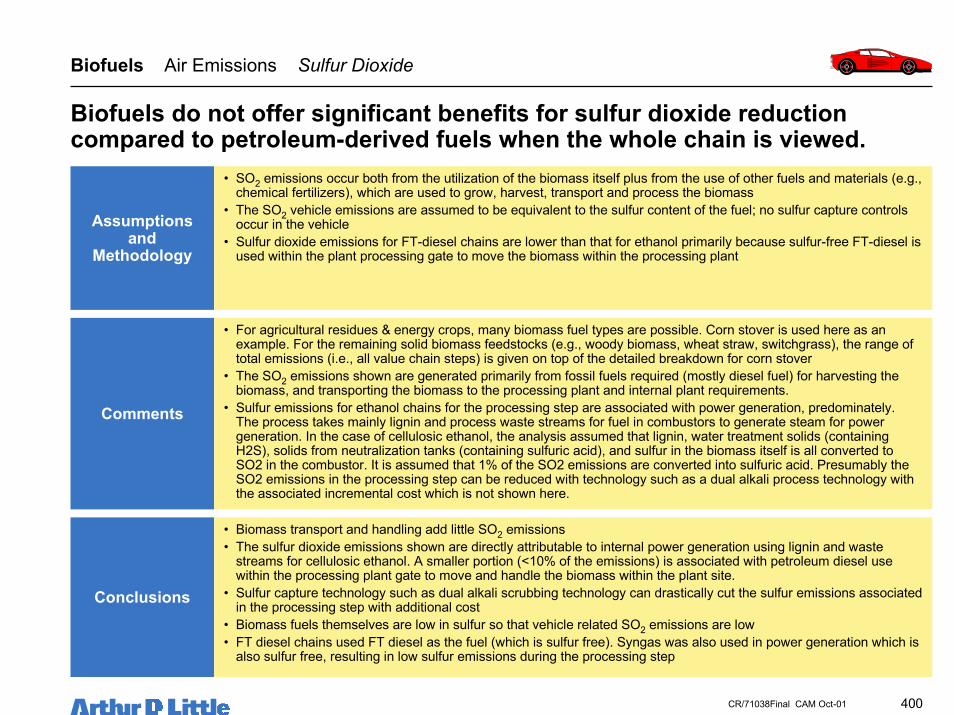
400CR/71038Final CAM Oct-01
Assumptionsand
Methodology
• SO2 emissions occur both from the utilization of the biomass itself plus from the use of other fuels and materials (e.g.,chemical fertilizers), which are used to grow, harvest, transport and process the biomass
• The SO2 vehicle emissions are assumed to be equivalent to the sulfur content of the fuel; no sulfur capture controlsoccur in the vehicle
• Sulfur dioxide emissions for FT-diesel chains are lower than that for ethanol primarily because sulfur-free FT-diesel isused within the plant processing gate to move the biomass within the processing plant
Comments
• For agricultural residues & energy crops, many biomass fuel types are possible. Corn stover is used here as anexample. For the remaining solid biomass feedstocks (e.g., woody biomass, wheat straw, switchgrass), the range oftotal emissions (i.e., all value chain steps) is given on top of the detailed breakdown for corn stover
• The SO2 emissions shown are generated primarily from fossil fuels required (mostly diesel fuel) for harvesting thebiomass, and transporting the biomass to the processing plant and internal plant requirements.
• Sulfur emissions for ethanol chains for the processing step are associated with power generation, predominately.The process takes mainly lignin and process waste streams for fuel in combustors to generate steam for powergeneration. In the case of cellulosic ethanol, the analysis assumed that lignin, water treatment solids (containingH2S), solids from neutralization tanks (containing sulfuric acid), and sulfur in the biomass itself is all converted toSO2 in the combustor. It is assumed that 1% of the SO2 emissions are converted into sulfuric acid. Presumably theSO2 emissions in the processing step can be reduced with technology such as a dual alkali process technology withthe associated incremental cost which is not shown here.
Conclusions
• Biomass transport and handling add little SO2 emissions• The sulfur dioxide emissions shown are directly attributable to internal power generation using lignin and waste
streams for cellulosic ethanol. A smaller portion (<10% of the emissions) is associated with petroleum diesel usewithin the processing plant gate to move and handle the biomass within the plant site.
• Sulfur capture technology such as dual alkali scrubbing technology can drastically cut the sulfur emissions associatedin the processing step with additional cost
• Biomass fuels themselves are low in sulfur so that vehicle related SO2 emissions are low• FT diesel chains used FT diesel as the fuel (which is sulfur free). Syngas was also used in power generation which is
also sulfur free, resulting in low sulfur emissions during the processing step
Biofuels do not offer significant benefits for sulfur dioxide reductioncompared to petroleum-derived fuels when the whole chain is viewed.
Biofuels Air Emissions Sulfur Dioxide

401CR/71038Final CAM Oct-01
0.00 0.05 0.10 0.15 0.20 0.25 0.30
Pure corn ethanol
Pure corn stover ethanol2010 SSF
Pure corn stoverFischer-Tropsch diesel
Blended corn ethanol
Blended corn stoverethanol 2010 SSF
Total SO2 Emissions, gm per mile driven
Biomass ProductionBiomass TransportationFuel ProductionFuel DistributionFuel MarketingVehicle End Use
Most of the sulfur emissions are associated with diesel engines used tohandle the biomass on-site.
Biofuels Air Emissions Sulfur Dioxide
Air Emissions of Sample Fuel OptionsSO2 emissions, grams per mile driven
FT-diesel is essentially sulfur free since any sulfur present in the biomassis removed prior to the fuel synthesis.
Emissions of a gasoline fuel chain = 0.102 gm per mile drivenEmissions of a reformulated gasoline fuel chain = 0.098 gm per mile drivenEmissions of a petroleum diesel fuel chain = 0.063 gm per mile driven
(0.32-0.48)
Range for all other feedstock options
(0.29-0.44)
(0.10-0.22)

402CR/71038Final CAM Oct-01
Assumptionsand
Methodology
• NOx emissions occur both from the utilization of the biomass itself plus from the use of other fuels andmaterials (e.g., chemical fertilizers), which are used to grow, harvest, transport and process the biomass
• The vehicle emissions of NOx are set to the 50,000 mile durability ULEV standards for 2001-2006 modelyear for all passenger cars and light-duty trucks (0-3750 lbs LVW)
• It is assumed that the engine will be designed to meet the emission standard regardless of the fuel used;therefore all chains have the same emissions per mile driven for the end use step
• The emission factors used for diesel engines used in biomass production, biomass transportation, andengines used at the processing plant use 50/50 emissions which represent that an average of 1/2 of theengines used are state-of-the-art and 1/2 are uncontrolled
Comments
• For agricultural residues & energy crops, many biomass fuel types are possible. Corn stover is used hereas an example. For the remaining solid biomass feedstocks (e.g., woody biomass, wheat straw,switchgrass), the range of total emissions (i.e., all value chain steps) is given on top of the detailedbreakdown for corn stover
• The NOx emissions shown are generated primarily from fossil fuels required (mostly diesel fuel) forharvesting the biomass, and transporting the biomass to the processing plant and internal plantrequirements. The processing plant requirements are mainly for moving the biomass around the plantwithin the plant gate. All options used comparable diesel fuel on a biomass weight basis
Conclusions
• Biomass-only options do not result in lower NOx emissions relative to the petroleum-derived fuels• NOx emissions are generated primarily in combustion applications. For the vehicle end use, it is assumed
that the vehicle emissions are the same for all biofuels used• The main avenue to reduce biomass fuel chain emissions is the use of state-of-the-art engines and
combustion turbines with reduced NOx generation capability for biomass harvesting, transportation• The main generator of NOx emissions is within the fuel processing gate which can be reduced with the
use of more state-of-the-art equipment
Biomass fuels do not provide appreciable benefits in nitrogen oxidesreduction compared petroleum derived fuels.
Biofuels Air Emissions Nitrogen Oxides

403CR/71038Final CAM Oct-01
0.00 0.05 0.10 0.15 0.20 0.25 0.30 0.35 0.40 0.45 0.50
Pure corn ethanol
Pure corn stover ethanol2010 SSF
Pure corn stoverFischer-Tropsch diesel
Blended corn ethanol
Blended corn stoverethanol 2010 SSF
Total NOx Emissions, gm per mile driven
Biomass ProductionBiomass TransportationFuel ProductionFuel DistributionFuel MarketingVehicle End Use
Most nitrogen oxides are generated on the vehicle. Engine manufacturerstypically tune the engines to just meet emissions specifications.
Biofuels Air Emissions Nitrogen Oxides
Air Emissions of Sample Fuel OptionsNOx emissions, grams per mile driven
Emissions of a gasoline fuel chain = 0.272 gm per mile drivenEmissions of a reformulated gasoline fuel chain = 0.270 gm per mile drivenEmissions of a petroleum diesel fuel chain = 0.982 gm per mile driven
(0.51-0.94)
Range for all other feedstock options
(0.48-0.87)
(0.41-0.80)
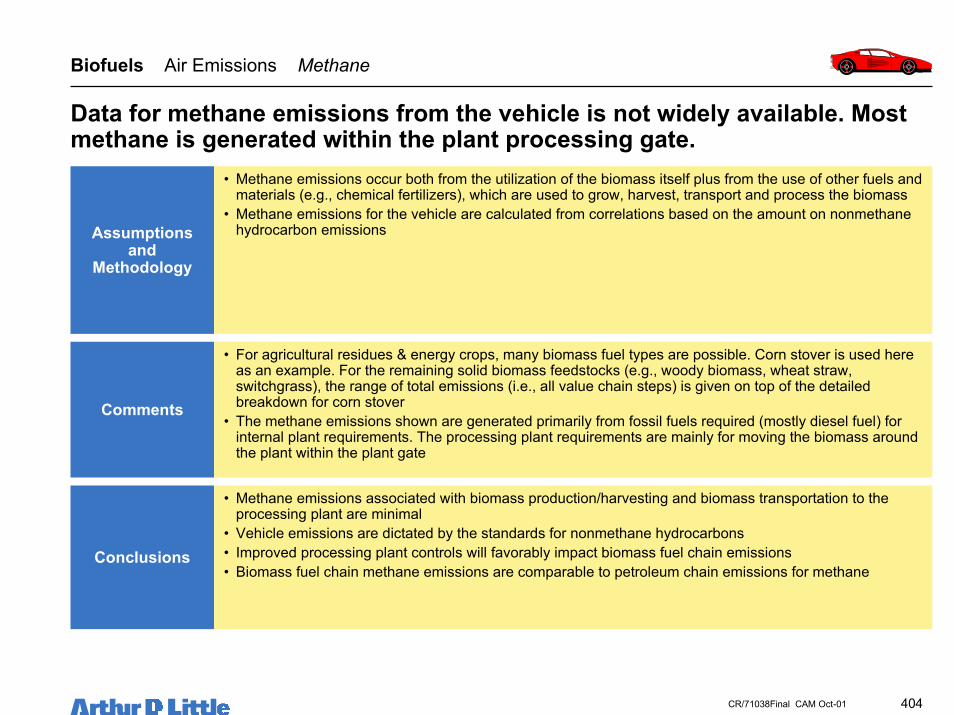
404CR/71038Final CAM Oct-01
Assumptionsand
Methodology
• Methane emissions occur both from the utilization of the biomass itself plus from the use of other fuels andmaterials (e.g., chemical fertilizers), which are used to grow, harvest, transport and process the biomass
• Methane emissions for the vehicle are calculated from correlations based on the amount on nonmethanehydrocarbon emissions
Comments
• For agricultural residues & energy crops, many biomass fuel types are possible. Corn stover is used hereas an example. For the remaining solid biomass feedstocks (e.g., woody biomass, wheat straw,switchgrass), the range of total emissions (i.e., all value chain steps) is given on top of the detailedbreakdown for corn stover
• The methane emissions shown are generated primarily from fossil fuels required (mostly diesel fuel) forinternal plant requirements. The processing plant requirements are mainly for moving the biomass aroundthe plant within the plant gate
Conclusions
• Methane emissions associated with biomass production/harvesting and biomass transportation to theprocessing plant are minimal
• Vehicle emissions are dictated by the standards for nonmethane hydrocarbons• Improved processing plant controls will favorably impact biomass fuel chain emissions• Biomass fuel chain methane emissions are comparable to petroleum chain emissions for methane
Data for methane emissions from the vehicle is not widely available. Mostmethane is generated within the plant processing gate.
Biofuels Air Emissions Methane

405CR/71038Final CAM Oct-01
0.000 0.005 0.010 0.015 0.020 0.025 0.030
Pure corn ethanol
Pure corn stover ethanol2010 SSF
Pure corn stover Fischer-Tropsch diesel
Blended corn ethanol
Blended corn stoverethanol 2010 SSF
gm methane per mile driven
Biomass ProductionBiomass TransportationFuel ProductionFuel DistributionFuel MarketingVehicle End use
Methane emissions are associated with processing (process gascombustion) and diesel engine emissions.
Biofuels Air Emissions Methane
Air Emissions of Sample Fuel OptionsMethane emissions, grams per mile driven
Emissions of a gasoline fuel chain = 0.026 gm per mile drivenEmissions of a reformulated gasoline fuel chain = 0.025 gm per mile drivenEmissions of a petroleum diesel fuel chain = 0.019 gm per mile driven
(0.026-0.034)
Range for all other feedstock options
(0.025-0.032)
(0.006-0.010)

406CR/71038Final CAM Oct-01
Assumptionsand
Methodology
• NMHC emissions occur both from the utilization of the biomass itself plus from the use of other fuels andmaterials (e.g., chemical fertilizers), which are used to grow, harvest, transport and process the biomass,and evaporative emissions at the fuel pump
• The vehicle emissions of NMHC are set to the 50,000 mile durability ULEV standards for 2001-2006model year for all passenger cars and light-duty trucks (0-3750 lbs LVW)
• It is assumed that the engine will be designed to meet the emission standard regardless of the fuel used;therefore all chains have the same emissions per mile driven for the end use step
• The emission factors used for diesel engines used in biomass production, biomass transportation, andengines used at the processing plant use 50/50 emissions which represent that an average of 1/2 of theengines used are state-of-the-art and 1/2 are uncontrolled.
Comments
• For agricultural residues & energy crops, many biomass fuel types are possible. Corn stover is used hereas an example. For the remaining solid biomass feedstocks (e.g., woody biomass, wheat straw,switchgrass), the range of total emissions (i.e., all value chain steps) is given on top of the detailedbreakdown for corn stover
• The NMHC emissions shown are generated primarily from fossil fuels required (mostly diesel fuel) forinternal plant requirements and evaporative emissions for fuel marketing
Conclusions
• Biomass fuels may not offer any benefits for the vehicle since the engine will likely be designed to meetthe emission standards regardless of the fuel used
• Evaporative emissions for especially ethanol is an issue since the Reid vapor pressure of ethanol is higherthan for current gasoline mixes used. This has implications on the use of ethanol for blending which willrequire additional petroleum capacity to lower the overall vapor pressure of the ethanol/gasoline mixtures
• Pure use of ethanol might require additional investments in vehicle equipment and fueling equipment toaccount for the high vapor pressure of ethanol so that evaporative emissions are kept under control
The situation with NMHCs is similar to that for methane – biomass yieldscomparable NMHC emissions as for petroleum-derived fuels.
Biofuels Air Emissions Non-Methane Hydrocarbons

407CR/71038Final CAM Oct-01
0.000 0.020 0.040 0.060 0.080 0.100 0.120
Pure corn ethanol
Pure corn stover ethanol2010 SSF
Pure corn stoverFischer-Tropsch diesel
Blended corn ethanol
Blended corn stoverethanol 2010 SSF
Total NMHC Emissions, gm per mile driven
Biomass ProductionBiomass TransportationFuel ProductionFuel DistributionFuel MarketingVehicle End Use
Most non-methane hydrocarbon emissions are associated with evaporativelosses and emissions associated with actual vehicle use.
Biofuels Air Emissions Non-methane Hydrocarbons
Air Emissions of Sample Fuel OptionsNon-methane hydrocarbon emissions, grams per mile driven
Emissions of a gasoline fuel chain = 0.160 gm per mile drivenEmissions of a reformulated gasoline fuel chain = 0.150 gm per mile drivenEmissions of a petroleum diesel fuel chain = 0.092 gm per mile driven
Range for all other feedstock options
(0.113-0.174)
(0.106-0.162)
(0.066-0.122)

408CR/71038Final CAM Oct-01
Assumptionsand
Methodology
• Particulate matter emissions occur both from the utilization of the biomass itself plus from the use of otherfuels and materials (e.g., chemical fertilizers), which are used to grow, harvest, transport and process thebiomass
• The vehicle emissions of particulate matter for gasoline spark ignition engines are assumed to benegligible. Those for compression ignition engines are set to the 100,000 mile durability standards for new2001-2003 Model Year TLEV passenger cars and light duty trucks
• The benefits of FT-diesel in reduced PM emissions are not taken into account; it was assumed the vehiclewould be designed to meet the relevant standard. Therefore, all diesel replacement chains have the sameemissions per mile driven for the end use step regardless of fuel used
• The emission factors used for diesel engines used in biomass production, biomass transportation, andengines used at the processing plant use 50/50 emissions which represent that an average of 1/2 of theengines used are state-of-the-art and 1/2 are uncontrolled
Comments
• For agricultural residues & energy crops, many biomass fuel types are possible. Corn stover is used hereas an example. For the remaining solid biomass feedstocks (e.g., woody biomass, wheat straw,switchgrass), the range of total emissions (i.e., all value chain steps) is given on top of the detailedbreakdown for corn stover
• The PM emissions shown are generated primarily from fossil fuels required (mostly diesel fuel) for internalplant requirements
Conclusions
• Biomass derived fuels will offer comparable particulate matter emissions compared to petroleum-derivedfuels; It is likely the FT-diesel will result in PM emission reduction which is not shown here
• PM emissions are generated primarily in combustion applications• The main avenue to reduce biomass fuel chain emissions is the use of state-of-the-art engines and
combustion turbines with reduced PM generation capability for biomass harvesting and transportation• The main generator of PM emissions is within the fuel processing gate which use diesel engines which
can be reduced with the use of more state-of-the-art equipment
Biomass fuels will offer comparable chain particulate matter emissionscompared to petroleum-derived fuels.
Biofuels Air Emissions Particulate Matter (PM)

409CR/71038Final CAM Oct-01
0.000 0.010 0.020 0.030 0.040 0.050 0.060
Pure corn ethanol
Pure corn stover ethanol2010 SSF
Pure corn stover Fischer-Tropsch diesel
Blended corn ethanol
Blended corn stoverethanol 2010 SSF
Total Particulate Emissions, gm per mile driven
Biomass ProductionBiomass TransportationFuel ProductionFuel DistributionFuel MarketingVehicle End Use
Particulate matter is generated mostly at the vehicle for compressionignition engine vehicle options.
Biofuels Air Emissions Particulate Matter
Air Emissions of Sample Fuel OptionsParticulate matter emissions, grams per mile driven
The use of diesel engines at processing plants accounts for the bulk of theemission for the ethanol cases.
Emissions of a gasoline fuel chain = 0.005 gm per mile drivenEmissions of a reformulated gasoline fuel chain = 0.005 gm per mile drivenEmissions of a petroleum diesel fuel chain = 0.044 gm per mile driven
Range for all other feedstock options
(0.016-0.045)
(0.014-0.041)
(0.055-0.082)

410CR/71038Final CAM Oct-01
Assumptionsand
Methodology
• CO emissions occur both from the utilization of the biomass itself plus from the use of other fuels andmaterials (e.g., chemical fertilizers), which are used to grow, harvest, transport and process the biomass,and evaporative emissions at the fuel pump
• The vehicle emissions of CO are set to the 50,000 mile durability ULEV standards for 2001-2006 modelyear for all passenger cars and light-duty trucks (0-3750 lbs LVW)
• It is assumed that the engine will be designed to meet the emission standard regardless of the fuel used;therefore all chains have the same emissions per mile driven for the end use step
• The emission factors used for diesel engines used in biomass production, biomass transportation, andengines used at the processing plant use 50/50 emissions which represent that an average of 1/2 of theengines used are state-of-the-art and 1/2 are uncontrolled
Comments
• For agricultural residues & energy crops, many biomass fuel types are possible. Corn stover is used hereas an example. For the remaining solid biomass feedstocks (e.g., woody biomass, wheat straw,switchgrass), the range of total emissions (i.e., all value chain steps) is given on top of the detailedbreakdown for corn stover
• The CO emissions shown are generated primarily in the end use step in the vehicle engine
Conclusions
• Biomass derived fuels will offer comparable carbon monoxide emissions compared to petroleum-derivedfuels
• Carbon monoxide is mainly generated in the vehicle step of the fuel chain. Vehicle performance will mostprobably be designed to meet relevant emission standards. Differences among various fuels type will benegligible in the vehicle step
CO emissions are predominately generated in the end use step at thevehicle. Emissions are comparable to petroleum based chains.
Biofuels Air Emissions Carbon Monoxide (CO)

411CR/71038Final CAM Oct-01
0.00 0.20 0.40 0.60 0.80 1.00 1.20 1.40 1.60 1.80 2.00
Pure corn ethanol
Pure corn stover ethanol2010 SSF
Pure corn stover Fischer-Tropsch diesel
Blended corn ethanol
Blended corn stoverethanol 2010 SSF
Total CO Emissions, gm per mile driven
Biomass Production
Biomass Transportation
Fuel ProductionFuel Distribution
Fuel Marketing
Vehicle End Use
A significant fraction of the carbon monoxide is generated at the vehicle.
Biofuels Air Emissions Carbon Monoxide
Air Emissions of Sample Fuel OptionsCarbon monoxide emissions, grams per mile driven
Emissions of a gasoline fuel chain = 1.76 gm per mile drivenEmissions of a reformulated gasoline fuel chain = 1.76 gm per mile drivenEmissions of a petroleum diesel fuel chain = 1.75 gm per mile driven
Range for all other feedstock options
(1.83-2.00)
(1.82-1.98)
(1.76-1.91)

412CR/71038Final CAM Oct-01
Biomass fuels can produce solid wastes and water effluent; water use andtreatment may be an issue in some geographical areas.
1 Biological Oxygen Demand, which is a measure of the potential of organic wastes to compete with aquatic life for dissolved oxygen
Biofuels Solid Waste and Effluent Impacts
Solid Waste
• Solid wastes issues are likely to bemanageable for projected single plant sizes
• Solid waste is likely to be less an issue forbiofuels compared to biopower applications
• Solid waste production and disposal may bean issue for fermentation based processeswhich generate waste biomass in the form oforganic cell mass materials
• Ash production is may still be an issue sincemost biomass biofuel plants will use ligninand cell mass as fuel for on-site powergeneration
– Biomass ash is generally non-toxic andis capable of being used, and even sold,for beneficial purposes (e.g., fertilizer)
Effluent Waste
• Effluent can originate from a number ofsources, but is usually preventable
– Effluent from fermenters (ethanolproduction) is typically filtered andrecycled, and the solids are de-wateredfor handling as solid wastes
– Facilities may have to monitor or controlstorm and wash-down runoff, which maycontain substances leached frombiomass storage and handling areas
– Effluent can contain suspended solidsand BOD1, but toxicity is not usually aserious concern
• Fischer-Tropsch based processes generatewater which may be treated and used forirrigation of the biomass feedstock
• Water requirements for mega-scale ethanolplants may be an issue in semi/aridgeographical areas

413CR/71038Final CAM Oct-01
Blended cellulosic ethanol is used to illustrate the possible environmentalbenefit of biomass fuels, if deployed aggressively.• Blended cellulosic ethanol has the potential to result in a aggressive growth of
biomass derived fuels (to a level of 334 million GJ per year of fuel; 3.4 billiongallons of ethanol)
• Corn stover was taken as an example as its potential use alone could reachthe biofuels aggressive goal (334 million GJ of fuel)
• There is an excess of corn stover over that which would be required tomanufacture the ethanol for blending
• The charts that follow use a total of 50,000 thousand tons of stover• The resulting possible total impact of cellulosic ethanol provides an illustration
of potential environmental benefits of biofuels• The biomass fuels are compared with the equivalent gasoline-related
emissions
Biofuels Example Environmental Impact

414CR/71038Final CAM Oct-01
0
5,000
10,000
15,000
20,000
25,000
30,000
Blended Ethanol fromCorn Stover SSF 2010
ReformulatedGasoline from
Petroleum
Thou
sand
met
ric to
ns o
f CO
2 p
rodu
ced
per y
ear
Vehicle End UseFuel MarketingFuel DistributionFuel ProductionBiomass TransportBiomass Production
Biofuels Environmental Impact
23000 thousand metrictons of CO2
avoided per year
1. The Emissions shown produce a total of 334,000,000 GJ of fuel per year using a total of 50,385 thousand tons per year of blended ethanol from cornstover using NREL SSF 2010. Only the emissions associated with ethanol are shown. Fuel economy of 0.22 miles/MJ fuel.
Carbon Dioxide Avoided per YearThousand Metric tons for 334,000,000 GJ/yr
Sulfur Dioxide Increasemetric tons for 334,000,000 GJ/yr
0
2,000
4,000
6,000
8,000
10,000
12,000
14,000
16,000
18,000
20,000
Blended Ethanol fromCorn Stover SSF 2010
ReformulatedGasoline from
Petroleumm
etric
tons
of S
O2
prod
uced
per
yea
r
Vehicle End UseFuel MarketingFuel DistributionFuel ProductionBiomass TransportBiomass Production
10,000 metric tons per yearof SO2 net addition
Blended ethanol has significant carbon dioxide reduction benefits. Eventhough biofuels are low in sulfur, the total chain emissions are comparableto petroleum fuels.
Reduction of diesel engine use in fuel processing/production may reducetotal biofuel chain sulfur emissions.

415CR/71038Final CAM Oct-01
Biofuels Environmental Impact
Nitrogen Oxides Increasemetric tons for 334,000,000 GJ/yr
0
5,000
10,000
15,000
20,000
25,000
30,000
35,000
Blended Ethanol fromCorn Stover SSF 2010
ReformulatedGasoline from
Petroleum
met
ric to
ns o
f NO
x pr
oduc
ed p
er y
ear
Vehicle End UseFuel MarketingFuel DistributionFuel ProductionBiomass TransportBiomass Production
1. The Emissions shown produce a total of 334,000,000 GJ of fuel per year using a total of 50,385 thousand tons per year of blended ethanol from cornstover using NREL SSF 2010. Fuel economy of 0.22 miles/MJ fuel. Only the emissions associated with ethanol are shown.
12,500 metric tons per yearof NOx Net addition
Benefits in NOx reduction are negligible for cellulosic ethanol when theemissions control on the ethanol plant are comparable to refinery practice.
Actual vehicle NOx emissions were assumed to be the same for ethanol asfor the gasoline chain, dictated by relevant vehicle emission standards.

416CR/71038Final CAM Oct-01
The method of analysis has implications in the conclusions for possibleeconomic impact of accelerated biomass use for fuel.• We assumed that the capital investment associated with biomass production is
contained in the feedstock price• One weakness of this method is that it does not account for any additional
investment of equipment that is needed to collect the biomass not currentlyharvested
• The same thought experiment used to illustrate environmental impacts is usedhere to illustrate the possible impacts of accelerated biomass use using cornstover cellulosic ethanol for blending
• The investments shown produce a total of 3.4 billion gallons of ethanol (334million GJ per year) using a total of 50,000 thousand tons per year of cornstover
Biofuels Example Economic Impact

417CR/71038Final CAM Oct-01
0
1,000
2,000
3,000
4,000
5,000
6,000
7,000
8,000
9,000
10,000
Biomass Production Biomass Transport Fuel Production Fuel Distribution Fuel Marketing
Mill
ion
Dol
lar I
nves
tmen
t
WestSENWNEGreat Lakes
One-Time Total Capital Investment for Blended EthanolUsing Next Generation SSCF Technology with Corn Stover: Million dollar Investment
1. The investments shown produce a total of 334,000,000 GJ of fuel per year using a total of 50,385 Ktons per year of blended ethanol from corn stover usingNREL SSF 2010
2. The capital investment associated with biomass production is assume to be contained in the feedstock cost.
Biofuels Economic Impact Regional
In terms of one-time investment, the bulk of the capital required may be inprocessing plants for cellulosic ethanol.

418CR/71038Final CAM Oct-01
0.00.10.20.30.40.50.60.70.80.91.01.11.21.31.41.51.6
BiomassProduction
BiomassTransport
FuelProduction
FuelDistribution
FuelMarketing
Leve
lized
cos
t of f
uel
$ pe
r gal
lon
0.00.10.20.30.40.50.60.70.80.91.01.11.21.3
Biomass Fuel PetroleumFuel
Non-fuel O&M CapitalRecovery
Leve
lized
cos
t of f
uel
$ pe
r gal
lon
Value creation for blended cellulosic ethanol is comparably split betweenactual production of biomass and manufacture of the fuel.
Biofuels Economic Impact Rural Impact
Corn Stover Blended EthanolNext Generation SSCF TechnologyLevelized Cost of Fuel, $ per gallon
1. Capital recovery cost per year are a 13% per year for biomass transport investment and 15% for fuel production investment, 9% for fuel distributioninvestment, and 25% for fuel marketing. The capital recovery for biomass production is included in the price for biomass.
2. The fuel operating cost for biomass production is solely the cost of the biomass. The capital, non-fuel operating, and petroleum fuel costs in biomassproduction are incorporated into the price for biomass
3. The feedstock cost of corn stover is $30 per ton.
Corn Stover Blended EthanolNext Generation SSCF TechnologyLevelized Cost of Fuel, $ per gallon
Rural Semi-Rural

419CR/71038Final CAM Oct-01
0
500
1,000
1,500
2,000
2,500
3,000
Biomass Production Biomass Transport Fuel Production Fuel Distribution Fuel Marketing
Mill
ion
Dolla
rs o
f Cos
t per
yea
r
Biomass FeedstockFuel Operating CostNon-fuel Operating CostCapital Recovery Cost
Biofuels Economic Impact Rural Impact
1. Capital recovery cost per year are a 13% per year for biomass transport investment and 15% for fuel production investment, 9% for fuel distributioninvestment, and 25% for fuel marketing.
2. The fuel operating cost for biomass production is solely the cost of the biomass. The capital, non-fuel operating, and petroleum fuel costs in biomassproduction are incorporated into the price for biomass
3. The feedstock cost of corn stover is $30 per ton.4. The investments shown produce a total of 334,000,000 GJ of fuel per year using a total of 50,385 thousand tons per year of blended ethanol from corn
stover using NREL SSF 2010
Blended Ethanol from Corn Stover Using Next Generation SSCF TechnologyCost of Total Fuel Chain, $Millions/yr
The annual costs are comparable between the cost of the biomass and thecost of operating the processing plants for cellulosic blended ethanol.
Biomass Feedstock
only

420CR/71038Final CAM Oct-01
Biofuels Market Potential Summary
Cellulosic ethanol as a blending agent is a probable avenue to increase useof biomass-derived fuels and could lead to aggressive growth of biomassfor fuels.• Pure fuels represent the largest potential opportunity for the use of biomass
fuels• However, the premium associated with pure biomass fuels is projected to be at
least 100 percent compared to projected petroleum fuels (exclusive of anyincentives)
• Although not shown, FT diesel from biomass could be used as a blendingagent (providing a zero sulfur, zero aromatic blending stock)
• Provided that low cost biomass feedstock can be used, cellulosic ethanol forblending could provide a major avenue to increase the use of biomass derivedfuels
• Corn ethanol also is a continuing option for a blending stock• Significant demands for ethanol for blending may be highly dependent upon
the demand for oxygenates for reformulated fuels and the phasing-out ofMTBE

421CR/71038Final CAM Oct-01
0
500
1,000
1,500
2,000
2,500
3,000
Pure Corn Ethanol Corn ethanol forBlending
Cellulosic ethanol,pure fuel
Cellulosic ethanol forblending
Pure FT Diesel forfuel
Fuel
ene
rgy
valu
e,
Mill
ion
GJ
of fu
el p
er y
ear
WesternSoutheastNorthwestNortheastGreat Lakes
Biofuels Overview of Market Potential
Pure fuels represent the largest opportunity; however, the projected costssuggest that blended fuels are more likely in the near to mid-term.
1. The bars represent using the entire resource to generate fuel.2. Cellulosic ethanol includes corn stover, wheat straw, switchgrass, and poplar using the 2010 NREL SSF technology for ethanol production.3. FT diesel (Fischer-Tropsch) includes corn stover, wheat straw, switchgrass, and poplar.4. Ethanol fuel blends are on a volume basis at 10 percent by volume5. The following energy values have been used for the fuels: Ethanol 88.6 MJ per gal.; FT diesel 138.4 MJ per gal.6. Corn ethanol for blending is not resource limited, but demand limited in all regions7. Cellulosic ethanol for blending is demand limited in all regions except the Northeast.
Maximum Biofuel MarketAggressive Goal for Biofuels 345 million GJCurrent Biofuel production = 115 million GJ

422CR/71038Final CAM Oct-01
Scenario Analysis
4
Policy Options
5
Conclusions & Recommendations
6
Benefit & Impact Analysis
7
Table of Contents
Identification of Options
Background & Objectives
Executive Summary
3
1
0
Baseline Use of Biomass2
• Resource Assessment• Fossil Chain Baselines• Biopower Options• Biofuel Options•• Bioproduct OptionsBioproduct Options

423CR/71038Final CAM Oct-01
Bioproducts Air Emissions Summary
Bioproducts can offer significant benefits, though not in absolute terms,but at a modest ultimate cost to the nation.• CO2 emissions of bioproducts could offer significant benefits but the absolute amount is
somewhat limited by the size of chemicals markets• Criteria pollutant emissions are not strongly impacted by the implementation of
bioproducts• The solid and water effluent waste is likely to have the same issues as for cellulosic
ethanol implementation and is expected to be manageable– Solid wastes are expected to be biodegradable and usable as fuel (e.g. Cell mass)– Water will contain suspended solids and toxicity is not a serious concern– Water use for processing (especially for fermentation) may be a concern in arid or semi-arid
regions
• Production As costs for bioproducts appear to be approaching those of conventionalproducts, the cost of implementation of bioproducts could eventually be quite low
• Bioproducts will primarily off-set products now produced from partially importedpetroleum, thus the cost of bioproducts, will be off-set partially by increased economicactivity and tax revenues
• Most of the economic value-added in the production of bioproducts is added in theconversion plant, which is most likely located near existing chemical plants

424CR/71038Final CAM Oct-01
In our methodology we did not consider the post-consumer fate of theproducts, resulting in the maximum impact of bioproducts.• For carbon dioxide emissions, the methodology assumes that carbon is sequestered in
the final product– This is equivalent to the product being land-filled with the carbon removed from the carbon cycle– This analysis does not take into account the product’s biodegradability– This does not take into account the final product being “recycled” or recovered for its energy value
• The value chain analyzed ends at the primary processing plant gate– This has implications for the other emissions analyzed (e.g. SO2, NOx, hydrocarbons, CO and PM)
• The analysis did not account for downstream pieces of the value chain that will generateadditional emissions for neither the bioproduct nor the conventional product– Transportation and distribution of the primary product if applicable– Further processing the primary product to form the final consumer product– Any necessary processing to form a derivative product– Associated transportation, distribution, and marketing of the final product form
• The level of information available has implications in emission estimation– Most processes in this analysis used grid average electricity (and its associated emissions)– In reality, plant integration could shift to onsite power production to reduce grid demand (with
possibly lower net emissions)
Bioproducts Air Emissions Methodology
This analysis is not a product life cycle analysis and should not beinterpreted as such.

425CR/71038Final CAM Oct-01
Air emissions were estimated and included those associated with biomassproduction & transportation and processing up to the primary plant gate.• Emissions associated with biomass production are included in the analysis
– Most emissions are associated with planting and harvesting the biomass– Emissions with fertilizer use are also included
• The analysis assumes that on average biomass transportation to theprocessing plant involves 50-mile one-way trips– Emissions associated with diesel trucks are included
• The plant processing emissions are associated with three main components– Diesel engine use for onsite biomass handling contribute the bulk of the emissions– Onsite power production particularly for waste boilers and tail gas combustion– Emissions associated with average industrial grid mix of electricity
• For the processing plants, all equipment except diesel engines were assumedto be state-of-the-art with the associated best available control technology
• Diesel engine use within the plant gate was assumed to be a 50/50 mix of bestavailable and uncontrolled engines
Bioproducts Air Emissions Methodology
The premise is carbon in the final product is “sequestered”; essentially theproduct is land-filled so that the carbon does not re-enter the carbon cycle.

426CR/71038Final CAM Oct-01
Bioproducts Air Emissions Baseline
The diverse nature of products and the complexity of the various valuechains makes it difficult to use a common baseline for comparison.• We used sample products which represent a range of those obtained with
current promising processing technology– Lactic acid and 1,3-propanediol from fermentation of starch feedstocks– Phenolics and levoglucosan from pyrolysis of a variety of woody cellulosics– Naphtha obtained via biomass gasification and Fischer-Tropsch synthesis
• Emissions were estimated to the primary plant gate and do not contain theassociated emissions for a number of subsequent value chain steps– Distribution of the raw product– Subsequent processing of the raw product to make the final end product (e.g. polymer
synthesis of monomers, blow-molding of the polymer to make the final part)– Distribution and marketing of the final products– Emissions associated with end use
• We took as an example, emissions from two fossil derived “building blocks” asa comparison (to the primary plant processing gate)– Methanol obtained from natural gas– Liquefied petroleum gas (LPG) from petroleum

427CR/71038Final CAM Oct-01
Bioproducts Air Emissions CO2 Calculations
For fuels, the CO2 sequestered in the biomass is assumed to equal the CO2released by the vehicle.
Only the CO2 emissions associated with fossil fuels are incorporated in theresults.
End-useMarketingDistributionProduction/ConversionBiomass TransportBiomass Production
CO2 sequestered in Biomass CO2 released by vehicle
CO2 associated with fossil fuels

428CR/71038Final CAM Oct-01
Bioproducts Air Emissions CO2 Calculations
For products, the CO2 sequestered in the biomass is credited to theproduct in the product conversion step.
The CO2 emissions associated with fossil fuels and the sequestering ofCO2 in the product are incorporated in the results.
Production/ConversionBiomass TransportBiomass Production
CO2 sequestered in Biomass
CO2 associated with fossil fuels

429CR/71038Final CAM Oct-01
Assumptionsand
Methodology
• CO2 emissions from the utilization of any biomass material as a fuel for engine use or power generation is assumedto be zero (closed-loop carbon cycle)
– CO2 emissions occur when other fuels and materials (e.g., chemical fertilizers) are used to grow, harvest,transport and process the biomass
• CO2 emissions from any degrading of the final product itself are not included• The results shown are estimated primary plant gate emissions and do not include those emissions from downstream
portions of the value chain such as derivative manufacture, product formulation, distribution and marketing• It is assumed that the product is essentially land-filled, effectively sequestering the carbon contained in the product
Comments
• For agricultural residues & energy crops, many biomass feedstock types are possible. Woody biomass such aspoplar and starch feedstock are used here as an example
• The fermentation results are incomplete because they do not contain the associated emissions to make the starchfrom the corn. The fermentation emissions contain those associated with growing and transporting the corn to theprocessing site. Emissions associated with the actual fermentation and clean-up steps are included
• The CO2 emissions shown are generated primarily from grid average electricity and fossil fuels required (mostlydiesel fuel for harvesting the biomass, and transporting the biomass to the processing plant and internal plantrequirements). The processing plant requirements are mainly for moving the biomass around the plant within theplant gate. All options used comparable diesel fuel on a biomass weight basis
Conclusions
• Bioproducts offer a route for GHG reduction. An assumption of the analysis is that the carbon contained in theproduct is effectively sequestered. There is a strong caveat in that subsequent portions of the value chain have notbeen considered in this analysis; this approximates the emissions generated up to the primary processing plant gate
• Fully integrated plants will likely reduce grid average electricity requirements which will likely lower associatedemissions of CO2
• Methods to reduce biomass handling/transport within the plant site will impact the carbon dioxide emissions for theentire chain
• Harvesting methods used will dramatically impact biomass fuel chain emissions which are directly attributed to fossilfuels used in harvesting
Fully integrated bioproduct plants, part of a biorefinery concept, are likelyto have reduced CO2 emissions and may be an avenue for GHG reduction.
Bioproducts Air Emissions Carbon Dioxide

430CR/71038Final CAM Oct-01
Carbon dioxide emissions are mainly associated with the use of diesel fuelin engines, especially in biomass production and grid electricity use.
Bioproducts Air Emissions Carbon Dioxide
Plant Gate Air Emissions of Sample Bioproduct OptionsCO2 emissions, MT per 1000 tons product
-1000 -800 -600 -400 -200 0 200 400 600 800
Naphtha from poplar
Phenolics from poplar
Levoglucosan from poplar
1,3-propanediol from corn
Lactic acid from corn
Methanol from natural gas
LPG from petroleum
MT CO2 Emissions per 1000 tons of product
Biomass ProductionBiomass TransportationPrimary Processing
319
693
-324
-737
117
453
412
Total CO2 (MT/1000 tons product)
Fully integrated bioproduct plants, part of a biorefinery concept, are likelyto have reduced CO2 emissions and may be an avenue for GHG reduction.

431CR/71038Final CAM Oct-01
Assumptionsand
Methodology
• SO2 emissions occur both from the utilization of the biomass itself plus from the use of other fuels and materials (e.g.,chemical fertilizers), which are used to grow, harvest, transport and process the biomass
• Sulfur dioxide emissions for naphtha (from FT synthesis) are lower primarily because sulfur-free FT-diesel is usedwithin the plant processing gate to move the biomass within the processing plant
• The results shown are estimated plant gate emissions and do not include those emissions from downstream portionsof the value chain such as derivative manufacture, product formulation, distribution and marketing
Comments
• For agricultural residues & energy crops, many biomass feedstocks are possible. Woody biomass such as poplar andstarch feedstock are used here as an example
• The fermentation results are incomplete because they do not contain the associated emissions to make the starchfrom the corn. The fermentation emissions contain those associated with growing and transporting the corn to theprocessing site. Emissions associated with the actual fermentation and clean-up steps are included
• The SO2 emissions shown are generated primarily from grid average electricity use and fossil fuels required (mostlydiesel fuel for harvesting the biomass, and transporting the biomass to the processing plant and internal plantrequirements). The processing plant requirements are mainly for moving the biomass around the plant within theplant gate. All options used comparable diesel fuel on a biomass weight basis
Conclusions
• Bioproducts do not appear to offer sulfur dioxide reduction benefits. There is a strong caveat in that subsequentportions of the value chain have not been considered in this analysis; this approximates the emissions generated upto the primary processing plant gate
• Biomass transport and handling add little SO2 emissions• The sulfur dioxide emissions shown are directly attributable to petroleum diesel use within the processing plant gate
to move and handle the biomass within the plant site. Methods that reduce the amount of diesel fuel used forconveyors and fork lifts, for example will dramatically reduce chain emissions for the biomass fuels
• The assumed use of grid average electricity also contributes significantly to the sulfur emissions within the processingplant, especially for the fermentation-based products
• Fully integrated plants, part of a bio-refinery concept ,will likely have lower grid average electricity requirements andhave lower associated emissions
Bioproducts do not offer significant benefits for sulfur dioxide reductioncompared to petrochemicals.
Bioproducts Air Emissions Sulfur Dioxide

432CR/71038Final CAM Oct-01
0.0 0.5 1.0 1.5 2.0 2.5 3.0 3.5 4.0 4.5
Naphtha from poplar
Phenolics from poplar
Levoglucosan from poplar
1,3-propanediol from corn
Lactic acid from corn
Methanol from natural gas
LPG from petroleum
MT SO2 per 1000 tons product
Biomass Production
Biomass Transportation
Primary Processing
The assumed use of grid average electricity contributes the bulk of thesulfur emissions in the processing plant step.
Bioproducts Air Emissions Sulfur Dioxide
Plant Gate Air Emissions of Sample Fuel OptionsSO2 emissions, MT per 1000 tons product
0.31
0.81
1.1
2.8
4.0
0.49
0.62
Total SO2 (MT/1000 tons product)
Diesel fuel use contributes the bulk of emissions in the biomassproduction step. Naphtha processing used FT-diesel (sulfur-free) fuel.

433CR/71038Final CAM Oct-01
Assumptionsand
Methodology
• NOx emissions occur both from the utilization of the biomass itself plus from the use of other fuels andmaterials (e.g., chemical fertilizers), which are used to grow, harvest, transport and process the biomass
• The emission factors used for diesel engines used in biomass production, biomass transportation, andengines used at the processing plant use 50/50 emissions which represent that an average of 1/2 of theengines used are state-of-the-art and 1/2 are uncontrolled. Emissions from boilers and turbines at theprocessing plant were assumed to be state-of-the-art
• The results shown are estimated plant gate emissions and do not include those emissions fromdownstream portions of the value chain such as derivative manufacture, product formulation, distributionand marketing
Comments
• For agricultural residues & energy crops, many biomass feedstocks are possible. Woody biomass such aspoplar and starch feedstock are used here as an example
• The fermentation results are incomplete because they do not contain the associated emissions to makethe starch from the corn. The fermentation emissions contain those associated with growing andtransporting the corn to the processing site. Emissions associated with the actual fermentation and clean-up steps are included
• The processing plant fossil fuel requirements are mainly for grid average electricity use and diesel fuel formoving the biomass around the plant within the plant gate. All options used comparable diesel fuel on abiomass weight basis
Conclusions
• Biomass-only options do not appear to offer significant NOx emission reduction benefits. There is a strongcaveat in that subsequent portions of the value chain have not been considered in this analysis; thisapproximates the emissions generated up to the primary processing plant gate
• NOx emissions are generated primarily in combustion applications• The main avenue to reduce biomass fuel chain emissions is the use of state-of-the-art engines and
combustion turbines with reduced NOx generation capability• Fully integrated plants will likely use lower levels of grid average electricity than that used in this analysis.
Lower emissions are likely, especially in fermentation-based processes (compared to that shown in thisanalysis)
Biomass products have comparable associated NOx emissions comparedto typical petrochemicals.
Bioproducts Air Emissions Nitrogen Oxides

434CR/71038Final CAM Oct-01
0.0 0.5 1.0 1.5 2.0 2.5 3.0 3.5 4.0 4.5
Naphtha from poplar
Phenolics from poplar
Levoglucosan from poplar
1,3-propanediol from corn
Lactic acid from corn
Methanol from natural gas
LPG from petroleum
MT NOx per 1000 tons product
Biomass Production
Biomass Transportation
Primary Processing
NOx generation occurs about equally from the production of the biomassand the downstream processing steps.
Bioproducts Air Emissions Nitrogen Oxides
Plant Gate Air Emissions of Sample Fuel OptionsNOx emissions, MT per 1000 tons product
3.8
4.2
2.3
0.68
1.1
3.0
0.48
Total NOx (MT/1000 tons product)
For the fermentation-based processes, the bulk of the emissions in primaryprocessing is associated with use of grid average electricity.

435CR/71038Final CAM Oct-01
Assumptionsand
Methodology
• Methane emissions occur both from the utilization of the biomass itself plus from the use of other fuels andmaterials (e.g., chemical fertilizers), which are used to grow, harvest, transport and process the biomass
• The emission factors used for diesel engines used in biomass production, biomass transportation, andengines used at the processing plant use 50/50 emissions which represent that an average of 1/2 of theengines used are state-of-the-art and 1/2 are uncontrolled. Emissions from boilers and turbines at theprocessing plant were assumed to be state-of-the-art
• The results shown are estimated plant gate emissions and do not include those emissions fromdownstream portions of the value chain such as derivative manufacture, product formulation, distributionand marketing
Comments
• For agricultural residues & energy crops, many biomass feedstocks are possible. Woody biomass such aspoplar and starch feedstock are used here as an example
• The fermentation results are incomplete because they do not contain the associated emissions to makethe starch from the corn. The fermentation emissions contain those associated with growing andtransporting the corn to the processing site. Emissions associated with the actual fermentation and clean-up steps are included
• The processing plant fossil fuel requirements are mainly for moving the biomass around the plant withinthe plant gate. All options used comparable diesel fuel on a biomass weight basis
Conclusions
• Biomass-only options do not result in higher net methane emissions. There is a strong caveat in thatsubsequent portions of the value chain have not been considered in this analysis; this approximates theemissions generated up to the primary processing plant gate
• Methane emissions associated with biomass production/harvesting and biomass transportation to theprocessing plant are minimal
Net increase of emissions of methane is likely not an issue for bioproducts.
Bioproducts Air Emissions Methane
Most methane generation is expected in the primary processing step tomake the product.

436CR/71038Final CAM Oct-01
0.0 0.1 0.2 0.3 0.4 0.5 0.6 0.7
Naphtha from poplar
Phenolics from poplar
Levoglucosan from poplar
1,3-propanediol from corn
Lactic acid from corn
Methanol from natural gas
LPG from petroleum
MT methane per 1000 tons product
Biomass Production
Biomass Transportation
Primary Processing
Bioproducts are likely to have comparable or lower methane emissions asfor routes using petrochemicals.
Bioproducts Air Emissions Methane
Plant Gate Air Emissions of Sample Fuel OptionsMethane emissions, MT per 1000 tons product
0.02
0.04
0.09
0.12
0.19
0.60
0.07
Total methane (MT/1000 tons product)
Methane generation occurs mostly during the processing steps.

437CR/71038Final CAM Oct-01
Assumptionsand
Methodology
• Nonmethane hydrocarbon (NMHC) emissions occur both from the utilization of the biomass itself plusfrom the use of other fuels and materials (e.g., chemical fertilizers), which are used to grow, harvest,transport and process the biomass
• The emission factors used for diesel engines used in biomass production, biomass transportation, andengines used at the processing plant use 50/50 emissions which represent that an average of 1/2 of theengines used are state-of-the-art and 1/2 are uncontrolled. Emissions from boilers and turbines at theprocessing plant were assumed to be state-of-the-art
• The results shown are estimated plant gate emissions and do not include those emissions fromdownstream portions of the value chain such as derivative manufacture, product formulation, distributionand marketing
Comments
• For agricultural residues & energy crops, many biomass feedstocks are possible. Woody biomass such aspoplar and starch feedstock are used here as an example
• The fermentation results are incomplete because they do not contain the associated emissions to makethe starch from the corn. The fermentation emissions contain those associated with growing andtransporting the corn to the processing site. Emissions associated with the actual fermentation and clean-up steps are included
• The processing plant fossil fuel requirements are mainly for moving the biomass around the plant withinthe plant gate. All options used comparable diesel fuel on a biomass weight basis
Conclusions
• Biomass-only options have comparable nonmethane hydrocarbon emissions as petrochemicals. There isa strong caveat in that subsequent portions of the value chain have not been considered in this analysis;this approximates the emissions generated up to the primary processing plant gate
• Diesel engine use both in biomass production/harvesting and primary processing contribute significantly tothe generation of nonmethane hydrocarbon emissions
Nonmethane hydrocarbons emissions are likely to be comparable with thatassociated with petrochemical manufacture.
Bioproducts Air Emissions Non-Methane Hydrocarbons

438CR/71038Final CAM Oct-01
0.00 0.05 0.10 0.15 0.20 0.25 0.30 0.35
Naphtha from poplar
Phenolics from poplar
Levoglucosan from poplar
1,3-propanediol from corn
Lactic acid from corn
Methanol from natural gas
LPG from petroleum
MT NMHC per 1000 tons product
Biomass Production
Biomass Transportation
Primary Processing
An important source of nonmethane hydrocarbon emissions are dieselengines used during biomass production.
Bioproducts Air Emissions Non-methane Hydrocarbons
Plant Gate Air Emissions of Sample Fuel OptionsNon-methane hydrocarbon emissions, MT per 1000 tons product
0.31
0.18
0.11
0.08
0.19
0.09
0.17
Total NMHC (MT/1000 tons product)

439CR/71038Final CAM Oct-01
Assumptionsand
Methodology
• Particulate matter emissions occur both from the utilization of the biomass itself plus from the use of other fuels andmaterials (e.g., chemical fertilizers), which are used to grow, harvest, transport and process the biomass
• The emission factors used for diesel engines used in biomass production, biomass transportation, and engines usedat the processing plant use 50/50 emissions which represent that an average of 1/2 of the engines used are state-of-the-art and 1/2 are uncontrolled. Emissions from boilers and turbines at the processing plant were assumed to bestate-of-the-art
• The results shown are estimated plant gate emissions and do not include those emissions from downstream portionsof the value chain such as derivative manufacture, product formulation, distribution and marketing
Comments
• For agricultural residues & energy crops, many biomass feedstocks are possible. Woody biomass such as poplar andstarch feedstock are used here as an example
• The fermentation results are incomplete because they do not contain the associated emissions to make the starchfrom the corn. The fermentation emissions contain those associated with growing and transporting the corn to theprocessing site. Emissions associated with the actual fermentation and clean-up steps are included
• The processing plant fossil fuel requirements and its associated emissions are mainly for moving the biomass aroundthe plant within the plant gate. All options used comparable diesel fuel on a biomass weight basis
• The PM emissions shown are generated primarily from fossil fuels required (mostly diesel fuel) for internal plantrequirements
Conclusions
• Biomass-only options have comparable PM emissions as petrochemicals. There is a strong caveat in thatsubsequent portions of the value chain have not been considered in this analysis; this approximates the emissionsgenerated up to the primary processing plant gate
• Diesel engine use both in biomass production/harvesting and primary processing contribute significantly to thegeneration of PM emissions.
• PM emissions are generated primarily in combustion applications. The main avenue to reduce biomass fuel chainemissions is the use of state-of-the-art engines and combustion turbines with reduced PM generation capability forbiomass harvesting and transportation
Bioproducts will offer comparable PM emissions compared topetrochemicals when including those associated with biomass production.
Bioproducts Air Emissions Particulate Matter (PM)

440CR/71038Final CAM Oct-01
0.00 0.05 0.10 0.15 0.20 0.25
Naphtha from poplar
Phenolics from poplar
Levoglucosan from poplar
1,3-propanediol from corn
Lactic acid from corn
Methanol from natural gas
LPG from petroleum
MT particulate matter per 1000 tons product
Biomass Production
Biomass Transportation
Primary Processing
An important source of particulate matter emissions are diesel enginesused during biomass production.
Bioproducts Air Emissions Particulate Matter
Plant Gate Air Emissions of Sample Fuel OptionsParticulate matter emissions, MT per 1000 tons product
0.05
0.06
0.13
0.21
0.09
0.04
0.17
Total PM (MT/1000 tons product)
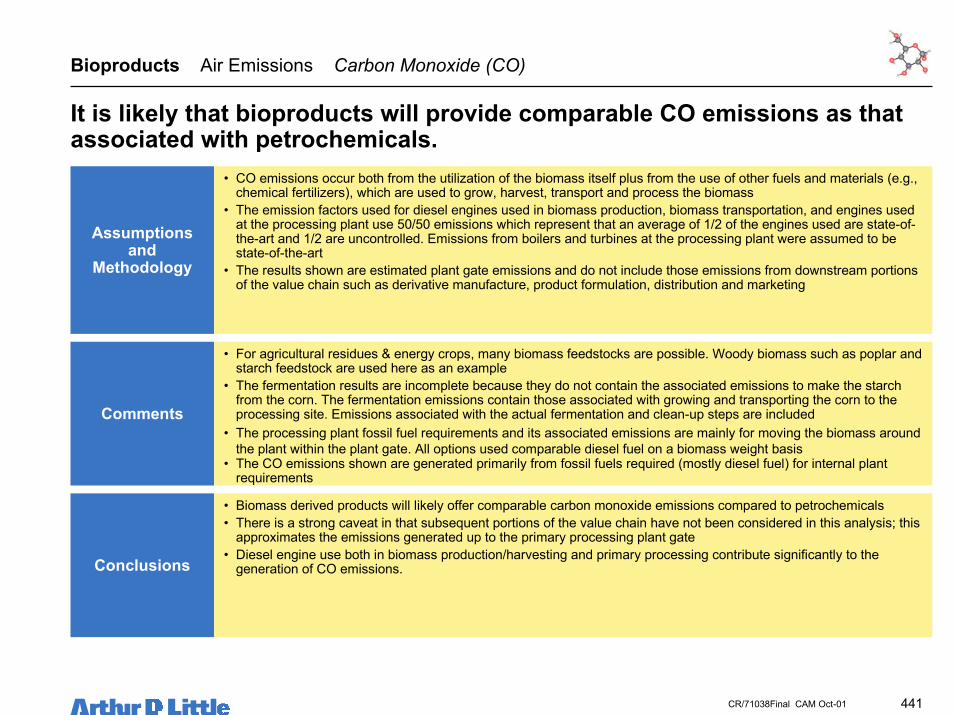
441CR/71038Final CAM Oct-01
Assumptionsand
Methodology
• CO emissions occur both from the utilization of the biomass itself plus from the use of other fuels and materials (e.g.,chemical fertilizers), which are used to grow, harvest, transport and process the biomass
• The emission factors used for diesel engines used in biomass production, biomass transportation, and engines usedat the processing plant use 50/50 emissions which represent that an average of 1/2 of the engines used are state-of-the-art and 1/2 are uncontrolled. Emissions from boilers and turbines at the processing plant were assumed to bestate-of-the-art
• The results shown are estimated plant gate emissions and do not include those emissions from downstream portionsof the value chain such as derivative manufacture, product formulation, distribution and marketing
Comments
• For agricultural residues & energy crops, many biomass feedstocks are possible. Woody biomass such as poplar andstarch feedstock are used here as an example
• The fermentation results are incomplete because they do not contain the associated emissions to make the starchfrom the corn. The fermentation emissions contain those associated with growing and transporting the corn to theprocessing site. Emissions associated with the actual fermentation and clean-up steps are included
• The processing plant fossil fuel requirements and its associated emissions are mainly for moving the biomass aroundthe plant within the plant gate. All options used comparable diesel fuel on a biomass weight basis
• The CO emissions shown are generated primarily from fossil fuels required (mostly diesel fuel) for internal plantrequirements
Conclusions
• Biomass derived products will likely offer comparable carbon monoxide emissions compared to petrochemicals• There is a strong caveat in that subsequent portions of the value chain have not been considered in this analysis; this
approximates the emissions generated up to the primary processing plant gate• Diesel engine use both in biomass production/harvesting and primary processing contribute significantly to the
generation of CO emissions.
It is likely that bioproducts will provide comparable CO emissions as thatassociated with petrochemicals.
Bioproducts Air Emissions Carbon Monoxide (CO)

442CR/71038Final CAM Oct-01
0.0 0.2 0.4 0.6 0.8 1.0 1.2 1.4
Naphtha from poplar
Phenolics from poplar
Levoglucosan from poplar
1,3-propanediol from corn
Lactic acid from corn
Methanol from naturalgas
LPG from petroleum
MT CO per 1000 tons product
Biomass Production
Biomass Transportation
Primary Processing
Carbon monoxide emissions occur mostly during primary processing withthe combustion of waste gases and waste process fuels.
Bioproducts Air Emissions Carbon Monoxide
Plant Gate Air Emissions of Sample Fuel OptionsCarbon monoxide emissions, MT per 1000 tons product
1.2
1.1
0.37
0.18
1.2
0.42
0.70
Total CO (MT/1000 tons product)

443CR/71038Final CAM Oct-01
Biomass products have similar issues as biofuels with respect to solid andeffluent waste. The major issue is likely to be water treatment capacity.
1 Biological Oxygen Demand, which is a measure of the potential of organic wastes to compete with aquatic life for dissolved oxygen
Bioproducts Solid Waste and Effluent Impacts
Solid Waste
• Solid wastes issues are likely to bemanageable for projected single plant sizes
• Solid waste is likely to be less an issue forbioproducts as compared to biopowerapplications and the same as for biofuels
• Solid waste production and disposal may bean issue for fermentation based processeswhich generate waste biomass in the form oforganic cell mass materials
• Ash production is may still be an issue sincemost biomass product plants (in the form ofbio-refineries) will use lignin and cell massas fuel for on-site power generation
– Biomass ash is generally non-toxic andis capable of being used, and even sold,for beneficial purposes (e.g., fertilizer)
Effluent Waste
• Effluent can originate from a number ofsources, but is usually preventable
– Effluent from fermentors is typicallyfiltered and recycled, and the solids arede-watered for handling as solid wastes
– Facilities may have to monitor or controlstorm and wash-down runoff, which maycontain substances leached frombiomass storage and handling areas
– Effluent can contain suspended solidsand BOD1, but toxicity is not usually aserious concern
• Fischer-Tropsch based processes generatewater which may be treated and used forirrigation of the biomass feedstock
• Water requirements for mega-scalefermentation-based plants may be an issuein semi/arid geographical areas and mightlimit choice of plant location

444CR/71038Final CAM Oct-01
The method of analysis has implications in the conclusions for possibleeconomic impact of accelerated biomass use for bioproducts.• We assumed that the capital investment associated with biomass production is
contained in the feedstock price• One weakness of this method is that it does not account for any additional
investment of equipment that is needed to collect the biomass not currentlyharvested
• Additional investments may be required such as for water treatment, especiallyfor fermentation-based processes
• The investments shown produce a total of:– For phenolics using woody biomass, 139,000 dry tons woody biomass yield 34,000
tons (68 million pounds) phenolics for formaldehyde-phenol resin applications– For 1,3-propanediol using corn, 288,000 dry tons corn yield 2,650,000 tons diol (5.3
billion pounds)
Bioproducts Example Economic Impact
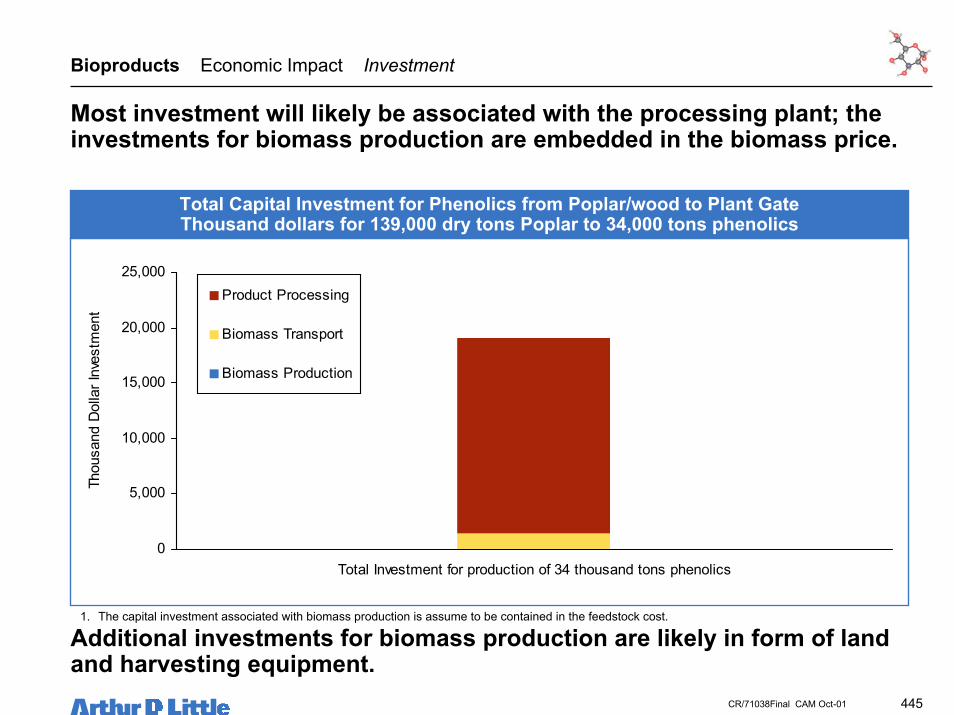
445CR/71038Final CAM Oct-01
0
5,000
10,000
15,000
20,000
25,000
Total Investment for production of 34 thousand tons phenolics
Thou
sand
Dol
lar I
nves
tmen
t
Product Processing
Biomass Transport
Biomass Production
Total Capital Investment for Phenolics from Poplar/wood to Plant GateThousand dollars for 139,000 dry tons Poplar to 34,000 tons phenolics
1. The capital investment associated with biomass production is assume to be contained in the feedstock cost.
Bioproducts Economic Impact Investment
Most investment will likely be associated with the processing plant; theinvestments for biomass production are embedded in the biomass price.
Additional investments for biomass production are likely in form of landand harvesting equipment.

446CR/71038Final CAM Oct-01
0
1,000
2,000
3,000
4,000
5,000
6,000
7,000
8,000
Biomass Production Biomass Transportation Processing
Thou
sand
Dol
lars
of C
ost p
er y
ear
Biomass FeedstockFuel Operating CostNon-fuel Operating CostCapital Recovery Cost
Bioproducts Economic Impact Annual Cost
1. Capital recovery cost per year are a 13% per year for biomass transport investment and 15% for product processing investment2. The fuel operating cost for biomass production is solely the cost of the biomass. The capital, non-fuel operating, and petroleum fuel costs in biomass
production are incorporated into the price for biomass3. The feedstock cost of poplar is $50 per ton.4. Production volume shown is 34 thousand tons phenolics using 139,000 dry tons woody biomass.
Phenolics from poplar/wood, Levelized Cost of Product to Plant GateCost of Product, $thousand/yr for 34,000 tons Phenolics
The annual costs for phenolics is weighed towards biomass feedstockfollowed by costs associated with processing.
Rural Semi-Rural

447CR/71038Final CAM Oct-01
0.0
5.0
10.0
15.0
20.0
25.0
BiomassProduction
BiomassTransport
ProductProcessing
Leve
lized
cos
t of p
rodu
ct
cent
s pe
r pou
nd
0.0
5.0
10.0
15.0
20.0
25.0
BiomassFeedstock
PetroleumFuel
Non-fuelO&M
CapitalRecovery
Co-Productcredit
Leve
lized
cos
t of p
rodu
ctce
nts
per p
ound
Bioproducts Economic Impact Rural Impact
Phenolics from poplar/woodLevelized Plant Gate Cost of Product,
cents per pound
1. Capital recovery cost per year are a 13% per year for biomass transport investment and 15% for product processing investment. The capital recovery forbiomass production is included in the price for biomass.
2. The capital, non-fuel operating, and petroleum fuel costs in biomass production are incorporated into the price for biomass3. The feedstock cost of poplar is $50 per ton.
Phenolics from poplar/woodLevelized Plant Gate Cost of Product,
cents per pound
Rural Semi-Rural
The value creation for phenolics, as an example, is spread across rural andsemi-rural areas.

448CR/71038Final CAM Oct-01
0
1,000,000
2,000,000
3,000,000
4,000,000
5,000,000
6,000,000
7,000,000
8,000,000
9,000,000
10,000,000
Total Investment for production of 2650 thousand tons 1,3-propanediol
Thou
sand
Dol
lar I
nves
tmen
t
Product Processing
Biomass Transport
Biomass Production
Total Capital Investment for 1,3-Propanediol from Corn to Primary Plant GateThousand dollars for 288,000 thousand dry tons corn
for 2650 thousand tons 1,3-propanediol
1. The capital investment associated with biomass production is assume to be contained in the feedstock cost.
Bioproducts Economic Impact Investment
Most investment will likely be associated with the processing plant; theinvestments for biomass production are embedded in the biomass price.
Additional investments for biomass production are likely in form of landand harvesting equipment.

449CR/71038Final CAM Oct-01
0
500,000
1,000,000
1,500,000
2,000,000
2,500,000
3,000,000
3,500,000
Biomass Production Biomass Transportation Processing
Thou
sand
Dol
lars
of C
ost p
er y
ear
Biomass FeedstockFuel Operating CostNon-fuel Operating CostCapital Recovery Cost
Bioproducts Economic Impact Annual Cost
1. Capital recovery cost per year are a 13% per year for biomass transport investment and 15% for product processing investment2. The fuel operating cost for biomass production is solely the cost of the biomass. The capital, non-fuel operating, and petroleum fuel costs in biomass
production are incorporated into the price for biomass
1,3-Propanediol from corn, Levelized Cost of Primary Plant Gate,Cost of Product, $thousand/yr for 288,000 thousand dry tons corn
for 2650 thousand tons 1,3-propanediol
Annual costs for fermentation products such as 1,3-propanediol will beassociated with processing, provided inexpensive feedstocks are available.
Rural Semi-Rural
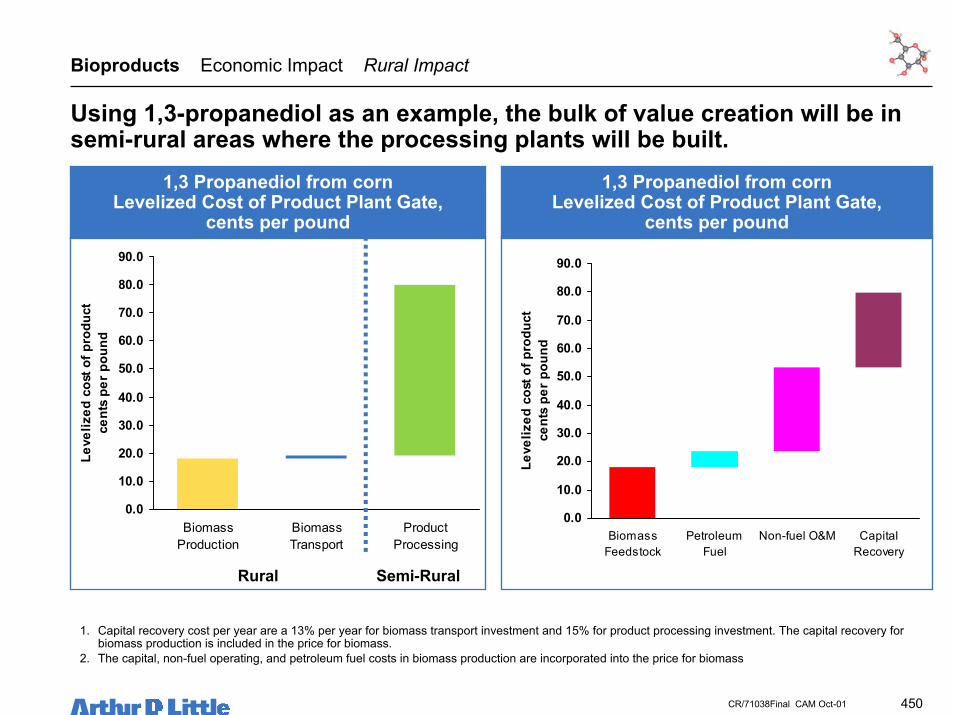
450CR/71038Final CAM Oct-01
0.0
10.0
20.0
30.0
40.0
50.0
60.0
70.0
80.0
90.0
BiomassProduction
BiomassTransport
ProductProcessing
Leve
lized
cos
t of p
rodu
ct
cent
s pe
r pou
nd
0.0
10.0
20.0
30.0
40.0
50.0
60.0
70.0
80.0
90.0
BiomassFeedstock
PetroleumFuel
Non-fuel O&M CapitalRecovery
Leve
lized
cos
t of p
rodu
ctce
nts
per p
ound
Using 1,3-propanediol as an example, the bulk of value creation will be insemi-rural areas where the processing plants will be built.
Bioproducts Economic Impact Rural Impact
1,3 Propanediol from cornLevelized Cost of Product Plant Gate,
cents per pound
1. Capital recovery cost per year are a 13% per year for biomass transport investment and 15% for product processing investment. The capital recovery forbiomass production is included in the price for biomass.
2. The capital, non-fuel operating, and petroleum fuel costs in biomass production are incorporated into the price for biomass
1,3 Propanediol from cornLevelized Cost of Product Plant Gate,
cents per pound
Rural Semi-Rural

451CR/71038Final CAM Oct-01
Policy Options6
Scenario Analysis
4
5
Conclusions & Recommendations
Benefit & Impact Analysis
7
Table of Contents
Identification of Options
Background & Objectives
Executive Summary
3
1
0
Baseline Use of Biomass2

452CR/71038Final CAM Oct-01
Scenario Analysis Objective
Scenario analysis was used to understand the impact of time-relatedfactors in achieving the potential impacts of the biomass options.• The screening and benefit & impact analysis primarily focused on the ultimate
potential of each of the options– Assuming matured technology– Assuming complete market penetration
• Implementing these options will take time, and will require the right actions tobe taken in a timely manner, due to various factors, including:– Time required for technology development process– Time required for application and market development– Market barriers– Implementation of necessary policy actions
• To gain a better understanding of the actions that will be required to achieve asignificant impact with the biomass options, a scenario analysis was performed

453CR/71038Final CAM Oct-01
For each category of options, a business as usual (BAU) and an aggressivescenario were developed.• Business as usual (BAU) scenarios project forward what the impacts would be if no
special actions were taken:– Assumes successful technology development and rates of progress consistent with best in class
performance– Assumes that policy instruments currently in place will continue to be in place in the future– Is based on EIA baseline forecasts for energy prices, economic growth etc.
• The aggressive scenario starts with a biomass vision and asks what actions would haveto be taken to achieve as much impact as possible:– Visions for each of the biomass option categories were developed in a workshop with industry
experts– Detailed timelines were developed to support achieving these visions– Action items were identified that would need to be taken in order to meet the timelines– Aggressive assumptions were used with respect to:
- Technology and application development progress rates- Technology performance- Market acceptance of and market pull for products- Market penetration rates achievable
• Basic economic factors, such as economic growth and energy prices, are the same inboth scenarios
• Technologies are assumed to mainly capture growth markets, rather than replacement(exceptions are black liquor gasification, biomass co-firing, and oxygenate fuel blendstocks)
Scenario Analysis Approach

454CR/71038Final CAM Oct-01
For each sector a baseline was defined and projected out to 2010.
Scenario Analysis Baseline Growth
Sector
Biopower
Bioproducts
Biofuels
BAU2010
BaselineConventional
Units
MW
Billion pounds
million gallons ethanol
10,000 10,000
Aggressive2010
Baseline
21 21
1500 1600
No growth in baseline
Comments
Both the BAU and aggressivescenarios grow at 1.8% per year
(projected rate of total transportationfuels demand)
• In BAU, biofuels baseline grows at1.4% per year (projected rate ofmotor gasoline demand
• For aggressive implementation,biofuels baseline grows at 1.8%per year (projected rate of totaltransportation fuels demand)
1. All growth rate projections taken from USDOE EIA 2001 Energy Outlook, reference case.

455CR/71038Final CAM Oct-01
Performed During Screening
Industry Analysis(Power generation, transport fuels,commodity chemicals)
Comparison of industryneeds with technologycharacteristics(feedstock compatibility, fit withcurrent infrastructure )
Market acceptance analysis(this analysis)
Analysis of competingtechnology (not considered)
Addressable Market(= entire market - limitations due to technology or market fit)
Capturable Market(=addressable market - limitations on rate of
acceptance of new technology)
Market Share(= capturable market -
share captured bycompeting
technologies)
# total marketcapacity
# total marketcapacity
% marketaddressable% market
addressableMarket
penetration(% captured)
Marketpenetration
(% captured)% market
share% market
share# installedcapacity
# installedcapacityx x x =
The scenario analysis involves forecasting the market penetration ofemerging technologies.
Entire MarketAll applications requiring the basic function the new technology offers)
Scenario Analysis Approach Market Penetration Analysis

456CR/71038Final CAM Oct-01
Time after Introduction
Scenario Analysis Market Penetration Analysis Capturable Market
To aid projecting the capturable market, we categorized the technology /market spectrum based on a few important criteria.
• The rate at which technologies capturethe market depends on:– Technology characteristics (technology
economics, new versus retrofit)– Industry characteristics (industry growth,
competition)– External drivers (government regulation,
trade restrictions, wars)
• Historical data reveals that major classesof technology/market with commonmarket-penetration characteristics can bedistinguished
• The Fisher-Pry technology substitutionmodel is a relatively simple but usefulway to predict market penetration for anexisting market of known size
The half time th is the time at which f = 0.5The takeover time ts is the time between f = 0.1 and f = 0.9The parameter c12 = 2 ln(9)/ts
fe c t th
=+ − −
11 12 ( )
E
% o
f Add
ress
able
Mar
ket C
aptu
red
A B DC

457CR/71038Final CAM Oct-01
Characteristic
Payback discretionary
Equipment replacement
Growth (% p.a.)
Attitude to risk
Government regulation
Technology Factors
Industry Factors
External Factors
Time to Saturation (ts)
A
<<1 yrs
None
> 5%
open
forcing
5 yrs
Impact on product quality ++
Impact on plant productivity ++
Technology experience New to U.S. only
B
<1 yrs
minor
> 5%
open
forcing
10 yrs
++
++
New to U.S. only
C
1-3 yrs
Unit operation
2 - 5%
cautious
driving
20 yrs
++
++
New to industry
D
3 - 5 yrs
Plant section
1 - 2%
conservative
none
40 yrs
+
+
New
E
>5 yrs
Entire plant
<1%
averse
none
>40 yrs
O / -
O / -
New
Equipment life <5 yrs 5 - 15 yrs 15 - 25 yrs 25 - 40 yrs > 40 yrs
Payback non-discretionary <<1 yrs <1 yrs 1 - 2 yrs 2 - 3 yrs >3 yrs
Scenario Analysis Capturable Market Technology Classes
Five technology classes, based on historical data for technologyintroductions, were used to characterize market penetration rates.
By rating all applicable categories, consensus can be reached on theappropriate classification and the likely market penetration rate.

458CR/71038Final CAM Oct-01
Technology(basic materials,
working principles)
For the technology development timelines we used our stages-ofdevelopment analysis and associated best-in-class timelines.
ProductRefinement
CustomerNeed
Product ConceptDevelopment
Initial ProductLaunch
Product IdeaDevelopment
Advanced Development CommercializationTechnologyVerification
TechnologyViability
FirstEvidence
Production Process(process to manufacture
technology)
Market(Customers that want
to buy products)
FirstEvidence
Product ConceptViability CommercializationProduct
DesignAdvanced
DevelopmentProduct
(Product incorporatingtechnology)
ProcessIntegration &
DemonstrationCommercializationUnit Operation
DevelopmentProof of
PrinciplesFirst
Evidence
8-15 years 5-10 years 3-8 years 1-4 years 0-2 years
8-15 years 5-10 years 3-8 years 1-4 years 0-2 years
2-15 years 2-15 years 1-4 years 0-1 years 0-0.5 years
2-6 months 2- 12 months 2-8 months1-6 months 1-6 months
Scenario Analysis Technology Development Timeline Considerations
Some of the processes based on biological processes can take somewhatlonger to mature. Polymer market development can take much longer timescales.

459CR/71038Final CAM Oct-01
Scenario Analysis Technology Development & Construction Considerations
The progression of bioproduct use is dependent upon technologyintroduction timing, target market size and rate of product penetration.• The timing of technology introduction is dependent upon the stage of
development of the technology– There exist key development events that are required for commercialization– Typical times are required at each stage in order to decrease technical risk
• There is a limit to the rate at which green-field plants are built and brought on-line– Especially for new process technologies, EPC contractors with the necessary
experience may be limited– New technology green-field plants may require longer start-up times to full capacity– Experience will be collected with the new plant before construction of the second and
third plants are likely to be undertaken
• The target market is based primarily on the actual and perceived performancecharacteristics of the product and its cost structure
• The rate of market penetration will be dictated by the cost structure of theproduct, its potential benefits, and industry and government factors

460CR/71038Final CAM Oct-01
Policy Options6
Scenario Analysis
4
5
Conclusions & Recommendations
Benefit & Impact Analysis
7
Table of Contents
Identification of Options
Background & Objectives
Executive Summary
3
1
0
Baseline Use of Biomass2
•• Biopower OptionsBiopower Options• Biofuel Options• Bioproduct Options

461CR/71038Final CAM Oct-01
Both the current reality and an extrapolated future are factored into theBusiness-as-Usual and Aggressive Growth scenarios for biomass power.• The focus of the quantitative scenarios was on the technologies that passed through the
screening process reviewed in Section 3 of this report– Technologies like grid-sited biomass-only IGCC, while part of the vision for biomass power, were
not part of the quantitative scenario because it did not pass the screening process based onconstraints imposed by looking out to 2010
• The BAU scenario assumes that the industry does grow gradually, but that the focus ison “low-hanging fruit”– Options requiring significant technology development or that face other hurdles are not deployed in
the BAU scenario
• The aggressive growth scenario is consistent with a robust 2020 vision for the biomassenergy industry that was developed by Arthur D. Little– Technology advances are rapid and significant– There is strong support from the public sector to level the playing field for biomass (via direct
support and via state restructuring plans that include provisions for renewable energy)– Market conditions favor fuel diversity and green power
• In both scenarios, the baseline of biopower is 10,000 MW capacity and has zero growthin the baseline out to 2020
Biopower Scenario Development Overview
Since these are scenarios, they do not include the full suite of biopowertechnologies, but use a variety of options to illustrate what is possible.

462CR/71038Final CAM Oct-01
Biopower Scenario Development Development of Technology Assumptions
Business-as-Usual
“Low HangingFruit”
Gasification ofProcess
Residues
Other
• Gradual deployment of availabletechnologies
• Fuel cells make gradual inroads inlandfill gas
• Co-firing focused on “best”feedstocks
• Introduction and deployment ofgasification for use with onsiteresidues is expected to be slow
– Limited to best applications– Fewer products available
• Pulp & paper industry very slow toadopt gasification for commercialuse
• Gasification for co-firing notexpected to be deployed at all dueto perceived risks and highercapital costs relative to direct firing
• RDF never accepted by public asviable option - no new capacitybuilt
Biomass co-firing and landfill gas figure prominently in the BAU scenario,while gasification options are only deployed if biopower is pursuedaggressively.
Technologies*
• Direct co-firing of biomass withcoal
• Landfill gas• Other biogas (from sewage
treatment, animal waste and othersources)
• Pulp & paper– Black Liquor IGCC plants– Hogged fuel, bark, sludge
IGCC plants• Other process residues
– Lumber, food processing, etc.
• Co-firing of gasified biomass incoal Rankine and natural gasGTCC power plants
• Refuse derived fuel IGCC plants
* For the purposes of the scenarios, not all technology/fuel combinations have been included. The scenarios are meant to be illustrative.
Aggressive Growth
• Rapid deployment of availabletechnologies
• Fuel cells penetrate more rapidly• Multiple feedstocks used in co-
firing
• Successful deployment ofgasification for use with onsiteresidues at a variety of scales
– Widely deployed whereresidues are available
– Many products available• Pulp & paper industry successfully
adopts gasification technology
• Gasification widely accepted asviable technology - leads to gradualdeployment starting in 2004
• RDF accepted by public as viableoption - new capacity graduallydeployed starting in 2009

463CR/71038Final CAM Oct-01
Biopower Scenario Development Market Penetration Assumptions
In the BAU scenario, biopower technologies are expected to “saturate” themarket in 20-40 years.
Business-as-Usual Scenario Assumptions
Direct firingwith coalRankine
Percent of addressablemarket that is capturable
Co-Firing
Gasificationwith coalRankine
Gasificationwith NGGTCC
Market growth rate(% per year)
Year of introduction
Time for marketsaturation (years)
RDF IGCC internalcombustion
EngineGas
Turbine Fuel Cell
Landfill Gas
30%
0%
2001
20
0%
N/A
N/A
N/A
0%
N/A
N/A
N/A
0%
N/A
N/A
N/A
2001
20
2001
20
2004
40
33%
1%
50%
1%
17%
1%
Pulp & Paper IGCC
BlackLiquor
HoggedFuel, Bark,
SludgePercent of addressable
market that is capturableMarket growth rate
(% per year)
Year of introduction
Time for marketsaturation (years)
Other Solid Residues -Gasification
internalcombustion
EngineGas
Turbine
Sewage TreatmentBiogas
GasTurbine Fuel Cell
Other Biogas (e.g.digester gas)
internalcombustion
EngineGas
Turbine
70%
0%
2010
40
100%
0%
2010
40
50%
2%
2001
20
50%
2%
2004
40
50%
2%
2001
40
50%
2%
2002
40
50%
2%
2004
40
50%
2%
2004
40

464CR/71038Final CAM Oct-01
In the BAU scenario, biomass power achieves approximately 40% growth incapacity (over baseline) by 2010 and could more than double by 2020.
Biopower Business-as-Usual Scenario Installed Capacity
�������������������������������������������������������������������������������������������������������������������������������������������������������������������������������������������
�������������������������������������������������������������������������������������������������������������������������������������������������������������������������������������������
�������������������������������������������������������������������������������������������������������������������������������������������������������������������������������������������
�������������������������������������������������������������������������������������������������������������������������������������������������������������������������������������������
�������������������������������������������������������������������������������������������������������������������������������������������������������������������������������������������
�������������������������������������������������������������������������������������������������������������������������������������������������������������������������������������������
0
5,000
10,000
15,000
20,000
25,000
30,000
2000
2002
2004
2006
2008
2010
2012
2014
2016
2018
2020
Tota
l Ins
talle
d Bi
omas
s Po
wer
Cap
acity
(MW
) Other Biogas
Sewage Treatment Biogas
Other Solid Residues - Gasification
P&P IGCC* (hogged fuel, bark, sludge)
P&P IGCC* (Black liquor)
Landfill Gas
RDF IGCC
Biomass co-firing w/natural gas -gasificationBiomass co-firing w/coal - gasification
�������� Biomass co-firing w/coal - direct fire
Baseline
Total Cumulative Installed Biomass Power Capacity (MW) - Business-as-Usual (BAU) Scenario
Growth is limited by both the rate of technology deployment and becauseseveral applications are not expected to be deployed at all.
Baseline is flat
Aggressive Goal = 30,000 MW
*P&P IGCC represents incremental capacity resulting from repowering with IGCC. Existing capacity included in baseline.

465CR/71038Final CAM Oct-01
Biopower Scenario Analysis Conclusions
Biomass power use could double by 2010 but requires that several factorscombine favorably in addition to strong government support.• Biomass co-firing with coal is critical for rapid, near-term growth and is responsible for over 50% of the growth
– Direct co-firing using non-woody fuels will likely be required, which will itself require further technology development anddemonstration
– May be potential for synergy with new clean-coal-based technologies (not included in analysis)
• Biomass integrated gasification combined cycle (BIGCC) technology in the pulp & paper industry is the second mostimportant contributor with almost 20% of the growth through 2010, and with greater potential post-2010, provided thetechnology is successfully adopted by the industry
• Landfill gas and other biogases also figure prominently in the aggressive growth scenario for early growth– Technologies are available today– USDOE should focus on removing economic or regulatory barriers
• Other gasification options are less important in the near-term but are important for sustained growth:– Other industries that generate residues are expected to contribute modestly throughout the 2000-2020 timeframe– RDF could become a significant source of biopower in the long term, provided technical and environmental issues are
addressed successfully– Gasification for co-firing could become significant beyond 2010, in both coal- and natural gas-fired power plants
• Implementation of the Aggressive Growth scenario would require several successful simultaneous developments:– Biomass supply infrastructure to develop rapidly if the market potential is to be realized– Successful development of gasification technology– Successful elimination of regulatory barriers to biopower implementation
• It would also require significant government support to overcome the cost difference of some longer-term options andexpected market prices

466CR/71038Final CAM Oct-01
The quantitative aspects of an Aggressive Growth scenario were based ona robust 2020 vision for the biomass industry.The vision:• Was developed by Arthur D. Little to guide the development of a scenario in
which it would be possible to triple the production of biomass power• Went out to 2020 so as not to constrain technology options only to those that
would be commercially viable before 2010• Considered technology, market and regulatory issues• The vision begins with a desired end-state in 2020 and then “writes the history”
required to achieve the desired end-state• The baseline is 10,000 MW capacity with zero growth out to 2020
Biopower Aggressive Growth Scenario Overview

467CR/71038Final CAM Oct-01
Biopower Aggressive Growth Scenario “Vision End State”
In the desired “end-state”, multiple biopower technologies arecommercially available with some markets fully exploited.
Biomass co-firing with coal fullyexploited at a variety of scales andfiring percentages
Common technologiesbetween landfill gas,digester gas and otherapplications are transferredacross market segments.Technology developmentsare applicable to biomassfuels and productsapplications
• Small-scale powergeneration
• Gas cleanup• Low-medium Btu
combustion systems• Project development
learning and businessmodels (e.g., for manysmall-scale sites)
• Partnerships
Gasification-basedtechnology isscaleindependent andlow cost
Co-Firing
Grid Power
Onsite Power& CHP
Conversiontechnology isscaleindependentand low cost
Biomass infrastructuredeveloped to deliverlarge quantities ofbiomass (energycrops, residues)
• Large companiesinvolved
• Market mechanismsin place similar toother fuels (e.g.,futures, B2B)
Landfill gas fullyexploited - 3,000MW added
RDF gasificationfully accepted asviable option -commerciallyviable
Common technologiesbetween utility-scaleIGCC are transferred toP&P industry for hoggedfuel and bark residues
10-15,000 MWco-firing inoperation
Residues usedfor highestvalueapplication
Biomass Co-firingwith coal
Gasification/IGCC
Power in P&P
Biogases
Regulations &Biomass markets
Small-scaleGasification
2020 End State
1. We selected 2020 as the year to focus the vision to avoid missing attractive technologies that only barely achieve market introduction by 2010.
5-6000 MW added in P&P through efficiency gains fromgasification (black liquor, hogged fuel, bark, sludge).(Capacity added via increased biomass utilization forpower only, which is part of the 2020 Vision of the pulp &paper industry, would be in addition to this amount).

468CR/71038Final CAM Oct-01
2003 20052002
Co-Firing
Grid Power
Onsite Power& CHP
NOx Tradingbegins
2004
Biomass-basedgreen power is
available/offeredfrom newbiomasscapacity
Chemicalrecovery hurdles
overcome
Black liquorgasificationdemo in fulloperation
Special co-firingincentive to
encourage earlyadoption -
targeted to first15-20
commercialplants
Specs for flyash accepted
- biomasscontent is OK
3000-5000 MWin operation
Demonstrationof gasification
co-firing inGTCC
Biomass fuelinfrastructureresponds to
growing demand -large companies
enter
Co-firing broadlyaccepted as
green power -certification is
given
U.S. demo ofutility-scale
biomass IGCC
Aggressivedevelopment of
landfill gasprojects begins
Standardization forlandfill gas projects
streamlinesdevelopment &reduces cost &
shortens lead time
Microturbinesdeployed
routinely forsmaller landfillgas projects
Lack of landfillspace renewsinterest in RDF
conversion
Demonstrationof gasification of
RDF to proveenvironmentalacceptability
Nextgenerationsmall-scalegasification
systemsdemonstrated
Concern overimpact of animal
waste from CAFOon environment
grows
Deployment ofdigester gasconversion
technologiesaccelerates
Microturbinesdeployed
routinely forbiogas projects
Multiple small-scalegasification systemscommercially available:
• multiple fuels• multiple technologies• scaleable
U.S. demo ofgasification co-firing in a coal
plant
Solid co-firingwith herbaceous
biomass is as“easy” as with
woody biomass
1st commercialgasification co-firing in a coal
plant
EPAstrengthens
commitment tomethanemitigation
Advanced gascleanup for
turbines is proven
Advanced gascleanup for
turbines is proven
Market optimization occursfor use of biomassresidues:
• buying & selling(“residues.com”)
• onsite utilization (power vs.bedding, vs. mulch, etc.)
1st U.S.commercialutility-scale
biomass IGCC
Continued electric and gas price volatility and regional supply/demand imbalances providesadditional impetus for distributed power, CHP, and fuel diversity.
Demo of IGCC usinghogged fuel, bark &
sludge
Biopower Aggressive Growth Scenario Timeline
Biomass Co-firing with coal
Gasification/IGCC
Power in P&P
Biogases
Regulations &Biomassmarkets
Small-scaleGasification
The aggressive growth scenario will require early technologydemonstration combined with significant market and regulatory support.

469CR/71038Final CAM Oct-01
2007 2010 2015 2020
Demonstrate that IGCCcan generally replace
Kraft boiler “on the fly” -minimal mill disruption
during retrofit
Fuel cells running onlandfill gas are
competitive relative toother biogastechnologies
Acceptance in mills toreplace recovery boiler
with gasification -deployment accelerates
$1000/kW orless for IGCCwith > 40%efficiency
10-15,000 MWco-firing inoperation
Someconventionalcoal plants
retiring - Co-firing may bedecreasing
Co-Firing
Grid Power
Onsite Power& CHP
Shift to co-firingwith gasification
in GTCC isaccelerating
6,000-9,000 MWin operation
Best coal plantsites exploited -
growth slows
Firstcommercial
gasification co-firing in GTCC
Firstcommercial
RDFgasification
IGCC
RDF IGCCdeploymentaccelerates(new andretrofit)
Landfill gas fullyexploited - 3,000
MW added
Digester biogasfully exploited -
3-5,000 MWadded
Gasification ofonsite residues
1-2,000 MWadded
Biomass IGCCdeployment atmultiple scales
accelerates
Fuel cells running ondigester gas are
competitive relative toother biogastechnologies
Commercialapplication of IGCCusing hogged fuel,
bark & sludge
Biopower Aggressive Growth Scenario Timeline
Biomass Co-firing with coal
Gasification/IGCC
Power in P&P
Biogases
Regulations &Biomassmarkets
Small-scaleGasification
To achieve the aggressive goal before 2020, continued improvement oftechnology competitiveness will be required.

470CR/71038Final CAM Oct-01
Biopower Scenario Development
In the Aggressive Growth scenario, more attractive performance and costand market pull allow several technologies to achieve saturation in 10 years.
Aggressive Growth Scenario Assumptions
70%
0%
2007
20
100%
0%
2005
20
50%
2%
2004
20
50%
2%
2004
20
50%
2%
2001
10
50%
2%
2002
20
50%
2%
2001
20
Percent of addressablemarket that is capturable
Market growth rate(% per year)
Year of introduction
Time for marketsaturation (years)
50%
2%
2002
20
Pulp & Paper IGCC
BlackLiquor
HoggedFuel, Bark,
Sludge
Other Solid Residues -Gasification
internalcombustion
EngineGas
Turbine
Sewage Treatment biogas
GasTurbine Fuel Cell
Other biogas (e.g.digester gas)
internalcombustion
EngineGas
Turbine
Direct firingwith coalRankine
Co-Firing
Gasificationwith coalRankine
Gasificationwith NGGTCC
RDF IGCC internalcombustion
EngineGas
Turbine Fuel Cell
Landfill Gas
30%
0%
2001
10
15%
0%
2004
20
10%
10%
2007
20
100%
2%
2009
20
33%
1%
2001
10
50%
1%
2001
10
17%
1%
2002
20
Percent of addressablemarket that is capturable
Market growth rate(% per year)
Year of introduction
Time for marketsaturation (years)
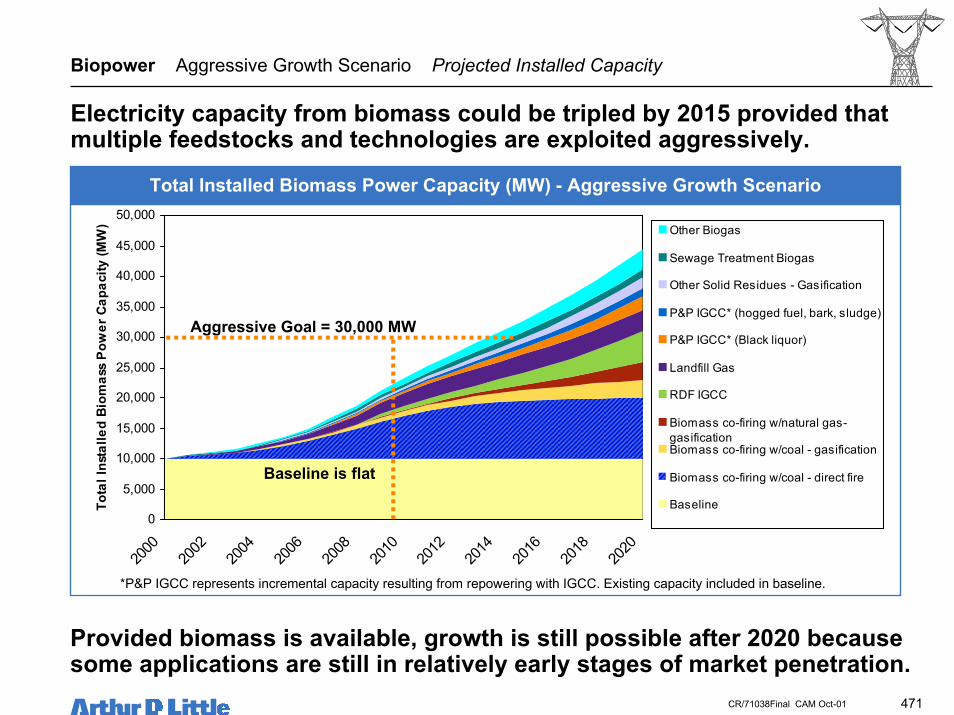
471CR/71038Final CAM Oct-01
Electricity capacity from biomass could be tripled by 2015 provided thatmultiple feedstocks and technologies are exploited aggressively.
Biopower Aggressive Growth Scenario Projected Installed Capacity
Provided biomass is available, growth is still possible after 2020 becausesome applications are still in relatively early stages of market penetration.
��������������������������������������������������������������������������������������������������������������������������������������������������������������������������������������������
��������������������������������������������������������������������������������������������������������������������������������������������������������������������������������������������
��������������������������������������������������������������������������������������������������������������������������������������������������������������������������������������������
��������������������������������������������������������������������������������������������������������������������������������������������������������������������������������������������
��������������������������������������������������������������������������������������������������������������������������������������������������������������������������������������������
0
5,000
10,000
15,000
20,000
25,000
30,000
35,000
40,000
45,000
50,000
2000
2002
2004
2006
2008
2010
2012
2014
2016
2018
2020
Tota
l Ins
talle
d Bi
omas
s Po
wer
Cap
acity
(MW
) Other Biogas
Sewage Treatment Biogas
Other Solid Residues - Gasification
P&P IGCC* (hogged fuel, bark, sludge)
P&P IGCC* (Black liquor)
Landfill Gas
RDF IGCC
Biomass co-firing w/natural gas-gasificationBiomass co-firing w/coal - gasification
���
Biomass co-firing w/coal - direct fire
Baseline
Aggressive Goal = 30,000 MW
Total Installed Biomass Power Capacity (MW) - Aggressive Growth Scenario
Baseline is flat
*P&P IGCC represents incremental capacity resulting from repowering with IGCC. Existing capacity included in baseline.

472CR/71038Final CAM Oct-01
Assumptionsand
Methodology
• The feedstock cost for cellulosic biomass was $30 per dry ton (farm-gate); gaseous biomass andprocess wastes were considered zero cost feedstock
• The incremental cost of products was estimated by a comparable electricity demand (GWh) with a valueGTCC levelized cost of power of $0.0324 per kWh
• Assumed all new capacity (green field plants) were built for the new electricity except for co-firingsituations; did not take into account building next to existing petroluem, pulp&paper, or grain processingfacilities that would likely reduce investment cost
• For co-firing with coal capacity, the emission credits were credited against capital recovery costs
Comments
• Feedstock costs followed by nonfuel operating costs are the dominant cost elements for biopower• Capital recovery is an issue especially as new capacity comes on line (with its higher associated costs)
Conclusions
• In the BAU scenario, the savings in cost of electricity compared to new capacity natural gas GTCC reach$80 MM in 2010 and $250MM in 2020
• In the aggressive scenario, the incremental cost of biomass electricity delivered reaches a savings of $80million in 2010 and an incremental cost of $1.3 billion in 2020
• Caveats are in the BAU scenario: 2500 MW are in co-firing with coal using existing capacity; ~1850MWare associated with zero cost gaseous biomass and utilization of zero cost process wastes all by 2010
• Caveats are in the Aggressive scenario: 210MW in co-firing with NG GTCC; 7800 MW in co-firing in coalplants; 1015MW for RDG gasification; and 4540MW in utilizing zero cost gaseous biomass and zero costprocess wastes; all by 2010
The yearly costs associated with aggressive biopower implementation aremostly related to the biomass feedstock followed by capital recovery costs.
Biopower Cost Implications

473CR/71038Final CAM Oct-01
If most process wastes are zero cost and co-firing with coal isimplemented, there may be net savings in the COE for biomassimplementation: ~$80MM in 2010 for BAU and aggressive scenarios.
Biopower Cost Implications
0
2,000
4,000
6,000
8,000
10,000
2000 2005 2010 2015 2020Absolute cost of Electricity
Cost
, $M
illio
n pe
r yea
r Biomass Fuel Cost Petroleum Fuel Cost Non-Fuel Operating Cost Capital Recovery
Cost per Year to 2020 (Taxes and credits excluded)Incremental Million dollars per year
0500
1,0001,5002,0002,5003,0003,500
2000 2005 2010 2015 2020Absolute Cost of Electricity
Cost
, $M
illio
n pe
r yea
r Biomass Fuel Cost Petroleum Fuel Cost Non-Fuel Operating Cost Capital Recovery
Aggressive ScenarioBusiness as Usual Scenario
-300
-250
-200
-150
-100
-50
0
2000 2005 2010 2015 2020Relative Cost of Electricity
Cost
, $M
illio
n pe
r yea
r
Incremental cost (Biomassminus GTCC electricity)
-2500
250500750
1,0001,2501,500
2000 2005 2010 2015 2020Relative cost of Electricity
Cost
, $M
illio
n pe
r yea
r Incremental cost (Biomassminus GTCC electricity)
Emission credits were credited against the capital recovery costs for biomass co-firing with coal.

474CR/71038Final CAM Oct-01
One time investments for aggressive biopower deployment would reach$11 billion by 2010 and $36 billion by 2020 for full implementation.
Biopower Aggressive Growth Scenario Installed Capacity
0
5,000
10,000
15,000
20,000
25,000
30,000
35,000
40,000
2000 2005 2010 2015 2020
Cum
ulat
ive
Inve
stm
ent,
$Mill
ion
WORK IN PROGRESS - this is one way we could present the scenario impactsInvestment to 2020
Absolute Cumulative Investment of Incremental Capacity Above Baseline, Million Dollars
Aggressive ScenarioBusiness as Usual Scenario
0
5,000
10,000
15,000
20,000
25,000
30,000
35,000
40,000
45,000
2000 2005 2010 2015 2020
Inve
stm
ent,
$Mill
ion
For BAU, the one time investment would reach $3 billion by 2010.

475CR/71038Final CAM Oct-01
Biopower has significant implications for carbon dioxide reduction.Methane emissions, primarily from coal replacement, may be reduced.
Biopower Aggressive Growth Scenario Installed Capacity
WORK IN PROGRESS - this is one way we could present the scenario impactsEmissions, Thousand Metric Tons per Year Avoided
2.6E+045.2E+04
8.0E+04
0.0E+00
1.3E+05
1.7E+05
1.0E+040.0E+002.3E+04
8.0E+04
0
50,000
100,000
150,000
200,000
2000 2005 2010 2015 2020Thou
sand
met
ric to
ns p
er y
ear
avoi
ded
CO2 Avoided BAUCO2 Avoided Aggressive
0.0E+008.0E+00
2.3E+01
4.8E+01
6.5E+01
1.1E+021.0E+02
0.0E+00
8.7E+01
2.6E+01
0
20
40
60
80
100
120
2000 2005 2010 2015 2020
Thou
sand
met
ric to
ns p
er y
ear
avoi
ded
Methane Avoided BAUMethane Avoided Aggressive

476CR/71038Final CAM Oct-01
Sulfur dioxide and nitrogen oxides are also reduced; mostly by use of low-sulfur biomass and use of co-firing biomass with coal for NOx reductions.
Biopower Aggressive Growth Scenario Installed Capacity
WORK IN PROGRESS - this is one way we could present the scenario impactsEmissions, Thousand Metric Tons per Year Avoided
5.2E+011.3E+02
2.6E+02
4.0E+02
0.0E+00
6.1E+02
7.8E+02
0.0E+00
3.9E+02
1.2E+02
0100200300400500600700800900
2000 2005 2010 2015 2020
Thou
sand
met
ric to
ns p
er
year
avo
ided
SO2 Avoided BAUSO2 Avoided Aggressive
0.0E+005.3E+01
1.3E+02
2.7E+02
4.0E+02
6.7E+02
8.1E+02
0.0E+00
4.4E+02
1.4E+02
0100200300400500600700800900
2000 2005 2010 2015 2020Thou
sand
met
ric to
ns p
er y
ear
avoi
ded
NOx Avoided BAUNOx Avoided Aggressive

477CR/71038Final CAM Oct-01
Biopower Aggressive Growth Scenario Conclusions
In the aggressive scenario, broader application of biomass technology anda more rapid market penetration lead to greater impact by 2015.Under the aggressive scenario:• All technologies are introduced commercially by 2010:
– Successful development and demonstration of gasification technology is required
• All technologies are applied to all relevant feedstocks available• Technologies can achieve rapid market penetration:
– Successful and early demonstration of high performance (e.g. efficiency) and low cost– Markets value biopower and create pull for green bio-kWhs:
- Biopower is generally recognized as green power, including biomass co-firing- Markets are willing to pay a modest green premium- Black liquor gasification is available in time for wave of recovery boiler rebuilds
• To achieve this, aggressive action must be taken:– Rapidly enable market penetration of “low-hanging fruits”: biomass co-firing and landfill gas through
regulatory reform, and targeted support for the establishment of biomass fuel markets– Aggressively promote development and demonstration of higher-risk technologies
• Recent experience with photovoltaics and wind power indicate that renewable energytechnologies can sustain market growth rates of 20-40% per year– In the case of wind power this has been driven by a combination of green power markets and
improvements in fundamental economics– In the case of PV, this has been driven by growth in viable niche markets (mainly off-grid) and very
strong government support

478CR/71038Final CAM Oct-01
Biopower Aggressive Growth Scenario Conclusions
Biomass power has the potential for rapid growth but requires that severalfactors combine favorably in addition to very strong government support.• The largest market is grid-based wholesale power. This requires that the biomass supply
infrastructure develop rapidly if the market potential is to be realized• Biomass co-firing with coal is critical for rapid, near-term growth
– Direct co-firing using non-woody fuels will likely be required, which will itself require further technology developmentand demonstration
• Landfill gas and other biogases also figure prominently in the aggressive growth scenario– Technologies are available today– DOE should focus on removing economic or regulatory barriers
• Other technologies are less important in the near-term but are important for sustained growth– The pulp & paper industry represents an important growth area after 2010 via repowering with IGCC– Other industries that generate residues are expected to contribute modestly throughout the 2000-2020 timeframe– RDF could become a significant source of biopower in the long term, provided technical and environmental issues
are addressed successfully
• Gasification for co-firing could become significant beyond 2010, in both coal- and natural gas-firedpower plants
• Not included in the scenario is the potential for coal plants to begin retiring. If this begins to happen inlarge enough numbers beyond 2010, biomass co-firing capacity might actually decrease, unless:– These coal plants are re-powered with IGCC technology or replaced with new coal plants, in which case the
biomass could be co-gasified or continued to be co-fired– The biomass could be used by new, stand-alone biomass power plants or by additional natural gas GTCC plants
interested in implementing co-firing

479CR/71038Final CAM Oct-01
Non-technical barriers to biomass co-firing can and should be dealt withimmediately, while simultaneously addressing remaining technical issues.
Biopower Aggressive Growth Scenario Near-Term Actions – Co-firing
2001-2002 By 2003 By 2005
Financial/Economic
Technical
Regulatory/Incentives
• National assessment of biomassco-firing feasibility (unit by unit)
– Business case analysis– Develop software package to
facilitate analysis– Proximity to biomass resources
• Encourage rapid adoption withproven technology/fuel types whilesimultaneously working on solvingremaining technical issues for otheroptions
• Develop incentives to encourageearly adopters
• Seek green certification forbiomass co-firing
• Resolve tax credit loophole for“closed loop biomass”
• Develop specifications for fly ashthat includes biomass content
• Support development of biomasssupply infrastructure
– Encourage large companies toenter
– Financial instruments (e.g.,futures)
– Markets (e.g., “residues.com”)
• Resolve technical issues with co-firing of herbaceous crops andresidues (e.g., switchgrass, cornstover)
• Demonstrate biomass gasificationco-firing in a coal plant
• Demonstrate biomass gasificationco-firing in a GTCC

480CR/71038Final CAM Oct-01
Biopower Aggressive Growth Scenario Near-Term Actions – Biogases
2001-2002 By 2003 By 2005
Financial/Economic
Technical
Regulatory/Incentives
• Improve the understanding of thedigester gas market potential to alevel similar to the landfill gasmarket
– Business case analysis– Resource assessment
• Develop appropriate, modestincentives to ensurecompetitiveness
• Develop packaged powergeneration solutions suited for avariety of landfill gas and digestergas applications (size, fuelcomposition)
– complement existing product– standardized products
• More EPA, DOE, USDAcoordination on methane mitigation
– technology transfer (e.g.,landfill gas to digester gas)
– private sector involvementacross applications
– partnerships between powerindustry, agricultural co-ops,etc.
– promulgate standards tofacilitate project development
• Encourage large energycompanies to enter business (couldbe viewed as part of overalldistributed power businessdevelopment)
• Resolve remaining technical issuesassociated with the combustion oflandfill gas and other biogases
– life– reliability– durability
• Promote digester gas and landfillgas conversion as solution tomultiple problems
– onsite power for reliability andcost savings
– waste minimization (e.g., forCAFOs)
– Environmental stewardship– Overall grid reliability by
encouraging distributedgeneration
• Develop commercial fuel cellproducts to competitively addressthis market
Most of the needs for landfill gas/biogas should be addressed quickly sothat deployment can be accelerated - no fundamental technology barriersexist.

481CR/71038Final CAM Oct-01
Biopower Aggressive Growth Scenario Near-Term Actions – RDF Gasification
2001-2002 By 2003 By 2005
Financial/Economic
Technical
Regulatory/Incentives
• Targeted technology development/screening to identify mostpromising options
– Technology transfer fromEurope
• Education on– Environmental issues of RDF
gasification versus incineration– Landfill space crunch
• Screen suitable sites for RDFIGCC demonstration
– Consider retrofit todemonstrate emissionsreduction over base technology
• Consider tipping fee structure orother mechanisms to promote RDFproduction and utilization
• Develop standards to ensurehighest environmental performance
• Implement RDF IGCCdemonstration
RDF gasification should be demonstrated in the 2005 timeframe. Thereshould be parallel efforts to remove barriers and educate the public.

482CR/71038Final CAM Oct-01
Biopower Aggressive Growth Scenario Near-Term Actions – Gasification of Onsite Residues
2001-2002 By 2003 By 2005
Financial/Economic
Technical
Regulatory/Incentives
• Develop analysis tool (e.g.software?) to facilitate analysis ofthe attractiveness of onsitebiomass-fueled CHP
– Overall plant economics & fitwith process
– Optimization of residueutilization within plant
• Continue development of small-scale gasification systems, focuson cost-reduction
• Develop plan for addressingremaining technical issues in pulp& paper
• chemical recovery• gas clean-up
• Continue strong support of currentblack liquor gasificationdemonstrations
• National inventory of Kraft boilerand hogged fuel and bark boilers
– Overall attractiveness of retrofit(mill bottlenecks, condition ofcurrent equipment)
– Assess suitability for retrofit togasification (age, condition,physical space)
– Mill energy balances• Detailed assessment of onsiteresidue generation and use tofacilitate optimization of utilization
• Commercial demonstration ofsmall-scale systems using variousfeedstocks and prime movers
– internal combustion engines– Microturbines
• Demonstrate gasification of hoggedfuel and bark in P&P industry
• Promote residue conversion assolution to multiple problems
– Onsite power for reliability andcost savings
– Waste minimization– Environmental stewardship– Overall grid reliability by
encouraging distributedgeneration
• Demonstrate black liquorgasification at full scale
• Develop standards & regulations toencourage high-efficiencyconversion of onsite residues
Small-scale gasification of onsite residues could be implemented relativelyquickly, whereas pulp & paper applications will take more time.

483CR/71038Final CAM Oct-01
Scenario Analysis
4
Policy Options
5
Conclusions & Recommendations
6
Benefit & Impact Analysis
7
Table of Contents
Identification of Options
Background & Objectives
Executive Summary
3
1
0
Baseline Use of Biomass2
• Biopower Options•• Biofuel OptionsBiofuel Options• Bioproduct Options

484CR/71038Final CAM Oct-01
Biofuels Scenario Development Overview
The increased use of biofuels may be impacted by the MTBE debate andcontinued requirements for oxygenated blend stocks for RFG.• The focus of the quantitative scenarios was on the technologies that passed through the
screening process reviewed in Section 3 of this report– Pure fuels focused on ethanol and FT-diesel– Blend stocks for a variety of purposes used primarily ethanol
• The BAU scenario assumes that the biomass fuel industry grows aggressively– MTBE is banned in California in 2002; the oxygenate requirement is maintained for RFG driving
corn ethanol capacity increases– Options requiring significant technology development or that face other hurdles are not deployed in
the BAU scenario– Technology developments (particularly gasification) are adopted with a time-lag after
demonstration with biopower grid and onsite applications (not likely before 2020 for fuels use)
• The aggressive scenario leverages developments facilitated by the biopower industry– Earlier demonstrations of gasification technology enable gasification based fuels for blending
markets– Development of a biomass feedstock market and distribution infrastructure– MTBE is banned in California in 2002 and in the U.S. in ~2007 and oxygenate requirements are
maintained for CAAA affected areas (effectively defining a requirement for ethanol)
• Since these are scenarios, they do not include the full suite of biofuel technologies, butuse a variety of options to illustrate what is possible
• We did not include an analysis of a possible import/export market for ethanol

485CR/71038Final CAM Oct-01
Recent government and industry actions herald a sharp reduction inMTBE use within the U.S.
Year
200
0Ye
ar 1
999
• California approved an MTBE phase-out by December 31, 2002• EPA’s blue ribbon panel in 1999 recommended a significant reduction in the consumption of MTBE in the
U.S.• Environmental groups see pros and cons
– Air quality wins vs. water quality concerns– Public health evidence questionable
• Industry is studying the issue, and beginning to take stands• MTBE bans may spread to other oxygenates, with potential implications for fuel specifications and qualities
(e.g. ETBE and TAME)• Refineries are considering best path forward, cautious of potential legal liability• Studies are underway regarding potential MTBE carcinogenicity and “developmental and reproductive toxicity”
• EPA issued, in March 2000, an Advanced Notice of Proposed Rulemaking that would regulate the use ofMTBE under the authority of the Toxic Substances Control Act. The notice does not provide details about howthe use of MTBE might be regulated
• As of October 2000, no regulatory nor legislative action has been taken to waive the Federal Oxygenrequirement in any state
• New York and Connecticut approved an MTBE phase-out by December 31, 2003• Five other States - Arizona, Maine, Minnesota and Nebraska passed legislation to ban, and South Dakota to
limit the use of MTBE within the next several years. The majority of recent legislation has not been linked toan oxygen waiver request. Other States have drafted, but not passed, legislation regarding MTBE use, testingand gasoline pump labeling
Biofuels Scenario Development Regulatory Issues

486CR/71038Final CAM Oct-01
Biofuels Scenario Development Development of Technology Assumptions
Business-as-Usual
Neat ethanol
Ethanol forBlending
• Neat ethanol primarily obtainedfrom corn; restricted to limited fleetuse
• Ethanol made from corn is used innear term for blending; mainoxygenate for California MTBEreplacement in near term
• Ethanol that is made withcellulosic feedstocks comes on-lineas development of technologyadvances
Ethanol for blending is prominent in the BAU and aggressive scenarios.
Fuels*
• Ethanol from variety of resourcesincluding corn and cellulosicbiomass
• Ethanol from variety of resourcesincluding corn and cellulosicbiomass)
• Blending for oxygenate, octane,low-sulfur, and gasoline volumeextender applications
* For the purposes of the scenarios, not all technology/fuel combinations have been included. The scenarios are meant to be illustrative.
Aggressive Growth
• Neat ethanol restricted to limited fleetuse; feedstocks include corn andcellulosics
• Fuel cells penetrate more rapidly
• Ethanol most likely oxygenate forreformulated and oxygenated gasoline
• Cellulosic technology developmentaccelerated for increased blend demandfor ethanol for California and later totalU.S. ban of MTBE
• Ethanol production from corn limited bydemand/market for feedstock and co-products

487CR/71038Final CAM Oct-01
In both scenarios, ethanol was used in both neat and blending applications.
Biofuels Scenario Analysis Fuels Included
Addressablemarket
ProductionTechnology
TargetApplications
Ethanol
Gasoline replacement& blend stock
Fermentation using traditional crops (e.g. corn,wheat) and cellulosics (e.g. energy crops andagricultural residues)
• Pure fuel• Volume extender• Octane booster• Additive for oxygenates

488CR/71038Final CAM Oct-01
The time required to develop and demonstrate technology and to buildplants places significant limitations on the rate of biofuels growth.
Business asUsual
• MTBE is banned in California (~2002) as an oxygenate for RFG and oxygenated gasoline• The projected lack of cost competitiveness of biofuels for neat applications will slow their
penetration into the market place• Most technologies will require the investment of new plant sections (or new plants) and
represent new technology in some cases• The baseline growth of biofuels will be mostly through corn ethanol for blend stocks until
cellulosic plants come on-line
AggressiveGrowth
• MTBE is phased out in the United States (~2007)as an oxygenate for RFG and oxygenatedgasoline and in California in 2002
• Technologies will be able to capture a greater volume of the growth market• The improved cost competitiveness of the biofuels combined with existing incentives
approach cost parity with other blending agents for oxygenate, octane, low-sulfur and low-aromatic blending applications
• Significant capital and resources are available for aggressive plant construction schedules• Other options for blending agents are disfavored by market pressures or regulation (e.g.
ETBE and TAME for oxygenate blending)
Biofuels Scenario Analysis Overview of Assumptions

489CR/71038Final CAM Oct-01
In the BAU scenario, growth is aggressive, primarily from satisfying theoxygenate requirement for California.
Biofuels Business as Usual Scenario Assumptions for Market Penetration
Year of introduction
Time for marketsaturation (years
Percent of addressablemarket that iscapturable*
Annual market growthrate (%)
2000 2006
60 40
0.25% 0
1.4 N/A
CornEthanol
Cellulosicethanol
1975 2006
40 40
75% 75%
1.4 1.4
CornEthanol
Cellulosicethanol
Pure Fuels Blending Agents
The baseline growth is for biofuels for existing uses as gasohol and octaneand volume extender and oxygenate in selected markets.
The EIA 2001 Energy projects an average growth rate in the demand of motor gasoline of 1.4%. The demand fordiesel fuel is projected at 2.3 percent. Overall petroleum demand is projected to grow at 1.8 percent. All growthrates are for the period of 2001-2020.

490CR/71038Final CAM Oct-01
Business As Usual Growth Scenario, Cumulative Installed Capacity to 2020
In the BAU scenario, most of the growth in biofuel consumption will stemfrom growth in corn ethanol for oxygenate blending for California in 2002.
Biofuels Business as Usual Scenario
0
500
1,000
1,500
2,000
2,500
3,000
2000 2002 2004 2006 2008 2010 2012 2014 2016 2018 2020
Mill
ion
Gal
lons
of E
than
ol
Blended Cellulosic Ethanol
Blended Corn Ethanol
Neat Corn Ethanol
Baseline
Aggressive Goal = 3860 million gallons(Ethanol equivalent)
Baseline of biofuels is growing at 1.4% per year, projected rate of motor gasoline demand
from 2001 to 2020, EIA 2001 Outlook
Two plants of cellulosic ethanol are operating by 2020.
The size of the near-term market forCalifornia (2003) depends uponunsettled requirements for oxygencontent in California gasoline,nevertheless, current estimates placeethanol demand in the range of 580million to 715 million gallons per yearethanol (or 37,834 barrels/day to46,641 barrels/day ethanol)
COSTS AND BENEFITS OF A BIOMASS-TO-ETHANOL PRODUCTION INDUSTRY IN CALIFORNIA, COMMISSION REPORT, California EnergyCommission, March 2001.

491CR/71038Final CAM Oct-01
Biofuels Aggressive Growth Scenario Vision “End State”
Greater than 750 million gallonsof cellulosic ethanol
At least 10 plants in operationusing cellulosic feedstocks
Medium-scalegasification-based
technology integratedwith blending
terminals
Piggy back off biomassinfrastructure developedto deliver large quantitiesof biomass (energycrops, residues) for co-firing
• Large companiesinvolved
• JVs between fuelmarketers and agro-companies
• Market mechanisms inplace similar to otherfuels (e.g., futures, B2B)
2 Demo FT-Diesel plants
Ethanol
FT-Diesel
Cellulosic ethanol primarily usedin blending for octane
enhancement and oxygenatecontent
Medium-scale conversiontechnology integrated with
blending terminals
FT Dieseldemonstrated as lowsulfur blending agent
• Fuel specs require ultra-cleantransportation fuels
– Ultra-low sulfur– Low aromatics– Oxygenate requirement for
diesel and gasoline• Bio-blend-stocks receive
preference over petroleumderived ones
• Green fuel premium is availablefor neat fuels in niche urban andfleet markets
• Alternative fuel status and taxcredits are extended to other bio-derived fuels other than ethanol
The vision for the aggressive growth scenario incorporates successfuldevelopment of advanced technology combined with regulatory stimuli andincentives.
2020 End State
Gasificationtechnology
FermentationTechnology
Market Issues
1. We selected 2020 as the year to focus the vision to avoid missing attractive technologies that only barely achieve market introduction by 2010.

492CR/71038Final CAM Oct-01
Biofuels Aggressive Growth Scenarios Timeline
20042003 20052002
Ethanol
FT-Diesel
• Green fuels andblends marketingestablished in nichemarkets
• Ultra-clean fuelspecs promulgated
Successful pilot-scaledemonstration of cellulosic SSF
ethanol in several facilities
SSF reactor worldscalescale-up demonstrated
Simplified FT based on biomasssyngas test at pilot scale
Integrated gasification,reforming and liquid
synthesis demonstrated forFT-Diesel
Bio-FT diesel approved foralternative fuel tax credit similar to
current ethanol incentives
• Feedstock marketsbecoming established
• Partnerships between fuelsmarketers and agro-business established
MTBE phase out inCalifornia
ETBE & TAMEregarded similar to
MTBE
Integration of SSF ethanolwith blending terminals
demonstrated
Intermediate scale FTproduction
demonstrated
Natural gas-based FT productsaccepted as blending agents and
alternative fuels
Intensive CBPtechnology biotechprogram initiated
Near-term milestones on the aggressive growth scenario timeline involvemainly technology development and fuel specifications.
Gasificationtechnology
FermentationTechnology
Market Issues

493CR/71038Final CAM Oct-01
Biofuels Aggressive Growth Scenario Timeline
2007 2010 2015 2020
FirstcommercialSSF plant
commissioned
Ethanol
FT-DieselIntegrated gasification,
reforming and liquidsynthesis demonstratedfor FT-Diesel (continued)
FirstcommercialSSF plantstart-up
• Successfuloperation firstSSF plant
• Two more plantscommissioned
• Ultra-clean fuel specs tightened• Preference given to neat ethanol
and FT fuels for non-attainmentareas
• Five more SSF plantscommissioned
• First CBP conversionplanned
• Five more SSF plantscommissioned
• First CBP conversioncomplete
CBP pilotstart-up
CBPfeasibilityproven
CBP demonstrationplantCBP
biotechnologyfeasibility
established
First commercial bio-FTdiesel plant integratedwith blending terminal
Successful operation firstFT plant
Two more commissioned
• Federal and protected landsmade available for biofuelsproduction
In the long term, sustained technology development and supportingregulation and incentives are critical to continued biofuels growth.
U.S. phase out ofMTBE foroxygenate
Gasificationtechnology
FermentationTechnology
Market Issues

494CR/71038Final CAM Oct-01
In the aggressive scenario significant improvements in technology andacceleration of the process significantly accelerates implementation.
2000 2006
60 60
.25% 0
1.0 N/A
Corn Ethanol Cellulosicethanol
1975 2004
40 20
75 75
1.4 1.4
Corn Ethanol Cellulosicethanol
Biofuels Aggressive Growth Scenario Assumptions for Market Penetration
Year of introduction
Time for marketsaturation (years
Percent of addressablemarket that is
capturable
Annual market growthrate (%)
Pure Fuels Blending Agents
• Corn ethanol as a pure fuel is projected to able to address25% of the market volume corresponding to demand growth
• Cellulosic ethanol will likely be used for blending applicationsrather than as a neat fuel due to projected cost of production
• For blending agents, the cost of corn ethanol is projected tolimit its use of as a blending agent to half of the demand foroxygenated blending agents
• Cellulosic ethanol is projected to be able to address all of thedemand for oxygenate and octane blending agents
Comments
The California MTBE ban in 2002 and an assumed U.S. MTBE ban in ~2007are the major drivers for ethanol market growth (oxygenate maintained).

495CR/71038Final CAM Oct-01
Aggressive Growth Scenario, Cumulative Installed Capacity to 2020
The aggressive scenario does not meet the 2010 aggressive goal but cansurpass it by 2015, requiring significant new plant capacity investments.
Biofuels Aggressive Growth Scenario
0
1,000
2,000
3,000
4,000
5,000
6,000
2000 2002 2004 2006 2008 2010 2012 2014 2016 2018 2020
Mill
ion
Gal
lons
of E
than
ol E
quiv
alen
t per
yea
r Blended Cellulosic Ethanol
Blended Corn Ethanol
Neat Cellulosic Ethanol
Neat Corn Ethanol
Baseline
Baseline of biofuels is growing at 1.8% per year, projected rate of total transportation fuels demand from
2001 to 2020, EIA 2001 Outlook
Aggressive Goal = 3860 million gallons(Ethanol equivalent)
Growth may be limited due to the time and infrastructure (and investment)required to build the new plants and possibly feedstock availability.
SUPPLY AND COST OF ALTERNATIVES TO MTBE IN GASOLINE, TECHNICAL APPENDIXES, Technical Documents, California Energy Commission, 1998,prepared by Purvin & Gertz, Inc.
The size of the near-term market forCalifornia (2003) depends uponunsettled requirements for oxygencontent in California gasoline,nevertheless, current estimates placeethanol demand in the range of 580million to 715 million gallons per year (or37,834 barrels/day to 46,641barrels/day).Additional requirements for RFG oroxygenated gasoline in rest of U.S. ~114,000 BD (1750 MM gal ethanol/y)

496CR/71038Final CAM Oct-01
Assumptionsand
Methodology
• The BAU scenario assumed a MTBE ban in California in 2002 which drives the demand for ethanol.Oxygenate requirements remain. Gasification fuels (FT-diesel) do not make a contribution
• The aggressive scenario took the California MTBE ban and projected a U.S. ban for MTBE in ~2007. Anoxygenate requirement was assumed in place
• The feedstock cost for cellulosic biomass was $30 per dry ton (farm-gate); corn was $121 per dry ton($2.92/bu farm-gate)
• Blended ethanol price was $1.095/gal (not including tax credit); Premium gasoline $0.96/gal (neat ethanolvalued at gasoline value times 0.696 to account for energy density differences)
Comments
• In the BAU scenario, the costs are associated with predominately corn ethanol for blending. It is assumedthat cellulosic ethanol comes on line starting in 2006
• In the aggressive scenario, corn ethanol provides the bulk of the demand of ethanol as oxygenate untilcellulosic ethanol comes on line in 2004 and capacity is built up. Eventually the ethanol demand isprovided by comparable amounts derived from corn and cellulosics
• The prices and volumes of comparable fuels were used to estimate the incremental cost associated withimplementing biomass fuels, not including any tax credit
Conclusions
• The predominate cost element with biomass fuels is the actual feedstock cost, followed by capitalrecovery and nonfuel operating cost
• In the BAU scenario, the incremental cost of biomass fuels reaches ~$130 MM in 2010 and $205MM in2020
• In the aggressive scenario, the incremental cost of biomass fuels reaches ~$415 million in 2010 and $770million in 2020 (not including any tax credits in price of fuels)
The costs of biomass fuels are mostly associated with the feedstock,capital recovery and non-fuel operating cost.
Biofuels Cost Implications

497CR/71038Final CAM Oct-01
The incremental cost in the BAU scenario is ~$130 million in 2010; in theaggressive scenario it reaches $415 million.
Biofuels Cost Implications
0500
1,0001,5002,0002,5003,0003,5004,0004,500
2000 2005 2010 2015 2020Absolute cost of fuel
Cost
, $M
illio
n pe
r yea
r Biomass Fuel Cost Petroleum Fuel Cost Non-Fuel Operating Cost Capital Recovery
Cost per Year to 2020 (Taxes and credits excluded)Incremental Million dollars per year with $30/dry ton biomass (farm-gate)
0
500
1,000
1,500
2,000
2000 2005 2010 2015 2020Absolute cost of fuels
Cost
, $M
illio
n pe
r yea
r Biomass Fuel Cost Petroleum Fuel Cost Non-Fuel Operating Cost Capital Recovery
Aggressive ScenarioBusiness as Usual Scenario
0
50
100
150
200
250
2000 2005 2010 2015 2020Relative cost of fuels
Cost
, $M
illio
n pe
r yea
r Incremental cost (Biomassminus conventional fuels)
0
500
1,000
2000 2005 2010 2015 2020Relative cost of fuel
Cost
, $M
illio
n pe
r yea
r Incremental cost (Biomassminus conventional fuels)
Does not include ethanol tax credit for ethanol price was not included in incremental cost calculation.

498CR/71038Final CAM Oct-01
Significant investments are required from 2008 onward as new cellulosicethanol capacity is built and brought on-line.
Biofuels Investment Requirements
0
1,000
2,000
3,000
4,000
5,000
6,000
7,000
8,000
2000 2005 2010 2015 2020
Inve
stm
ent,
$Mill
ion
WORK IN PROGRESS - this is one way we could present the scenario impactsInvestment to 2020Absolute Cumulative Investment of Incremental Capacity Above Baseline, Million Dollars
Aggressive ScenarioBusiness as Usual Scenario
0
200
400
600
800
1,000
1,200
1,400
1,600
1,800
2000 2005 2010 2015 2020
Inve
stm
ent,
$Mill
ion

499CR/71038Final CAM Oct-01
Biofuels Environmental Impacts
WORK IN PROGRESS - this is one way we could present the scenario impactsEmissions Impact
135
4,009 4,769 5,503 6,454
188
15,68018,745
4,152
13,440
0
5,000
10,000
15,000
20,000
Thou
sand
met
ric to
ns p
er
year
avo
ided
CO2 Avoided BAUCO2 Avoided Aggressive
Biofuels offer significant potential carbon dioxide reduction benefits. Allother emissions are on par with the petroleum derived fuels.
• The emissions shown are for the incremental (above base line) use of biofuels (mostly ethanol) for blending (mainly oxygenate additive) and pure fuels• The benefits of additive gasoline has not been taken into account; all priority pollutants generation was set to the emission standard in the vehicle use step
0.00
0.07 0.08 0.08 0.09
0.00
0.10
-0.01
0.07
0.16
-0.05
0.00
0.05
0.10
0.15
0.20
2000 2005 2010 2015 2020
Thou
sand
met
ric to
ns p
er
year
avo
ided
Methane Avoided BAUMethane Avoided Aggressive
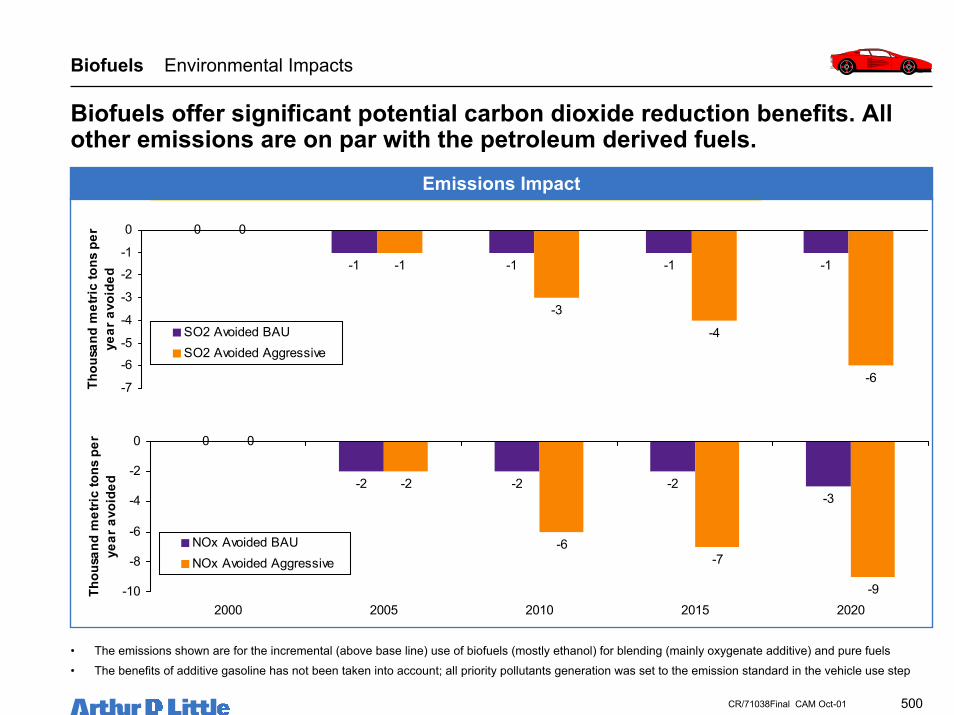
500CR/71038Final CAM Oct-01
Biofuels Environmental Impacts
WORK IN PROGRESS - this is one way we could present the scenario impactsEmissions Impact
Biofuels offer significant potential carbon dioxide reduction benefits. Allother emissions are on par with the petroleum derived fuels.
• The emissions shown are for the incremental (above base line) use of biofuels (mostly ethanol) for blending (mainly oxygenate additive) and pure fuels• The benefits of additive gasoline has not been taken into account; all priority pollutants generation was set to the emission standard in the vehicle use step
0
-1 -1 -1 -1
0
-4
-6
-1
-3
-7
-6-5
-4
-3
-2-1
0
Thou
sand
met
ric to
ns p
er
year
avo
ided
SO2 Avoided BAUSO2 Avoided Aggressive
0
-2 -2 -2-3
0
-7
-9
-2
-6
-10
-8
-6
-4
-2
0
2000 2005 2010 2015 2020
Thou
sand
met
ric to
ns p
er
year
avo
ided
NOx Avoided BAUNOx Avoided Aggressive

501CR/71038Final CAM Oct-01
Biofuels Scenario Analysis Conclusions
Tremendous impact could be achieved with the aggressive biofuelsscenario, albeit at a high cost.• In a Business As Usual scenario, increases in production and use of biofuels would be
approximately 800 million gallons ethanol by 2010:– Limited by current technology cost and government incentives– Gasification-based technology is not likely to become commercial– Ethanol looks like the preferred MTBE replacement but die is not cast– Implementation of ethanol as an MTBE replacement in California is thought to have net positive
impact on California economy (but not necessarily on the country)
• Achieving tripling of biofuels use by 2010 would require:– Strong regulatory support for bio-derived oxygenates for RFG nationwide– Highly successful technology development and cost reduction– Highly packaged plants for integration with conventional blending and distribution terminals– Continued and stable incentives for biofuel productions
• However, the cost associated with achieving this impact rapidly would be very high:– Cost of current bio-ethanol requires a $0.54 per gallon tax credit– Additional demand (especially if MTBE were phase out in the nation and an oxygenate requirement
remained) would put pressure on ethanol markets and could possibly increase the price– Achieving a tripling goal would require construction of cellulosic ethanol facilities based on first
generation technology
SUPPLY AND COST OF ALTERNATIVES TO MTBE IN GASOLINE, TECHNinternal combustionAL APPENDinternal combustionES, Technical Documents,California Energy Commission, 1998, prepared by Purvin & Gertz, Inc.

502CR/71038Final CAM Oct-01
Scenario Analysis
4
Policy Options
5
Conclusions & Recommendations
6
Benefit & Impact Analysis
7
Table of Contents
Identification of Options
Background & Objectives
Executive Summary
3
1
0
Baseline Use of Biomass2
• Biopower Options• Biofuel Options•• Bioproduct OptionsBioproduct Options

503CR/71038Final CAM Oct-01
The increased use of bioproducts will likely be through two avenuesinitially: carbohydrate based products and lipid based products.• Aside from wood and paper products (outside scope), most current bioproducts are
based on either starch or lipids (seed oils)• The technology to fully utilize all constituents of cellulosic biomass for products is on par
(in development maturity) with fuels technology (other than for power generationapplications)
• The options screening analysis indicated that products from fermentation and low-temperature processing had great potential to be cost competitive now and in the nearfuture
• Niche or medium markets may exist to utilize products formed from pyrolysis technology• Gasification or syngas based products are likely not to be competitive as stand alone
units; it is more likely that these products may be made as part of a biorefinery• Feedstocks for starch and lipid based products are available now and used now for other
applications• A 1998 baseline of 8.7 million tons of bioproducts was taken with a growth rate of 1.8%
(constant out to 2020) was taken for both the BAU and aggressive scenarios
Bioproducts Scenario Development Overview

504CR/71038Final CAM Oct-01
Bioproducts Scenario Development Development of Technology Assumptions
Business-as-Usual
Monomersfor
commoditypolymers
Lipid basedproducts
Specialtychemicals
• Most monomers will be produced byfermentation technology which promiseshigh volume manufacture
• Monomers will capture volume of marketcorresponding to growth. Existing capacitywill remain utilized
• Lipid based products are limited in volumeby demand of co-products (e.g. Food stuffs,glycerol)
• Products will capture volume of marketcorresponding to growth. Existing capacitywill remain utilized
• Most products will be produced byfermentation technology
• Lipids and pyrolysis based products findniche markets
• Monomers will capture volume of marketcorresponding to growth. Existing capacitywill remain utilized
Fermentation technology is likely to be key to produce “designer”functionalized monomers for high volume polymer applications.
Products*• 1,3-propane diol• Lactic acid• Ethylene• Phenolics• Acetic acid
• Oil seed polymers• Oil seed lubricants• Paints/Inks• Oleo-chemicals
• Water solublepolymers
• Solvents• Adhesives/sealants• Oxo chemicals• Antifreeze chemicals
* For the purposes of the scenarios, not all technology/fuel combinations have been included. The scenarios are meant to be illustrative.
Aggressive Growth• Most monomers will be produced by
fermentation technology which promiseshigh volume manufacture
• Cellulosic ethanol may enable bio-ethylenemanufacture
• Monomers will capture volume of marketcorresponding to growth. Some marketshare capture will occur
• Lipid based products are limited in volumeby demand of co-products (e.g. Food stuffs,glycerol)
• Products will capture volume of marketcorresponding to growth. Some marketshare capture will occur
• New applications are found for new markets
• Gasification widely accepted as viabletechnology - leads to gradual deploymentstarting in 2004
• External environmental factors open newmarket s for bioproducts (e.g. Greensolvents
• Products will capture volume of marketcorresponding to growth. Some marketshare capture will occur
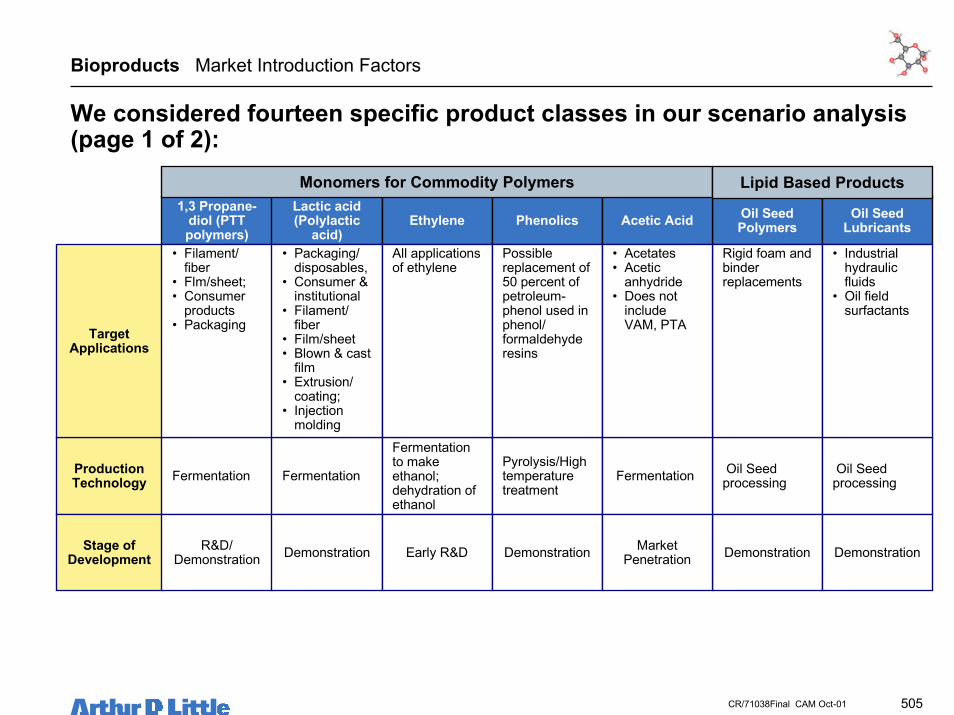
505CR/71038Final CAM Oct-01
Bioproducts Market Introduction Factors
We considered fourteen specific product classes in our scenario analysis(page 1 of 2):
1,3 Propane-diol (PTTpolymers)
ProductionTechnology Fermentation
Lactic acid(Polylactic
acid)
Fermentation
Ethylene
Fermentationto makeethanol;dehydration ofethanol
Phenolics
Pyrolysis/Hightemperaturetreatment
Oil SeedPolymers
Oil Seedprocessing
TargetApplications
• Filament/fiber
• Flm/sheet;• Consumer
products• Packaging
• Packaging/disposables,
• Consumer &institutional
• Filament/fiber
• Film/sheet• Blown & cast
film• Extrusion/
coating;• Injection
molding
All applicationsof ethylene
Possiblereplacement of50 percent ofpetroleum-phenol used inphenol/formaldehyderesins
Rigid foam andbinderreplacements
Stage ofDevelopment
R&D/Demonstration Demonstration Early R&D Demonstration Demonstration
Acetic Acid
Fermentation
• Acetates• Acetic
anhydride• Does not
includeVAM, PTA
MarketPenetration
Monomers for Commodity Polymers
Oil SeedLubricants
Oil Seedprocessing
• Industrialhydraulicfluids
• Oil fieldsurfactants
Demonstration
Lipid Based Products

506CR/71038Final CAM Oct-01
We considered fourteen specific products in our scenario analysis (page 2of 2):
Adhesives/Sealants
VariousTechnologies
Paints/Inks
Oil Seedprocessing
Oleo-chemicals
Oil Seedprocessing
OxoChemicals
Fermentationanddownstreamprocessing
Antifreeze
Fermentationanddownstreamprocessing
1. Adhesive replacements include polyolefins, polyurethanes, urea/formaldehyde, acrylics, thermoplastic elastomers, PVC, polyesters, Butyl/isobutylrubber,furan, nitrile rubber, ethylene-acrylic acid, polyamides, resorcinol-formaldehyde, elastomerics
2. Solvent replacements for perchloroethylene, methylene chloride, acetone, isopropanol, MEK, acetates, trichloroethylene, n-butanol
ProductionTechnology
TargetApplications
• Broad rangeof ingredientsubstitutionandapplicationsubstitution1
• Alkyd resins• Resins for
lithography,gravure andflexography
• Oils forlithography
• Soaps• Detergents• Surfactants• Plasticizers
• Plasticizerreplacement
• Antifreeze• Aircraft
deicers
Stage ofDevelopment
Market Entry/Market
PenetrationMarket Entry Market
Penetration R&D R&D
Bioproducts Market Introduction Factors
Water SolublePolymers
Lowtemperatureprocess forstarchrecovery
Replacementsforhydrocolloids,polyvinylalcohol, andpolyacrylamide
MarketPenetration
Solvents
Fermentation,oil seedprocessing
SolventReplacement2
Demonstration
Lipid Based Products Specialty Chemicals

507CR/71038Final CAM Oct-01
Bioproducts Scenario Overview
The premise of the bioproducts analysis is that existing capacity will beutilized looking forward to 2020; bioproducts may capture growth volume.
Business asUsual
• Most target markets are mature markets growing at less than three percent• Technologies will be targeted towards capturing the volume of market corresponding to
market growth• Most technologies will require the investment of new plant sections (or new plants) and
represent new technology and in some instances new applications of the products• The industries involved are for the most part fairly conservative in their attitude towards new
products and new process technology• The new bioproducts promise improve performance characteristics. The awareness of the
improved properties may be low
AggressiveGrowth
• Most target markets are growing at less than 10 percent• Technologies will be able to capture the volume of the growth market plus gain market
share captured from competing products• The bioproduct technologies will be evolved so that some applications will only require the
investment of new unit operations rather than whole plant sections (or green field plants)• The environment for technology trial has been improved so that industries are cautious in
their approach to technology adoption• The performance properties of the new bioproducts are overtly known by both industrial and
end consumers.

508CR/71038Final CAM Oct-01
Bioproducts Business as Usual Scenario Overview
The assumptions for the business as usual (BAU) scenario are that thebioproducts would capture the growth volume of the market.• The baseline of bioproduct use is assumed to grow at the projected rate of
growth of consumption of petroleum from the EIA Energy Outlook 2001• The projected market growth rates are taken from the chemical industry
literature and are specific for each market– A constant growth rate is estimated for each market from 2000 to 2020
• The percent of the addressable market that is capturable is assumed to equalthe volume represented by the market growth– It is assumed that existing capacity will be utilized and not mothballed or retrofitted
• The year of product introduction is dictated by the stage of development of thetechnology to produce the product and the stage of application/marketdevelopment
• Most technologies involve the investment of new plant sections or even newplants
• The products have perceived enhanced performance attributes

509CR/71038Final CAM Oct-01
Though most products are expected to reach the market, slow penetrationinto a limited segment of the market limits impact.
1,3 Propane-diol (PTTpolymers)
Lactic acid(Polylactic
acid)Ethylene Phenolics
Water SolublePolymers
Oil SeedPolymers
Solvents
Year ofintroduction 2006 2003 2021 2003
2003
2004
2003
MarketSaturation
Yrs40 40 40 20
20
40
20
Percent ofaddressablemarket that
is capturable6.6 3.6 2.5 3.5
2.8
3.0
2.0
Marketgrowth rate 6.6 3.6 2.5 3.5
2.8
3.0
2.0
Oil SeedLubricants
Adhesives/Sealants
Acetic Acid
Paints/Inks Oleo-chemicals
OxoChemicals Antifreeze
Year ofintroduction
2004
2004
2004
2003 2000 2008 2008
MarketSaturation
Yrs
40
20
20
20 10 40 40
Percent ofaddressablemarket that
is capturable
3.0
4.4
3.0
2.0 3.0 3.0 2.5
Marketgrowth rate
3.0
4.4
3.0
2.0 3.0 3.0 2.5
Bioproducts Business as Usual Scenario Market Penetration Assumptions
Monomers for Commodity Polymers Lipid Based Products
Lipid Based Products Specialty Chemicals

510CR/71038Final CAM Oct-01
Business As Usual Growth ScenarioMillion Pounds of Bioproducts to 2020
The BAU scenario represents an increase of only 3% over the baseline in2010 and 11% by 2020 due to slow implementation.
��������������������������������������������������������������������������������������������������������������������������������������������������������������������������������������������
��������������������������������������������������������������������������������������������������������������������������������������������������������������������������������������������
��������������������������������������������������������������������������������������������������������������������������������������������������������������������������������������������
��������������������������������������������������������������������������������������������������������������������������������������������������������������������������������������������
��������������������������������������������������������������������������������������������������������������������������������������������������������������������������������������������
��������������������������������������������������������������������������������������������������������������������������������������������������������������������������������������������
��������������������������������������������������������������������������������������������������������������������������������������������������������������������������������������������
��������������������������������������������������������������������������������������������������������������������������������������������������������������������������������������������
��������������������������������������������������������������������������������������������������������������������������������������������������������������������������������������������
��������������������������������������������������������������������������������������������������������������������������������������������������������������������������������������������
��������������������������������������������������������������������������������������������������������������������������������������������������������������������������������������������
��������������������������������������������������������������������������������������������������������������������������������������������������������������������������������������������
��������������������������������������������������������������������������������������������������������������������������������������������������������������������������������������������
��������������������������������������������������������������������������������������������������������������������������������������������������������������������������������������������
17,000
22,000
27,000
32,000
37,000
42,000
47,000
52,000
2000 2002 2004 2006 2008 2010 2012 2014 2016 2018 2020
Mill
ion
Poun
ds o
f Pro
duct
per
Yea
r
�������� 1,2-propylene glycol/EG
Solvents����
���� Oxo alcohols
Oleochemicals
Paints/Inks
Acetic acid
Adhesives/Sealants
Oil Seed Lubricants/Surfactants
Oil Seed Urethanes
Water Soluble Polymers
Phenolics for Thermoset Polymers
Lactic acid
1,3-propanediol
Baseline
Aggressive Goal = 52 billion pounds per year
Baseline is growing at 1.8% peryear, projected rate of total
transportation fuels demandfrom
2001 to 2020, EIA 2001 Outlook
The BAU scenario reaches 40% of the aggressive goal by 2010 and 50percent by 2020.
Bioproducts Business as Usual Scenario Impact Analysis Results
Baseline

511CR/71038Final CAM Oct-01
Bioproducts Business as Usual Scenario Impact Analysis Results
Although some growth in bioproducts can be expected, it represents asmall increase due to the slow penetration rates and limited potentialmarket.• Despite relatively attractive fundamental economics, compared with fuels and
power, bioproducts do not have much impact in the BAU scenario:– Limited potential market– No current large-scale incentives for bioproduct use (such as tax credits for ethanol
fuel and green power and other renewable power credits)
• Most of the growth in the BAU scenario for bioproducts comes from traditionalbioproduct growth (e.g. starches) and from products produced by physicalextraction (e.g. seed oils)
• Technologies with greater potential impact do not reach the market until muchlater and will penetrate the market slowly

512CR/71038Final CAM Oct-01
Bioproducts Aggressive Growth Scenario Observations
The assumptions for the aggressive scenario are that the addressablemarket can be expanded and market penetration is accelerated.• The baseline of bioproduct use is assumed to grow at the projected rate of
growth of consumption of petroleum from the EIA Energy Outlook 2001• The projected market growth rates are unchanged from the BAU case• The percent of the addressable market that is capturable is assumed to equal
the volume represented by market growth plus an additional 10 percent– It is assumed that some existing capacity could be retrofitted
• Technology introductions are accelerated when feasible• The cost competitiveness of bioproducts has been improved so that they are at
or approach cost parity• The properties of the bioproducts, in general, are perceived to be superior to
competitive products in selected markets
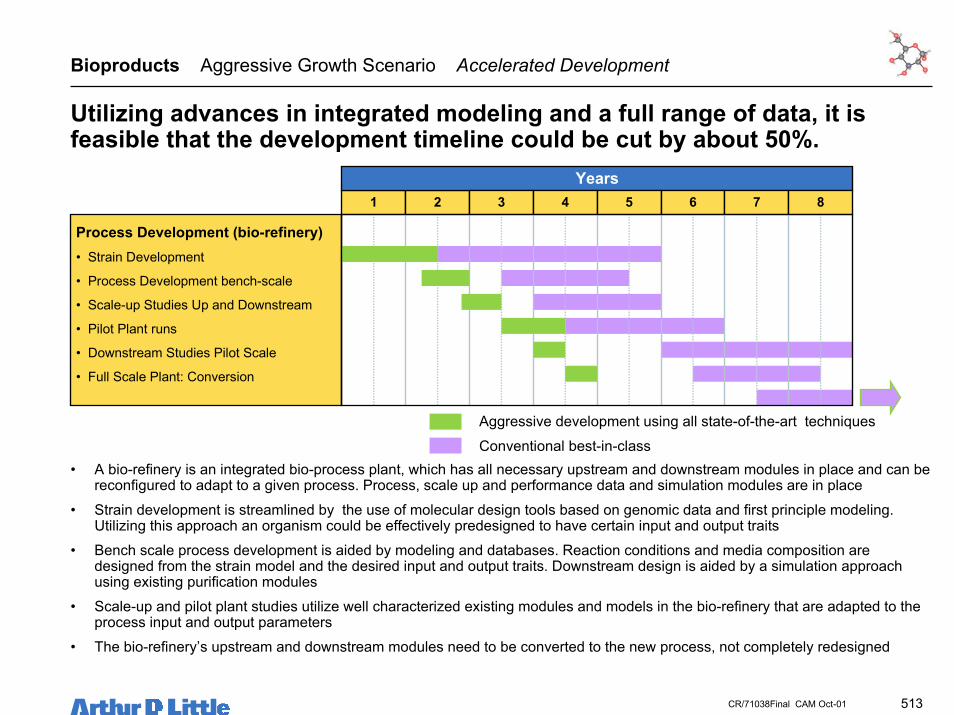
513CR/71038Final CAM Oct-01
Utilizing advances in integrated modeling and a full range of data, it isfeasible that the development timeline could be cut by about 50%.
• A bio-refinery is an integrated bio-process plant, which has all necessary upstream and downstream modules in place and can bereconfigured to adapt to a given process. Process, scale up and performance data and simulation modules are in place
• Strain development is streamlined by the use of molecular design tools based on genomic data and first principle modeling.Utilizing this approach an organism could be effectively predesigned to have certain input and output traits
• Bench scale process development is aided by modeling and databases. Reaction conditions and media composition aredesigned from the strain model and the desired input and output traits. Downstream design is aided by a simulation approachusing existing purification modules
• Scale-up and pilot plant studies utilize well characterized existing modules and models in the bio-refinery that are adapted to theprocess input and output parameters
• The bio-refinery’s upstream and downstream modules need to be converted to the new process, not completely redesigned
Bioproducts Aggressive Growth Scenario Accelerated Development
1 2Years
Aggressive development using all state-of-the-art techniquesConventional best-in-class
3 4 5 6 7 8
Process Development (bio-refinery)• Strain Development
• Process Development bench-scale
• Scale-up Studies Up and Downstream
• Pilot Plant runs
• Downstream Studies Pilot Scale
• Full Scale Plant: Conversion

514CR/71038Final CAM Oct-01
Bioproducts Aggressive Growth Scenario Vision of “End State”
Greater than 750 milliongallons of cellulosic ethanol
At least 10 plants in operationusing cellulosic feedstocks Piggy back off biomass
infrastructure developed todeliver large quantities ofbiomass (energy crops,residues) for coal co-firing
• large companies involved• market mechanisms in
place similar to other fuels(e.g., futures, B2B)
Conversion technology is scaleindependent and low cost
• Bioproducts are seen as “Green” withenhanced properties that can carry a pricepremium
• Bioproducts will compete with petroleumproducts that are biodegradable which isalso viewed as “Green”
• EPC industry has developed a newmarket, construction and operation of largescale bio-processing plants
Commodity Bioproducts
SpecialtyProducts
An incremental 20 billion pounds ofmaterial derived from biomass isbeing produced per year in 2020.Most of the new capacity willleverage fermentation technologies.Growth will continue to leverageexisting and new uses for agproducts such as seed oils. Hightemperature processes usingcellulosics make specialty productsfor small to medium volumeapplications.
The consumers drive the demand forproducts seen as green.
The processing technology forbioproducts has been significantlyimproved and seen as clean.Biomass plants are no longer viewedsimilar to a MSW incineration plant.
Products are:• Solvents• Polymers
–Propane diol polyester–Lactic acid
• Other organic acids such ascitric, succinic
• Paints & inks• Detergents• Specialty Chemicals• Adhesives/Sealants/Coatings• Polyurethane intermediates(polyol)
The aggressive scenario focuses heavily on successful development,demonstration, and implementation of fermentation-based technology.
BioproductTechnology
Developments
Biofuel TechnologyDevelopments
Leveraged
Biopower MarketDevelopment
Leveraged
2020 End State
Bioproducts leverage the aggressive advances made by biofuels andbiopower.
1. We selected 2020 as the year to focus the vision to avoid missing attractive technologies that only barely achieve market introduction by 2010.

515CR/71038Final CAM Oct-01
Bioproducts Aggressive Growth Scenarios Timeline
2003 20052002
Commodity Bioproducts
Specialty Products
2004
Biomass-basedgreen power is
available/offeredfrom new
biomass capacity
Biomass resourceinfrastructure
responds to growingdemand for
biopower- largecompanies enter
• Current likelyfermentation-basedcommoditybioproducts are madewith simple starch &glucose feedstocksobtained fromdedicated & wastestreams (e.g. corn milland food processingwaste streams)
• Future fermentation-based bio-commodities mayhave to use dedicatedhigh-volume cellulosicfeedstocks. Programsare put in place toleverage experiencegained with cellulosicethanol organismdesign
Advanced gascleanup for
turbines is proven
Market optimization occurs foruse of biomass residues:
• buying & selling(“residues.com”)
• onsite utilization (power vs.bedding, vs. mulch, etc.)
Demonstration semi-worksplant runs for SSF ethanoltechnology are conducted
R&D and pilot studies continue with varied feedstocks(e.g.crop wastes, energy crops, woody feedstocks, MSW) todevelop operating windows for optimal microorganism (MO)performance using existing metabolic pathways
Engineering MO to make glucose(or derivatives) as feedstockInter-agency coordination andcooperation on bioproductsdevelopment/ road map
Co-ordinate with NIH and NSF for long-termresearch for new metabolic pathways forpromising future “building block” chemicals
Lessons learned from biopower gasification enable use of syngas based products as part of a biorefinery concept (stand-alone plants notlikely to be competitive)
Specialty products derived from seed oils, fermentation processing, and high temperature processing will continue to be developed whenthe delivered performance and cost offers advantages over competitive petroleum derived products
External instruments will continue to influence the adoption of bioproducts. For example halogenated solvents may be gradually replacedby alternatives that offer price competitiveness and enhanced properties
Additional resources may be required for application development, market development, and necessary infrastructure investments
Study on what are the likeliest products that canbe derived from existing metabolic pathwaysCreate a wish list of possible “building blocks”that could be made with “to be designed”metabolic pathways
Develop policy instrumentsto encourage growth of newresource industry to supplyglucose; make glucose thebio-industry “ethylene”
Start programs that encourage long-termresearch on utilizing hemicellulose and lignin toproduce commodity high-value products. Longterm research to use cellulose as feedstock toprovide glucose source
Commodity lacticacid commercialplant on-line
1,3-propanediol (1,3-PD)from glucosesemi-works plant on-line
Studies on possible costsavings of co-locatingbioproduct plants near existingchemicals, refining, resource,& grain mill plants.Identification of possibleshared infrastructure.
Improved reactor designs forcontinuous commodity scalefermentation processes at bench topilot scale
Lactic acidplant-2 online atexisting site
Bio-Polymers are ahit for disposables.“Cheap and Green”has resoundedwith the market
In the short term, the aggressive scenario will require a mix ofaggressive technology development and facilitation of bio-engineeringfrom a regulatory perspective.
CommodityTechnology
Developments
Biofuel TechnologyDevelopments
Leveraged
Biopower MarketDevelopment
Leveraged
SpecialtyTechnology
Developments

516CR/71038Final CAM Oct-01
Bioproducts Aggressive Growth Scenario Timeline
2007 2010 2015 2020
11 Commercial scaleSSF ethanol plants
on-lineMarket for co-
products expanded
Firstcommercial
gasification co-firing in GTCC
New markets forglycerol are developing,possible co-feed forbioproduct syntheses
Commercial scale plant (~75million gal/yr) on-line for SSF
cellulosic technology
Market for ligninfor biopowerapplicationsestablished.
Uses biopowerresourcedelivery
infrastructure
Commodity Bioproducts
Specialty Products
First commercial plant for 1,3-PD usingglucose, ~200 MM lb/yr graduallyexpanding production through ‘12Improvements through experience arereducing cost towards competitiveness withEO derived 1,3-PD.
Aggressive construction schedule tokeep up with projected demands,cost competitive with EO derived1,3-PD. 4 new world scale plants(~300 MM lb/y) through 2020
Cellulosic ethanol enables bio-ethylene from ethanol.Aggressive capacity put in place, 1 billion pounds by 2020
First green-field worldscale commodity lactic acidplant online
Aggressive construction and engineering efforts to keep up withprojected demands. Projected demands require building and getting upa plant every year through 2020. Plants with multiple trains located nearcentral resource gathering places. Projected demand of 7 billionpounds by 2020.
Pilot scale demonstrationsof continuous processesusing cellulose to makeglucose to leverage existingmetabolic pathways
Pilot scale demonstrationsof continuous processesusing hemicelluose to makeglucose to leverage existingmetabolic pathways
Proteomics is leveraged tomap new metabolicpathways to producedesigner molecules withdistinct functionalities forboth pharma, specialty, andcommodity markets
Pilot scale studies with newdesigner metabolicpathways found with aid ofexisting work withproteomics
New product applications and markets are developed using existing biomass sources, mainly ag-products and food wastestreams. Cellulosics are being used more and more for new product applications. High-volume applications are identifiedfor possible high volume manufacture
In the long term, the aggressive scenario will require continued focuson technology development combined with considerable consumereducation and leveraging with fuels and power applications.
CommodityTechnology
Developments
Biofuel TechnologyDevelopments
Leveraged
Biopower MarketDevelopment
Leveraged
SpecialtyTechnology
Developments

517CR/71038Final CAM Oct-01
In the aggressive scenario more aggressive market penetration rates andbroader capturable markets were assumed.
Oil SeedLubricants
Adhesives/Sealants
Acetic Acid
Paints/Inks Oleo-chemicals
OxoChemicals Antifreeze
Year ofintroduction
MarketSaturation
Yrs
20
10
10
10 5 20 20
Percent ofaddressablemarket that
is capturable
13.0
14.4
13.0
12.0 13.0 13.0 12.5
MarketGrowth rate
2002
2002
2004
2002 2000 2006 2006
3.0
4.4
3.0
2.0 3.0 3.0 2.5
1,3 Propane-diol (PTTpolymers)
Lactic acid(Polylactic
acid)Ethylene Phenolics
Water SolublePolymers
Oil SeedPolymers
Solvents
Year ofintroduction 2006 2002 2015 2002
2002
2003
2002
MarketSaturation
Yrs20 20 20 10
10
20
10
Percent ofaddressablemarket that
is capturable16.6 13.6 12.5 13.5
12.8
13.0
12.0
MarketGrowth rate 6.6 3.6 2.5 3.5
2.8
3.0
2.0
Bioproducts Aggressive Growth Scenario Market Penetration Assumptions
Monomers for Commodity Polymers Lipid Based Products
Lipid Based Products Specialty Chemicals

518CR/71038Final CAM Oct-01
Bioproducts Aggressive Scenario Impact Analysis Results
Aggressive Growth Scenario, Cumulative Installed Capacity to 2020
The aggressive scenario reaches over 50% of the aggressive goal by 2010and almost reaches it by 2020.
��������������������������������������������������������������������������������������������������������������������������������������������������������������������������������������������
��������������������������������������������������������������������������������������������������������������������������������������������������������������������������������������������
��������������������������������������������������������������������������������������������������������������������������������������������������������������������������������������������
��������������������������������������������������������������������������������������������������������������������������������������������������������������������������������������������
��������������������������������������������������������������������������������������������������������������������������������������������������������������������������������������������
��������������������������������������������������������������������������������������������������������������������������������������������������������������������������������������������
��������������������������������������������������������������������������������������������������������������������������������������������������������������������������������������������
��������������������������������������������������������������������������������������������������������������������������������������������������������������������������������������������
��������������������������������������������������������������������������������������������������������������������������������������������������������������������������������������������
��������������������������������������������������������������������������������������������������������������������������������������������������������������������������������������������
��������������������������������������������������������������������������������������������������������������������������������������������������������������������������������������������
��������������������������������������������������������������������������������������������������������������������������������������������������������������������������������������������
��������������������������������������������������������������������������������������������������������������������������������������������������������������������������������������������
��������������������������������������������������������������������������������������������������������������������������������������������������������������������������������������������
��������������������������������������������������������������������������������������������������������������������������������������������������������������������������������������������
��������������������������������������������������������������������������������������������������������������������������������������������������������������������������������������������
��������������������������������������������������������������������������������������������������������������������������������������������������������������������������������������������
��������������������������������������������������������������������������������������������������������������������������������������������������������������������������������������������
��������������������������������������������������������������������������������������������������������������������������������������������������������������������������������������������
��������������������������������������������������������������������������������������������������������������������������������������������������������������������������������������������
��������������������������������������������������������������������������������������������������������������������������������������������������������������������������������������������
��������������������������������������������������������������������������������������������������������������������������������������������������������������������������������������������
��������������������������������������������������������������������������������������������������������������������������������������������������������������������������������������������
��������������������������������������������������������������������������������������������������������������������������������������������������������������������������������������������
��������������������������������������������������������������������������������������������������������������������������������������������������������������������������������������������
��������������������������������������������������������������������������������������������������������������������������������������������������������������������������������������������
��������������������������������������������������������������������������������������������������������������������������������������������������������������������������������������������
��������������������������������������������������������������������������������������������������������������������������������������������������������������������������������������������
��������������������������������������������������������������������������������������������������������������������������������������������������������������������������������������������
��������������������������������������������������������������������������������������������������������������������������������������������������������������������������������������������
��������������������������������������������������������������������������������������������������������������������������������������������������������������������������������������������
��������������������������������������������������������������������������������������������������������������������������������������������������������������������������������������������
��������������������������������������������������������������������������������������������������������������������������������������������������������������������������������������������
��������������������������������������������������������������������������������������������������������������������������������������������������������������������������������������������
��������������������������������������������������������������������������������������������������������������������������������������������������������������������������������������������
��������������������������������������������������������������������������������������������������������������������������������������������������������������������������������������������
��������������������������������������������������������������������������������������������������������������������������������������������������������������������������������������������
��������������������������������������������������������������������������������������������������������������������������������������������������������������������������������������������
17,000
22,000
27,000
32,000
37,000
42,000
47,000
52,000
2000 2002 2004 2006 2008 2010 2012 2014 2016 2018 2020
Mill
ion
Poun
ds o
f Pro
duct
per
Yea
r
������ 1,2-PG/EG
Solvents������ Oxo alcohols
Oleochemicals
Paints/Inks
Acetic acid
Adhesives/Sealants
Oil Seed Lubricants/Surfactants
Oil Seed Urethanes
Water Soluble Polymers
Phenolics for Thermoset Polymers
Lactic acid
Ethylene
1,3-propanediol
Baseline
Aggressive Goal = 52,200 million pounds
The scenario includes an aggressive plant construction schedule forfermentation-based processes, which will probably have to be combinedwith SSF ethanol production.
Baseline is growing at1.8% per year, projected
rate of total transportation fuels
demand from 2001 to 2020, EIA 2001
Outlook
Baseline

519CR/71038Final CAM Oct-01
Bioproducts Aggressive Scenario Reaching Goal by 2010
Reaching the aggressive goals by 2010 implies significant increases in therate of market penetration and expansion of addressable and capturablemarkets.
WORK IN PROGRESS - this is one way we could present the scenario impactsAggressive Growth Scenario, Cumulative Installed Capacity to 2020Reaching the Aggressive Goals by 2010
�����������������������������������������������������������������������������������������������������������������������������������������������������������������������������������������
�����������������������������������������������������������������������������������������������������������������������������������������������������������������������������������������
�����������������������������������������������������������������������������������������������������������������������������������������������������������������������������������������
�����������������������������������������������������������������������������������������������������������������������������������������������������������������������������������������
�����������������������������������������������������������������������������������������������������������������������������������������������������������������������������������������
�����������������������������������������������������������������������������������������������������������������������������������������������������������������������������������������
�����������������������������������������������������������������������������������������������������������������������������������������������������������������������������������������
�����������������������������������������������������������������������������������������������������������������������������������������������������������������������������������������
�����������������������������������������������������������������������������������������������������������������������������������������������������������������������������������������
�����������������������������������������������������������������������������������������������������������������������������������������������������������������������������������������
�����������������������������������������������������������������������������������������������������������������������������������������������������������������������������������������
�����������������������������������������������������������������������������������������������������������������������������������������������������������������������������������������
�����������������������������������������������������������������������������������������������������������������������������������������������������������������������������������������
�����������������������������������������������������������������������������������������������������������������������������������������������������������������������������������������
�����������������������������������������������������������������������������������������������������������������������������������������������������������������������������������������
�����������������������������������������������������������������������������������������������������������������������������������������������������������������������������������������
�����������������������������������������������������������������������������������������������������������������������������������������������������������������������������������������
�����������������������������������������������������������������������������������������������������������������������������������������������������������������������������������������
�����������������������������������������������������������������������������������������������������������������������������������������������������������������������������������������
�����������������������������������������������������������������������������������������������������������������������������������������������������������������������������������������
�����������������������������������������������������������������������������������������������������������������������������������������������������������������������������������������
�����������������������������������������������������������������������������������������������������������������������������������������������������������������������������������������
�����������������������������������������������������������������������������������������������������������������������������������������������������������������������������������������
�����������������������������������������������������������������������������������������������������������������������������������������������������������������������������������������
�����������������������������������������������������������������������������������������������������������������������������������������������������������������������������������������
�����������������������������������������������������������������������������������������������������������������������������������������������������������������������������������������
�����������������������������������������������������������������������������������������������������������������������������������������������������������������������������������������
�����������������������������������������������������������������������������������������������������������������������������������������������������������������������������������������
�����������������������������������������������������������������������������������������������������������������������������������������������������������������������������������������
�����������������������������������������������������������������������������������������������������������������������������������������������������������������������������������������
�����������������������������������������������������������������������������������������������������������������������������������������������������������������������������������������
�����������������������������������������������������������������������������������������������������������������������������������������������������������������������������������������
�����������������������������������������������������������������������������������������������������������������������������������������������������������������������������������������
�����������������������������������������������������������������������������������������������������������������������������������������������������������������������������������������
�����������������������������������������������������������������������������������������������������������������������������������������������������������������������������������������
�����������������������������������������������������������������������������������������������������������������������������������������������������������������������������������������17,000
27,000
37,000
47,000
57,000
67,000
77,000
87,000
97,000
107,000
2000 2002 2004 2006 2008 2010 2012 2014 2016 2018 2020
Mill
ion
Poun
ds o
f Pro
duct
per
Yea
r
�������� 1,2-PG/EG
Solvents�������� Oxo alcohols
Oleochemicals
Paints/Inks
Acetic acid
Adhesives/Sealants
Oil Seed Lubricants/Surfactants
Oil Seed Urethanes
Water Soluble Polymers
Phenolics for Thermoset Polymers
Lactic acid
Ethylene
1,3-propanediol
Baseline
Aggressive Goal = 52,200 million pounds
Baseline is growing at 1.8% per year
Reaching the aggressive goals by 2010 for bioproducts is unrealistic justfrom a viewpoint of capacity expansion rate.

520CR/71038Final CAM Oct-01
Bioproducts Scenarios Cost Implications
Since there is a wide variety of products in the scenario we estimated thecosts of implementation by using three representative costs.
Lactic acid manufacture Phenolics by Pyrolysis Oil seed processing for fatty alcohols
• Lactic acid• 1,3-Propanediol• Ethylene• Acetic acid• Solvents• Oxo chemicals• 1,2-propylene glycol and
antifreeze/deicing substitutes• Water soluble polymers
(starch & cellulose)
• Phenolics• Adhesives
• Oil seed polymers• Oil seed lubricants &
surfactants• Oleochemicals• Paints & Inks

521CR/71038Final CAM Oct-01
Assumptionsand
Methodology
• The BAU scenario assumed a negligible advances in bioproducts• The aggressive scenario took aggressive advances in bioproducts into a wide variety of markets• The feedstock cost for cellulosic biomass was $30 per dry ton (farm-gate); corn was $83 per dry ton
($2.00/bu) farm-gate; Seed oil was $340 per ton• The incremental cost of products was estimated by a comparable mass of petroleum products with a value
of $0.60 per pound• Assumed all new capacity (green field plants) were built for the new products; did not take into account
building next to existing petroluem, pulp&paper, or grain processing facilities that would likely reduceinvestment cost
Comments
• In the BAU scenario, the costs are associated with fermentation and seed oil products• In the aggressive scenario, fermentation is used to produce both biomonomers, solvent replacements, and
a wide variety of products• In the aggressive scenario, lipid based products play an increasing role in selected market segments with
relevant applications
Conclusions
• The predominate cost element with biomass products is the capital recovery• In the BAU scenario, the incremental cost of biomass products reaches ~$140 MM in 2010 and $730MM
in 2020• In the aggressive scenario, the incremental cost of biomass fuels reaches ~$1.8 billion in 2010 and $5.0
billion in 2020
The aggressive use of biomass for bioproducts will highly leverage the useof fermentation technology to build commodity bio-chemicals.
Bioproducts Cost Implications
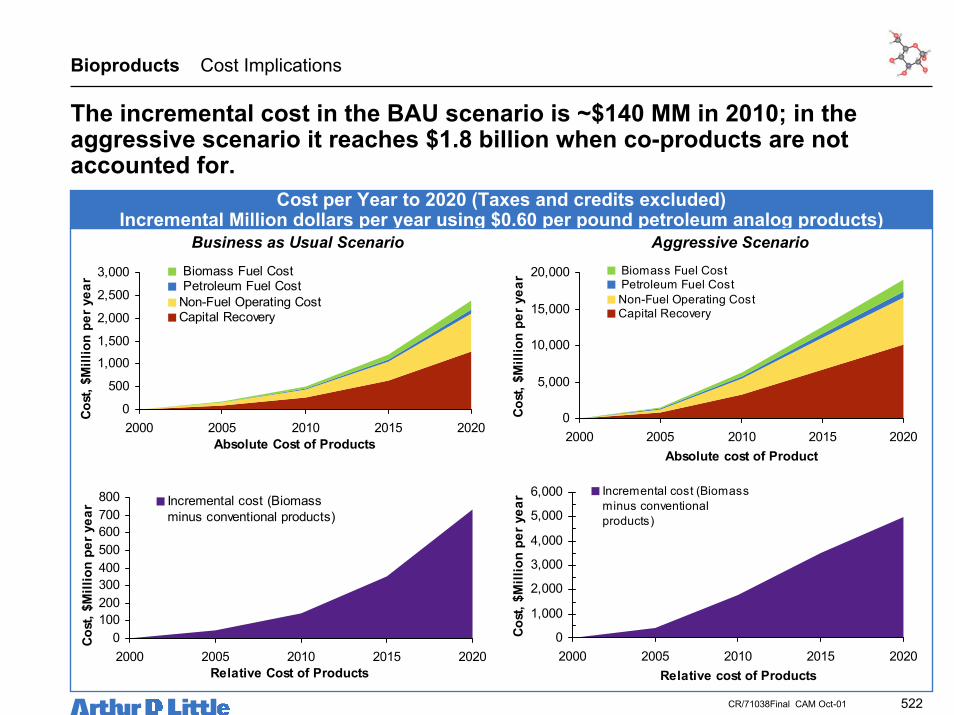
522CR/71038Final CAM Oct-01
The incremental cost in the BAU scenario is ~$140 MM in 2010; in theaggressive scenario it reaches $1.8 billion when co-products are notaccounted for.
Bioproducts Cost Implications
0
5,000
10,000
15,000
20,000
2000 2005 2010 2015 2020Absolute cost of Product
Cost
, $M
illio
n pe
r yea
r Biomass Fuel Cost Petroleum Fuel Cost Non-Fuel Operating Cost Capital Recovery
Cost per Year to 2020 (Taxes and credits excluded)Incremental Million dollars per year using $0.60 per pound petroleum analog products)
0
500
1,0001,500
2,000
2,500
3,000
2000 2005 2010 2015 2020Absolute Cost of Products
Cost
, $M
illio
n pe
r yea
r Biomass Fuel Cost Petroleum Fuel Cost Non-Fuel Operating Cost Capital Recovery
Aggressive ScenarioBusiness as Usual Scenario
0100200300400500600700800
2000 2005 2010 2015 2020Relative Cost of Products
Cost
, $M
illio
n pe
r yea
r Incremental cost (Biomassminus conventional products)
0
1,000
2,000
3,000
4,000
5,000
6,000
2000 2005 2010 2015 2020Relative cost of Products
Cost
, $M
illio
n pe
r yea
r Incremental cost (Biomassminus conventionalproducts)

523CR/71038Final CAM Oct-01
Bioproducts Scenarios Investment for Implementation
One time investments required for aggressive implementation ofbioproducts could reach 20 billion by 2010.
0
10,000
20,000
30,000
40,000
50,000
60,000
70,000
80,000
2000 2005 2010 2015 2020
Cum
ulat
ive
Inve
stm
ent,
$Mill
ion
Investment to 2020Million dollars
Aggressive ScenarioBusiness as Usual Scenario
0
10,000
20,000
30,000
40,000
50,000
60,000
70,000
80,000
2000 2005 2010 2015 2020
Inve
stm
ent,
$Mill
ion

524CR/71038Final CAM Oct-01
Bioproducts Scenarios Environmental Benefits
Bioproducts offer potential carbon dioxide reduction benefits. All otheremissions are on par with the petroleum derived chemicals and products.
• This emissions analysis compared the average carbon dioxide emissions against methanol chain emissions on a equivalent mass basis• This analysis assumed that bioproducts for plastics effectively sequester the carbon contained in the material (e.g. Land-filled and removed from cycle)• Downstream value chain steps such as derivative product manufacture, product formulation, and distribution, marketing, and end use were not included
WORK IN PROGRESS - this is one way we could present the scenario impactsEmissions Impact
1 41 120 266 5066
2,520
3,574
382
1,349
0
1,000
2,000
3,000
4,000
Thou
sand
met
ric
tons
per
yea
r av
oide
d
CO2 Avoided BAUCO2 Avoided Aggressive
00 -1
-2
-4
0
-4
-6
-1
-3
-8
-6
-4
-2
0
Thou
sand
met
ric
tons
per
yea
r av
oide
d
SO2 Avoided BAUSO2 Avoided Aggressive
0 0-1 -1 -2
0
-12
-19
-1-6
-25-20-15-10-50
2000 2005 2010 2015 2020
Thou
sand
met
ric
tons
per
yea
r av
oide
d
NOx Avoided BAUNOx Avoided Aggressive

525CR/71038Final CAM Oct-01
Bioproducts use could be tripled by 2020 requiring aggressive technologyand market development but not sustained government support.• In a Business as Usual scenario, bioproducts would capture a small fraction of the growth volume of
specific chemical markets– No current large-scale incentives for bioproduct use (such as tax credits for ethanol fuel, green power and other
renewable power credits)– Most of the growth comes from traditional bioproduct growth (e.g. starches) and from products produced by
physical extraction (e.g. seed oils), in which bioproducts already have a high market share– Limited potential market for low-hanging fruit– Technologies with greater potential impact do not reach the market until much later and will penetrate the market
slowly– Even in the BAU scenario, however, we expect bioproducts to have a considerable impact in the longer term, since
competitive economics will be achieved for broad-based application of bioproducts to polymers and solvents
• With aggressive technology and market development and some government support (but notnecessarily product price support), a significant impact (even tripling) may be achievable by 2020,though not by 2010– Technologies with high impact potential (such as fermentation-based polymers and monomers) would become
commercially available in the 2010 timeframe– With plant construction and market penetration inertia significant market penetration would not be achievable before
2020
• Given the limited volume of product markets (as compared with fuels and power markets) the relativeimpact of bioproducts on greenhouse gas emissions and rural economic development can beconsiderable, but not large in absolute terms– Because of the more limited scale, at least early facilities may well be integrated into existing chemicals plants or
into existing corn or paper mills– The projected economics of bioproducts will eventually not require sustained government financial support for
several of the options, resulting in potentially very modest cost for investment, but not for sustained subsidies
Bioproducts Scenario Analysis Conclusions

526CR/71038Final CAM Oct-01
Overall Analysis Section Overview
This section contains the following topics:
• Background• Bio-refinery options• Bio-refinery impacts and role• Conclusions

527CR/71038Final CAM Oct-01
Bio-Refinery Background Interest in “Bio-Refineries”
Many biomass proponents have argued for the implementation of biomassconversion in bio-refineries, chiefly based on economic arguments.• In analogy to the petroleum refinery a “bio-refinery” is predicted to benefit from economy
of scale and efficiency benefits– Co-production of high-value chemicals and pharmaceuticals would help the economics of lower
value, high-volume fuel and power products– Co-production would allow the economy of scale competitive with oil refineries
• This is clearly true in some cases, as “bio-refineries” are common in a number ofindustries:– World-scale corn mills, food processing facilities, and paper mills often sell a wide range of
products, optimizing the overall economics– The “high”-value products invariably include foods or paper products– In most biofuels and bioproducts production processes co-production of power is considered
• The next section identifies options for applying such concepts to the type of bio-energyand products that fall within the scope of this study:– What are the true opportunities created by such bio-refinery concepts?– How do they relate to traditional refineries (either petroleum or the biomass-type mentioned
above)?– What limitations restrict the implementation of “bio-refineries”– Which types of “bio-refineries” offer most promise– What barriers do they face in their implementation?

528CR/71038Final CAM Oct-01
Bio-Refinery Background Why Petroleum Refineries?
Achieving cost effective feedstock utilization and economy of scale are theprimary drivers for the configuration of today’s petroleum refineries.• To understand the merit of bio-refineries it is instructive to study the drivers behind the
establishment of oil refineries• Crude oils are complex mixtures of chemicals which can largely be readily separated into
various usable products via distillation, maximizing the product value per barrel input:– Simple distillation (so-called straight-run refining) can be used to very cheaply separate crude into
a host of commodity products (e.g. LPG, naphtha, gasoline, kerosene, gasoil/diesel, fuel oil,bunker oil, asphalt)
– To efficiently utilize the crude oil and maximize the profit from the products, modern refineriesmanage to sell around 90% of each barrel of feedstock as some sort of product
– Markets for these products have been developed over the last one hundred years (recall thatgasoline was flared for the first thirty-some years of the industry’s life)
• Because crude oil is easily and cheaply transportable, refineries can be built at hugescales, providing significant cost-savings:– The minimum scale for a modern refinery is considered to be around 250,000 barrels per day,with
the capacity of typical green field refineries overseas in excess of 400,000 barrels per day– Most smaller refineries in the U.S. have been shut down over the past decades
- Too small to achieve economy of scale for individual process units- Cannot achieve economy of scale of outside battery limits equipment, notably environmental control equipment
– For comparison, the largest ethanol plants represent an equivalent scale of a few thousand barrelsper day

529CR/71038Final CAM Oct-01
Bio-Refinery Background Implications for the “Bio-Refinery”
In principle, similar considerations apply to bio-refineries.
• Biomass feedstocks are made up of several fractions, with distinct properties:– Main constituents (e.g. sugar, starch, oils, cellulose, hemicellulose, and lignin)– Valuable trace constituents which may either naturally occur or can be bred or bioengineered into
crops
• Many of the biomass conversion processes preferentially utilize and reject the samefractions of the biomass:– Sugars, starches, oils, cellulose are generally desirable constituents– Lignin is generally considered a waste product, at best, suitable for power generation
• To realize the benefits of feedstock utilization, independent uses of each of the fractionsmust be found
• Similar to most chemical processes, many of the biomass conversion processes wouldbenefit considerably from larger scale implementation
• However, the capacity of biomass conversion facilities is often constrained by theavailability of cost-effective feedstock
• Given this constraint, a single-product plant will often provide the greatest economy ofscale
• The economy of scale benefits can only be realized for small-volume products or if thebiobased facility is integrated with a fossil-based one

530CR/71038Final CAM Oct-01
We identified five types of “bio-refineries” that could provide some of theefficiency and economy-of-scale benefits petroleum refineries offer.
Bio-Refinery Options Overview
Increase in Fraction of Feedstock Converted to Products2
Impr
ovem
ent i
n O
vera
llEc
onom
y of
Sca
le1
Marginal IncreaseType-4 Bioproduction independent
from fossil productionType-5 Bioproduction synergistic
with fossil production
Significant Increase
Mar
gina
lIm
prov
emen
tSi
gnifi
cant
Impr
ovem
ent Petroleum Refinery
Paper MillCorn Mill
Type-3 Parallel processing ofbiomass into differentproducts3
Type-1 Production of co-productsinherent in the feedstock
Type-2 Co-products produced fromlow-value process residues
1. This is the economy of scale of the entire production, in case of a marginal improvement, it might still improve the economy ofscale of producing one of the products significantly
2. Referring to the fraction converted into sold products, in many biomass processes, part of the biomass is used to producepower or heat for internal consumption: this is not what is intended here
3. This option could still improve the economy of scale of the production of individual products, although the overall scale remainssmall
Types 2, 4 and 5 could be combined with others.

531CR/71038Final CAM Oct-01
These five types of “refineries” differ fundamentally in their characteristics.
Bio-Refinery Options Overview
Biomass-only options
Type-1 - Co-productsinherent in the feedstock
Type-2 - Co-productsproduced from low-valueresidues
Biomass-fossil options
Type-4 - Bioproductionindependent from fossilproduction
Type-5 - Bioproductionsynergistic with fossilproduction
Characteristics
• Different plant fractions inherently lead todifferent set of products
• No product viable by itself• Analogous to straight-run oil refinery
Examples*
• Cellulosic ethanol from hemicellulose,power from lignin and other wastes
• Masada process with co-productrecovery
* Potential examples, some of these combinations have not yet been realized
• Residue further processed to yield more saleableproduct
• Main product viable by itself• Analogous to high-conversion refinery
• Corn Mill, paper mill that co-producesfurfural
• Bio-FT diesel plant that co-producesLPG, power-co-production
• Integrated with existing fossil facility to reduceinfrastructure and OSBL costs
• Economy of scale benefits
• Integration of polylactic acid (PLA)production with polyolefins plant
• Bioproduction and fossil production share mutualbenefits
• Synergy in downstream processing• Viable for new facilities or facilities with
bottlenecks or excess capacity only
• Bio-FT diesel plant integrated with GTLplant
Type-3 - Parallel productionof multiple products
• Only integration of feedstock preparation battery-limit and outside battery-limit (OSBL)infrastructure
• Primary benefit economy of scale; onlymeaningful for low-volume products
• Grain mill producing multiple foodproducts in parallel

532CR/71038Final CAM Oct-01
Where achievable, the Type-1 bio-refinery is most likely to providemaximum product value per ton of feedstock input.
Bio-Refinery Options Type 1 Bio-Refinery: Products Inherent in Feedstock
PRO• Highest-value use of all feedstock fractions• Could enable use of lower-concentration,
high-value products (high-volume product“pays” for harvesting and processing)
• Low-volume, high-value products could helpprovide lift in overall economics
• With cross-breeding and biotechnology,high-value products could be bred into crops
CON• Limited number of high-volume products
with non-competing feedstock demands• Demand for high-value product may be
easily satisfied by single, large-scale fuelsplant
• Low-volume of valuable products will limitbreadth of impact of this option
Characteristics• Different products are based on different chemical characteristics of feedstock fractions• Products do not compete for feedstock fractions• Benefits of combination of products in single plant are clear compared with each product
separately
PotentialApplications
Pros & Cons
Barriers toImplementation
• Typical example is combination of high-value extracted product (e.g. specialty chemical) thatoccurs at low concentration with high-volume product such as fuel
• Most likely does not include more than one fermentation-, gasification-, or pyrolysis-basedproduct (they tend to vie for the same biomass fractions)
• Finding realistic specific product combinations• Combinations may not support more than one plant, making it more difficult to justify
development costs• If high-value product is a pharmaceutical ingredient, FDA production requirements may be
incompatible with low-cost fuels production
Type-1 bio-refineries are considered further and should be investigated inmore detail by the U.S. government.

533CR/71038Final CAM Oct-01
Type-2 bio-refineries are likely to be implemented where feasible and couldadd some additional product value per ton of feedstock input.
Bio-Refinery Options Type 2 Bio-Refinery: Co-Products from Residues
PRO• Efficient and high-value use of residues• Provides uplift on main product• Likely to be more broadly applicable as
primary conversion becomes less and lessenergy intensive
CON• Many current conversion processes have
little true residue that is not already usedfor internal power or heat generation
• Candidate products less likely to be veryhigh value (most likely power, not likely tobe high-value specialty chemical orpharmaceutical)
Characteristics
• Production residues from main product are used to produce valuable co-products• Implies main product(s) that is/are close to viable on its own• New value in use of residue must exceed alternative use; many residues are proposed to be
used for internal power or heat generation, which would have to be off-set by alternativepower generation options
PotentialApplications
Pros & Cons
Barriers toImplementation
• Co-product production must be able to use residues• Co-product must be sufficiently valuable to justify additional cost• Likely examples include power co-production from lignin or residue fractions
• Limited barriers, likely to be implemented where possible• Increased plant and project complexity could present issue in first-of-a-kind facility
Type-2 bio-refineries are already included in the basic option analysiswhere feasible.

534CR/71038Final CAM Oct-01
Type-3 bio-refineries are likely to be implemented where feasible butprovide limited upside potential in a small number of applications.
Bio-Refinery Options Type 3 Bio-Refinery: Parallel Production from Biomass
PRO• Easy to implement (requires no special
process integration)
CON• Limited upside potential• Only viable for products with limited
markets, thus national impact is expectedto be low
Characteristics • No inherent synergy in production of different products• Benefits derived from economy of scale in feedstock preparation, off-sites, or infrastructure
PotentialApplications
Pros & Cons
Barriers toImplementation
• Technically works with any combination of products• Only provides benefits for products whose production scale is market constrained (rather
than limited by feedstock availability)
• Limited technical barriers• Small upside potential may limit appeal
We will not further investigate Type-3 bio-refineries.

535CR/71038Final CAM Oct-01
Type-4 bio-refineries could be implemented early on to minimize the cost ofbioproduction and facilitate product distribution.
Bio-Refinery Options Type 4 Bio-Refinery: Parallel Production with Fossil Products
PRO• Could provide significant cost savings on
non-process equipment• Facilitates distribution and marketing of
product• Could be combined with type 1 or 2 bio-
refinery
CON• Requires existing fossil-based facility with
expansion potential (e.g. space, systemscapacity)
• Does not help to reduce process-relatedcost
• May present limited benefit to fossil-basedproduction
Characteristics• No inherent synergy in production of bio- and fossil- products• Benefits derived from economy of scale in off-sites, downstream processing or infrastructure• Can take advantage of existing infrastructure where some over capacity exists
PotentialApplications
Pros & Cons
Barriers toImplementation
• Should be (and is) considered for chemicals production, notably the production of polymerprecursors
• Integration of bio-ethanol or FT diesel with existing refineries or blending terminals• Biomass co-firing for power generation
• Limited technical barriers• Small upside potential may limit appeal, especially from fossil-based processing side
We believe that type-4 bio-refineries should be seriously considered for allbut fine chemicals plants.

536CR/71038Final CAM Oct-01
Where Type-5 bio-refineries can truly be realized, they could be attractiveand provide additional impetus for the use of biomass.
Bio-Refinery Options Type 5 Bio-Refinery: Synergistic Production with Fossil Products
PRO• Provides benefits to both fossil- and
biobased production• Could help reduce process related cost• Facilitates distribution & marketing of product• Could be combined with type 1 or 2 bio-
refinery
CON• Requires changes to existing fossil-based
facility or new facility• True synergy potential is not easily found• At least GTL opportunity may not be
realistic in U.S.
Characteristics• Process and or product synergy between bio- and fossil-based production• Benefits derived from economy of scale in off-sites, downstream processing or infrastructure• Can take advantage of existing infrastructure where some over capacity exists
PotentialApplications
Pros & Cons
Barriers toImplementation
• Bio-FT diesel integrated with GTL plant• Bio-ethanol facility integrated with RFG blending station (possibly)• Requires either new facility or changes to existing fossil facilities
• Increases complexity of plant• Significantly increases the risk of the overall plant, especially for first-of-a-kind plant
Type-5 biorefineries should be considered seriously but are not likely to bea realistic option in the short term.

537CR/71038Final CAM Oct-01
Bio-Refinery Impact & Role
“Bio-refineries” are likely to play a key role in the implementation ofbiomass-derived energy and products.• “Bio-refineries” could significantly improve the economic viability of certain
biomass options, principally by reducing capital cost and improving efficiency• Only “bio-refineries” where all products truly benefit from the integration are
likely to be successful• “Bio-refineries” are likely to be much more diverse in structure than petroleum
refineries• As such, “bio-refineries” could help in the commercialization of biobased
energy and products by broadening its appeal earlier• Added technical risk and complexity are likely to initially slow down broad
implementation of most types of bio-refineries until individual technologies are“proven”

538CR/71038Final CAM Oct-01
Bio-Refinery Conclusions
Bio-refineries where true synergy between production processes can beachieved, deserve additional attention.• Combining biomass-based processes into “Bio-refineries” can offer two
potential benefits:– Maximizing the value of the products per ton of feedstock (for combining biomass-
based processes only)– Maximizing the economy of scale of the overall process (for combining biomass-based
with fossil-based processes)
• “Bio-refineries” that do not involve any synergy between the productionprocesses may be attractive in some cases, in which case, they will beimplemented readily
• “Bio-refineries” that do offer direct synergy between the production processesoffer greater potential benefit, but are also more complex and are not well-understood
• The U.S. government could further support the study of such synergistic bio-refineries, but should focus on realistic options

539CR/71038Final CAM Oct-01
Table of Contents
Identification of Options
Background & Objectives
Scenario Analysis
Executive Summary
3
1
4
0
Policy Options
5
Conclusions & Recommendations
6
Baseline Use of Biomass2
Benefit & Impact Analysis
7

540CR/71038Final CAM Oct-01
A 4-step approach was followed to identify appropriate policy options forthe DOE to consider in order to increase aggressively the use of biomassby 2010.
Policy Options Approach
1 • Underlying objectives for aggressive biomass utilization• Output versus input basis for biomass use
3• Cost?• Technology Risk?• Lack of infrastructure?• Consumer education?
4• Identify instruments that can be used, given the barriers now
in place• Analyze likely effectiveness of options to achieve aggressive
growth goals
2• Establish status quo of regulations on national and regional
level• Identify likely changes in regulations
Clearly DefinePolicy
Objective
Identify KeyBarriers toObjective
Develop &AnalyzeOptions
ReviewCurrent
RegulatoryEnvironment

541CR/71038Final CAM Oct-01
Policy Options Approach Definition of Policy Objective
Broad Objective Increase dramatically the use of biomass-derived materials in the U.S. by 2010(More than doubling of biomass use or products, fuels, and power)
If the specific objective is: Then an ideal policy option should:
Aggressively increase the use ofbiomass-derived materials
in the U.S. by 2010• Provide equal stimulus to any technology that produces biomass-derived
materials, independent of technology
Bring a particular technology from thelaboratory to the market
• Minimize technology development risks to the technology, with successfulcommercialization (and hence the end of policy support) clearly defined
Create a market for a particularbiomass-derived material
• Support any production of the material, independent of technology (and, insome cases, perhaps even independent of feedstock)
A clear definition of the policy objective is critical to the identification ofstrong policy options.• Poorly-crafted policy can have unintended consequences, and it is therefore
critical to define exactly what the goals of the policy are– This is most often observed in policies that proscribe technological fixes, rather than
setting well-defined goals
• Within a broad policy objective, specific goals may require dramaticallydifferent policy tools

542CR/71038Final CAM Oct-01
Arthur D. Little and DOE identified the underlying policy objectives for theaggressive targets for biomass use.
Policy Options Definition of Underlying Policy Objectives
Broad Study Objective More than double the use of biomass-derived energy & materials in the U.S. by 2010
To Address the Underlying Objectives... …the policies options should:
Reduce environmental burden of producing andutilizing energy and products
• Be focused on the environmental end-result, not the path toget there
• Address all relevant environmental concerns
Stimulate rural economic development• Focus on developing competitive economic activity in rural
areas, preferably value-added activity
Accelerate development of competitive U.S.technology
• Focus on technologies with competitive potential for U.S.industry, not necessarily on ones that are closest to large-scale application
• Eliminate barriers for technology development
Improve U.S. balance of payments position• Focus on U.S.-generated biomass (e.g. options should not
support import of Indonesian rubber or Brazilian ethanol)
Improve United States energy security• Focus on pathways that directly offset fossil fuel (e.g., not
food & feed or pulp & paper)

543CR/71038Final CAM Oct-01
Policy Options Current Policy Status
* Details of the policy review done are included in the Data volume
Both at the federal and state levels there are numerous policies,regulations, and subsidies that directly impact biomass-derived energy andproducts.• Many policies are broadly applicable to all renewables• At the federal level we found that:
– The 1992 Energy Policy Act (EPAct) is a powerful law to accelerate the use of alternative fuels– Existing biopower incentives have not been fully exploited due to stringent requirements, e.g., use
of closed loop biomass– Several bills had been proposed in the previous Congresses and Administrations, which would
have impacted biomass use– The Current Administration’s focus on a national energy policy promises to take a fresh look at all
national energy-related issues, presumably including biobased energy
• There are significant state-to-state variations of policies and incentives:– Alternative fuels support from oil overcharge funds or utilities taxes– Alternative fuels / vehicle rebates– Renewable Energy Trusts / funds– Net metering
• We performed a detailed analysis of worldwide policy instruments in use for thepromotion of advanced energy technology

544CR/71038Final CAM Oct-01
Policy Options Current Policy Status Federal Incentives - EPAct
The Energy Policy Act of 1992 (EPAct, Public Law 102-486) is a powerfullaw designed to accelerate the use of alternative fuels.• EPAct is a comprehensive law that promotes energy efficiency, alternative fuels, replacement fuels,
and renewable energy through requirements, incentives, and voluntary programs• EPAct requires the purchase of alternative fueled vehicles (AFVs) at both the Federal and State level;
however, EPAct does not require the use of alternative fuels– Executive Order 12844 established guidelines Federal fleets must follow; at least 75% of vehicles acquired by a
Federal fleet in any year must be AFVs– 75% of light duty vehicles acquired by State fleets must be AFVs in 2000– By 2001, 90% of light duty vehicles acquired by covered alternative fuel providers must be AFVs– Credits have been allocated to State fleet operators; these credits can be traded and sold– States can also apply for Federal assistance to implement AFV programs– Federal tax incentives are available to help offset the cost of purchasing an AFV or converting a traditional vehicle
to an AFV
• DOE hopes to significantly displace the use of petroleum motor fuels with alternative fuels such asethanol and biodiesel– 10% by 2000– 30% by 2010
• The Renewable Energy Production Incentive specified under EPAct applies to a facility for the first 10years of its operation– Incentive of $0.015/kWh for energy produced using closed loop biomass
- Closed loop has proven to be too restrictive; broadening the definition of biomass to include industrial residuesand agricultural waste is under consideration
– Incentive terminates 20 full fiscal years after the implementation of EPAct (2013), regardless of in service date
• EPAct also lowered the taxes applied to gasohol products based on the alcohol content

545CR/71038Final CAM Oct-01
Program Name Biofuel Incentive Value of Incentive
Federal Tax Deduction(through the IRS)
Allows a tax deduction for new, originalequipment manufacturer clean fuel vehiclesor for the conversion of a traditional vehicleto a clean fuel vehicle
Is available for both commercial andpersonal vehicles and must be taken in theyear that the vehicle is purchased
Deduction expires on December 31, 2004
• $5,000 for a truck or van with a gross vehicle weight(GVW) between 10,000 and 26,000 lbs.
• $50,000 for a truck or van with a GVW greater than26,000 lbs. or buses that seat 20 or more adults
• $2,000 for all other vehicles (except off-roadvehicles)
• Refueling property is also eligible for an incentive• Incentives will begin reducing after 2001 as follows:
– 25% in 2002– 50% in 2003– 75% in 2004
Policy Options Current Policy Status Federal Incentives - EPAct Structure
EPAct includes specific incentives for the purchase of alternative fuelvehicles and development of refueling facilities.

546CR/71038Final CAM Oct-01
In addition to EPAct, several other incentives are currently in place tostimulate the alternative fuel market in the U.S..
Program Name Biofuel Incentive Value of Incentive
Transportation Equity Act of the 21stCentury (TEA-21, Public Law 105-178)
An ethanol tax incentive is offered under theterms of this Federal highwayreauthorization bill. Applies to specificgeographic areas. Expires in 2007
• $0.54/gallon in 2000• $0.53/gallon in 2001• $0.52/gallon in 2003• $0.51/gallon in 2005
Small Ethanol Producer Credit Provides a tax credit for small ethanolproducers through December 31, 2007
• Dollar-for-dollar $0.10/galloncredit
• Maximum yearly tax credit of$1.5MM (15MM gallons ofethanol)
The Alternative Motor Fuels Act (AMFA)Public Law 100-494
This Federal statute calls for the FederalGovernment to purchase as many alcohol,dual energy, natural gas, or dual energynatural gas passenger automobiles and lightduty truck as is practical
• No specific incentive value
Energy Conservation ReauthorizationAct (1998)
Amends EPAct to include biodieselpurchases for use in fleet vehicles thatweigh more than 8,500 pounds (grossvehicle weight)
• One EPAct AFV acquisitioncredit for every 450 gallons ofbiodiesel containing 20%biodiesel (volumetric)
Sources: Various DOE websites
Policy Options Current Policy Status Federal Incentives - Other Laws

547CR/71038Final CAM Oct-01
Existing biopower incentives have not been fully exploited due to stringentrequirements, e.g., use of closed loop biomass.
Program Name Biofuel Incentive Value of Incentive
Renewable Energy ProductionIncentive for publicly ownedfacilities (Specified in EPAct)
Provides an incentive for biopower produced atpublic facilities using closed loop biomass1.Expires in 2003 and is appropriated on a year-to-year basis
• $0.015/kWh
Renewable Electricity Tax Credit Applies to new facilities only
• Up to $0.015/kWh• Incentive is reduced if the
purchased cost of power ismore than $0.08 or if theproject employs governmentcost sharing
The Tax Relief Extension Act of1999 (S.1792.PCS)
Extends the biomass production tax credit thatexpired last year. Extends the in service date to12/31/92 through 1/1/01 for closed loop, modifiedclosed loop, and biomass co-firing with coalfacilities. Biomass includes specific forestproducts, wood wastes, and crop by-products.MSW and paper do not qualify. Also includesfacilities powered by landfill gas and poultry wastethat are placed in service between 12/31/99 and1/1/0. Tax incentives cannot be claimed underSection 29 and this Act
• $0.015/kWh
Credit for producing fuel from anon-conventional source
Extends Internal Revenue Code Section 29provisions until January 1, 2008 for biomassfacilities placed in service after December 31,1992
Sources: Various DOE websites and United Bioenergy Commercialization Association.1. Closed loop biomass refers to agricultural products other than wood that were planted specifically for the purpose of producing electricity.
Policy Options Current Policy Status Federal Incentives - Biomass Power

548CR/71038Final CAM Oct-01
Funding for state programs that support biomass or alternative fuelscomes from industry, consumers, and state agencies.
Alternative Fuels Often from oil overcharge funds or utilitiestaxes
Alternative FuelVehicle Rebates
State energy offices, alternative fuelsindustry, utilities taxes
Renewable EnergyTrusts Systems benefits charges on electricity sales
Net Metering Electric utilities, ratepayers
Policy Options State Incentives Funding Mechanisms
Funding Source

549CR/71038Final CAM Oct-01
None, or not applicable for biomass
Individual utilities
IOUs only, not RECs
All IOUs and RECs
100 kW 40 kW
20 kW
No Limit
100 kW 10 kW
100 kW25,000 kWh/y
50 kW
1,000kWh/mo
100 kW
No Limit
25 kW100 kW
60 kW
100 kW
25 kW
IOU - Investor-Owned UtilityREC - Rural Electric Cooperative
Note: Unit size limits are shown for each state. Most net metering programsprovide buyback at the utilities avoided cost, not the retail rate.
25 kW
Policy Options Current Policy Status State Programs - Net Metering
Net metering programs that include biomass are offered by 16 states, butare commonly limited to small units.

550CR/71038Final CAM Oct-01
Seven states have developed renewables portfolio standards, whichprovide non-financial market pull.
State RPS Provisions Eligible Resources
CTClass 1: increase to 0.5% by July 2000,and to 6% by 2009Class 2: increase to 7% by 2009 from 5.5%
Class 1: New sustainable biomass, landfill gas, fuel cells,photovoltaic (PV)Class 2: Biomass, hydro, MSW
ME1 30% of supply must be renewable(includes utility owned hydro)
Biomass, MSW <100MW, fuel cells, tidal, PV, wind,geothermal, hydro, qualified small power and cogeneration
MA 1% in 2003, 4% by 2009, and 1% per yearthereafter
Low emission advanced biomass, landfill gas, fuel cellsusing renewable fuels, PV, wind, and ocean
NV 0.2%, increasing to 1% by 201050% from new PV or solar thermal50% from wind, PV, geothermal, and biomass resourcesnaturally regenerated
PA 2% increasing by 0.5% annually Biomass, landfill gas, wind, PV, small hydro (MSW does notqualify as biomass in PA)
TX 400 MW new renewable capacity by 2003;2000 MW total new capacity by 2009
Biomass or biomass-waste products including landfill gas,wind, PV, geothermal, hydroelectric, tidal
WI 0.5% by 2001, increasing to 2.2% by 2012 Biomass, fuel cells, solar thermal, PV, wind, or geothermal
1. Although Maine appears to have set the most aggressive target, it already has 50% renewable capacity (hydro and paper industrybiomass), and envisions trading credits in the future.
Source: Bioenergy UPDATE, December 1999
Policy Options Current Policy Status State Programs - Renewable Portfolio Standards

551CR/71038Final CAM Oct-01
Systems benefits charges are established in some states where electricindustry restructuring threatens the development of new technologies.
No systems benefits charge
Systems benefits charge
$135 million peryear in rate
subsidies forrenewables for 4
years (untilJanuary 2002)
California
Utility supplierscontribute 2.4% of
1995 revenuesannually for 4
years until July2003
Montana
$10 million peryear over 10years, raised
through customerlevies.
Illinois 1
1. Half of Illinois’ funds supports renewables, half supports coal technology development. No expiration.2. Most goes to DSM programs. Only $1 million targeted renewables, including fuel cells, in 1998. Programwill be reviewed in Aug 2001
$30 million peryear for 5 years(through 2002),raised through
customer levies.
Massachusetts
About $17 millionper year for 5years, raised
through customerlevies.
Rhode Island 2
Policy Options Current Policy Status State Programs - System Benefits Charges

552CR/71038Final CAM Oct-01
Green pricing programs are offered by utilities in 22 states, but only fivestates offer programs supporting biomass or landfill gas projects.1
1. Most green pricing programs support s wind power, which is close to cost competitive, or small PV projects.Source: National Renewable Energy Laboratory, 2/2000
No green pricing programs
Excludes biomass or landfill gas
Includes biomass or landfill gas
Biomass andlandfill gas
California
Landfill gas
Oregon
Landfill gas
Washington
Landfill gas
Texas
Biomass
Wisconsin
Policy Options Current Policy Status State Programs - Utility Green Power Metering

553CR/71038Final CAM Oct-01
Green pricing is offered by individual utilities as a customer service, and isnot a state requirement.
State Utility Value of Premium
CA
LA Dept of Water andPower
City of Palo Alto
SMUD
0.64 ¢/kWh
1.2-3.4 ¢/kWh
1.0 ¢/kWh
Type 1
Geothermal, biomass, wind
Landfill gas, wind, geothermal,small hydro
Landfill gas, geothermal
OR Pacific NorthwestGenerating Cooperative 1.8-2.0 ¢/kWhLandfill gas
TX Austin Energy 0.4 ¢/kWhLandfill gas, wind
WA Benton Country PublicUtility District
CustomercontributionLandfill gas
WI Wisconsin Electric PowerCompany 2 ¢/kWhBiomass, hydro, wind
Capacity
20 MW
8.3 MW
1.05 MW
40 MWplanned
1 MW
9.8 MW
Year
1999
2000
1997
1998
2000
2000
1996
1 Most green pricing programs support s wind power, which is close to cost competitive, or small PV projects.Source: National Renewable Energy Laboratory, 2/2000
Policy Options Current Policy Status State Programs - Utility Green Power Pricing

554CR/71038Final CAM Oct-01
Green power markets are emerging as states are deregulated1, makingclear definitions of “green” increasingly important.• The Green-e certification program was established to provide guidelines
for consumers on what power sources are “green”• Certified provider’s products bear the Green-e logo, assuring consumers
that the product meets specified requirements and the content is auditedannually
• Participation in the Green-e program is voluntary, so not all green powerofferings are “certified”
Policy Options State Incentives Biomass Power -- Green Power Marketing
Minimum Requirements for Green-e Certification
At least 50% is from renewable energy sources (biomass,including landfill gas, wind, solar, small hydro (generally <30MW), tidal, ocean, wind, or geothermal)
The remainder can be non-renewable, but must have lowerSO2, NOx, and CO2 emissions than your grid supply.
1 California, Pennsylvania, New Hampshire, and Massachusetts are closest to retail offerings. Arizona, Arkansas, Connecticut, Delaware, DC, Illinois, Maine, Maryland, Montana, Nevada, New Jersey, New Mexico, Ohio, Oklahoma, Oregon, Rhode Island, Texas, and Virginia have passed deregulation legislation

555CR/71038Final CAM Oct-01
Marketers with Green-e certification will be searching for new renewablecapacity, creating potential market pull for biomass-fired plants.• One year after deregulation, Green-e certified products must contain at
least 5% new renewable capacity– Requirement increases by 5% each year, until 25% of the product is new renewable capacity– New capacity is defined as
- Operating after January 1, 1997- Re-powered after January 1, 1997- Improvement or enhancement of an existing facility- A separately metered landfill gas resource not used for power generation prior to January
1, 1997
California Companies with Green-e Certified Products
Commonwealth Energy Corporation Green Mountain EnergyPG&E Energy Services Utility.comAutomated Power Exchange New West EnergyPacifiCorp SMUD
Policy Options State Incentives Biomass Power -- Green Power Marketing

556CR/71038Final CAM Oct-01
U.S. Green Power Marketers
All Energy Marketing Company Essential.comBonneville Power Administration Foresight EnergyBoston Oil Consumers Alliance Go-Green.comCalpine Corporation GreenMountain.comComEd Keystone Energy ServicesCommunity Energy Inc. Mack Services GroupCommonwealth Energy Corporation PacificorpConectiv Energy PG&E CorporationEdison Source PG&E Energy ServicesElectric Lite Power DirectEnergy Atlantic Renewable Energy AllianceEnergy Cooperative Association of PA Scottish PowerEnron Energy Service Sun Power ElectricUtility.com Vestas American Wind Technology
Source: http://www.eren.doe.gov/greenpower/marketing.shtml
Policy Options Current Policy Status State Programs - Green Power Marketing
Green power marketers, in general, represent a direct pathway to marketfor biomass power projects, although without the strict criteria required ofGreen-e certified suppliers.

557CR/71038Final CAM Oct-01
Four states offer credits or other financial incentives for new alternativefuels conversion facilities.
State Program Value
Arkansas 30% of the cost of buildings andequipment
Iowa20% grant, 80% loan, up to a maximumof $900,000. Fund receives about $2million annually
NorthCarolina 35% of project cost, up to $250,000
Wisconsin $15,000 for technical assistance,$75,000 for construction
Type
CorporateTax Credit
State Loan
CorporateTax Credits
State Grant
Program Description
Designed to promote development offacilities that produce ethanol, methanol,and their derivatives from biomass
Renewable Fuel Fund has funded sixethanol plants, two soy processingplants, and a methane recaptureprogram for hog farmers
Biomass production facility credits
Source: Bioenergy UPDATE, April 2000
Policy Options Current Policy Status State Programs - Alternative Fuel Conversion Facilities

558CR/71038Final CAM Oct-01
Only five states offer consumer rebates for alternative vehicle purchases,and two states offer fuel tax exemptions.
State Alternative Fuel Vehicle Rebates
Arkansas $1000 to $2000 for vehicle conversions. Federal rebates of $2000 to $4000 areadditive
California $5000 maximum, for new vehicle purchases only
Colorado $1,500 for passenger cars, $2,500 for light duty trucks, $3,500 for medium dutytrucks, and $6,000 for heavy duty
Indiana $2,000 to $10,000 grants for alternative fuel vehicles (also includes refuelingstations, wood waste boilers, and renewables)
Pennsylvania20% of the cost of AFV, refueling facilities, recharging stations, or vehicleconversion to alternative fuels. $3.5-4.0 million/year is raised from from a utilitiestax to fund the program
State Alternative Fuels Tax Exemption
Hawaii Alcohol fuels tax exemption
Iowa Ethanol-based fuels tax exemption
Policy Options Current Policy Status State Programs - AFV and AF Assistance

559CR/71038Final CAM Oct-01
We used the analytical tools developed in this study to identify the currentbarriers to implementation of biomass technologies.
Policy Options Identification of Barriers
• While the broad objective (more than double biomass use by 2010) applies toall technologies, it is expected that the specific barriers to the implementationof each technology will vary by technology and application
• Some of the barriers that are expected to be significant are shown in the tablebelow
TechnologyDevelopment Risk
• New technologies carry risk premiums, with associated rises in financing costs,construction times, acquisition of qualified personnel, etc.
High Cost of FinishedProduct
• Note that this may be a permanent feature of the technology (e.g., inherently high costfeed stock) or a temporary feature that can be solved with further technologydevelopment and production scale.
Infrastructure Limitations• The introduction of new products that are economically viable, and technically proven
may be slowed by the lack of a well-developed infrastructure: for feedstockprocurement, product distribution/marketing and/or end-use of the finished product.
Consumer Education• Consumers may not be aware of the particular benefits of a particular product, thus
slowing its market penetration. Consumers may possess disinformation regarding thetechnology or product.
Examples of Expected Technology Barriers

560CR/71038Final CAM Oct-01
It is useful to recognize that some barriers are persistent and will requirecontinued government fiscal support, while others require “investments”.
Policy Options Identification of Barriers
Time
Leve
l of I
nves
tmen
t
Technology A
Technology B
R&D Stage Demonstrationstage
Market penetrationstage
This technology requires larger fiscal supportafter it has achieved market penetrationthan it did before, suggesting that the salesrequire steady government support in orderto achieve market share. This might resultfrom:
• Inherently high feedstock costs• Inherent limitations in conversion efficiency
This technology requires requires agovernment investment to bring it tomarket, but once it enters the market, itrequires little (if any) sustained governmentsupport
Both types of barriers must be tackled in order to achieve significantimpact in all segments.

561CR/71038Final CAM Oct-01
Once these barriers are identified, it is possible to classify the policyoptions to spur their implementation.
Policy Options Identification of Barriers
TechnologyDevelopment Risk
• Bench-scale R&D to improve technology• Co-funding of pilot plant construction and/or operation• Publicity of early successes• Favorable tax/depreciation treatment for first-generation plants• Access to low-cost capital• Access to personnel
High Cost of FinishedProduct
• Subsidized prices (e.g., ethanol credit)• Cross-subsidies from competing products• Note that subsidies may be permanent (type A) or gradually phase out (type B)
Infrastructure Limitations• Subsidize the development of an infrastructure• Bring together industrial partners to develop infrastructure (e.g., California H2 program)• Develop codes and standards for infrastructure
Consumer Education • Publicity/education
Barrier Sample Policy Options (Partial List)

562CR/71038Final CAM Oct-01
Barriers to technology implementation were identified from the comparisonof the BAU and Aggressive growth scenarios, as well as the impactanalysis.
Policy Options Identification of Barriers
Examples of Potential Barriers, by Stage of Development Impacted
MarketPenetration
System DemonstrationRefined
PrototypesCommercial Prototypes
MarketEntry
Type
of B
arrie
r
Technical
Economic
Market
Political /Regulatory
Research and DevelopmentComponent
R&DInitial System
Prototypes• Low efficiency• Low durability• High cost
• Unit operationcompatibility
• Thermal integrationissues
• Operation in “realworld” conditions
• Proof of durability • Provideperformancedesired by market
• Incrementaltechnologyadvances
• Materials selection• Efficiency
• High balance ofplant (BOP) costs
• Identify path tolower costs
• Developmanufacturingtechniques
• Maintenance &service cost
• Access toaffordable fuels
• Incremental costreduction
• Markets often notidentified
• Markets often notidentified and/orpoorlycharacterized
• Identify “earlyadopter” markets
• Develop marketingstrategy
• Unacceptablereturn
• Feedstockavailability
• Publicity• Consumer
education
• Lack of R&D taxcredits
• Lack of R&D taxcredits
• Identification ofrelevant codes &standards
• GM standards
• Siting & permittingissues (compliancewith C&S); GMstandards
• Subsidies tocompetingtechnologies
• Inconsistency ofregulatoryenvironment (stateversus Federal,etc.)
Biopower Biofuels Bioproducts

563CR/71038Final CAM Oct-01
We identified five key categories of barriers that most impact all categoriesof options.
Policy Options Identified Key Barriers
Cost notAcceptable
Address EarlyAdopterMarkets
Poorlyeducatedconsumer
Regulatory BarriersFundamentalTechnology
Barrier
Biopower
•Cost of stand alonebiopower is too high
•Black liquor gasifiersface marketconservatism
•Biopower not seenas really green
•RDF / Waste-to-energy seen as an“incinerator”
•Fly-ash regs for co-firingare restricting
•Deregulation uncertainty•Biomass feedstockmarkets not welldeveloped
•New Source Review
•Gas cleaning forBIGCC must beimproved
•Design & eng.guidelines for co-firingimplementationdon’t exist
Biofuels
•Cost of all optionsmore than 1-2 timesas expensive for fuelvalue of products
•Oxygenate marketsprove difficult tosubstitute ethanol(market,infrastructureissues)
•Value of green fuelsnot recognized
•Ethanol credit only extendto all renewable fuels?
•Limitations on GMO R&Dand production
•Organisms for CBP(consolidatedbioprocessing)ethanol not robust
•Gas cleaning forBio-FT not adequate
Bioproducts
•Cost of currenttechnologies maystill be too high forearly adopterapplications
•Need early marketsfor fermentation-based feeds
•U.S. consumer notvery responsive togreen branding
•Competition with“biodegradable”fossil derivedproducts
•Product standards for newchemicals not yetestablished
•Limitations on GMO(genetically modifiedorganism) R&D andproduction
•Fermentation-basedcommodity-scaleproduction not welldeveloped
•Large-scale reactortechnology notdeveloped
BiomassFeedstock
•Biomass low energydensity makestransportation costskey issue
• Harvesting, yield
•Pulp & paperexpand powerproduction
•Ag residues formore revenue forfarmer
•Biomass equatedwith MSW;“garbage”
•Biomass utilizationplants perceived as“dirty”
•Markets for biomass notwell developed
•Competition amongbiomass forms (ag wastesvs energy crops)
•Recalcitrance ofcellulosic biomassfor applicationsother than power
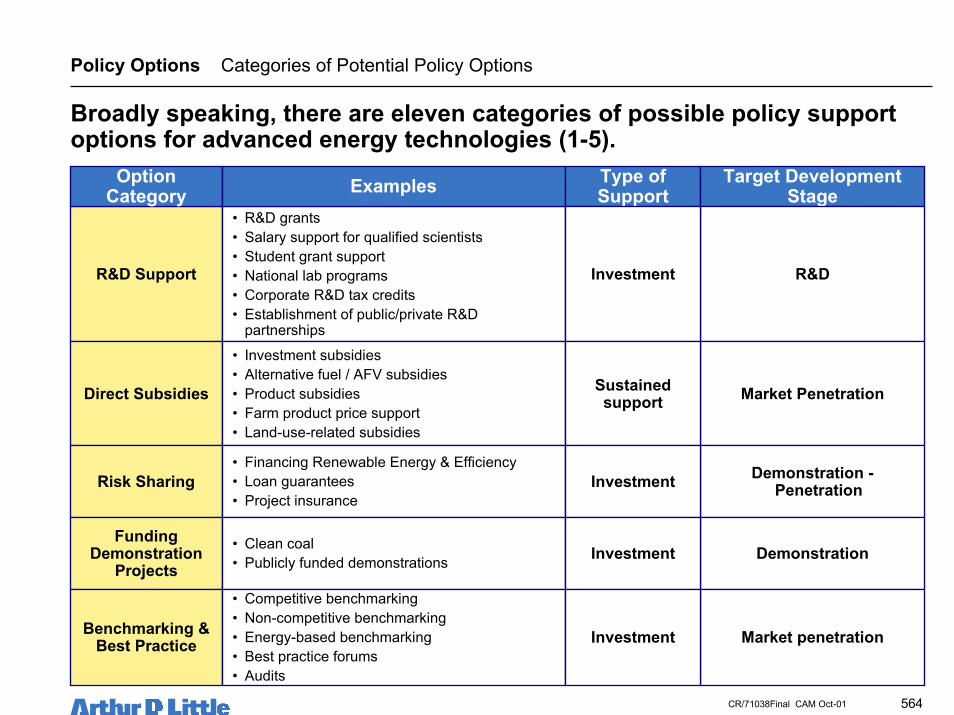
564CR/71038Final CAM Oct-01
Broadly speaking, there are eleven categories of possible policy supportoptions for advanced energy technologies (1-5).
Policy Options Categories of Potential Policy Options
R&D Support
• R&D grants• Salary support for qualified scientists• Student grant support• National lab programs• Corporate R&D tax credits• Establishment of public/private R&D
partnerships
Direct Subsidies
• Investment subsidies• Alternative fuel / AFV subsidies• Product subsidies• Farm product price support• Land-use-related subsidies
Risk Sharing• Financing Renewable Energy & Efficiency• Loan guarantees• Project insurance
FundingDemonstration
Projects• Clean coal• Publicly funded demonstrations
OptionCategory Examples Type of
SupportTarget Development
Stage
R&DInvestment
Market PenetrationSustainedsupport
Demonstration -PenetrationInvestment
DemonstrationInvestment
Benchmarking &Best Practice
• Competitive benchmarking• Non-competitive benchmarking• Energy-based benchmarking• Best practice forums• Audits
Market penetrationInvestment

565CR/71038Final CAM Oct-01
Broadly speaking, there are eleven categories of possible policy supportoptions for advanced energy technologies (6-11).
Policy Options Categories of Potential Policy Options
VoluntaryAgreements
• Gentlemen’s agreements• Covenants• Public/private partnerships
Risk Sharing• Financing Renewable Energy & Efficiency• Loan guarantees• Project insurance
Standards,regulation,
Deregulation
• Regulation rationalization• Utility deregulation• Renewable portfolio standards• Green certification
R&D - Market PenetrationInvestment/Sustainedsupport
Demonstration, MarketEntry, PenetrationInvestment
R&D - Market PenetrationInvestment /SustainedSupport
InfrastructureInvestment • Government investment in infrastructure Market Entry, Market
PenetrationInvestment
OptionCategory Examples Type of
SupportTarget Development
Stage
InformationProvision
• Consumer awareness programs• Technical information exchange programs• Industry workshops• Networking events• Training activities
R&D - Market penetrationInvestment
Tax Measures • Investment tax credits• Depreciation benefits
Market Entry, MarketPenetrationInvestment
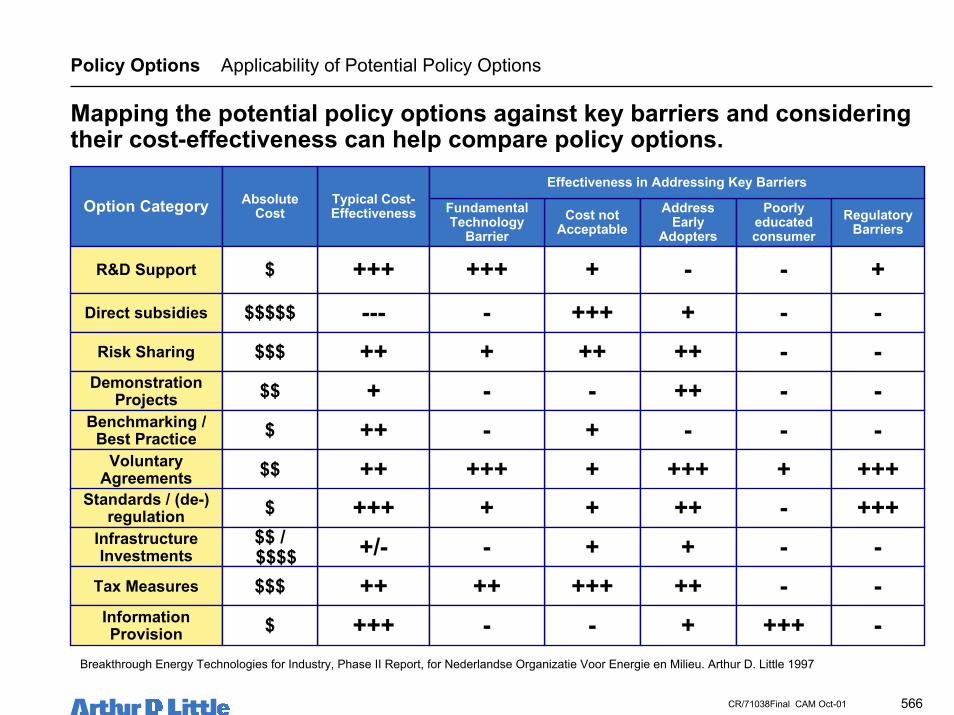
566CR/71038Final CAM Oct-01
Mapping the potential policy options against key barriers and consideringtheir cost-effectiveness can help compare policy options.
Policy Options Applicability of Potential Policy Options
Option Category Typical Cost-Effectiveness
AbsoluteCost Cost not
AcceptableAddress
EarlyAdopters
Poorlyeducatedconsumer
RegulatoryBarriers
FundamentalTechnology
Barrier
R&D Support
Direct subsidies
Risk Sharing
DemonstrationProjects
+++$
---$$$$$
++$$$
+$$Benchmarking /
Best Practice ++$Voluntary
Agreements ++$$Standards / (de-)
regulation +++$InfrastructureInvestments +/-$$ /
$$$$Tax Measures ++$$$InformationProvision +++$
+ - - ++++
+++ + - --++ ++ - -+- ++ - --+ - - --+ +++ + +++++++ ++ - +++++ + - --
+++ ++ - -++- + +++ --
Effectiveness in Addressing Key Barriers
Breakthrough Energy Technologies for Industry, Phase II Report, for Nederlandse Organizatie Voor Energie en Milieu. Arthur D. Little 1997

567CR/71038Final CAM Oct-01
Policy Options Regional Justification of Sustained Government Support
Sustained support of globally uneconomic options may still be sensiblefrom a national or regional perspective.• Sustained support for a given option clearly costs the state significant sums in
subsidies, price supports, tax credits etc.• However, that cost can be off-set wholly or partially by economic benefits to the
region:– Switch from imported to home-grown products– Investment in industry creates jobs– This all creates extra tax revenue which could be used to fund the subsidy partially

568CR/71038Final CAM Oct-01
Policy Options Summary
A selected set of policy options appear to be critical to achieving successin implementing increases in biomass use.• R&D support is critical to achieve the necessary and sustained breakthrough
improvements in technology performance and cost• Voluntary agreements and public/private partnerships are critical to marshalling the level
of resources necessary for large-scale implementation efficiently• Tax measures can be used to entice early adopters and or bridge the cost-
competitiveness gap for selected biomass options• Information programs and consumer education programs are critical to internalizing the
benefits of biobased energy and products in terms of product premiums• Direct subsidies or price controls are likely the only way to have a chance at achieving
the tripling goal can be achieved by 2020 in all sectors• If, for example, similar tax credits as in ethanol were provided for biopower and
bioproducts, significantly larger impacts could be achieved in these categories, of coursewith considerable added cost too
• Sustained support, while not desirable from a global, free market perspective, may in factbe sensible on a national or regional basis

569CR/71038Final CAM Oct-01
Table of Contents
Identification of Options
Background & Objectives
Scenario Analysis
Executive Summary
3
1
4
0
Policy Options & Recommendations
5
Conclusions
6
Baseline Use of Biomass2
Benefit & Impact Analysis
7
570CR/71038Final CAM Oct-01
Overall Conclusions
Overall, the opportunities for biomass-derived energy and products areconsiderable with environmental benefits and increased value-addedactivity.• In the near term, and with modest additional cost, considerable impact can be achieved by focusing
on a number of attractive options, primarily in biopower• In the longer term, significant impact can be achieved with the further development of some higher-
risk technologies– This impact takes the form of reductions in greenhouse gases and other pollutants– Increased domestic production of natural resources consumed in the U.S.– Increased high-value economic activity in rural areas
• Achieving a doubling or tripling of use of biomass energy and products is possible by 2015 or 2020– The development of new production and conversion technologies and the application to new markets could lead to
this impact overall, and in each of the biomass use categories (power, fuel, and products)
• However, we recommend that the U.S. government carefully weigh the rate of increase in the use ofbiomass-derived energy and products against the cost– We believe that attempting to achieve rapid doubling of biomass energy and products use at all cost (e.g. by 2015)
will lead to the application of technologies that could be superseded by superior and more cost-effectivetechnologies only few years later
• Thus, we believe that a somewhat more long-term view of the biomass opportunity which allows forthe development of technologies that could become commercial in the 2010-2020 timeframe, wouldbe beneficial, and may lead to a more optimal use of resources for the benefit of the nation

571CR/71038Final CAM Oct-01
Conclusions Key Findings Potential
With sufficient investment and government support, significant increasesin the use of biomass energy and products in the U.S. by 2010 arefeasible...• Sufficient biomass is expected to be available in the U.S. to more than double its use but prices at
high volume are expected to exceed $20/dry ton farm-gate (~$1.1/GJ; $1.2/MMBTU)• Several significant implementation options appear nearly ready for commercialization, provided a
supportive regulatory and tax environment for their early implementation:– Biogas-to-power (e.g. landfill gas) and biomass co-firing with coal provide competitive ways to increase biopower
capacity by over 100% by 2010 (additional 11,000 MW) from today’s biopower capacity levels– Increased use of bio-ethanol as a gasoline oxygenate, it alone represents a potential 50% increase (additional 2
billion gallons) in use by 2010 from today’s biofuel consumption (provided the current tax credit is continued and theoxygenate requirement in RFG remains)
– Fermentation-based monomers, pyrolysis-derived phenolics and lipids offer near-term opportunities for increasingbioproducts use by over 40% from today’s use (additional 7 billion pounds product by 2010)
• When looking out to 2020, additional long-term options exist to significantly expand that impact:– Biogas-to-power (e.g. landfill gas, sewage gas, digester gas) and gasification based biopower– Ethanol for gasoline blending based on advanced cellulosic-based technology– Bio-polymers via fermentation based processes
• These options could provide significant environmental and rural economic benefits by 2010 withaggressive deployment:– Over 95 million ton per year reduction in carbon dioxide reduction emissions– Significant criteria pollutant emission reductions (390 thousand tons SOx avoided; 440 thousand tons NOx avoided)– Around three billion dollar per year added economic activity in rural areas by 2010 from feedstock production alone
(primary impact)
... though doubling of use is not likely to happen before 2015.

572CR/71038Final CAM Oct-01
Conclusions Key Findings Technology
Achieving significant impact will require the application of new biomasstechnologies to new applications, in addition to expanding existing ones.
• Existing biomass utilization is based on mature technology and occurs mostly in maturemarkets (e.g. pulp & paper, starch manufacture)
• Combinations of new technologies and new applications are required to achieve rapidand significant growth in the use of bio-derived energy and products
• Key improvements in technology for targeted markets could aid the implementation ofbiomass-derived energy and products:– Development of lower cost, high-volume, biomass feedstocks (e.g. energy crops) and the
establishment of large-scale distribution infrastructure for these biomass feedstocks– Development and demonstration of low-cost production processes, which could result in broader
cost-competitiveness for biomass-derived power, fuels, and products in the long term (after 2010)– Demonstration of the viability and reliability of technologies currently under development– Development of optimal information systems to minimize the impact of industry inertia on the
market penetration rate of biomass technologies and their products
• Integrated production of energy and products in “Bio-refineries” could contribute toimproving the cost competitiveness of biomass options with fossil-based counterparts;this will likely require new inter- and intra industry collaborations
1. This analysis used the projected crude oil and electricity prices in 2010 from the U.S. Energy Information Administration (USEIA) 2001 Energy Outlook,reference case scenario.

573CR/71038Final CAM Oct-01
Conclusions Key Findings Barriers
To achieve these benefits, significant barriers to implementation must beovercome which will require focused government support.
• Given current projections for crude oil and utility prices,1some of the long-term2 options are expectedto require considerable investments by stakeholders and carry higher production costs
• High feedstock and capital recovery costs are the main barriers to significant increases in the use ofbiomass-derived energy and products in the U.S.:– Most current technologies are not cost-competitive with conventional fuels, power, and products in new markets
without government support– Considerable R&D/D3 funding will be required to prepare the technologies for commercial application– Significant investments (tens of billions of dollars) will be required for plant construction and infrastructure
development
• To overcome these barriers, two types of support are critical:– Sustained support for crop (resource) production, crop conversion, and product use through tax credits, farm
supports, and subsidies will be required if use of biomass-derived energy and products is to be dramaticallyincreased
– Strong support for R&D/D focused on long-term improvements in technology that will eventually make thetechnology cost-competitive with conventional fuels and power sources
– Coordination and careful planning of such support will be critical to its success
• The USDOE, USEPA and USDA could play a key coordinating role with interested industries if suchan effort were undertaken
1. This analysis used the projected crude oil and electricity prices in 2010 from the U.S. Energy Information Administration (USEIA) 2001 Annual EnergyOutlook, reference case.
2. In this context, near-term means having significant impact before 2010, while long-term means with potentially significant impact in the 2010-2020timeframe.
3. R&D/D is Research, development and demonstration

574CR/71038Final CAM Oct-01
Conclusions Biomass Production Availability & Cost
Sufficient biomass is expected to be available to more than double the useof biomass but farm-gate prices at high volumes are expected to exceed$20/dry ton.• Available literature data indicates that over 600 million dry tons of biomass are available within the U.S. at
farm-gate prices between 0 and 40 $/dry ton (0 to ~$2.3/GJ or $2.4/MMBTU):– Available biomass is defined as a resource that is currently or potentially collectable and not currently used as
energy fuel or any beneficial use and is potentially usable (not contaminated)– Available biomass in significant quantities below $20/dry ton farm-gate are heterogeneous wastes (Organic
municipal solid waste, and urban tree residues)– Manure is potentially available in large quantities and at low cost, but off-site applications may be limited due to
high transportation costs– Based on USDOE agricultural sector model projections, energy crops could be the largest source of biomass at
prices in excess of $40/dry ton farm-gate, but energy crops are not currently produced in high volume
• Consistent and homogeneous biomass supplies are only available in large quantities at prices in excess of$20/dry ton farm-gate (e.g. energy crops, corn stover, wheat straw)
• The biomass sources with the highest potential in the 0-40 $/dry ton farm-gate price range are:– Corn stover (Great Lakes region: Minnesota, Iowa, Wisconsin, Illinois, Indiana, Ohio and Michigan)– Switchgrass (Southeast and West regions: all other states)– Organic municipal solid waste (Northeast: New England, New York, Pennsylvania, New Jersey, and Delaware)– Forest residues (Northwest :Washington, Oregon, Idaho, and Montana)
• Feedstock cost reductions alone will not enable broader competitiveness for some technologies
Further cost reductions (through more efficient production and co-production with foods & feeds) could broaden the appeal of biomass use inindustry.

575CR/71038Final CAM Oct-01
Bioenergy and bioproducts industries could provide environmentalbenefits, provided careful management practices are implemented.
• Converting traditional crop lands into perennial energy crop production could yield netbenefits in increased soil carbon and nutrients– Energy crop production can have erosion concerns unless managed properly– Reduced runoff contamination and improved biodiversity are additional potential benefits
• If agricultural residue collection are managed properly soil quality (e.g. organic matter,nutrients, and soil stability) can be maintained and/or improved and increased runoffcontamination avoided
• Provided marginal lands need to be carefully managed to realize net benefits fromenergy crop production
• Forest residue collection must be managed properly to prevent erosion and realizebenefits from fire prevention
• Several areas of additional research are necessary to assess the potential environmentalimpacts and benefits of bioenergy and bioproducts industries– The information currently available is based on smaller scale studies– Studies at larger scale are needed to validate results and determine landscape scale effects
Conclusions Biomass Production Environmental Impacts

576CR/71038Final CAM Oct-01
Conclusions Biopower Options Opportunities For Growth
Several biopower options could provide large fossil energy & greenhousegas reduction benefits in the short to medium term with modest cost.• A number of biopower options are commercially available today or can be made available within 1-2
years with minimal technology development– Co-firing of solid biomass in coal plants– Biogas (digester gas or residue gas) and landfill gas combustion
• These technologies also have fairly attractive economics today, particularly when the fuel source islow or zero cost
• Other biopower technologies have the potential for attractive economics ultimately, but technologydevelopment is still required to achieve the needed levels of cost and performance– Various gasification options (Refuse derived fuel [RDF], small-scale systems, utility-scale systems, black liquor)– Some of these technologies also face significant non-technical hurdles, such as RDF gasification and black liquor
gasification
• Several opportunities for biopower are significant and could independently achieve the aggressivegoals for biomass use if fully exploited– While it is unlikely that any one application will achieve its full technical potential, a combination of applications
could meet the aggressive goals– The fact that biopower utilizes a variety of feedstocks allows for parallel deployment with minimal inter-application
competition– Many resources, like landfill gas and onsite residues, are not likely to be in demand for other end uses besides
electricity generation
• Biopower has the potential to be cost effective at a variety of scales, from less than 1 MW to 100 MW,depending on the application and technology used– This provides the opportunity to utilize feedstocks that might otherwise not be useable for biofuels or bioproducts

577CR/71038Final CAM Oct-01
Conclusions Biofuel Options Opportunities For Growth
*Based on $21/b oil prices projected by EIA for 2010, for comparison assume price of conventional fuels is roughly proportional to crude oil prices
Biofuels have significant potential as additive alternatives for conventionalpetroleum fuels, provided current tax credits are continued.• Many biofuel options exist that are technically feasible based on fermentation, low-temperature
processing and gasification technology• Due to the huge market potential, biofuels can offer significant potential impact
– The most likely continued growing market for biofuels is as blending agents– Neat fuels are a longer term option
• Ethanol looks particularly attractive as a desirable gasoline additive:– Additive markets (as an MTBE replacement) for ethanol would provide ~50% higher value than blending or neat
fuel markets primarily due to its oxygenate value on a dollar per gallon basis– A progressive reduction in ethanol cost is projected down to about two times the cost of gasoline on a volume basis– The ethanol tax credit aids the economics so that today ethanol can be competitive with MTBE
• Other fuels could be considered, but they will face much higher barriers than the ones selected– Bio-FT diesel appears to offer another plausible combination of cost and environmental benefits:– Bio-FT diesel is considerably more expensive than ethanol is projected to be at about 2.5 times the price of
conventional diesel* (on a energy basis)– Bio-FT diesel could help to meet new diesel specifications, but it will face tough competition from natural-gas-based
FT diesel– Extending ethanol tax credits to Bio-FT-Diesel would reduce the price differential to 50-100%

578CR/71038Final CAM Oct-01
Ethanol could be close to cost-competitive as an oxygenate additive, butother biofuel options carry a considerable cost premium when valuedsolely on energy content.
Conclusions Biofuel Options Opportunities For Growth
• Biofuels, either as a straight fuel replacement, as a blending stock, or even as an additive, representvery large potential markets for biobased products
• As a straight replacement of conventional fuels, the cost premium of biofuels over conventional fuelsexceeds 100% and presents the most important barrier to the implementation of biofuels as a neatfuel and volume extender
• As a fuel additive, we estimate that bio-ethanol could be produced for a very modest cost-premiumover MTBE; the current ethanol tax credit bridges that gap
• This, together with the alternative fuel tax credits available in some states and the planned phase-outof MTBE make bio-ethanol a plausible biofuel option for blending for oxygenate applications
• It is unclear whether ethanol is as competitive when just valued on its octane value (compared to itsoxygenate value) excluding any tax credits
• The tax credit could be reduced further if aggressive R&D&D on cellulosic ethanol technology reducescosts associated with feedstock, capital, and non-fuel operating
• In niche applications, where advantage can be taken of other benefits of bio-ethanol production,lower-overall-cost solutions could be found now:– Production of bio-ethanol from waste-streams while recovering other valuables from these stream– Use of forest residues for ethanol production that must be utilized (e.g. in California)– Use of existing infrastructure (e.g. use of idled paper mills or biomass power plants)

579CR/71038Final CAM Oct-01
Conclusions Bioproduct Options Opportunities For Growth
Several bioproducts appear to be able to approach cost and performancecompetitiveness with conventional products.• Fermentation-based polymer building blocks can offer cost-competitive routes
to commodity plastics provided key technology challenges are met• Selected pyrolysis-based and low-temperature processing based products
(using woody biomass and lipids) may be competitive in medium to largemarkets
• Bioproducts derived by C1-chemistry do not appear to come close to beingcost-competitive on a stand alone basis because of lack of economy of scale inthe processing steps
• Biotechnology could lead to a broader range of products that could beproduced through physical separation or fermentation
• Further development is required for large scale energy efficient reactors, thatallow easy and flexible operation and integration in “bio-refineries”, especiallyfor fermentation processes
• For commodity markets, availability of the desired feedstock at low cost and insufficient quantities is critical

580CR/71038Final CAM Oct-01
Conclusions Bioproduct Options Opportunities For Growth
Several bioproducts appear to be able to approach cost and performancecompetitiveness with conventional products.• Fermentation-based polymer building blocks can could offer cost-competitive
routes to commodity plastics provided key technology challenges are met:– High primary product yield and concentration– Large-scale, continuous-reactor production technology– Ability to use low-cost feedstock (i.e. waste or cheap to grow feedstock)
• Selected pyrolysis-based and low-temperature-processing-based productsmay be competitive in niche markets:– Phenolics from wood pyrolysis– Lipid based products such as fatty alcohols, acids, and esters
• Bioproducts based on C1-chemistry do not appear to come close to being cost-competitive:– Should still be considered as co-products in FT-diesel or DME production (bio-
refinery)– Require similar market premium or subsidy as most competitive fuels

581CR/71038Final CAM Oct-01
To achieve the necessary performance and cost improvements bothimproved organisms and improved reactor engineering will be required.• Process engineering can be used to achieve the capacity scale needed for
cost competitiveness– Continuous processing is required for commodity market competitiveness– Reaction scale and reactor type have to be sufficient to match both cost requirements
and market capacity– Process engineering can influence product concentration and product yields
• Genetic engineering of the organisms determines to a large extent, achievableproduct yields, product concentrations and by-product selectivity– Product concentration has to be high enough to allow for effective and simple
purification technology– Product yield should be high enough to allow for efficient substrate and equipment
utilization– Product selectivity will be determined in large part by the metabolic pathways used to
make the product by the organism
• Low cost (and available) feedstocks are required but alone will not ensurecommodity scale cost competitiveness
Conclusions Bioproduct Options Potential Improvement Mechanisms

582CR/71038Final CAM Oct-01
Conclusions Bioproduct Options Future Perspective
In the long term, further advances in genetics and bioengineering couldbroaden the appeal of bioproducts.• Biotechnology could lead to a broader range of products that could be
produced through physical separation or fermentation:– Currently, fermentation based products are limited to a few products that are
biochemically feasible to produce– Agricultural biotechnology efforts utilizing plant production could lead to success for a
much wider spectrum of potential products from physical separation and fermentation
• Further development of large scale energy efficient reactors, that allow easyand flexible operation and integration in “bio refineries”
• Development of stable production organism strains that allow for:– Sufficient product yield– Sufficient product concentration– Desired feedstock use
• Availability of the desired feedstock cost at low cost and sufficient quantities

583CR/71038Final CAM Oct-01
A number of uncertain factors could considerably benefit or detract fromthe growth and impact of biomass-derived energy and products.• Conventional energy prices:
– Developments in crude oil prices are likely to have considerable impact on all options, particularlyon the fuels and products options, which are competing directly with petroleum-based products
– Gasoline shortages in 2000 due in part to localized rulemaking leading to boutique fuelrequirements provide an opportunity for biofuels
– Uncertainty in natural gas and electric power prices also could have a significant impact on bio-energy viability, particularly for biopower options
– Fluctuations in prices cause uncertainty which concerns investors in biomass plants
• Political factors:– The situation around RFG oxygenates (MTBE) is unresolved and though it currently appears
favorable for biofuels, other outcomes are still possible– Tax incentives for biofuels have been rather stable over the past fifteen years– Discontinuation of PURPA support for biopower plants has caused concern over long-term
reliability of government support
• Public opinion:– Public environmental concern drives most interest in biomass-derived energy and products– Until recently use of Genetically Modified-crops for non-human food-uses was considered
uncontroversial in the U.S., but experience with GM-corn crossfertilization has called this intoquestion; this could have significant ramifications for the feasibility of certain crop improvementefforts for energy and product applications
– NIMBY concerns for waste to energy facilities might affect RDF biopower options– Impact of biomass production/collection/transport on local environment may be a concern
Conclusions Uncertainties

584CR/71038Final CAM Oct-01
Biomass power use could be doubled by 2010 but this would require thatseveral factors combine favorably in addition to strong governmentsupport.• Biomass co-firing with coal is critical for rapid, near-term growth and is responsible for over 50% of the growth
– Direct co-firing using non-woody fuels will likely be required, which will itself require further technology development anddemonstration
– May be potential for synergy with new clean-coal-based technologies (not included in analysis)
• Biomass integrated gasification combined cycle (BIGCC) technology in the pulp & paper industry is the second mostimportant contributor with almost 20%of the growth
• Landfill gas and digester gas also figure prominently in the aggressive growth scenario for early growth– Technologies are available today– USDOE should focus on removing economic or regulatory barriers
• Other gasification technologies are less important in the near-term but are important for sustained growth:– Other industries that generate residues are expected to contribute modestly throughout the 2000-2020 timeframe– RDF could become a significant source of biopower in the long term, provided technical and environmental issues are
addressed successfully– Gasification for co-firing could become significant beyond 2010, in both coal- and natural gas-fired power plants
• Implementation of the Aggressive Growth scenario would require several successful simultaneous developments:– Biomass supply infrastructure to develop rapidly if the market potential is to be realized– Successful development of gasification technology– Successful elimination of regulatory barriers to biopower implementation
• It would also require significant government support to overcome the cost difference of some longer-term options andexpected market prices
Conclusions Scenario Analysis Biopower

585CR/71038Final CAM Oct-01
Conclusions Scenario Analysis Biofuels
Biofuel utilization could be tripled by 2010, albeit at a high cost.
• In a Business As Usual scenario, increases in production and use of biofuels would beapproximately 800 million gallons ethanol by 2010 (Over baseline consumption):
– Limited by current technology cost and government incentives– Gasification-based technology is not likely to become commercial– Ethanol looks like the preferred MTBE replacement but die is not cast– Implementation of ethanol as an MTBE replacement in California is thought to have net positive
impact on California economy (but not necessarily on the country)
• Achieving tripling of biofuels use by 2010 would require:– Strong regulatory support for bio-derived oxygenates for RFG nationwide– Highly successful technology development and cost reduction– Highly packaged plants for integration with conventional blending and distribution terminals– Continued and stable incentives for biofuel productions
• However, the cost associated with achieving this impact rapidly would be very high:– Cost of current bio-ethanol requires a $0.54 per gallon tax credit– Additional demand (especially if MTBE were phase out in the nation and an oxygenate
requirement remained) would put pressure on ethanol markets and could possibly increase theprice
– Achieving a tripling goal would require construction of cellulosic ethanol facilities based on firstgeneration technology

586CR/71038Final CAM Oct-01
Conclusions Scenario Analysis Bioproducts
Bioproducts use could be tripled by 2020 requiring aggressive technologyand market development but not sustained government support.• In a Business as Usual scenario, bioproducts would capture a small fraction of the growth volume of
specific chemical markets– No current large-scale incentives for bioproduct use (such as tax credits for ethanol fuel, green power and other
renewable power credits)– Most of the growth comes from traditional bioproduct growth (e.g. starches) and from products produced by
physical extraction (e.g. seed oils), in which bioproducts already have a high market share– Limited potential market for low-hanging fruit– Technologies with greater potential impact do not reach the market until much later and will penetrate the market
slowly– Even in the BAU scenario, however, we expect bioproducts to have a considerable impact in the longer term, since
competitive economics will be achieved for broad-based application of bioproducts to polymers and solvents
• With aggressive technology and market development and some government support (but notnecessarily product price support), a significant impact (even tripling) may be achievable by 2020,though not by 2010– Technologies with high impact potential (such as fermentation-based polymers and monomers) would become
commercially available in the 2010 timeframe– With plant construction and market penetration inertia significant market penetration would not be achievable before
2020
• Given the limited volume of product markets (as compared with fuels and power markets) the relativeimpact of bioproducts on greenhouse gas emissions and rural economic development can beconsiderable, but not large in absolute terms– Because of the more limited scale, at least early facilities may well be integrated into existing chemicals plants or
into existing corn or paper mills– The projected economics of bioproducts will eventually not require sustained government financial support for
several of the options, resulting in potentially very modest cost for investment, but not for sustained subsidies

587CR/71038Final CAM Oct-01
A selected set of policy options appear to be critical to achieving successin implementing increases in biomass use.• R&D support is critical to achieve the necessary and sustained breakthrough
improvements in technology performance and cost• Voluntary agreements and public/private partnerships are critical to marshalling the
level of resources necessary for large-scale implementation efficiently• Tax measures can be used to entice early adopters and or bridge the cost-
competitiveness gap for selected biomass options• Information programs and consumer education programs are critical to internalizing
the benefits of biobased energy and products in terms of product premiums• Direct subsidies or price controls are likely the only way to have a chance at
achieving the tripling goal can be achieved by 2020 in all sectors• Renewable content standards have been proposed and are possibly a good
alternative to direct support• Sustained support, while not desirable from a global, free market perspective, may
in fact be sensible on a national or regional basis
Conclusions Policy Options Summary