cqs strategy perspectives
TRANSCRIPT
Where Now for Credit?NOVEMBER 2015
CQS Strategy Perspectives

2
Credit market trading liquidity has fallen from pre-Crisis levels, driven by regulatory change, a shift in market participants and signifi cant growth in the size of the market (relative to the size of the Street).
This ‘new normal’ for credit trading exhibits greater volatility and more persistent mispricings. We believe the opportunity set has increased across different parts of the credit market and across capital structures.
Tactical trading and adept credit selection will become more valuable as entry and exit costs increase.
A fl exible platform with a mandate to invest in multiple types of credit assets across currencies, markets and capital structures is key to exploiting the greater number of observable price anomalies.
We believe the ‘new normal’ is ideally suited for patient (longer lockup) and fl exible (multi-asset in scope) capital with a global footprint across all parts of credit markets, utilising strong credit selection skills.
“Liquidity” has been a prominent topic for credit market participants over the last several years, and has emerged frequently in conversations with our clients and counterparties. We recognise that market liquidity has changed meaningfully due to structural and behavioural factors. The data shows a sizeable reduction in liquidity since pre-Crisis; it also shows that liquidity was unusually high in the few years prior to 2008. Rather than viewing today’s environment as unusual, we view the 2003 to 2008 period as the outlier – and today as reverting to a ‘new normal’.
The ‘new normal’ credit market structure is an extremely harsh environment for some. We are likely to see higher price volatility, greater periods of ‘overshooting’ and sizeable gap moves (up or down) given fewer buffers in the system. Investment platforms which face short-term (daily or weekly) redemption risk, that operate with high mark-to-market leverage and daily margining requirements, or which are constrained to investing in narrow sections of the credit markets will fi nd the ‘new normal’ environment to be quite challenging.
Change is often disturbing, particularly when it impacts how markets operate. However, we are not as concerned as some about the current state of market liquidity as an impediment to outperformance. On the contrary, we believe that the opportunity set in the current environment favours patient and fl exible capital, which can identify and harvest opportunities across an increasingly segmented credit market.
In the last seven years, the size of credit markets and the breadth in number and type of credit securities traded have grown signifi cantly. Over the same period, we have seen dramatic shifts in fi nancial market regulations affecting the type and size of market participants who actively trade credit risk. As the manner in which credit markets trade has evolved, we have adapted the way in which we invest.
We believe that this ‘new normal’ requires adept talent in trading, research and risk management. We think that credit markets have become more fragmented in this ‘new normal’ – both across capital structures as well as geographic regions. This environment favours fl exible capital under a global platform which can best assess relative value across capital structures and across different markets.
We welcome price volatility, as it allows patient capital better entry and exit levels as liquidity permits. We consider the current retreat by Dealers as an opportunity to deploy capital in highly convex structures with attractive risk-reward profi les. In short, we think current liquidity concerns are overdone and miss the emergence of a larger and more attractive opportunity set.
We like the ‘new normal’. We believe that current market conditions are providing the best credit-pickers’ market for fundamentally-driven investors like us since 2011.
Introduction
Summary
CQS Strategy Perspectives: November 2015

3
Credit Market Liquidity
These changes, in aggregate, have had several direct effects on Dealers:
The more critical changes affecting Dealers’ willingness and ability to provide liquidity include:
Signifi cant increase in regulatory capital requirements
New constraints on total balance sheet size
Elimination of proprietary trading operations
Imposition of annual ‘stress tests’ by regulators on portfolios, trading and risk management
Regulators ‘embedding’ staff directly into Dealers
Revised risk-weights and underwriting procedures for structured products
Standardisation of margin requirements for derivatives
Strong encouragement to shift derivative trading to common clearing platforms (CCPs)
Dealers face large increases in the (regulatory) cost of capital for holding credit assets
Consequently, Dealers are less willing to offer leverage to investors and only then at a higher cost
Dealers are strongly discouraged, if not prohibited, from actively holding risk on a proprietary basis
Consequently, market-making is constrained to pure risk intermediation (e.g. simple brokerage)
Closer regulatory scrutiny, from ‘embedded’ regulatory staff to the annual ‘stress test’ reviews, discourage Dealers from engaging in any activity or new business that might appear to be aggressive
Hence, we have fewer new fi nancial products and consequently less volume and liquidity from new products
Increased transparency, standardisation of margin and encouragement of CCPs for derivative transactions signifi cantly reduces the profi tability of the market-making business for single-name CDS and CDS indices
Harsher risk-weights and underwriting procedures make it more challenging to create structured products
These changes reduce the profi tability of market-making, and make it harder to retain quality trading talent
What has changed?Liquidity is commonly defi ned as the degree to which an asset can be bought or sold in the market without meaningfully affecting its price. For a given size, there is a trade-off between immediacy and realised price. It is also important to distinguish between global liquidity (the overall looseness of fi nancial conditions) and market liquidity (the ability and cost of trading). We are focusing here solely on market liquidity, how changes in the ease
with which we enter or exit positions affect our ability to generate alpha and alter the size of our opportunity set of attractive trades.
Changing the rules of the game
A key consequence of the Crisis and its aftermath for market liquidity was the dramatic shift in fi nancial market regulation, coordinated on a global scale and with implications for all market participants.
CQS Strategy Perspectives: November 2015

4
1Source: SIFMA, US Bond Market Issuance and Outstandings, updated 3 November 2015. 2, 3BoAML, 1 September 2015.
These in turn result in higher price volatility for credit markets in the face of idiosyncratic credit events or broader elevated risk premia. The Street is no longer the marginal buyer (seller) of risk. As a result, credit markets have lost a key counter-cyclical buffer.
Moreover, the elimination of proprietary trading from Dealers and the reduced supply (and higher cost) of leverage offered by Dealers to investors mean that there are fewer people taking short positions in credits, and the sizes of the positions are smaller. As a result, the short base of credit risk is smaller in aggregate. Consequently, there is less short-covering (i.e. buying back a short risk position) upon a sudden drop in price, again, removing a counter-cyclical buffer and increasing price volatility.
Finally, the higher cost and reduced supply of leverage offered to investors only reduced further their capacity to be a marginal buyer (seller) of risk: less leverage means smaller position sizing.
Changing the size and quality of the playgroundIn response to the Crisis, central banks embarked on a period of near-zero policy rates combined with programmes of asset purchases (Quantitative Easing, or QE) that was unprecedented in size (both absolute and relative to GDP). This had important consequences for credit markets:
Signifi cant growth in the outstanding stock of corporate bonds as issuers replaced bank loans with bonds and took advantage of historically low rates to increase net borrowings (see Figures 1 and 2). The demand for corporate bonds was driven by a growing pool of investors seeking yield in any form as rates compressed. The demand was strong from both retail investors looking to offset near-nil deposit rates as well as institutional investors managing a liability book (e.g. pension, insurance) which rose in size as discount rates fell.
As a result, the stock of US$ corporate bonds grew strongly from $2.6tr in January 2005, to $3.6tr in January 2009 to $8.2tr by September 2015.1
Over time, this has led to a gradual, and now accelerating releveraging of corporate credits as replacement of existing bank debt has been overtaken by aggregate new borrowing. In the face of historically-cheap funding, corporates relevered – leverage metrics for US investment grade corporates are higher now than pre-Crisis levels. We believe this releveraging trend has been one key driver of the recent increase in dispersion of credit spreads within major indices.
QE and the resultant increased retail demand for credit led to a dramatic growth in Exchange Traded Funds (ETFs). These funds provide retail investors (and some
Figure 1: European High Yield Bond Market BAML Index (HE00)2
Figure 2: US High Yield Bond Market BAML Index (H0A0)3
0
100
200
300
400
500
600
700
€0
€50
€100
€150
€200
€250
€300
€350
2007 2008 2009 2010 2011 2012 2013 2014 2015
# of bonds
Not
iona
l Out
stan
ding
(€bn
)
EU HY - Notional EU HY - # of bonds
0
500
1,000
1,500
2,000
2,500
$0
$200
$400
$600
$800
$1,000
$1,200
$1,400
$1,600
2007 2008 2009 2010 2011 2012 2013 2014 2015
# of bonds
Not
iona
l Out
stan
ding
($bn
)
US HY - Notional US HY - # of bonds
CQS Strategy Perspectives: November 2015

5
institutional investors) an effi cient way to buy and sell a diversifi ed portfolio of corporate bonds, with liquidity similar to that of equities. The outstanding stock of corporate bond ETFs grew from $5.3bn in 2005 to $74bn by 2010 to $210bn in 20144.
ETFs became active procyclical players in corporate bond markets, largely because they are used actively by retail and institutional investors. ETFs become buyers of bonds when they receive retail infl ows and become sellers upon retail outfl ows. Importantly, ETFs are largely benchmark-based, so their trading activity exacerbates the differences in liquidity between benchmark and non-benchmark constituents.
As a result, ETFs are now an important marginal buyer (seller) of credit risk, despite the fact that their aggregate sized $210bn pales compared to the corporate bond holdings of insurance companies or mutual funds, $2.7tr or $2.3tr, respectively5.
The amount and proportion of credit managed against a bond index has grown. In addition to the rapid growth in ETFs, mutual funds focused on corporate bonds, largely benchmarked to an index have also seen dramatic growth. Mutual funds’ corporate bond holdings have grown from $660bn in 2005 to $2.3tr in 20146.This growth of a benchmarked investor base offering daily liquidity has encouraged a bifurcated pattern of liquidity. Bonds not included in an index saw a signifi cant drop in liquidity. Similarly, price volatility increases for bonds as they drop in (or out) of any bond index.
The amount of credit owned by search-for-yield investors has grown. This group of investors are reacting to global policy easing, which has led to near-zero yields for bank deposits and most short-dated government bond markets. Of note, this has seen non-US holdings of corporate bonds rise by 60% over the last ten years to $2.9tr.7 This investor base is important in that they will likely re-allocate out of corporate bonds once central bank policy rates and government bond yields start to rise.
ConclusionThe outstanding stock of corporate bonds has grown signifi cantly, helped by a similarly large growth in the universe of both benchmark-oriented investors and also less-sticky investors through ETFs.
Changing the way in which we trade creditDealers have largely transitioned towards a more brokerage-style model, where they are reluctant to take on risk unless they are confi dent that they can lay off the risk in a short time horizon. In addition, regulatory changes have altered not only the price and size of risk that Dealers will take on but also the price and size of leverage they will extend. The signifi cant growth in the outstanding stock against a reduced Street operating under a brokerage model means that the ‘exit door’ for large position holders has gotten uncomfortably small. Figure 3 shows the proportion of corporate bond volumes that were “crossed” – meaning that the Dealer took minimal risk. The proportion has risen meaningfully and consistently for US high yield bonds (the grey lines), highlighting the continued shift towards a brokerage model.
Figure 3: TRACE Crossable Activity by CUSIP8
4,5,6,7Source: Federal Reserve Board, Financial Accounts of the United States: Z.1 Statistical Release, updated 18 September 15. 8MarketAxess10 November 2015.
TR
AC
E C
ross
able
Act
ivity
by
CU
SIP
(%)
60%
55%
50%
45%
40%
35%
30%
25%2009 2010 2011 2012 2013 2014 2015
HG (Moving Average) HG HY (Moving Average) HY
Date
CQS Strategy Perspectives: November 2015

6
9Source: SIFMA, 1 September 2015. 10MarketAxess, 10 November 2015. 11MarketAxess as of 26 October 2015.
1.25
1.00
0.75
0.5
0.25
Euro Euro HG Euro HY
BASI
(%
of P
ar)
May2013
Sept2013
Jan2014
May2014
Sept2014
Jan2015
May2015
Sept2015
This means that trading must be more tactical.
Empirically, things are not all bad and actually appear to be improving over the last two to three years. Figure 4 shows trading activity under several metrics looking at daily trading volume (for the US market) as a proportion of the total outstanding stock, as a proportion of the ‘liquid’ outstanding stock (i.e. the BOA corporate bond indices). It illustrates these metrics declining steadily until mid-to late 2012, after which they begin to stabilise or trend upward.
MarketAxess also tracks the bid-ask spread across the US and European corporate bond markets, using a more refi ned measure to weigh for trade size and type of activity. Unfortunately, the data history only goes back about fi ve years. However, as can be seen in Figure 5, it also shows a gradual improvement since 2009 and more recent stabilisation in the US. Interestingly, Figure 6 shows moderate worsening conditions in European High Yield over the last two years.
The data also shows that corporate bond turnover has stabilised, after dropping signifi cantly from pre-Crisis levels. Figure 4 looks at average daily trading volumes for US high yield and US investment grade corporate bonds relative to the notional outstanding of the tradeable market (using the BOA-ML bond index as a proxy) as well as the notional outstanding of the entire corporate bond stock (using the SIFMA outstanding stock data). It shows a meaningful drop since the pre-2008 period, an improvement since 2012 and relatively stable trading turnover in the last year.
ConclusionEmpirical evidence of market liquidity demonstrates stabilisation at a lower level of activity.
Figure 4: US Corporate Bond Market Turnover SIFMA Average Daily Trading Vol as % of SIFMA IG and HY notional outstanding9
Figure 5: MarketAxess Bid-Ask Spread Index (BASI)™10
Figure 6: MarketAxess Bid-Ask Spread Index (European BASI)™11
bps
40
30
20
10
0
2009 2010 2011 2012 2013 2014 2015
BASI
0.00%
0.20%
0.40%
0.60%
0.80%
1.00%
2005 2006 2007 2008 2009 2010 2011 2012 2013 2014 2015
IG Turnover (total SIFMA outstanding)
HY Turnover (total SIFMA outstanding)
CQS Strategy Perspectives: November 2015

7
A Larger Opportunity SetThe ‘new normal’ has signifi cant implications for credit markets, both in structure and scope. Credit markets have expanded rapidly since the Crisis, largely as a function of QE. The market is larger in absolute size, relative size to GDP, number of issuers, number of bonds and (importantly) different types of securities from across the capital structure. One additional characteristic of the post-Crisis environment was a high degree of correlation of credit spreads across geographic regions, sectors and even different parts of the credit asset class. Everything was trading on beta. As the changes outlined previously began to take effect, the correlated price activity diminished. In the last few years, we have instead observed more volatility in credit spreads across different parts of the market – dispersion is rising and correlation is falling.
The increased retreat of Dealers from risk-taking and the greater fragmentation of investors into benchmark-focused or regional-focused portfolios only exacerbated the difference in price activity observed across markets.
Below, we present four examples of how increased market segmentation present opportunities.
One excellent example of market segmentation has been visible across global senior secured loans. From 2011 through the early part of 2015, US senior secured loan mutual funds and hedge funds experienced signifi cant infl ows from investors seeking yield in a less rate-sensitive/low-duration structure. For context, US senior secured loan mutual funds saw more than two years of uninterrupted weekly infl ows, driven by a doubling of the mutual-fund AUM focused specifi cally on senior secured loans. We observed a similar growth in CLO volumes, which rose from $54bn to $124bn between 2012 and mid-2015 (with the number of CLO managers rising from 66 to 105 over the same period)12.
In contrast, European senior secured loans did not have such a widespread retail-driven support, as UCITs funds are largely restricted from owning signifi cant amounts of senior secured loans. Moreover, with negative net CLO issuance in Europe due to more adverse regulations on Dealers, spreads and yields on euro-denominated senior secured loans remained attractive compared to US senior secured loans between 2012 and 2014.
This pricing differential began to reverse during the summer of this year, as US investors became more concerned over energy-related exposures within senior secured loans, as outfl ows from US senior secured loan funds accelerated, and as net CLO issuance in the US market
abated. Moreover, following a two-year period of concern and speculation over an imminent lift-off in rates by the Federal Reserve, the summer saw a reversal and growing speculation (ironically) that any rate rises would be deferred. All of these factors combined to see a widening in US senior secured loan spreads outright and relative to European senior secured loan spreads, as shown in Figure 7.
Now the differential in spreads between US and European senior secured loans looks attractive – European senior secured loans trading +55bp tighter (more expensive) than US senior secured loans, as expensive a relative differential as we have seen in the last fi ve years (see graph below). We believe that this represents an attractive entry point for a re-allocation from European into US senior secured loans.
#1: Relative value across currencies: € vs. US$ senior secured loans
Figure 7: Senior Secured Loan Relative Value: US$ vs. €13
12Source: S&P Financial Services, S&P LCD Research, October 2015. 13S&P LCD Loan US$ and € loan indices, spread-to-maturity (bp) as of 23 October 2015.
0bp
100bp
200bp
300bp
400bp
500bp
600bp
700bp
800bp
Oct 12 Apr 13 Oct 13 Apr 14 Oct 14 Apr 15 Oct 15
€ Senior Secured Loans
US$ Senior Secured Loans
CQS Strategy Perspectives: November 2015

8
S f
Looking back, there was signifi cant value in European high yield bonds at the beginning of 2012. As global QE progressed, the reach-for-yield demand from investors grew signifi cantly and demand for European high yield dramatically increased. Retail investors were keen to purchase yield to compensate for very low coupons from government and investment grade bonds – consequently, European high yield bond mutual funds and UCITs saw signifi cant infl ows. Additionally, global high yield credit funds saw equally strong growth of infl ows, of which an increasing proportion was allocated into European high yield bonds. Of signifi cant impact, institutional investors saw a marked increase in global high yield mandates in response to lower yields across other traditional fi xed income markets. Finally, there was a material growth in all types of credit hedge funds focusing on both European and global credit markets.
European high yield borrowers were more than happy to meet this demand, and issuance of high yield bonds rose dramatically. The European high yield bond market tripled in size and in number of issuers between early 2010 and today.
We began to see segmentation within the European high yield credit market, as demand for high yield bonds outstripped demand for similar senior secured loans. By the start of 2013, European high yield offered little relative value over European senior secured loans (the latter offering better protection for investors and historically providing better recovery on default). By the middle of 2014, European high yield bond spreads were actually nearly 200bps tighter than those in European senior secured loans (see Figure 9) – investors were essentially being paid greater spread to move into a more senior position in the capital structure. European senior secured loan spreads did not compress in a similar fashion, in part, because liquid UCITs funds are largely restricted from investing in them. This relative valuation persisted for two years and has only recently reversed.
As can be seen in Figure 9 and 10 since June 2014, European high yield bond spreads have widened by 200bps to 500bps (OAS). In addition, because the average coupon on new bond deals dropped over the last four years (from 7.0% to 5.5%), retail investors actually bear greater capital loss to spread widening. Moreover, the dispersion within European high yield bond indices has widened as well. As a result, retail investors have experienced greater capital loss with more volatility since June 2014.
We think this is only the early stage of a rotation. We believe that dispersion could increase even further should we begin to see a protracted exit from the asset class by the same investors who entered on a search-for-yield mandate. In the histogram below, we illustrate the change in spread distribution for individual issuers – now nearly 30% of the market is trading at spreads wider than 600bps, up from approximately 10% in early 2014.
Just as we preferred the risk-reward in European senior secured loans over much of 2013 and 2014 (getting paid more spread for a more senior credit position), we think that the technical dynamics are now shifting once again. Investor fl ows are leading to shifts in relative value opportunities within similar pools of credit risk. As European high yield bond spreads continue to widen more than European senior secured loans, we will look to tactical rotation out of senior secured loans and back in to bonds. We believe that the increased dispersion and see heightened volatility in European high yield bonds will only provide better tactical opportunities to execute this shift over time.
The key driver of the relative value rotation – both in mid-2013 and today – has been the segmentation of the investor base for European senior secured loans and the infl ux of non-dedicated investors into (and out of) European high yield bonds.
14Source: S&P LCD Loan € loan index, BAML Euro HY bond index (HE00) , spread (bp) vs. euribor as of 23 October 2015. 15Bloomberg, Option Adjusted Spreads as of 23 October 2015.
Figure 10: European High Yield Bond Dispersion of Spreads15
Figure 9: € High Yield Bonds vs. € Senior secured loans14
#2 – Relative Value between European high yield bonds and European senior secured loans
0
10
20
30
40
50
60
0bp 250bp 500bp 750bp 1,000bp 1,250bp 1,500bp
Num
ber
of B
onds
Spread Level (OAS)
Jun 2014
Oct 2015
200bp
300bp
400bp
500bp
600bp
700bp
800bp
900bp
1,000bp
Oct 11 Jun 12 Feb 13 Oct 13 Jun 14 Feb 15 Oct 15
€ Senior Secured Loans
HE00 vs euribor
CQS Strategy Perspectives: November 2015

9
During periods of heightened volatility, credit spreads react differently across the capital structure of the same issuer. This is due to the variations in liquidity across different securities within the same capital structure, as a result of either perceived riskiness or segmentation of investor interest. One example was the Italian telecommunication credit, Wind SpA, during October 2014 – which was a period of broader credit market volatility in the face of mixed macro data, heightened geopolitical pressure and concerns over broader credit fundamentals. These concerns faded by mid-November 2014 after the ECB announced that it was considering expanding its QE
programme. As shown in Figure 12 (in the red circle), Wind’s Senior Secured Loan dropped 2pts during this period of price volatility, while Wind’s senior unsecured bond (€ 7% 2021) dropped nearly 10pts over the same period. This pattern repeated itself in another period of volatility in September 2015, with the Senior Secured Loan relatively unchanged against a 6pt price drop in the bonds. By tactically moving from the secured loan into the bond during the “air pockets”, an investor can exploit these relative value discrepancies within a company’s capital structure and access potentially greater return opportunities.
#3: Relative value within an Issuer’s Capital Structure
Figure 11: Wind Telecommunicazioni SPA16
16Source: Bloomberg as at 30 October 2015. For illustrative purposes only. This is presented solely to show different strategies being pursued and is not intended to show performance or best or worst trades.
CQS Strategy Perspectives: November 2015

10
Many parts of credit markets have very segmented investor bases. Investors in senior secured loans differ in type, return horizon and risk-appetite from investors in structured credit, high yield bonds or convertible bonds. In the past year, we have found opportunities to exploit this gap in investor focus, particularly between convertible and unsecured bonds. The graph below highlights the example of Prospect Capital, a specialised mezzanine debt and equity lender. Prospect is a BBB-rated credit with unsecured bonds, convertible bonds and listed equity. Specifi cally, we fi nd two Prospect bonds to be of interest: both mature in 2019, both rank pari-passu in
the capital structure but one is a convertible and the other is a senior unsecured bond. The convertible (5.875% Jan 2019) has a higher coupon and is offered below par, while the senior unsecured (5% Jul 2019) has a lower coupon but trades above par. Figure 12 shows the recent price history.
We fi nd this type of mispricing attractive: the convertible has a higher coupon and a higher yield than the unsecured bond, yet retains the upside optionality of the equity. This mispricing is driven by both a segmented investor base and by reduced risk capital looking across assets.
#4: Relative value across different credit assets
Figure 12: Prospect Capital17
17Source: Bloomberg as at 30 October 2015. For illustrative purposes only. This is presented solely to show different strategies being pursued and is not intended to show performance or best or worst trades.
CQS Strategy Perspectives: November 2015
11
The ‘new normal’ credit market structure is an extremely harsh environment for some. We believe we will see higher price volatility, greater periods of ‘overshooting’ and sizeable gap moves (up or down) given fewer buffers in the system. Investment platforms which face short-term (daily or weekly) redemption risk, that operate with high mark-to-market leverage and daily margining requirements, or which are restricted to investing in specifi c areas within credit will fi nd the current environment challenging.
We believe that investors need to consider platforms that are better suited to the ‘new normal’.
Liability Management is Key
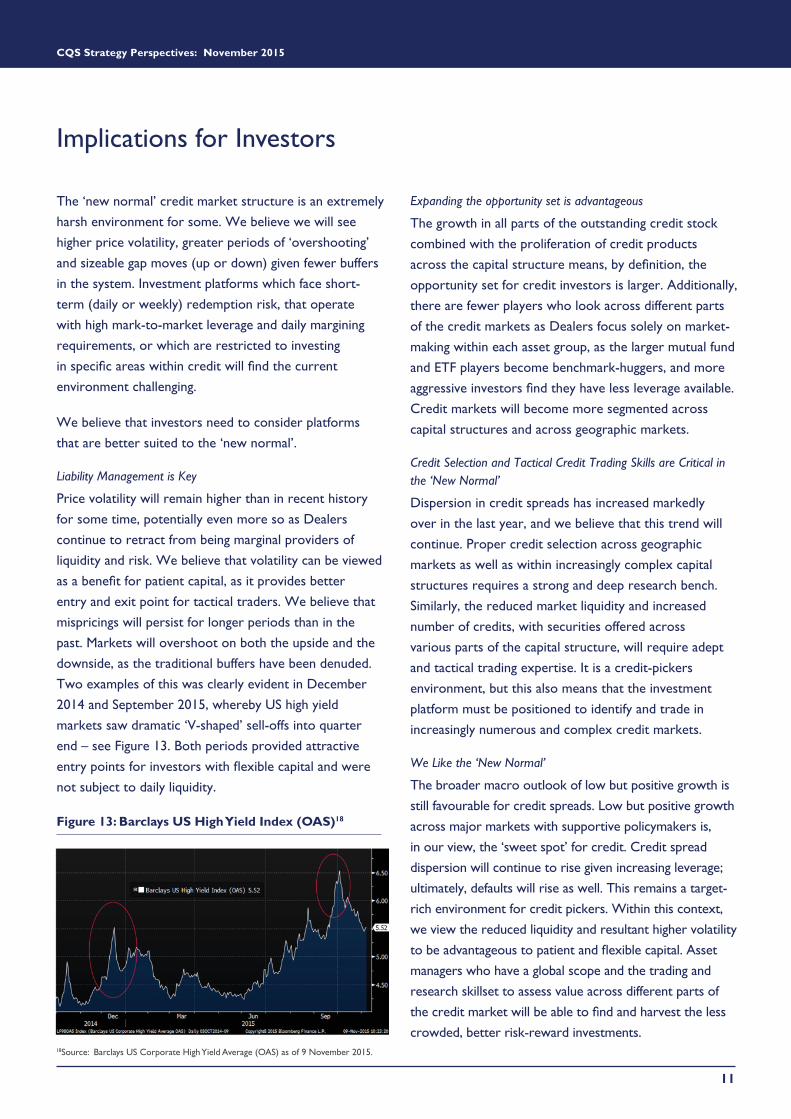
Price volatility will remain higher than in recent history for some time, potentially even more so as Dealers continue to retract from being marginal providers of liquidity and risk. We believe that volatility can be viewed as a benefi t for patient capital, as it provides better entry and exit point for tactical traders. We believe that mispricings will persist for longer periods than in the past. Markets will overshoot on both the upside and the downside, as the traditional buffers have been denuded. Two examples of this was clearly evident in December 2014 and September 2015, whereby US high yield markets saw dramatic ‘V-shaped’ sell-offs into quarter end – see Figure 13. Both periods provided attractive entry points for investors with fl exible capital and were not subject to daily liquidity.
Expanding the opportunity set is advantageous
The growth in all parts of the outstanding credit stock combined with the proliferation of credit products across the capital structure means, by defi nition, the opportunity set for credit investors is larger. Additionally, there are fewer players who look across different parts of the credit markets as Dealers focus solely on market-making within each asset group, as the larger mutual fund and ETF players become benchmark-huggers, and more aggressive investors fi nd they have less leverage available. Credit markets will become more segmented across capital structures and across geographic markets.
Credit Selection and Tactical Credit Trading Skills are Critical in the ‘New Normal’
Dispersion in credit spreads has increased markedly over in the last year, and we believe that this trend will continue. Proper credit selection across geographic markets as well as within increasingly complex capital structures requires a strong and deep research bench. Similarly, the reduced market liquidity and increased number of credits, with securities offered across various parts of the capital structure, will require adept and tactical trading expertise. It is a credit-pickers environment, but this also means that the investment platform must be positioned to identify and trade in increasingly numerous and complex credit markets.
We Like the ‘New Normal’
The broader macro outlook of low but positive growth is still favourable for credit spreads. Low but positive growth across major markets with supportive policymakers is, in our view, the ‘sweet spot’ for credit. Credit spread dispersion will continue to rise given increasing leverage; ultimately, defaults will rise as well. This remains a target-rich environment for credit pickers. Within this context, we view the reduced liquidity and resultant higher volatility to be advantageous to patient and fl exible capital. Asset managers who have a global scope and the trading and research skillset to assess value across different parts of the credit market will be able to fi nd and harvest the less crowded, better risk-reward investments.
18Source: Barclays US Corporate High Yield Average (OAS) as of 9 November 2015.
Implications for Investors
Figure 13: Barclays US High Yield Index (OAS)18
CQS Strategy Perspectives: November 2015

12
Founded in 1999, CQS is an $12.8bn1 global multi-strategy asset management fi rm. CQS has over 280 staff located globally, 92 of whom are specialist investment professionals. CQS is a founding member of the Hedge Fund Standards Board and is regulated by the FCA in the UK, the SFC in Hong Kong, ASIC in Australia and registered with the SEC in the US. CQS launched its fi rst hedge fund in March 2000 and has since expanded its offering to include additional strategies and bespoke solutions in the areas of multi-strategy, convertibles, asset
backed securities, credit, loans and equities.Since inception, the fi rm has placed fundamental analysis at the heart of its investment process and we follow a collaborative multi-disciplinary approach seeking adjacencies across all areas in which we invest. Our robust operations and risk management platform provides all mandates with liquidity management and risk monitoring which, in our view, should enable our investment professionals to be more nimble and effective throughout all market environments.
About CQS
¹Source: CQS, estimated as at 1 November 2015.

13
Not for distribution to retail investors as defi ned in Article 4 of the European Directive 2011/61/EU and the UK FCA COBS 3.4. CQS is a founder of the Hedge Fund Standards Board (“HFSB”) which was formed to act as custodian of the hedge fund best practice standards (the “Standards”) published by the Hedge Fund Working Group (“HFWG”) in 2008 and to promote conformity to the Standards. HFSB is also responsible for ensuring that they are updated and refi ned as appropriate. The Standards were drawn up by HFWG which comprised the leading hedge funds (based mainly in London) in 2007 in response to concerns about the industry, including fi nancial stability and systematic risk. The HFWG completed its work in January 2008 and published its report outlining the Standards. By applying, managers commit to adopt the “comply or explain” approach described in the Standards.
The term “CQS” may include one or more of any CQS branded entity including CQS Cayman Limited Partnership which is registered with the Cayman Islands Monetary Authority, CQS (UK) LLP and CQS Investment Management Limited which are both authorised and regulated by the UK Financial Conduct Authority, CQS (Hong Kong) Limited which is regulated by the Hong Kong Securities and Futures Commission, CQS (US), LLC which is registered with the US Securities and Exchange Commission, and CQS Investment Management (Australia) Pty Limited which is registered with the Australian Securities & Investments Commission, Australian Financial Services Licence No. 386047.
This document has been prepared for general information purposes only and has not been delivered for registration in any jurisdiction nor has its content been reviewed by any regulatory authority in any jurisdiction. The information contained herein does not constitute: (i) a binding legal agreement; (ii) legal, regulatory, tax, accounting or other advice; (iii) an offer, recommendation or solicitation to buy or sell shares in any fund or any security, commodity, fi nancial instrument or derivative linked to, or otherwise included in, a portfolio managed or advised by CQS; or (iv) an offer to enter into any other transaction whatsoever (each a “Transaction”).
Any decision to enter into a Transaction should be based on your own independent investigation of the Transaction and appraisal of the risks, benefi ts and suitability of such Transaction in light of your individual circumstances. Where applicable, any decision to enter into any Transaction should be based on the terms described in the relevant prospectus, supplement, offering memorandum, private placement memorandum, trading strategy, constitutional document and/or any other relevant document as appropriate (each an “Offering Document”). Any Transaction will be subject to the terms set out in its Offering Document and all applicable laws and regulations. The Offering Document supersedes this document and any information contained herein.
Nothing contained herein shall constitute or give rise to the relationship of partnership nor shall it constitute a joint venture or give rise to any fi duciary or equitable duties. Any information contained herein relating to any third party not affi liated with CQS is the sole responsibility of such third party and has not been independently verifi ed by CQS or any other independent third party. The information contained herein is not warranted as to completeness or accuracy and no representations are made in such respect, nor should it be deemed exhaustive information or advice on the subjects covered; as such, the information contained herein is not intended to be used or relied upon by any counterparty, investor or any other party. The information contained herein, as well as the views expressed herein by CQS professionals made as of the date of this presentation, is subject to change at any time without notice.
CQS uses information sourced from third-party vendors, such as statistical and other data, that are believed to be reliable. However, the accuracy of this data, which may also be used to calculate results or otherwise compile data that fi nds its way over time into CQS research data stored on its systems, is not guaranteed. If such information is not accurate, some of the conclusions reached or statements made may be adversely affected. CQS bears no responsibility for your investment research and/or investment decisions and you should consult your own lawyer, accountant, tax adviser or other professional adviser before entering into any Transaction. CQS is not liable for any decisions made or action taken by you or others based on the contents of this document and neither CQS nor any of its directors, offi cers, employees or representatives (including affi liates) accept any liability whatsoever for any errors and/or omissions or for any direct, indirect, special, incidental or consequential loss, damages or expenses of any kind howsoever arising from the use of, or reliance on, any information contained herein.
Information contained in this document should not be viewed as indicative of future results as past performance of any Transaction is not indicative of future results. The value of investments can go down as well as up. Certain assumptions and forward looking statements may have been made either for modelling purposes, to simplify the presentation and/or the calculation of any projections or estimates contained herein and CQS does not represent that any such assumptions or statements will refl ect actual future events or that all assumptions have been considered or stated. Accordingly, there can be no assurance that estimated returns or projections will be realized or that actual returns or performance results will not materially differ from those estimated herein. Some of the information contained in this document may be aggregated data of transactions executed by CQS that has been compiled so as not to identify the underlying transactions of any particular customer.
Any indices included in this document are included to simply show the general market trends relative to the types of investments CQS tends to select for certain funds managed or advised by CQS (“CQS Funds”) for the periods indicated within this document. The indices are not representative of CQS Funds in terms of either composition or risk (including volatility and other risk related factors). CQS Funds are not managed to a specifi c index. This document is not intended for distribution to, or use by, the public or any person or entity in any jurisdiction where such use is prohibited by law or regulation. In accepting receipt of this information, you represent and warrant that you have not been solicited, directly or indirectly, by CQS and are receiving this information at your own request. It is your responsibility to inform yourself of and to observe all applicable laws and regulations of any relevant jurisdiction.
The information contained herein is confi dential and may be legally privileged and is intended for the exclusive use of the intended recipient(s) to which the document has been provided. In accepting receipt of the information transmitted you agree that you and/or your affi liates, partners, directors, offi cers and employees, as applicable, will keep all information strictly confi dential. Any review, retransmission, dissemination or other use of, or taking of any action in reliance upon, this information is prohibited. Any distribution or reproduction of this document is not authorized and prohibited without the express written consent of CQS, or any of its affi liates.
AIFMD and Distribution in the European Economic Area: The Alternative Investment Fund Managers Directive (Directive (2011/61/EU)) (‘AIFMD’) is a regulatory regime which came into full effect on 22nd July 2014. CQS (UK) LLP is an Alternative Investment Fund Manager (an ‘AIFM’) to certain CQS Funds (each an ‘AIF’). The AIFM is required to make available to investors certain prescribed information prior to investing in an AIF. The majority of the prescribed information is contained in the latest Offering Document of the AIF. The remainder of the prescribed information is contained in the relevant AIF’s pre-investment disclosure document, the monthly investor report, and the fund limits document. All of this information is made available in accordance with the AIFMD.
In relation to each member state of the EEA (each a “Member State”) which has implemented the AIFMD (and for which transitional arrangements are not/no longer available), this document may only be distributed and shares in a CQS Fund (“Shares”) may only be offered or placed in a Member State to the extent that: (1) the CQS Fund is permitted to be marketed to professional investors in the relevant Member State in accordance with AIFMD (as implemented into the local law/regulation of the relevant Member State); or (2) this document may otherwise be lawfully distributed and the Shares may otherwise be lawfully offered or placed in that Member State (including at the initiative of the investor).
In relation to each Member State of the EEA which, at the date of this document, has not implemented the AIFMD, this document may only be distributed and Shares may only be offered or placed to the extent that this document may be lawfully distributed and the Shares may lawfully be offered or placed in that Member State (including at the initiative of the investor).

14
Contact Information
CQS (UK) LLPCQS Investment Management Limited4th Floor, One StrandLondon WC2N 5HRUnited Kingdom
Tel: +44 (0) 20 7201 6900Fax: +44 (0) 20 7201 1200
CQS (Hong Kong) LimitedUnit 1207, 12th FloorNo.9 Queen’s Road CentralHong KongChina
Tel: +852 3920 8600Fax: +852 2521 3189
CQS (US), LLC152 West 57th Street40th Floor, New YorkNY 10019United States
Tel: +1 212 259 2900Fax: +1 212 259 2699
CQS Investment Management (Australia) Pty LimitedSuite 9.02, 50 Pitt StreetSydneyNSW, 2000Australia
Tel: +61 2 8294 4180
Information Required, to the extent applicable, for Distribution of Foreign Collective Investment Schemes to Qualifi ed Investors in Switzerland: The representative in Switzerland is ARM Swiss Representatives SA, Route de Cité-Ouest 2, 1196 Gland, Switzerland. The distribution of shares of the relevant CQS Fund in Switzerland will be exclusively made to, and directed at, qualifi ed investors (the “Qualifi ed Investors”), as defi ned in the Swiss Collective Investment Schemes Act of 23 June 2006, as amended (“CISA”) and its implementing ordinance (the “Swiss Distribution Rules”). Accordingly, the relevant CQS Fund has not been and will not be registered with the Swiss Financial Market Supervisory Authority (“FINMA”).The representative in Switzerland is ARM Swiss Representatives SA, Route de Cité-Ouest 2, 1196 Gland, Switzerland. The paying agent in Switzerland is Banque Cantonale de Genève, 17, quai de l’Ile, 1204 Geneva, Switzerland. The relevant Offering Document and all other documents used for marketing purposes, including the annual and semi-annual report, if any, can be obtained free of charge from the representative in Switzerland. The place of performance and jurisdiction is the registered offi ce of the representative in Switzerland with regards to the Shares distributed in and from Switzerland. CQS (UK) LLP (as the distributor in Switzerland) and its agents do not pay any retrocessions to third parties in relation to the distribution of the Shares of the CQS Fund in or from Switzerland. CQS (UK) LLP (as the distributor in Switzerland) and its agents do not pay any rebates aiming at reducing fees and expenses paid by the CQS Fund and incurred by the investors.
Index Descriptors: The BofA Merrill Lynch US High Yield Index (H0A0: The BofA Merrill Lynch US High Yield Index tracks the performance of U.S. dollar denominated below investment grade corporate debt publicly issued in the U.S. domestic market. Qualifying securities must have a below investment grade rating (based on an average of Moody’s, S&P and Fitch) and an investment grade rated country of risk (based on an average of Moody’s, S&P and Fitch foreign currency long term sovereign debt ratings). In addition, qualifying securities must have at least one year remaining term to fi nal maturity, a fi xed coupon schedule and a minimum amount outstanding of $100 million. Original issue zero coupon bonds, “global” securities (debt issued simultaneously in the eurobond and U.S. domestic bond markets), 144a securities and pay-in-kind securities, including toggle notes, qualify for inclusion in the Index. Callable perpetual securities qualify provided they are at least one year from the fi rst call date. Fixed-to-fl oating rate securities also qualify provided they are callable within the fi xed rate period and are at least one year from the last call prior to the date the bond transitions from a fi xed to a fl oating rate security. DRD-eligible and defaulted securities are excluded from the Index.
The BofA Merrill Lynch Euro High Yield Index (HE00) : The BofA Merrill Lynch Euro High Yield Index tracks the performance of EUR denominated below investment grade corporate debt publicly issued in the euro domestic or eurobond markets. Qualifying securities must have a below investment grade rating (based on an average of Moody’s, S&P and Fitch) and at least 18 months to fi nal maturity at the time of issuance. In addition, qualifying securities must have at least one year remaining term to maturity, a fi xed coupon schedule and a minimum amount outstanding of EUR 100 million. Original issue zero coupon bonds, “global” securities (debt issued simultaneously in the eurobond and euro domestic markets), 144a securities and pay-in-kind securities, including toggle notes, qualify for inclusion in the Index. Callable perpetual securities qualify provided they are at least one year from the fi rst call date. Fixed-to-fl oating rate securities also qualify provided they are callable within the fi xed rate period and are at least one year from the last call prior to the date the bond transitions from a fi xed to a fl oating rate security. Contingent capital securities (“cocos”) are excluded, but capital securities where conversion can be mandated by a regulatory authority, but which have no specifi ed trigger, are included. Other hybrid capital securities, such as those issues that potentially convert into preference shares, those with both cumulative and non-cumulative coupon deferral provisions, and those with alternative coupon satisfaction mechanisms, are also included in the index. Securities in legal default, equity-linked and euro legacy currency securities are excluded from the Index. Securities issued or marketed primarily to retail investors do not qualify for inclusion in the index. Index constituents are capitalization-weighted based on their current amount outstanding times the market price plus accrued interest. Accrued interest is calculated assuming next-day settlement. Cash fl ows from bond payments that are received during the month are retained in the index until the end of the month and then are removed as part of the rebalancing. Cash does not earn any reinvestment income while it is held in the index. Information concerning constituent bond prices, timing and conventions is provided in the BofA Merrill Lynch Bond Index Guide, which can be accessed on Bloomberg (IND2[go], 4[go]), or by sending a request to [email protected]. The index is rebalanced on the last calendar day of the month, based on information available up to and including the third business day before the last business day of the month. No changes are made to constituent holdings other than on month end rebalancing dates.
Europe: MarketAxess Bid-Ask Spread Index (BASI) Developed by MarketAxess Research, the MarketAxess BASI demonstrates the relationship between overall market liquidity and transaction costs by tracking the spread differential between buy and sell trades of the most actively traded corporate bonds. The U.S. index is calculated daily using executed trade data from publicly-disseminated FINRA TRACE data and also incorporates trade data from the MarketAxess trading system. The European index is calculated using quoted price information available through Trax’s end-of-day pricing feed, Trax Pricing. The quoted prices from Trax Pricing are also enriched with traded prices as a means of validating the data.
The S&P/LSTA Index tracks the 100 largest loans in the S&P Global Leveraged Loan Index, using market bids from third-party providers. LCD’s European Leveraged Loan Index (the ELLI) is a gauge to track performance of the asset class in the European market.
The Barclays US Corporate High Yield Bond Index measures the USD-denominated, high yield, fi xed-rate corporate bond market. Securities are classifi ed as high yield if the middle rating of Moody’s, Fitch and S&P is Ba1/BB+/BB+ or below. Bonds from issuers with an emerging markets country of risk, based on Barclays EM country defi nition, are excluded. The US Corporate High Yield Index is a component of the US Universal and Global High Yield Indices. The index was created in 1986, with history backfi lled to July 1, 1983.