cpsc 599.29/601.28 information visualization basics
TRANSCRIPT

1
CPSC 599.29/601.28Information Visualization Basics
Sheelagh Carpendale
Overview for today
• course structure• introductions• discussion - definition of information
visualization• course outline

2
CPSC 599.28/601.28: course structure• Details
when: Tuesday & Thursday 9:30 am to 10:45 amplace: MS680Aformat: seminar
• Evaluationclass work 25%Assignment #1 15%Assignment #1 20%Assignment #1 40%For grad students only:
above reduced to 80% plus topic paper 20%
• Contact [email protected] MS680J or iLab MS680
• Office hoursTuesday and Thursday 3:30 to 4:30by email any timeby appointment: email or phone to arrange onedrop in for urgent requests (but no guarantees!)
In class exercisesPurpose:• develop representation mapping skills • create and recognize useful information
visualizations
Evaluation:• 5 of these exercises worth 5% each for a total of
25% of your course mark.• Each exercise will have 2 parts.
– Part 1 (innovation part): worth 2% each (total 10% for all 5 of these in the term)
– Part 2 (review skills, the ‘crit’): worth 3% each (total 15% for all 5 of these in the term)

3
In class exercisesStructure: • Part 1 (innovation part):
– creation in class of a visual representation of small data set – full marks will be awarded for doing this exercise – encourage creation, innovation, risk taking – ‘just do it’– sketches will be handed in at the end of class and
photographed to create a record– like a quiz in that you must be present and take part – not like a quiz in that you do not have to memorize facts
• Part 2 (review skills, the ‘crit’): – short 1 to max 2 page review a sketch that is not your own– hand in at the beginning of the next class– sometimes using specific criteria that have been taught in
class– for all you will discuss both the positive and negative
aspects of the sketch and make suggestions for improvements
Assignments• Assignment #1
• Nested hierarchical diagrams
• Assignment #2• Navigating, interaction with large 2D spaces.• Built on top of Assignment #1
• Assignment #3• You will be given access to data and asked to create an
interactive information visualization.
Language: Processing• Introduction tutorial Tuesday Jan 22nd in class• open source programming language• Web site: http://processing.org/• Book: http://www.oreilly.com/catalog/9780596514556/toc.html

4
Why do Information Visualization?
Mis-interpretation is common

5
Anscombe’s Quartet
N: 11.0mean X’s : 9.0mean Y’s : 7.5standard error of slope estimate: 0.1sum of squares: 110.0regression sum of squares: 27.5residual sum of squares of Y: 13.8correlation coefficient: 0.8r squared: 0.7regression line: Y=3+0.5X
John Snow 1854• Discovered
cause of a cholera epidemic through visualizing the data in conjunction with a map
Map 1. Published by C.F. Cheffins, Lith, Southhampton Buildings, London, England, 1854 in Snow, John. On the Mode of Communication of Cholera, 2nd Ed, John Churchill, New Burlington Street, London, England, 1855

6
Florence Nightingale . Notes on Matters Affecting the Health, Efficiency and Hospital Administration of the British Army (1858)
Influencing Hospital Management
Florence Nightingale English nurse, 1858
Data Maps
C. J. Minard, French engineer, 1851Combined statistical diagrams and maps

7
Diagrams of Motion• Using white tape and black velvet,
Marey created time series images.• E. J. Marey, (1830 – 1904)
E.J. Marey, “Movement,” (London 1895), p.60 and 61. (Tufte, 1883, p.35-36)
Course outline• Week 1
• Tuesday: Introduction• Thursday: Exercise #1
• Week 2• Tuesday: Processing tutorial• Tuesday: Hand in Exercise #1 Crit• Tuesday: Hand out Assignment #1• Thursday: Introduction to navigation
• Week 3• Tuesday: Interaction, context, filtering• Thursday: Distortion / generalization
8
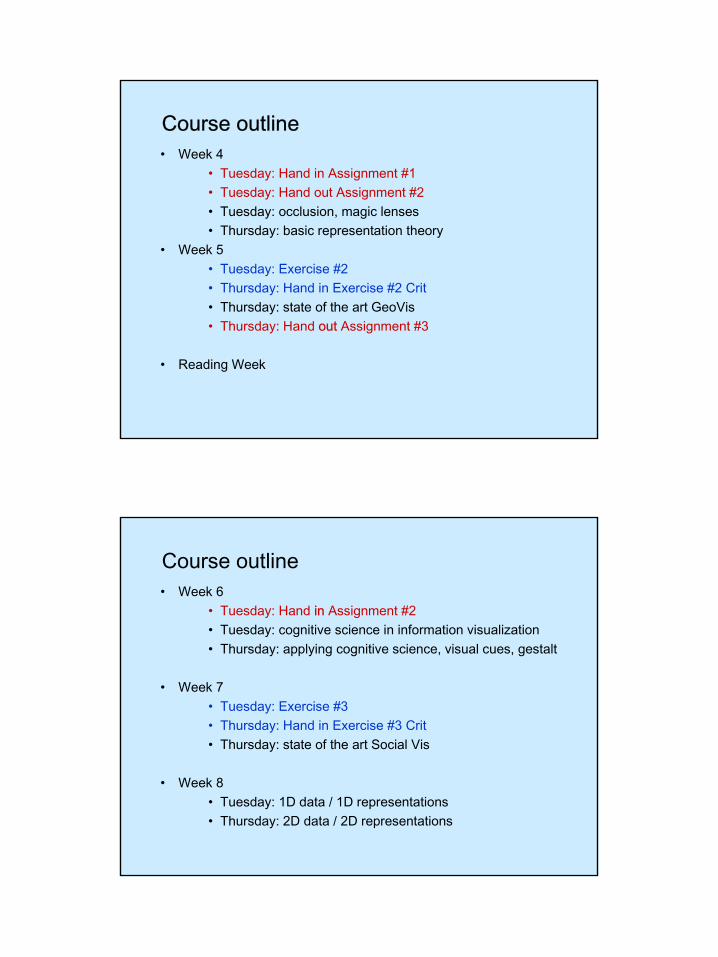
Course outline• Week 4
• Tuesday: Hand in Assignment #1• Tuesday: Hand out Assignment #2• Tuesday: occlusion, magic lenses• Thursday: basic representation theory
• Week 5• Tuesday: Exercise #2 • Thursday: Hand in Exercise #2 Crit• Thursday: state of the art GeoVis• Thursday: Hand out Assignment #3
• Reading Week
Course outline• Week 6
• Tuesday: Hand in Assignment #2• Tuesday: cognitive science in information visualization• Thursday: applying cognitive science, visual cues, gestalt
• Week 7• Tuesday: Exercise #3 • Thursday: Hand in Exercise #3 Crit• Thursday: state of the art Social Vis
• Week 8• Tuesday: 1D data / 1D representations• Thursday: 2D data / 2D representations

9
Course outline• Week 9
• Tuesday: Exercise #4 • Thursday: Hand in Exercise #4 Crit• Thursday: state of the art Linguistic Vis
• Week 10• Tuesday: 3D data / 3D representations• Thursday: MD data / MD representations• Thursday: Hand in Grad Topic Papers
• Week 11• Tuesday: grad topic presentations • Thursday: grad topic presentations
Course outline• Week 12
• Tuesday: TBA (visualizing uncertainty)• Thursday: TBA (evaluation)
• Week 13• Tuesday: Exercise #5 • Thursday: Hand in Exercise #5 Crit• Thursday: state of the art BioVis Vis
• To schedule before April 28th• Presentation and demos of Assignment #3
10
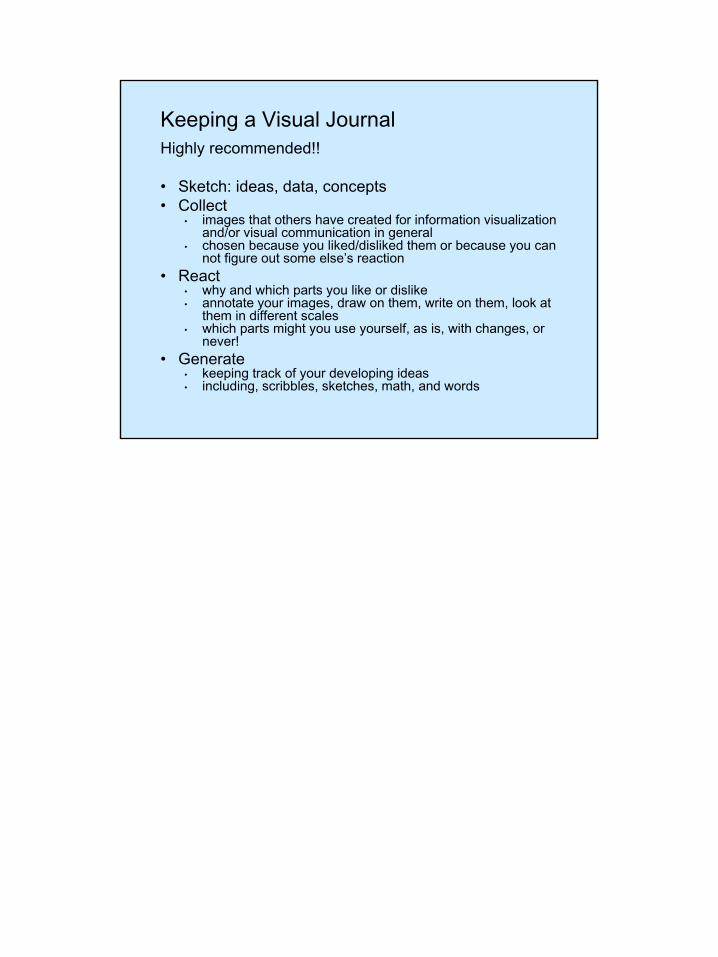
Keeping a Visual JournalHighly recommended!!
• Sketch: ideas, data, concepts• Collect
• images that others have created for information visualization and/or visual communication in general
• chosen because you liked/disliked them or because you can not figure out some else’s reaction
• React• why and which parts you like or dislike• annotate your images, draw on them, write on them, look at
them in different scales• which parts might you use yourself, as is, with changes, or
never!• Generate
• keeping track of your developing ideas• including, scribbles, sketches, math, and words