cpsc 335 geometric data structures in computer modeling and gis dr. marina l. gavrilova assistant...
Post on 19-Dec-2015
214 views
TRANSCRIPT
CPSC 335 Geometric Data Structures in Computer Modeling and GIS
Dr. Marina L. GavrilovaDr. Marina L. Gavrilova
Assistant ProfessorAssistant Professor
Dept of Comp. Science, University of Calgary,Dept of Comp. Science, University of Calgary,
AB, Canada, T2N1N4AB, Canada, T2N1N4
Topics
Survey of applications of computational geometry to modeling and simulation of natural processes and GIS
Brief introduction to Voronoi diagrams, ROAM and progressive meshes
Application to terrain modeling Application to image processing and
visualization

Computational geometry
Originated in 1960 with invention of computers
Describes algorithms and data structures for solving geometric problems with the use of computational methods
Confirmed by practical implementation of methods

Areas of applicability
A spectrum of computational geometry applications:
Biology Molecular dynamics GIS (Geographical
Information Systems) Physics Mechanics Chemistry
The Monter Carlo model of a lipid bilayer in water, 8666 atoms
Problems in CG
Problems that are addressed include: computing properties of particles arrangements, such as their
volume and topology, in a general d-dimensional space testing intersections and collisions between particles finding offset surfaces (related to questions of accessibility of
subregions) Solving nearest-neighbours problems Predicting time of the next collision between particles undergoing
continuous motion Updating data structures accurately and efficiently Visualizing algorithms for rendering models
Subjects of study in CG
Spatial objects: lines, polygons, planes Operations: stored, displayed,
manipulated, queried Methods: querying algorithms,
optimization algorithms, visualization methods
Topological relationships
Adjacent Overlapping Disjoined Inclusion Neighbor Closest neighbor

Long ago…
Jorge Luis Borges:
"Map of a region was a size of a city,
Map of an Empire was a size of a Province"
Now…
Digital maps of geographical objects: spatial, or geometric attribute (shape,
location, orientation, size) in 2D or 3D non-spatial attribute (descriptive)

Digital maps
Geographical object: spatial, or geometric attribute (shape,
location, orientation, size) in 2D or 3D non-spatial attribute (descriptive): statistic,
population, force, velocity, etc.

What computer scientists are looking for:
Not only a goal, but a process itself! Data structure: both inherent and coherent
model properties, attributed geometric data structures Ex: Surface representation Algorithms: efficient, reliable, easy to update,
portable, easy to implement, possible to visualize

Commonly used data structures in GISSpace partitioning: Planar subdivisions (regular and irregular) Tree-based data structure (segment trees, k-d trees,
hierarchical octrees…) Voronoi diagrams Triangulations k cells
Voronoi diagram
Given a set of N sites (points) in the plane or a 3D space
Distance function d(x,P) between point x and site P is defined according to some metric
Voronoi region Vor(P) is the set of all points which are closer to P than to any other site
Voronoi diagram is the union of all Voronoi regions
Delaunay triangulation
Definition 3. A Delaunay triangulation (DT) is the straight-line dual of the Voronoi diagram obtained by joining all pairs of sites whose Voronoi regions share a common Voronoi edge [Delaunay 34].
Follows from the definition:
If two Voronoi regions Vor(P) and Vor(Q) share an edge, then sites P and Q are connected by an edge in the Delaunay triangulation
If a Voronoi vertex belongs to Vor(P), Vor(Q) and Vor(R), then DT contains a triangle (P,Q,R)
The generalized Delaunay tessellation (DT) is the data structure, dual to the generalized VD, containing proximity information for a set S.

VD and DT (for circles)
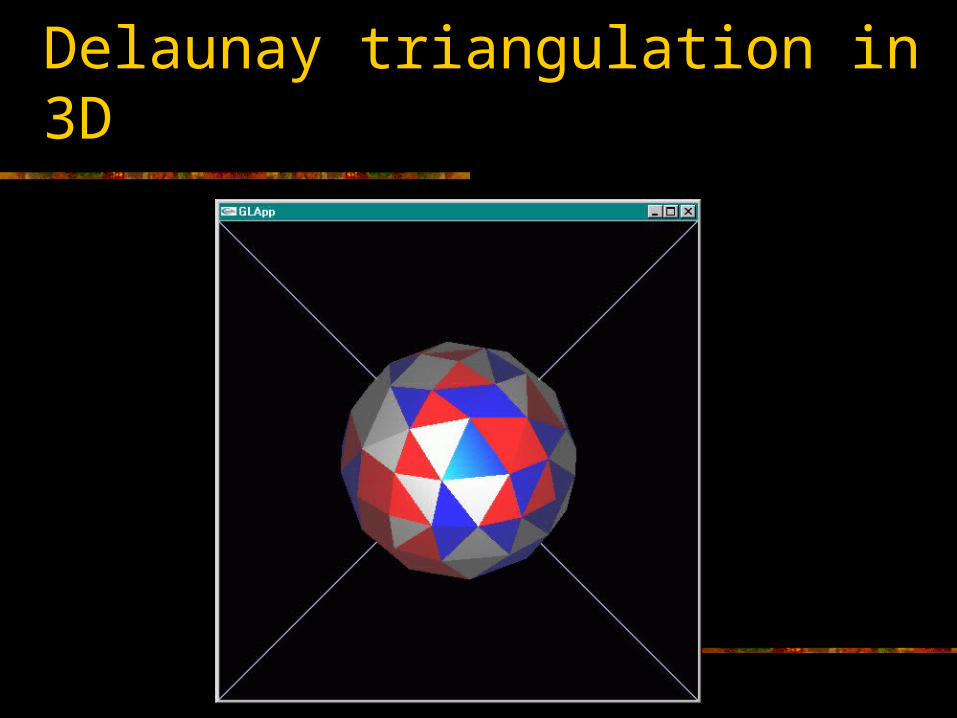
Delaunay triangulation in 3D

Delaunay triangulation in 3D, extra point
Distances
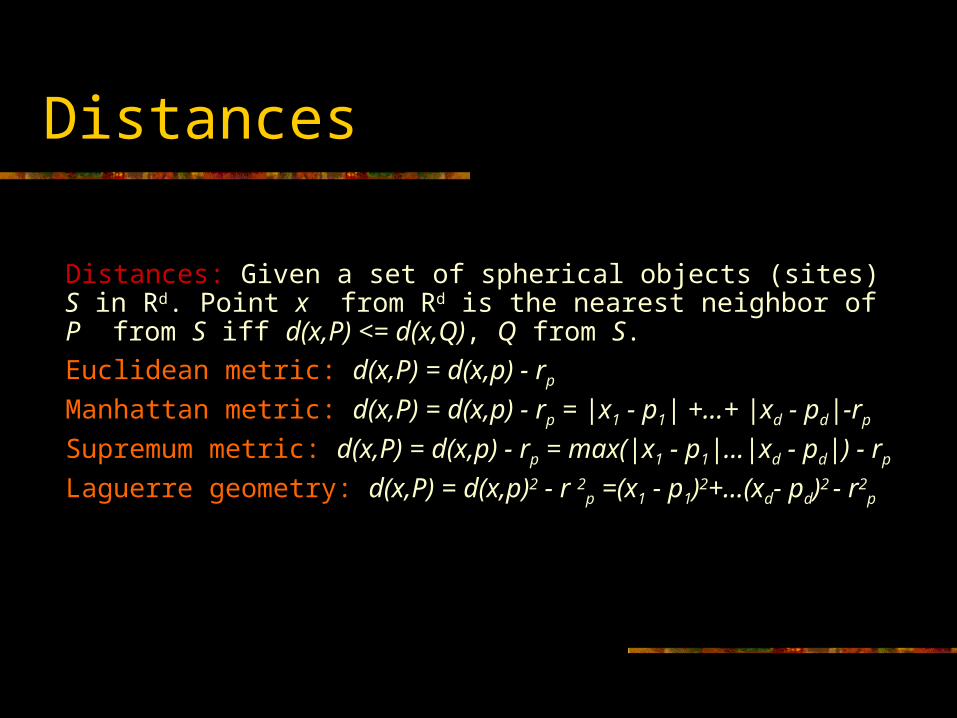
Distances: Given a set of spherical objects (sites) S in Rd. Point x from Rd is the nearest neighbor of P from S iff d(x,P) <= d(x,Q), Q from S.
Euclidean metric: d(x,P) = d(x,p) - rp
Manhattan metric: d(x,P) = d(x,p) - rp = |x1 - p1| +…+ |xd - pd|-rp
Supremum metric: d(x,P) = d(x,p) - rp = max(|x1 - p1|…|xd - pd|) - rp
Laguerre geometry: d(x,P) = d(x,p)2 - r 2p =(x1 - p1)2+…(xd- pd)2 - r2
p

Metric spaces in 2d
L1
L2 L

Power and Euclidean Voronoi diagrams – biological modeling
P Q
B(P,Q)
Euclidean bisectorPower bisector
Power diagram and Delaunay triangulation
P Q
B(P,Q)
Euclidean diagram and Delaunay triangulation

Manhattan and Supremum VD – city planning
Supremum bisectorsManhattan bisectors
Manhattan diagram and Delaunay triangulationSupremum diagram and Delaunay triangulation

Example of Supremum VD and DT
The supremum weighted Voronoi diagram (left) and the corresponding Delaunay triangulation (right) for 1000 randomly distributed sites .

Metric spaces are used:
In computer modeling For optimization For point patter analysis For autocorrelation analysis

3D Terrain Rendering
Involves transformation of GIS data sources into a 3D coherent system
Convert 2D map layers to 3D Using rendering methods to project the 3D
data back to 2D Manipulate Camera and animation
methods to obtain perspective view

Sourcing data from real world

DEM – Digital Elevation Models
Finite representation of an abstract modeled space.
Represent a function of 2D space: temperature, pressure, etc.
Exist in sampled points in space, other points obtained by interpolation.
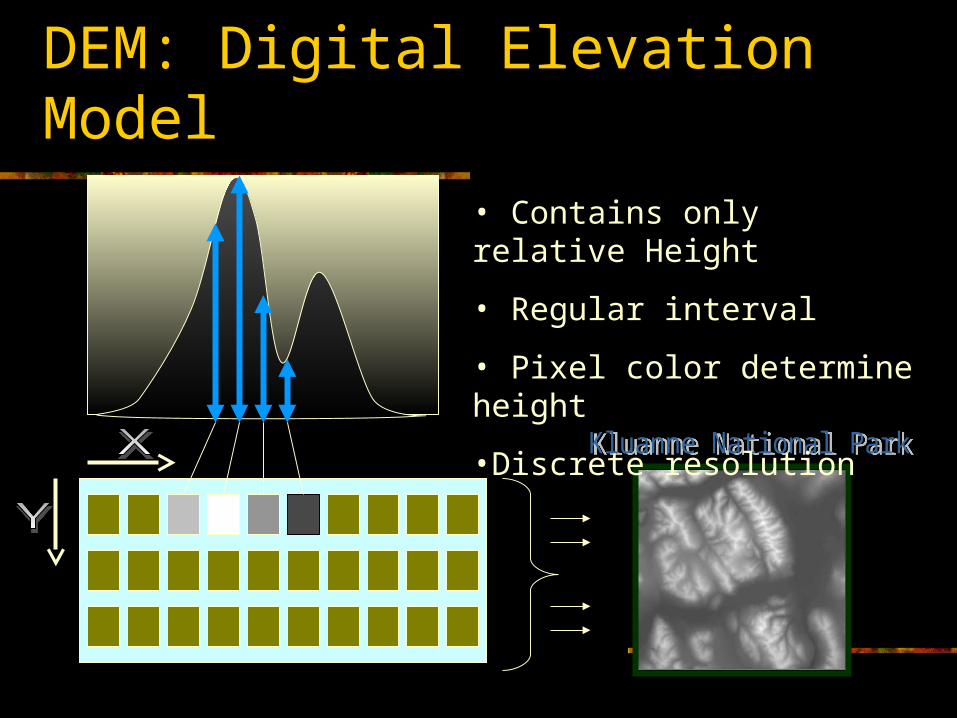
DEM: Digital Elevation Model
• Contains only relative Height
• Regular interval
• Pixel color determine height
•Discrete resolution

TIN – Triangulated Irregular Network
TIN is a triangular partitioning of space. Set of points P, edges V and triangles T is
stored in a “quad-edge” data structure.

Tessellation in terrain modeling
Tessellation is a cellular decomposition of the plane (space).

Non-Photo-Realistic Real-time 3D Terrain Rendering
• Uses DEM as input of the application
•Generates frame coherent animated view in real-time
•Uses texturing, shades, particles etc. for layer visualization

Real-time terrain rendering
Uses a graphics Engine/Library Central focus on efficient mesh
representation View coherence and frame rate constancy Limited/Variable Level of Detail Speed optimization Representing layer data as textures or
particles

Converting Height field data into 3D topological mesh
200 255 150 100
100 255 255 200
200 150 200 100
• Pixel value (z) is used as Height Map
• Vertices are generated as points in 3D
• A Mesh is triangulated

Mesh Representation
Goals:
Speed
Quality
Constancy
Representations:
Progressive Meshes
ROAM: Real-time Optimally Adapting Mesh

Progressive MeshesDeveloped by Hugues Hoppe, Microsoft Research Inc. Published first in SIGGRAPH 1996.
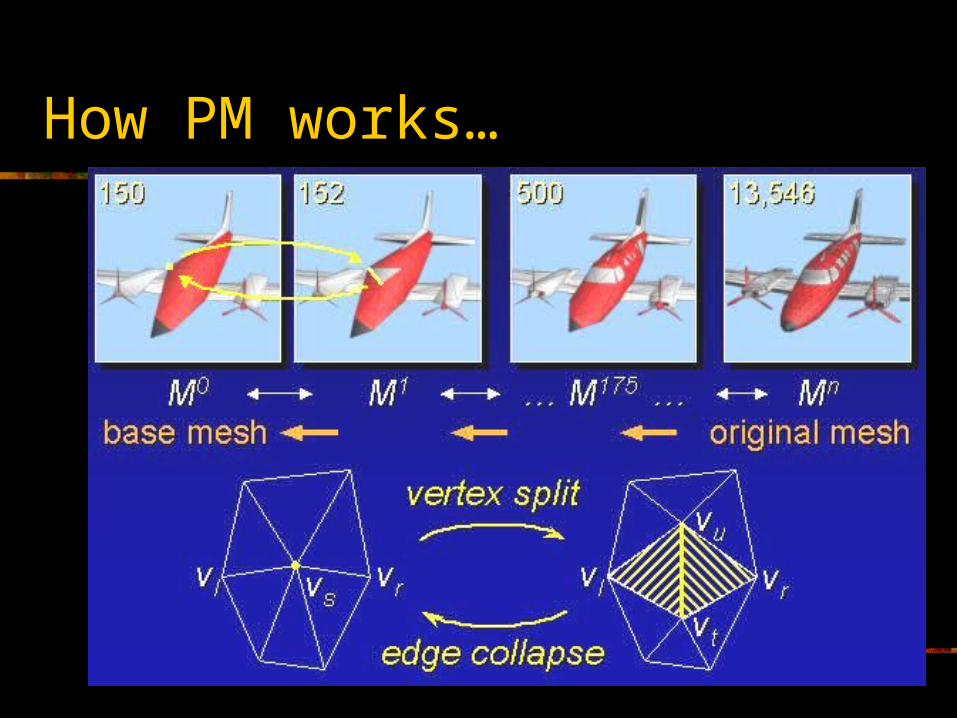
How PM works…

ROAM :•Can Subdivide when more details necessary
•Merge & Split Queue
•Tree Structured

Photo Realistic 3D Terrain

Conclusions
Computational geometry methods find a variety of applications in GIS and other areas: for underlying data structures, algorithm implementation, querying, visualization, statistical analysis and optimization.