cp's extended and long-lead forecasts and drought outlooks
TRANSCRIPT

U N I T E D S T A T E S D E P A R T M E N T O F C O M M E R C E
N A T I O N A L O C E A N I C A N D
A T M O S P H E R I C A D M I N I S T R A T I O N
CPC’s Extended & Long-Lead Forecasts and Drought Outlooks
David Miskus
Meteorologist & Drought POCNWS/NCEP/Climate Prediction Center
U.S. Drought Monitor Forum Desert Research Institute, Reno, NV
April 14-16, 2015

Climate Outlooks
Climate Predictions
Weather Forecasts
Warnings
Days
Hours
1 week
Minutes
2 weeks
Months
Seasons
Years Forecast Uncertainty
RECOVERY RESPONSE PREPARATION
Impact-Based Decision Support
Fore
cast
Lea
d T
ime
NWS_041
2
Climate/Weather
Linkage
CPC
TPCOPCHPC
SWPCAWCSPC
Click to edit Master title style
N A T I O N A L O C E A N I C A N D A T M O S P H E R I C A D M I N I S T R A T I O N
NOAA Seamless Suite of Forecast ProductsSpanning Climate and Weather
Service Center Perspective
CollaborativeForecasts
MDO & SDO

Outlook Variables Type Frequency Release Date and Time
Days 6-10; Days 8-14
Temp/Precip Probabilistic Daily Daily 3 PM ET
Monthly Temp/Precip Probabilistic 2x per month 3rd Thurs of month / Last day of month
8:30 AM, 3 PM ET
Seasonal Temp/Precip Probabilistic 1x per month 3rd Thursday of month
8:30 AM ET
Monthly drought
Drought tendency
Categorical 1x per month Last day of month 3 PM ET
Seasonaldrought
Drought tendency
Categorical 1x per month 3rd Thursday of month
8:30 AM ET
U.S. Hazards
Temps, precip, winds, etc.
Categorical Daily Monday - Friday 3 PM ET
Global Tropics
Precip, TCs, etc.
Categorical Weekly Tuesday or Wednesday
12 PM ET
CPC Outlook Overview* WPCs 7-Day QPF (Quantitative Precipitation Forecast) - Daily

Weather Prediction Center (WPC):
Quantitative Precipitation Outlooks, Days 1-7
MOS Mean (Maximum) Temperature Anomaly, Days 1-5
7-Day QPF
5-Day Max Temp Anomaly
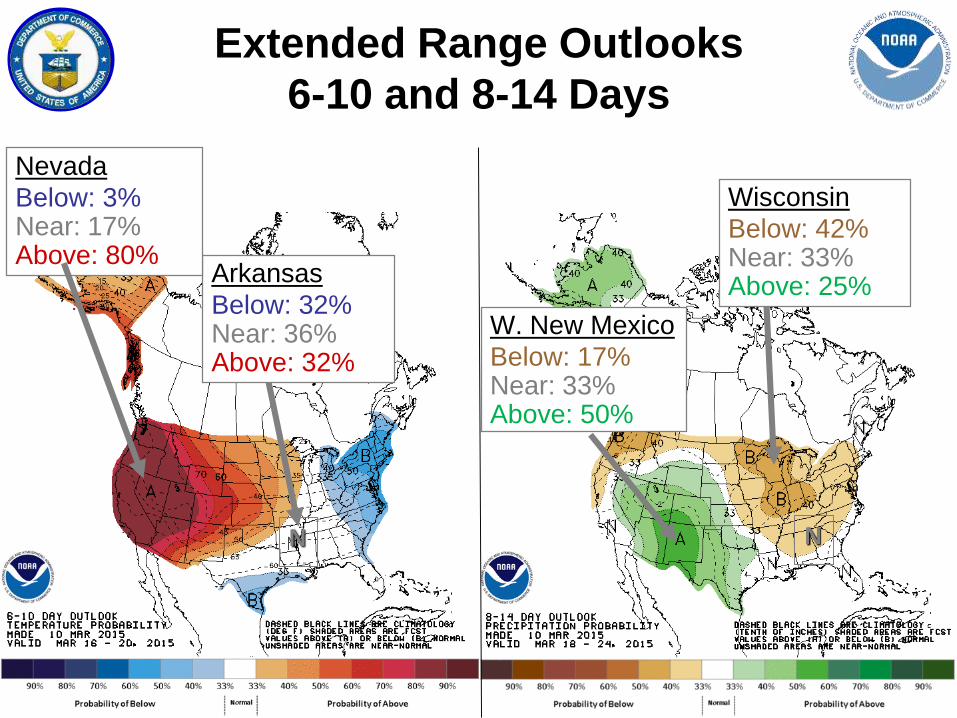
Extended Range Outlooks
6-10 and 8-14 Days
Arkansas
Below: 32%Near: 36%Above: 32%
N
Nevada
Below: 3%Near: 17%Above: 80%
Wisconsin
Below: 42%Near: 33%Above: 25%
N
W. New Mexico
Below: 17%Near: 33%Above: 50%

Extended Range Outlooks
6-10 and 8-14 Days

U.S. Hazards Outlook
• Both Days 3-7 and Days 8-14 maps produced;
• Hazards posted include those associated with temperature (much above/below, excessive heat), precipitation (heavy rain, heavy snow, ice, flooding), winds, waves, fire, severe weather and drought.
• Criteria for each hazard are specific in Station Duty Manual
• Collaborative effort with other NCEP Centers, RFCs, NWS Regions, WFOs.

U.S. Hazards Outlook
Probabilistic Framework• Probabilistic approach is being
pursued for each variable.
• Currently issuing temperature outlooks.
• Precipitation coming this year (planned).
• Future – winds, severe?

Excessive Heat: Experimental Week-2 excessive heat outlook being
developed by end of FY15 Q4. Experimental products not issued until Spring
2016. Targets combined temperature and humidity.
Upcoming Plans and Schedule
7/1/2014-7/3/2014
Excessive Heat (Heat Index > 105)
High Risk (60%)
Moderate Risk (40%)
Slight Risk (20%)

Planned: Week 3-4 Outlooks
• Work is currently ongoing in areas listed below:(1) Modification, enhancement and new development of empirical techniques (i.e.,
constructed analogue, regression, etc.) whose methodologies target MJO/ENSO,
trends and blocking
(2) Analysis of dynamical model guidance from a number of operational centers
including NCEP, ECMWF, JMA and Environment Canada
(3) Operational implementation at CPC of Coupled Linear Inverse Modeling (C-LIM)
techniques from ESRL
• Outlooks will need to capitalize on forecasts of opportunity
Week 3-4 Outlook
Precipitation Probability
Valid Dec. 16-29, 2014
Made: Dec. 1, 2014
Week 3-4 Outlook
Temperature Probability
Valid Dec. 16-29, 2014
Made: Dec. 1, 2014

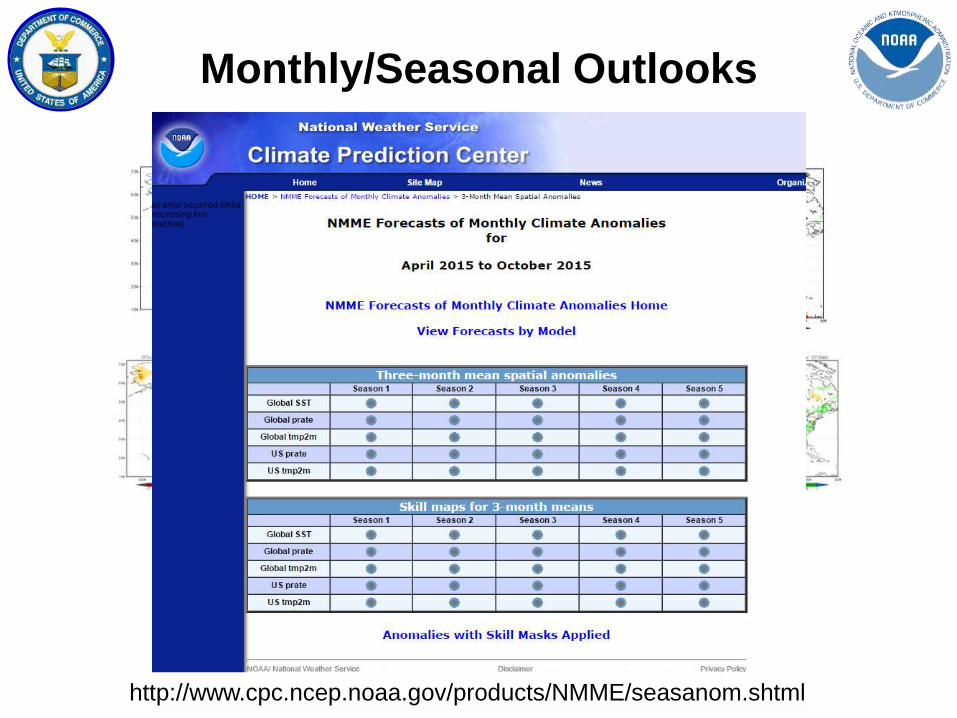
Monthly/Seasonal Outlooks
Anywhere w/o color
Below: 33%Near: 33%Above: 33%
S. Alaska
Below: 7%Near: 33%Above: 60%
S. Carolina
Below: 27%Near: 33%Above: 40%
N
W. Oregon
Below: 40%Near: 33%Above: 27%
Seasonal and Monthly – 3rd Thursday of the month
Monthly – Updated last day of month
Mean Temperature/Accumulated Precipitation

Monthly/Seasonal Outlooks
• Forecasters review tools and data.
• Collaboration meeting kicks off the process with each forecaster bringing his/her maps.
• Discussions about competing influences and data caveats.
– What patterns matter most?– Data issues for models and statistical tools
• Lead Forecaster will flesh out full map series (26) and write discussion.
• Other products L3MTO and POE come from core maps.
Monthly/Seasonal Outlooks
http://www.cpc.ncep.noaa.gov/products/NMME/seasanom.shtml


Drought Outlooks
Monthly
Seasonal
(created utilizing the aforementioned forecast tools & products)

US Drought Outlook History
• Originated in August 1999 (shortly after the US Drought Monitor became operational)—went public in March 2000;
• Intent is to present a simple national picture of where droughts will improve, persist, or develop;
• Issued SDOs continuously each month, with updates as required, by any of 5 CPC forecasters;
• Replaced updated SDO (released 1st Thursday of next month) with MDO (released last day of month) starting July 2013;
• Color-blind compliant colors started in Jan 2014, along with removal of arrows & text (cleaner);
• Scripting to automate basic DO creation & dissemination procedures starting late 2014 (more time for analysis);
• DO map formats changed to mimic DM map (early 2015);
• GIS overlay of DO input tools & forecasts – like DM (next);

Drought Outlook birth
Initial (Combined) DM & DO

19
OLDER
FORMAT

OLD
FORMAT


Seasonal Drought Outlook
2-Wk Soil Moisture
Constructed Analogue
Soil Model
Palmer 4-mo
Probabilities
CPC Seasonal
Outlook
NMME
Extended-Range
Forecasts
Climatology
Released 3rd
Thursday of
Month

Monthly Drought Outlook
Constructed Analogue
Soil Model
CPC Monthly
Outlook
Extended-Range
Forecasts
NMME
2-Wk Soil Moisture
7-Day QPF
Climatology
Released last
day of the Month

Climatology matters!!

AMJ’15 SDO (released Mar. 19)
Use the latest U.S. Drought Monitor
D0 & D1 shape file areas (& D2-D4)
Mar. 17, 2015 SDO
Start with 3/17/15 US Drought Monitor
25
From Tools - Determine if D1-D4 areas
will: Persist, , or be Removed;
and if D0 & normal areas will

From Tools - Determine if D1-D4 areas
will: Persist, , or be Removed;
and if D0 & normal areas will
DO needs to mimic the
GIS tool/product overlays
just like the DM.

DO Manual vs. Scripted: Workflow
S
S
S
S
S
S
S
S
Overlay Input Tools, Forecasts, and Products (like DM) for Analysis

How Are We Doing?

29Good Skill during developing La Nina & El Nino Mediocre Skill during ENSO Neutral & Summer

0%
10%
20%
30%
40%
50%
60%
70%
80%
90%
100%
Existing Drought Developing Drought
Seasonal D. O. Verification (% of Pixels Hit) - Existing & Developing Drought
La Nina La NinaEl NinoAlmost
La Nina
Almost
El Nino
Almost
La Nina
El Nino

5
10
15
20
25
30
35
40
45
50
55
60
65
70
75
80
85
RAW FCST SCORE SCORE FOR AN ALL PERSISTENCE FCST RAW FCST SCORE linear trend
Seasonal D.O. Verification Scores (% of Pixels Hit)
The “Waiting
Forever for
El Nino”

-40
-35
-30
-25
-20
-15
-10
-5
0
5
10
15
20
25
30
35
40Seasonal D. O. Skill (Forecast Score minus Persistence Score)
The “Waiting
Forever for
El Nino”

56.3
45.9
73.374.3
69.7
9.8
0
10
20
30
40
50
60
70
80
OFFICIAL OUTLOOK
Forecast of Persistence
Forecast of Improvement or Removal
Forecast of Persistence
Forecasts for ALL Existing
Drought Areas
Drought Development
Seasonal Drought Outlook: Median Percent of AreaSuccessfully Forecast -- DJF 2009/10 - NDJ 2014/15 Median


-20%
-10%
0%
10%
20%
30%
40%
50%
60%
70%
80%
90%
100%
Score Baseline Skill
Monthly Drought Outlook Verification Statistics -- (Score, Baseline [or persistence], and skill)
MDO: We have tended to over-forecast changes to drought.

Next Steps in Drought Forecasting
Short-Term:
Modify 3-Month Outlook Categories (Some Improvement Removal,
Improvement, or Persistence;
Produce a 1-Month Outlook (ag-related) that replaces Updated 3-
Month USDO;
Create and Post Public Documentation (internet) for the USDO;
Real-Time USDO Verification: Make more objective & automated;
Verification: Redefine Skill & Persistence scores;
GIS procedures to better automate USDO production procedures;
GIS procedures to overlay USDO tools and products – make more
objective & automated like USDM;
X
X
X
X
X

Next Steps in Drought Forecasting
Long-Term:
Develop a R2O plan for long-term improvement of USDO:
Improvement of Precipitation forecasts in the models is highest priority;
Integration of Temperature, Precipitation, & Soil Moisture Forecasts;
Engage the drought community for ideas on improving the USDO:
Comparison of the (subjective) USDO with objective ones, such as objective SPI or
one based upon the PDI;
Continuation of the current manual forecast, with the objective forecasts used as input and
run in parallel;
Customer preferences between objective versus subjective USDOs;
Develop an objective, probabilistic (or actual) USDO [Obstacles: time, $, personnel]
• Blending short-term forecasts with seasonal forecasts;
• Improving skill of forecasts (especially Precipitation) at all time ranges;
• Providing useful information for both the agricultural and hydrologic community;
• Automation of USDO production and verification;
Challenges:

38
Experimental Objective Forecasts for March 2015 (made around March 1)
ESP UW
MSUPrinceton-MSU-EMC
CPC SPI6
NASA

39
THANK YOU!
Any Questions, contact:
(301) 683-3453