cpm-200: principles of schedule management - nasa · cpm-200: principles of schedule management...
TRANSCRIPT

CPM-200: Principles of Schedule Management
Lesson C: Schedule Analysis Techniques
Instructor
Walt Majerowicz, PMP301-286-5622
1st Annual NASA Project Management ConferenceMarch 30-31, 2004
Professional Education Program (Training Track) presented byPMI-College of Performance Management faculty

Lesson Objectives
The student will understand:1. What is meant by Schedule Analysis.2. What insight Schedule Analysis can provide the
project team.3. Why Schedule Analysis is performed.4. What are some of the basic techniques for
performing Schedule Analysis

This Lesson Will Provide Insight Into:
Critical Path: schedule driver or long poleAccuracy: correct schedule inputs (activities, durations)Integration: properly defined interrelationshipsRealism: an achievable schedulePerformance: timely, efficient accomplishment of workVariances: significance of differences from baselineTrends: direction of the scheduleForecasting: predicting future schedule performanceWhat-If: impact of potential problems and changesRisk: likelihood of overrunning the scheduleResources: sufficient availability of staff, facilities, etc.

REV: Baseline 8/15/01
ID Activity Dur Early Start Early Finish Total Slack1 Authorize Funding 0 days 10/1/01 10/1/01 0 days
2 Procure VEIInstrument
220days
12/3/01 10/4/02 4 days
3 Procure SpacecraftBus
200days
10/8/01 7/12/02 59 days
4 Integrate RCI toSpacecraft
5 days 9/9/02 9/13/02 19 days
5 Develop RCIInstrument
240days
10/8/01 9/6/02 19 days
6 Integrate VEI toSpacecraft
5 days 10/7/02 10/11/02 4 days
7 ObservatoryTesting
120days
10/14/02 3/28/03 4 days
8 ScheduleContingency
60 days 3/29/03 5/27/03 6 days
9 Launch SiteOperations
60 days 5/28/03 7/26/03 6 days
10 Launch 0 days 8/1/03 8/1/03 0 days
S O N D J F M A M J J A S O N D J F M A M J J A2002 2003
Critical Pathas of
10/31/01
NBT Project Critical Path last month:– what’s the “long pole?”

REV: Baseline 8/15/01
ID Activity Dur Early Start Early Finish Total Slack1 Authorize Funding 0 days 10/1/01 10/1/01 0 days
2 Procure VEIInstrument
220days
11/12/01 9/13/02 19 days
3 Procure SpacecraftBus
200days
10/8/01 7/12/02 59 days
4 Integrate RCI toSpacecraft
5 days 11/14/02 11/20/02 -29 days
5 Develop RCIInstrument
288days
10/8/01 11/13/02 -29 days
6 Integrate VEI toSpacecraft
5 days 11/21/02 11/27/02 -29 days
7 ObservatoryTesting
120days
11/28/02 5/14/03 -29 days
8 ScheduleContingency
60 days 5/15/03 7/13/03 -41 days
9 Launch SiteOperations
60 days 7/14/03 9/11/03 -41 days
10 Launch 0 days 8/1/03 8/1/03 -41 days
S O N D J F M A M J J A S O N D J F M A M J J A S2002 2003
S/C Bus ison schedule
RCI deliverydelayed
8/1/03 launchthreatened
NegativeTotal Slack
VEI startedahead of schedule
NBT Project Critical Path this month:has it changed and why?

Schedule Accuracy:is the schedule data correct?
Schedule Accuracy- The primary data used to develop the schedule should be correct and based on reality
Activities capture the entire work scope Durations are realistic and feasible, not “success-oriented” or “fat”Assumptions and constraints are legitimate
Analysis Approach:Verification of activity traceability to project data (e.g. WBS, SOW)Comparison of current durations to baseline, prior period, “actuals” from similar projects or previous builds, BOEs, supplier lead times, etc.Verification of schedule assumptions with external agreements such as Memorandums Of Understanding, Letters Of Agreement, contracts & subcontracts, GFE lists, etc.

Horizontal Schedule Integration: is the logic right?NBT Mission
Total Program
3.0Instruments
2.0 Spacecraft
5.0 GroundData System
4.0 ScienceData System
8.0 FlightAssurance
12.0 ProjectManagement
7.0 Integ.& Test
9.0 Mission/Flight Ops
6.0 LaunchVehicle 10.0 Data
Specify Power Rqts.
S/ABuild Integ. S/As
to S/C
WBS
2.2.3 Solar Array Design
2.2.4 Solar Array Build
2.2.5 Solar Array Test
7.4.1.2. Integrate Solar Arrays to S/C
S/ATest
S/A Design
1.0 SystemEngineering
1.2.2.3 Power Reqt. Definition
Logic Network DiagramActivity 101
Activity 102 Activity 103
Activity 104
Activity 406

Master Schedule
Intermediate / Summary Schedule
Detail Schedule
Cost Account / Work Package Schedules
2000 2001 2002 2003 2004
J F M A M J J A S O N D J
Vertical Schedule Integration: is alignment correct?

NBT Project "Early Finish" Date Baseline Schedule Plan(As of:
10/15/94)
0
10
20
30
40
50
60
70
80
Oct
QU
AN
TITY
0
10
20
30
40
50
60
70
80
Oct '01 Nov '01 Dec '01 Jan '02 Feb '02 Mar '02 Apr '02 May '02 Jun '02 Jul '02 Aug '02 Sep '02 Oct '02 Nov '02
Early
or A
ctua
l Fin
ish
Dat
es
BASELINE Early Finish Dates
ACTUAL Finish Dates
FORECAST Early Finish Dates
“S” Curve’s slow start, gradual acceleration and leveling off is one
indicator of a realistic schedule
Schedule Realism:is the schedule achievable?
Oct '01 Nov '01 Dec '01 Jan '02 Feb '02 Mar '02 Apr '02 May '02 Jun '02 Jul '02 Aug '02 Sep '02 Oct '02 Nov '02CUM Baseline 1 2 3 6 11 22 32 45 53 59 62 65 70 72
CUM Actual
CUM Forecast

Schedule Performance: are activities being accomplished on time?
NBT Project Schedule Performance – as of May 30, 2002(As of:
10/15/94)
0
10
20
30
40
50
60
70
80
Oct
QU
AN
TITY
0
10
20
30
40
50
60
70
80
Oct '01 Nov '01 Dec '01 Jan '02 Feb '02 Mar '02 Apr '02 May '02 Jun '02 Jul '02 Aug '02 Sep '02 Oct '02 Nov '02
Early
or A
ctua
l Fin
ish
Dat
es
BASELINE Early Finish Dates
ACTUAL Finish Dates
ACTUAL
BASELINEPLAN
Oct '01 Nov '01 Dec '01 Jan '02 Feb '02 Mar '02 Apr '02 May '02 Jun '02 Jul '02 Aug '02 Sep '02 Oct '02 Nov '02CUM Baseline 1 2 3 6 11 22 32 45 53 59 62 65 70 72
CUM Actual 1 3 7 7 8 9 12 16

Schedule Performance:Ratio Analysis Example
Oct Nov Dec Jan Feb Mar Apr May Jun Jul Aug Sep Oct NovCUM Baseline 1 2 3 6 11 22 32 40 50 59 62 65 67 70CUM Actual 1 3 7 7 8 15 24 30
2001 2002ASTRO Project Software Module Code & Checkout Completion: As of 5/31/02
TO DATE30 modules ÷ 8 months = 3.75 (actual rate)40 modules ÷ 8 months = 5 (baseline rate)
3.75 ÷ 5 = 75% efficiency-to-date
0% 50% 100%More EfficientLess Efficient
To date, schedule efficiency is 75% - the ASTRO software development team is accomplishing, on average, 3/4 of what it planned to do.

NBT Project Schedule Performance - as of May 30, 2002
Oct '01 Nov '01 Dec '01 Jan '02 Feb '02 Mar '02 Apr '02 May '02 Jun '02 Jul '02 Aug '02 Sep '02 Oct '02 Nov '02CUM Baseline 1 2 3 6 11 22 32 45 53 59 62 65 70 72
CUM Actual 1 3 7 7 8 9 12 16
CUM Forecast 23 30 40 57 66 72
(As of:
10/15/94)
0
10
20
30
40
50
60
70
80
Oct
QU
AN
TITY
0
10
20
30
40
50
60
70
80
Oct '01 Nov '01 Dec '01 Jan '02 Feb '02 Mar '02 Apr '02 May '02 Jun '02 Jul '02 Aug '02 Sep '02 Oct '02 Nov '02
Early
or A
ctua
l Fin
ish
Dat
es
BASELINE Early Finish Dates
ACTUAL Finish Dates
FORECAST Early Finish Dates
FORECASTACTUAL
BASELINEPLAN
Plan vs.Actual
Variance
Plan vs.ForecastVariance
Schedule Variances:are differences from the baseline significant?

WBS: 1.1.2 C&DH Subsystem
1.1.2.2 RTT “B” Assembly
MILESTONE: CDH6022 RTT “B” Ready for Observatory Integration & Test
BASELINE: 5/28/02
FORECAST: 6/7/02
CAUSE & CORRECTIVE ACTION:
•Memory anomaly during final test caused a 10 day slip in delivery to I&T, putting the RTT B on the critical path at -5 days total slack.
•A 2nd shift will be added to finish testing.
•I&T Manager can modify I&T work flow to accommodate this delay if necessary.
Example Variance Analysis Report

Schedule Trends:is the schedule’s direction favorable or unfavorable?
Schedule Trend(s):Indicate the schedule’s future direction based on historical resultsProvide a means to indicate the extent to which actual and predicted performance are diverging from the baseline schedule
Analysis Approach:Performance trends: track actual completion of activities and milestones over time to determine if progress is being madeSlack trends: track slack depletion over time to assess if sufficient spare time is available or if resources should be reallocatedReserve trends: track reserve consumption over time to determine if it is still sufficientDelivery trends: track projected delivery dates over time to extent of delays or slippages

SEM FM6Instrument Delivery vs. I&T Need
May-99
Jul-99
Aug-99
Oct-99
Dec-99
Mar-00
May-00
Jul-00
Aug-00
Oct-00
Dec-00
Mar-01
May-01
Jul-01
Sep-01
Nov-01
Jan-02
Contra
ctDec
-98Ja
n-99
Feb-99
Mar-99
Apr-99
May-99
Jun-9
9Ju
l-99
Aug-99
Sep-00
Oct-99
Nov-99
Dec-99
Jan-0
0Feb
-00Mar-
00Apr-
00May
-00Ju
n-00
Jul-0
0Aug
-00Sep
-00Oct-
00Nov
-00Dec
-00Ja
n-01
Feb-01
Mar-01
Status Date
Early
Fin
ish
Del
iver
y an
d N
eed
Dat
es
SEM FM6 DeliveryI&T NeedContract Delivery
Planned Use
MetOp-26/21/01
12/31/99
12/1/01
Delivery Date Trend vs. Need Date Trend

Example Slack Trend With Risk Thresholds
WBS 1.1.2.2 RTT B Assembly Risk Indicator
-10
-5
0
5
10
15
20
25
30
35
Jul ‘
01
Aug
’01
Sep
‘01
Oct
‘01
Nov
‘01
Dec
‘01
Jan
‘02
Feb
‘02
Mar
‘02
Apr
‘02
May
’02
Jun
‘02
Jul ‘
02
Aug
‘02
Status Date
Day
s To
tal S
lack
Replacecracked
DRX-002
Test chamberavailability delay
Troubleshootnoise anomaly
AlertZone 1
AlertZone 2
AlertZone 3

NBT Project Schedule Reserve Consumption TrendAs of: March 31, 2001
0102030405060708090
100110120
1Q '002Q '00
3Q '004Q '00
1Q '012Q '01
3Q '014Q '01
1Q '022Q '02
3Q '024Q '02
TimeNow
Day
s of
Sch
edul
e R
eser
ve
Days Reserve
Target Threshold
ProjectStart
ProjectFinish
Example Schedule Reserve Trend

Risk-Based Schedule Reserve Determination ExampleExpected Value
of ReserveProbabilityActivity Risk Impact
ObservatoryMechanicalIntegration
ObservatoryMechanicalIntegration
Late MGSE =x30 days .10 3 days
ObservatoryVibration
Test
ObservatoryVibration
TestComponent
damage=x45 days .20 9 days
ObservatoryEMI Test
ObservatoryEMI Test
Noise anomaly =x40 days .60 24 days
ThermalVacuum
Test
ThermalVacuum
Test
Instrument failure
=x80 days .50 40 days
76 daysStarting Point for Reserve Determination

NBT Project Schedule Performance – as of May 30, 2002
Oct '01 Nov '01 Dec '01 Jan '02 Feb '02 Mar '02 Apr '02 May '02 Jun '02 Jul '02 Aug '02 Sep '02 Oct '02 Nov '02CUM Baseline 1 2 3 6 11 22 32 45 53 59 62 65 70 72
CUM Actual 1 3 7 7 8 9 12 16
CUM Forecast 23 30 40 57 66 72
(As of:
10/15/94)
0
10
20
30
40
50
60
70
80
QU
AN
TITY
0
10
20
30
40
50
60
70
80
Oct '01 Nov '01 Dec '01 Jan '02 Feb '02Mar '02 Apr '02 May'02
Jun '02 Jul '02 Aug'02
Sep '02 Oct '02 Nov '02
Early
or A
ctua
l Fin
ish
Dat
es
BASELINE EF Dates
ACTUAL Finish Dates
FORECAST EF Dates
Linear Projection
Linear Projection
FORECAST
ACTUAL
BASELINEPLAN
Schedule Forecasting:what is the predicted future schedule performance?

Projection Based on Efficiency-To-Date
Oct Nov Dec Jan Feb Mar Apr May Jun Jul Aug Sep Oct NovCUM Baseline 1 2 3 6 11 22 32 40 50 59 62 65 67 70CUM Actual 1 3 7 7 8 15 24 30CUM Forecast 37 46 52 60 66 70
2001 2002
ASTRO Project Software Module Code & Checkout Completion: As of 5/31/02
TO DATE30 modules ÷ 8 months = 3.75 (actual rate)40 modules ÷ 8 months = 5 (baseline rate)
3.75 ÷ 5 = 75% efficiency-to-date
0% 50% 100%More EfficientLess Efficient
TO GOActual rate to date = 3.75 modules
40 modules ÷ 6 months = 6.7 (forecast rate)6.7 ÷ 3.75 = 178% efficiency-to-complete !
To date, schedule efficiency is 75%. To go, the forecast-to-complete efficiency of 178% is probably unrealistic - unless something has changed (e.g. new technical approach, add more programmers, descope work, etc.)

“What-If” Schedule Analysis:how will changes affect the schedule?
“What-If” ScheduleProjects the effect on the baseline or current operating schedule of a potential problem, new constraint, or changed assumptionProvides the project team with insight into the impact of potential changes on the project’s schedule objectives
Analysis ApproachDevelop a “What-If” schedule by modifying the baseline and/or current operating schedule to reflect a desired schedule changeExamples:- Change a key assumption - Funding shortfalls - Late parts or GFE delivery - Staffing shortages- Descope of work

NOAA-M
NOAA-N
NOAA-N'
Call - Up
2
LEO
PLD
8/6
Titan II Closure
9/30
Launch
3/30
Projected End-Of-Contract
3/15
End of Contract
11/5Call-Up
WTR
B152
B158
Prep
Pre-Vib
Vib/Acou
Post Vib
us
SEPET
2
Instr
4
EMI LEO
LRD
4/17
Contract Storage
6/14
Need
8/6
Avail
1/31
PLD
6/30
Storage
12/4
Launch
6/30
1 Call-upTB/TV 3
WTR
Bus
B152
B158
DR
Pre-Vib
Pre-Vib
Vib/Acou
Post Vib
Bus
SEPET
Instr
EMInteg
LRD
2/25756 8
Contract Storage
4/18
Need/Avail
6/30
Storage
8/28
9
TV
3
NOAA-N' Planned Launch isMarch 2008.
O N D J F M A M J J A S O N D J F M A M J J A S O N D J F M A M J J A S O N D J F M A M J J A2001 2002 2003 2004
Foot Notes:1. A303 Removal; Installation of Mass Models*2. A303 Re-Integration & IPF/DET*3. SEM & SBUV* Removal4. SEM & SBUV* Re-Integration
5. SARR Delivery 6/15/016. A303 Installation on N’ 5/13/017. SBUV Delivery 7/6/018. SARP/ADCS Delivery 4/30/029. SARP & ADCS Integration*
“What-If” thelaunch was delayed
to 6/30/02?
NOAA M-N’ I&T Summary Schedule As of 3/31/01(Based on Preliminary LMMS Rev S Schedule)
* = Not yet in LMMS Master Schedule

NOAA-M
NOAA-N
NOAA-N'
Call - Up LEO
PLD
8/6
Titan II Closure
9/30
Launch
6/30
Projected End-Of-Contract
4/23
End of Contract
11/5Call-Up
WTR
B152
B158
Prep
Pre-Vib
Vib/Acou
Post VibSEPET
2
Instr
4
EMI LEO
LRD
6/9
Contract Storage
6/14
Need
8/6
Avail
1/31
PLD
6/30
Storage
1/26
Launch
6/30
1 Call-upTB/TV 3
WTR
Bus
B152
B158
DR
Pre-Vib Vib/Acou
Post Vib
Bus
SEPET
Instr
EMI
LRD
4/4756 8
Contract Storage
4/18
Need/Avail
6/30
Storage
10/6
9
TV
3
NOAA-N' Planned Launch isMarch 2008.
N D J F M A M J J A S O N D J F M A M J J A S O N D J F M A M J J A S O N D J F M A M J J A S O N2001 2002 2003 2004
Foot Notes:1. SEM, SBUV, AVHRR & H303 Removal2. SEM, SBUV, AVHRR & H303 Re-Integration3. A303 Removal; Installation of Mass Model*4. A303 Re-Integration & IPF/DET*5. SEM & SBUV* Removal
6. SEM & SBUV* Re-Integration7. SARP & ADCS Software Upgrades*8. SARP/ADCS Delivery 4/30/029. SARP & ADCS Integration*
Possible delays incompleting remaining
Spacecraft +EOC extension
* = Not yet in LMMS Master Schedule
NOAA M-N’ I&T Summary Schedule: 6/30/02 M Launch(Based on Preliminary LMMS Rev S Schedule)

NOAA-M Launch From VAFB, CA – 6/24/02

Schedule Risk Analysis: what is the likelihood of overrunning the schedule?
Risk: a threat or uncertainty that could adversely impact the project’s schedule objectives
Analysis Approach:Project Risk Listing: multi-disciplined subgroup of the project team lists and ranks qualitative or “gut feel” risks based on past experience early in the project life cycleFormal Risk Management Systems: establish and track schedule risks with parameters using alert zones or thresholds that when triggered lead to corrective action planningSimulation Analysis: mathematical modeling which translates the uncertainties associated with activity durations into their potential impact on the project’s overall duration and schedule objectives (“Monte Carlo” technique)

Could a range of duration estimates help us quantify schedule risk?
The difference between the most likely duration (used in the logic network) and the average/expected duration computed from the distribution is expressed as a potential overrun or delay:
103.33 – 90 = 13.33 work days of potential overrun
Activity
gNetwork Duration
Low Estimate
High Estimate
Average/ Expected
Design 30.00 10.00 60.00 33.33Fab & Assy 40.00 20.00 75.00 45.00I&T 20.00 15.00 40.00 25.00
Total 90.00 45.00 175.00 103.33
Activity Duration Estimates - Work Days
Example Project with 3 serial
activities
Quantifying Schedule Risk
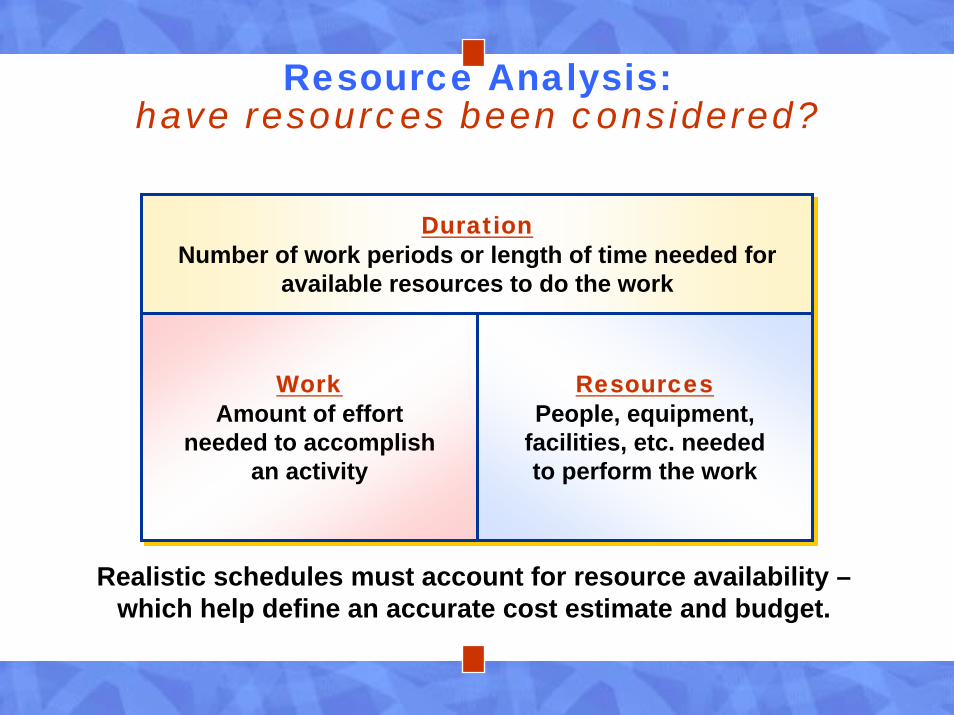
DurationNumber of work periods or length of time needed for
available resources to do the work
DurationNumber of work periods or length of time needed for
available resources to do the work
WorkAmount of effort
needed to accomplishan activity
WorkAmount of effort
needed to accomplishan activity
ResourcesPeople, equipment,
facilities, etc. neededto perform the work
ResourcesPeople, equipment,
facilities, etc. neededto perform the work
Resource Analysis:have resources been considered?
Realistic schedules must account for resource availability –which help define an accurate cost estimate and budget.

Resource Identification: the selection and definition of resource categories that are needed to accomplish the project’s activities (e.g. people, equipment, funds)
Resource Allocation: assigning and “loading” activities with the amounts of resources estimated to accomplish them
ID Task Name Duration Work Resource1 Award Contract 0 days? 0 hrs
2 Fab Housing 10 days? 80 hrs Mech Tech II
3 Fab Side Panels 5 days? 40 hrs Mech Tech II
4 Prep Module 2 days? 16 hrs Mech Tech II
5 Assemble Unit 1 day? 8 hrs Mech Tech II
6 Deliver Unit 0 days? 0 hrs
4/11
4/11 4/24
4/11 4/17
4/11 4/12
4/25 4/25
4/25
S S M T W T F S S M T W T F S S M T W T F SApr 8, '01 Apr 15, '01 Apr 22, '01
Resource Identification & Allocation

50%
100%
150%
200%
250%
300%
Peak Units:
Mech Tech II Overallocated: Allocated:
T W T F S S M T W T F S S M T W TApr 15, '01 Apr 22, '01
300% 300% 200% 200% 200% 100% 100% 100% 100% 100% 100%
Mechanical Tech II
Capacity:
1 tech
1-8-5
Initial Resource Profile
The shortage or over-commitment of resources is determined by profiling the requestedresources and comparing them to their availability or capacity.

Resource AnalysisResource Analysis: resolution of inconsistencies between resource supply and demand in a specific period of time including:
Add more of the resource (e.g. 2nd shift)Find a substitute for the resource (e.g. subcontract)Delay some activities (examine free slack)Perform some activities earlier than planned (examine logic)Combination of the above
Resource Leveling: the “smoothing” of resources so planned utilization matches availability in the most efficient manner while still meeting the project schedule’s objectives if possible
Schedule slack is a key consideration in levelingLeveling most useful for critical, near-term activities

20%
40%
60%
80%
100%
Peak Units:
Mech Tech II Overallocated: Allocated:
T W T F S S M T W T F S S M T W T F S S M T W T F SApr 15, '01 Apr 22, '01 Apr 29, '01
100% 100% 100% 100% 100% 100% 100% 100% 100% 100% 100% 100% 100% 100% 100% 100% 100% 100%
7 additional work days are needed
(after leveling)
Original 11 work day
plan
(before leveling)
“Leveled” Resource Profile
The “leveling” or smoothing of the “Mechanical Tech II” resourceallocation to fit the available capacity of one MTII.

ID Task Name Duration Work Resource1 Award Contract 0 days 0 hrs
2 Fab Housing 10 days 80 hrs Mech Tech II
3 Fab Side Panels 5 days 40 hrs Mech Tech II
4 Prep Module 2 days 16 hrs Mech Tech II
5 Assemble Unit 1 day 8 hrs Mech Tech II
6 Deliver Unit 0 days 0 hrs
4/114/11
4/11 4/244/11 4/24
4/11 5/14/11 4/17
4/11 5/34/11 4/12
5/4 5/44/25 4/25
5/44/25
S M T W T F S S M T W T F S S M T W T F S S M T W T F S S MApr 8, '01 Apr 15, '01 Apr 22, '01 Apr 29, '01
= Before Leveling
= After Leveling
Resource-Constrained Schedule
“Leveling” the resources results in a more realistic schedule, but delivery cannot occur on 4/25/01 as currently planned.

A baseline schedule is just a starting pointProject teams need information to help keep things on track in order to meet objectivesSchedule analysis techniques can augment earned value analysis by:
Evaluating schedule resultsAssessing the magnitude, impact, and significance of actual and forecast variations to the baseline schedule and/or current operating schedule
Summary