cpk28 is not involved in mediating meja-induced root ... · c inflorescence stem anatomy of wt, ......
TRANSCRIPT
1
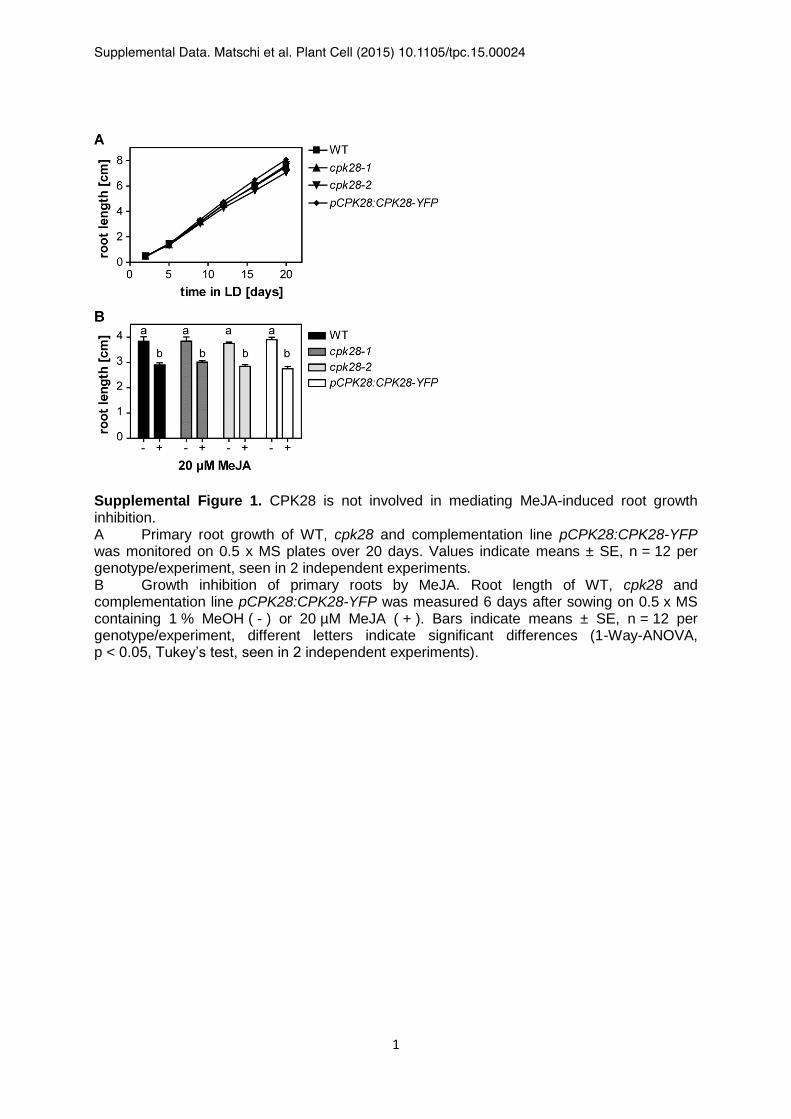
Supplemental Figure 1. CPK28 is not involved in mediating MeJA-induced root growth inhibition. A Primary root growth of WT, cpk28 and complementation line pCPK28:CPK28-YFP was monitored on 0.5 x MS plates over 20 days. Values indicate means ± SE, n = 12 per genotype/experiment, seen in 2 independent experiments. B Growth inhibition of primary roots by MeJA. Root length of WT, cpk28 and complementation line pCPK28:CPK28-YFP was measured 6 days after sowing on 0.5 x MS containing 1 % MeOH ( - ) or 20 µM MeJA ( + ). Bars indicate means ± SE, n = 12 per genotype/experiment, different letters indicate significant differences (1-Way-ANOVA, p < 0.05, Tukey’s test, seen in 2 independent experiments).
Supplemental Data. Matschi et al. Plant Cell (2015) 10.1105/tpc.15.00024

2
Supplemental Figure 2. JA biosynthesis or JA perception is required for the cpk28 growth phenotype. A Plant morphology of WT, cpk28-1, aos, cpk28-1 x aos, coi1-16 and cpk28-1 x coi1-16 at day 47. Scale bar: 5 cm. B Plant height in WT and different single and double mutants at day 47 (means ± SE, Student’s t-test; significance level ** = P < 0.01, n = 10, seen in 3 independent experiments).
Supplemental Data. Matschi et al. Plant Cell (2015) 10.1105/tpc.15.00024

3
Supplemental Figure 3. JA biosynthesis or JA perception is required for altered gene expression in cpk28 mutants. A-D Expression of JA-responsive marker genes PDF1.2, VSP2, PR3 and PR4 (A), JA signal transduction components JAZ1 and JAZ10 (B), NST1 (C) and GA3ox1 (D) in WT, cpk28-1, aos, cpk28-1 x aos, coi1-16 and cpk28-1 x coi1-16 (31 dag). Values represent means of three biological replicates with two pooled plants each ± SE (two technical replicates per biological replicate). Repetition of the experiment showed similar results (Student’s t-test; significance levels * = P < 0.05 and ** = P < 0.01 compared to WT).
Supplemental Data. Matschi et al. Plant Cell (2015) 10.1105/tpc.15.00024
4
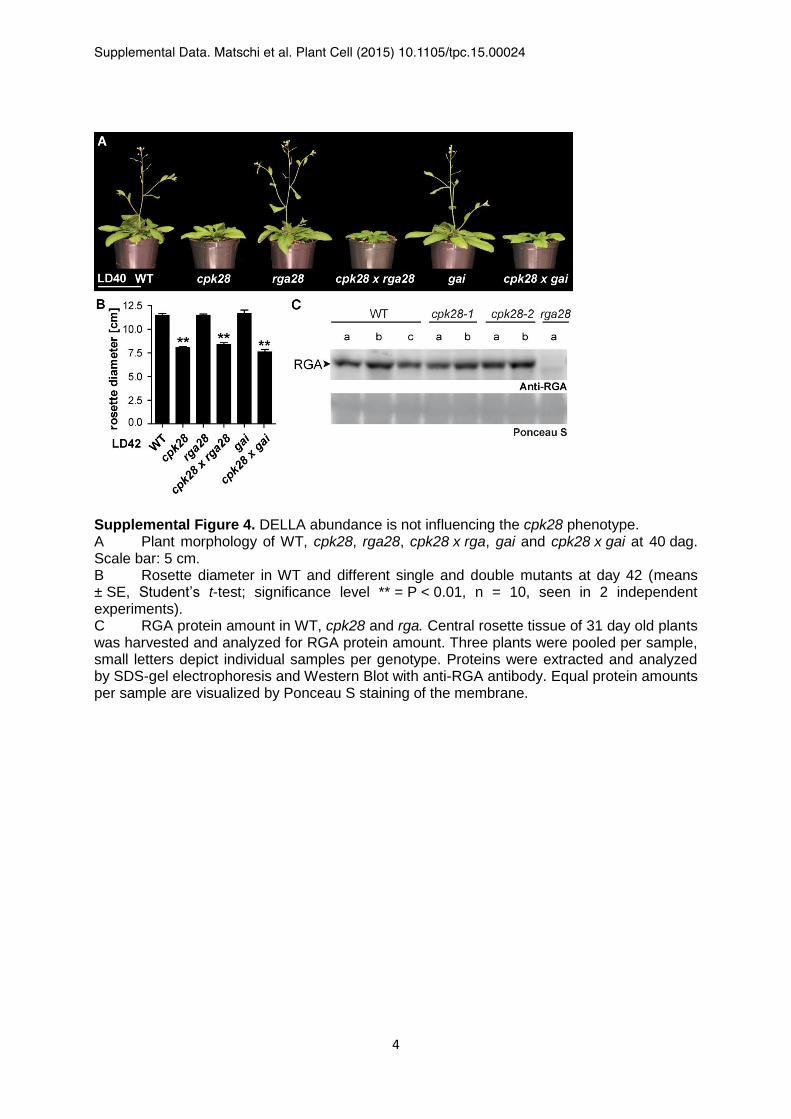
Supplemental Figure 4. DELLA abundance is not influencing the cpk28 phenotype. A Plant morphology of WT, cpk28, rga28, cpk28 x rga, gai and cpk28 x gai at 40 dag. Scale bar: 5 cm. B Rosette diameter in WT and different single and double mutants at day 42 (means ± SE, Student’s t-test; significance level ** = P < 0.01, n = 10, seen in 2 independent experiments). C RGA protein amount in WT, cpk28 and rga. Central rosette tissue of 31 day old plants was harvested and analyzed for RGA protein amount. Three plants were pooled per sample, small letters depict individual samples per genotype. Proteins were extracted and analyzed by SDS-gel electrophoresis and Western Blot with anti-RGA antibody. Equal protein amounts per sample are visualized by Ponceau S staining of the membrane.
Supplemental Data. Matschi et al. Plant Cell (2015) 10.1105/tpc.15.00024

5
Supplemental Figure 5. CPK28 does not influence suppressed resistance to fungal infection in JA biosynthesis or signaling mutants. A-B Alternaria brassicicola infection assay. Leaves of 31-day-old WT, cpk28, aos, cpk28-1 x aos, coi1-16 and cpk28-1 x coi1-16 plants were drop-inoculated with spores of Alternaria brassicicola. (A) Disease symptoms were monitored ten days after inoculation. (B) Mean values of disease indices are presented ± SE for at least 12 replicates, asterisks represent significant differences from WT (Student’s t-test; significance levels * = P < 0.05, ** = P < 0.01 and *** = P < 0.001). Scale bar = 1 cm.
Supplemental Data. Matschi et al. Plant Cell (2015) 10.1105/tpc.15.00024

6
Supplemental Figure 6. JA metabolite content in whole cpk28 plants is similar to wild type regardless of age or mechanical wounding. JA metabolite content measured in whole rosettes. Wounding of plants was carried out by squeezing 3 leaves per rosette with a pair of forceps. Whole rosettes were harvested before (control) or 1 hour after wounding (wounded) at 20 dag (LD20) and 27 dag (LD27) (values represent means ± SE, n = 6 per genotype/treatment). Extraction, purification, and quantification of OPDA, JA, JA-Ile and 12-OH-JA are described in Methods.
Supplemental Data. Matschi et al. Plant Cell (2015) 10.1105/tpc.15.00024
7
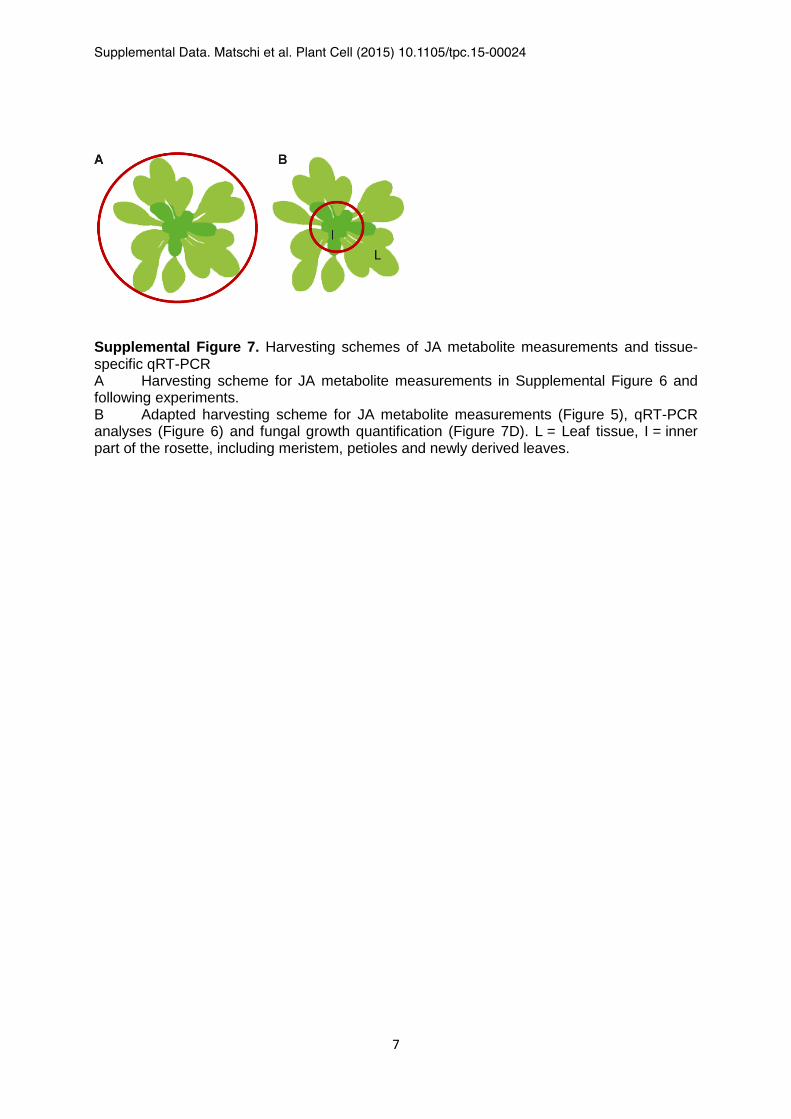
Supplemental Figure 7. Harvesting schemes of JA metabolite measurements and tissue-specific qRT-PCR A Harvesting scheme for JA metabolite measurements in Supplemental Figure 6 and following experiments. B Adapted harvesting scheme for JA metabolite measurements (Figure 5), qRT-PCR analyses (Figure 6) and fungal growth quantification (Figure 7D). L = Leaf tissue, I = inner part of the rosette, including meristem, petioles and newly derived leaves.
Supplemental Data. Matschi et al. Plant Cell (2015) 10.1105/tpc.15-00024

8
Supplemental Figure 8. Tissue-specific Alternaria brassicicola infection assay. A-B Leaves of the innermost rosette whorl of 31-day-old WT, cpk28 and aos plants were drop-inoculated with spores of Alternaria brassicicola. (A) Disease symptoms were monitored ten days after inoculation. (B) Mean values of disease indices are presented ± SE for at least 15 replicates, asterisks represent significant differences from WT (Student’s t-test; significance levels ** = P < 0.01). Scale bar = 1 cm.
Supplemental Data. Matschi et al. Plant Cell (2015) 10.1105/tpc.15.00024
9
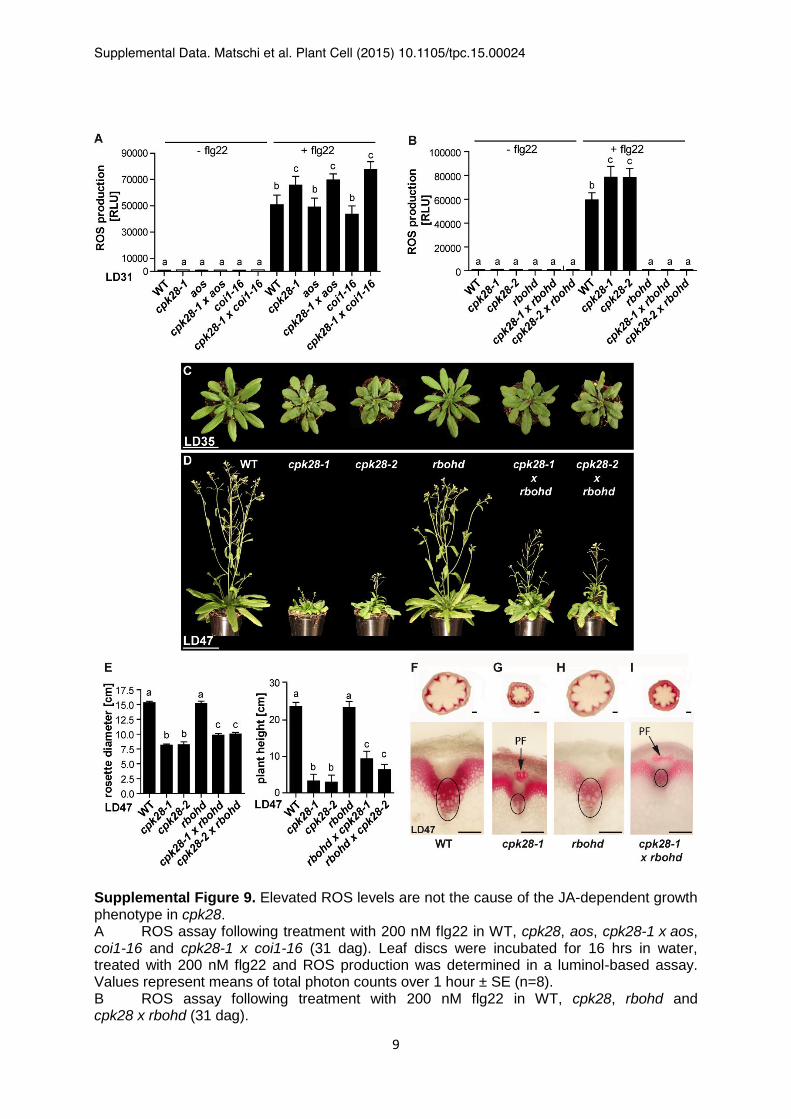
Supplemental Figure 9. Elevated ROS levels are not the cause of the JA-dependent growth phenotype in cpk28. A ROS assay following treatment with 200 nM flg22 in WT, cpk28, aos, cpk28-1 x aos, coi1-16 and cpk28-1 x coi1-16 (31 dag). Leaf discs were incubated for 16 hrs in water, treated with 200 nM flg22 and ROS production was determined in a luminol-based assay. Values represent means of total photon counts over 1 hour ± SE (n=8). B ROS assay following treatment with 200 nM flg22 in WT, cpk28, rbohd and cpk28 x rbohd (31 dag).
Supplemental Data. Matschi et al. Plant Cell (2015) 10.1105/tpc.15.00024

10
C-D Plant morphology of WT, cpk28, rbohd and cpk28 x rbohd at day 35 (LD35, C) and day 47 (LD47, D). Scale bar: 5 cm. E Rosette diameter and plant height in WT and rbohd single and double mutants at day 47 (n = 12). F-I Inflorescence stem anatomy of WT, cpk28, rbohd and cpk28 x rbohd at 47 dag. Circles indicate xylem tissue of vascular bundles with fewer developed lignified xylem tracheary elements in cpk28. PF = lignified phloem fibers. Scale bar: 100 µm. (1-Way-ANOVA, Tukey’s post-test, P<0.05, different letters indicate significant differences, values represent means ± SE).
Supplemental Data. Matschi et al. Plant Cell (2015) 10.1105/tpc.15.00024
11
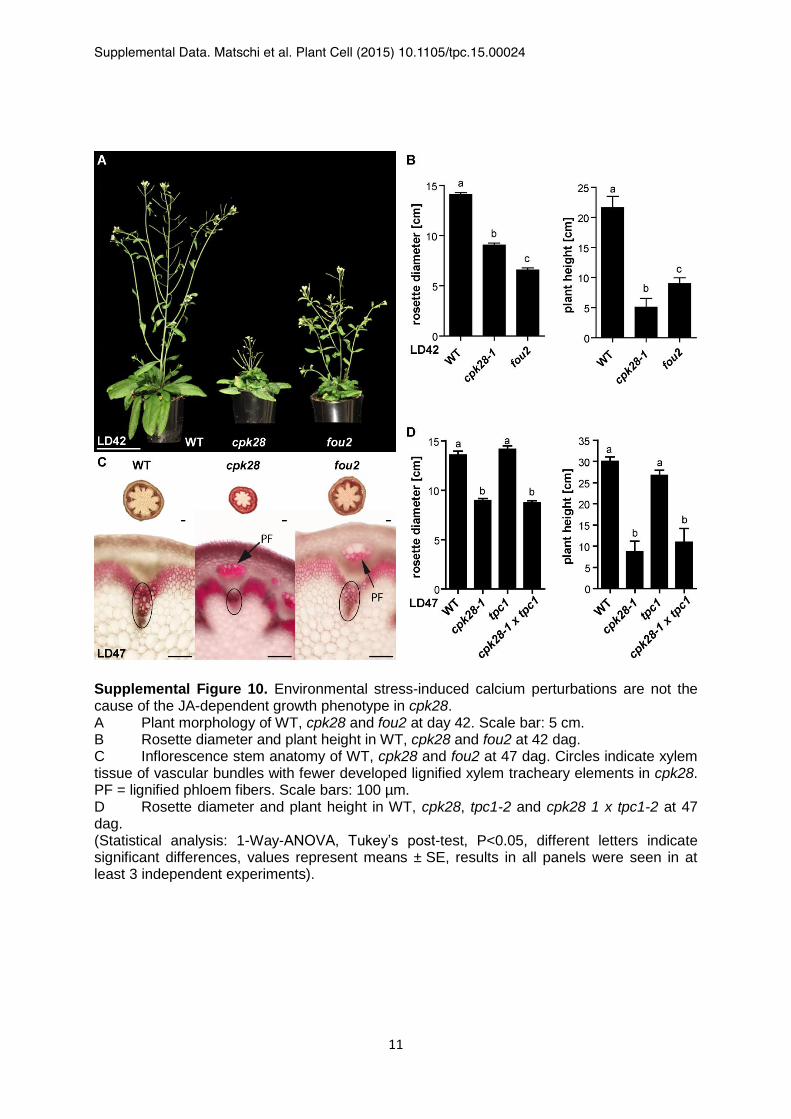
Supplemental Figure 10. Environmental stress-induced calcium perturbations are not the cause of the JA-dependent growth phenotype in cpk28. A Plant morphology of WT, cpk28 and fou2 at day 42. Scale bar: 5 cm. B Rosette diameter and plant height in WT, cpk28 and fou2 at 42 dag. C Inflorescence stem anatomy of WT, cpk28 and fou2 at 47 dag. Circles indicate xylem tissue of vascular bundles with fewer developed lignified xylem tracheary elements in cpk28. PF = lignified phloem fibers. Scale bars: 100 µm. D Rosette diameter and plant height in WT, cpk28, tpc1-2 and cpk28 1 x tpc1-2 at 47 dag. (Statistical analysis: 1-Way-ANOVA, Tukey’s post-test, P<0.05, different letters indicate significant differences, values represent means ± SE, results in all panels were seen in at least 3 independent experiments).
Supplemental Data. Matschi et al. Plant Cell (2015) 10.1105/tpc.15.00024

12
Supplemental Table 1. Genotyping primers used in this study.
name reaction sequence
CPK28 fwd CPK28 WT AAGGTTCCATGACATTGTTG
CPK28 rev CATTCGAAGTTCCTCAGGCGTTATG
GABI-KAT-LB T-DNA in cpk28 ATATTGACCATCATACTCATTGC
CPK28 rev CATTCGAAGTTCCTCAGGCGTTATG
AOS fwd AOS WT CTAACCGGAGGCTACCGTATC
AOS rev CGAGAAATTAACGGAGCTTCC
SALK-LB T-DNA in aos ATTTTGCCGATTTCGGAAC
AOS fwd CTAACCGGAGGCTACCGTATC
COI1-16 P2 COI1 WT GAACACAATTTAGTACTAAGGACGCATTCCCAA
COI1-16 P4 AACTAGTTGGGTTCTTTAAGGCTGCAGCTATTC
COI1-16 P2 coi1-16 (EMS
mutation)
GAACACAATTTAGTACTAAGGACGCATTCCCAA
COI1-16 P3 AACTAGTTGGGTTCTTTAAGGCTGCAGCTAACT
RGA fwd1 RGA WT CAGCTAAGCATCCGATTTGC
RGA rev TCACATAGAGAAGTCACATG
RGA fwd2 T-DNA in rga28 ATGAAGAGAGATCATCACC
SALK-LB ATTTTGCCGATTTCGGAAC
GAI fwd GAI WT ATGAAGAGAGATCATCATCAT
GAI rev ACCTTATCGATCGCACCAGGT
GAI T-DNA in gai ACCTTATCGATCGCACCAGGT
SAIL-LB TTTTCAGAAATGGATAAATAGCCTTGCTTC
RBOHD fwd RBOHD WT GCCTTTACACTCGCGACGCC
RBOHD rev CTTAAACCCTTTACTATTGTTGTTACTG
RBOHD rev T-DNA in rbohd CTTAAACCCTTTACTATTGTTGTTACTG
SALK-LB ATTTTGCCGATTTCGGAAC
TPC1 fwd TPC1 WT ATATCGAAGAAAGCTCGGCTC
TPC1 rev GGGAAATAGAACCCGTGAGAG
TPC1 rev T-DNA in tpc1-2 GGGAAATAGAACCCGTGAGAG
SALK-LB ATTTTGCCGATTTCGGAAC
Supplemental Data. Matschi et al. Plant Cell (2015) 10.1105/tpc.15.00024

13
Supplemental Table 2. q(RT)-PCR primers used in this study.
name sequence
qRT-Actin2-F TCCCTCAGCACATTCCAGCAGAT
qRT-Actin2-R AACGATTCCTGGACCTGCCTCATC
qRT-NST1-F TCGAGCCTTGGGACATTCAAGAGA
qRT-NST1-R ACCAGTCGTTTTGTGGCGTTGTT
qRT-NST3-F GTGCCTCCAGGTTTCAGATTCC
qRT-NST3-R TCCTCTTGAATATCCCAAGGCTCA
qRT-GA3OX1-F ACCGTGCCACCGTTTCCTGG
qRT-GA3OX1-R TAACCCGAGCGCGGTGCAAC
qRT-PDF1.2-F CTTTCGACGCACCGGCAATG
qRT-PDF1.2-R TCCGCAAACCCCTGACCATG
qRT-CORI3-F GAGGCGGCCAAAGATGCT
qRT-CORI3-R CAGGGCATAGAGTGCAGAGGTA
qRT-VSP2-F TCCATCAACTACGCCAACTG
qRT-VSP2-R CGGTTTTGGAGTCGTATTGG
qRT-JAZ1-F AACTTGGCGAGCAAAGGCAC
qRT-JAZ1-R TGGATGAGGAACTTGGTTTGCGA
qRT-JAZ10-F ATGTCGAAAGCTACCATAGAACTCG
qRT-JAZ10-R GCCGATGAATCGGAATTGTTTCCAGTGG
qRT-AOS-F GAACCACCGGTTACGGCTCA
qRT-AOS-R ACTTTAAACGCCGCGTCGTG
qRT-OPR3-F GGTGTTAATGGCTCAAAGCTCGC
qRT-OPR3-R CTCTGTTTGCCCGTAGGCGT
qPCR-AbCUTAB1-F GCATGTCCGCTCACCAATATC
qPCR-AbCUTAB1-R GCCTGGGATCTTGGAATGC
qPCR-AtACTIN2-F CTTGCACCAAGCAGCATGAA
qPCR-AtACTIN2-R CCGATCCAGACACTGTACTTCCTT
SUPPLEMENTAL REFERENCES Dubiella, U., Seybold, H., Durian, G., Komander, E., Lassig, R., Witte, C.-P., Schulze, W.X. and Romeis, T. (2013) Calcium-dependent protein kinase/NADPH oxidase activation circuit is required for rapid defense signal propagation. Proc Natl Acad Sci U S A, 110, 8744-8749. Willige, B.C., Ghosh, S., Nill, C., Zourelidou, M., Dohmann, E.M.N., Maier, A. and Schwechheimer, C. (2007) The DELLA domain of GA INSENSITIVE mediates the interaction with the GA INSENSITIVE DWARF1A gibberellin receptor of Arabidopsis. Plant Cell, 19, 1209-1220.
Supplemental Data. Matschi et al. Plant Cell (2015) 10.1105/tpc.15.00024