cpdw project assessment of cytotoxicological potential...
TRANSCRIPT

2004 EUR 21397/1 EN
CPDW project
Assessment of cytotoxicological potential ofproducts in contact with drinking water
F.Enkiri1, D. Colle1, T. Grummt2, C. Matthews3, R. Marcos4, H. Westphal5, E.J. Hoekstra6,M. Philippe1, P. Neveu1
1 Centre de Recherche et de Contrôle des Eaux de Paris, France
2 Umweltbundesamt, Germany
3 Thames Water, United Kingdom
4 Universitat Autònoma de Barcelona, Spain
5 Danish Toxicology Centre, Denmark
6 European Commission, DG JRC

3
October 2004
Assessment of cytotoxicologicalpotential of products in contactwith drinking waterDevelopment of a harmonised test to be used in theEuropean Acceptance Scheme concerning CPDW
European Commission
Contract numberEVK1-CT2000-00052
AuthorsF.Enkiri, D. Colle (CRECEP), T. Grummt (UBA), C. Matthews(TW), R. Marcos (UAB), H. Westphal (DTC), E.J. Hoekstra(EC DG JRC), M. Philippe, P. Neveu (CRECEP)

5
PREFACE
The investigations described in this report were conducted as part of the European Project"Development of Harmonised tests to be used in the European Approval Scheme (EAS)concerning Construction Products in contact with Drinking Water (CPDW)", under Contractno. EVK1-CT2000-00052. This project is financially supported by the EuropeanCommission, the national authorities of Denmark, France, Germany, Portugal and the UnitedKingdom and the material suppliers in these countries and Europe, respectively. WorkPackage 2 concerned the cytotoxicity properties of materials of this project. The institutesparticipating in the investigations and discussions in this work package are listed below.
UBA, Germany
TW, United Kingdom 1
CRECEP, France
UAB, Portugal
DTC, Denmark
EC, DG JRC
T. Grümmt, A. Jaeger
J. Ashworth, C. Matthews, D. Holt
D. Colle (convenor), F. Enkiri, M. Philippe, P. Neveu
R. Marcos
H. Westphal
E.J. Hoekstra
Special acknowledgements go to Claude Danglot for valuable advice and Catherine Bernardfor the WP2 pictures.
1 The Water Quality Centre, Materials Testing Service, Thames Water were involved in the laboratorydevelopment and evaluation of a cytotoxicity method for the project "Development of harmonised tests to beused in the European Approval Scheme (EAS) concerning construction products in contact with drinking water".The data analysis and reporting of the trials has been undertaken by other partners of the project and do notrepresent those of The Water Quality Centre. Any views or opinions expressed are solely the views of the otherauthors and do not represent those of Thames Water Utilities Limited or Thames Water Utilities Employees.Thames Water Utilities Limited gives no representation or warranty as to the accuracy, completeness, quality orotherwise of the data or information contained in the report and excludes all liability in this respect (to the extentpermitted by law).

7
ABBREVIATIONS
acid Rnases acid ribonucleasesAFNOR Association Française de NormalisationATP adenosine triphosphateCEN European Organisation for StandardisationCPDW construction products in contact with drinking watercpm counts per minutesDMSO dimethyl sulfoxideDNA deoxyribonucleic acidEAS European Acceptance schemeEPDM Ethylene propylene diene monomerEPDM RB EPDM rubber O sealEPDM RW EPDM rubber washerGCMS gas chromatography – mass spectrometry3H uridine tritiated uridineIC 50 inhibitory concentration 50 %mRNA messenger ribonucleic acidPE-X crosslinked polyethyleneNRB Nitrile Rubber O sealPE-Xc crosslinked high density polyethylenePTFE polytetrafluoroethylenePVC-C chlorinated-polyvinylchoridePVC-R polyvinylchoride rigidRG regulators groupRNA ribonucleic acidrRNA ribosomal ribonucleic acidRSD relative standard deviationSD standard deviationSDS sodium dodecyl sulfateS/V surface area to volume contact ratio (cm-1)TAC "titre alcalimétrique complet" = HCO3
- [note: titration volume (in ml or °F)of 0.02M H3O+ necessary to add to 100 ml of sample in order to change thecolour of phenolphtalein into red]
TCA trichloroacetic acidTOC total organic carbonVCR coefficient of variation of reproducibility (%)WP work package

9
ABSTRACT
A standardised test method is needed for assessing the potential toxicity of constructionproducts in contact with drinking water (CPDW) in Europe. Two types of toxicity towardshuman cells exist: a metabolic toxicity and a genetic toxicity. Metabolic toxicity refers to theability of a molecule to interact reversibly with cellular functions and to create disturbances,which can eventually lead to the death of the cell. Genotoxic agents have the capacity tointeract directly or indirectly with the genetic material of the cell and to generate changeswithin it. Also, it is of public interest to prevent consumers from being exposed to toxicchemicals and to widely develop toxicity analysis. To achieve this goal, the characteristics,the advantages and the drawbacks of the two existing European Standards have beendiscussed. The British Standard (BS 6920) measures the degree of inhibition of growth ofmonkey kidney cells, whereas the French Standards (XP P 41-250-3 and XP P 41-260-3)measure the inhibition of ribonucleic acid (RNA) synthesis in human cells in relation to thatobtained with a control. It was decided that the RNA synthesis inhibition assay was the bestcandidate for use as an European cytotoxicity test. A limited variety of CPDW, viz. EPDM,PE-X, PVC-r, PVC-C, NRB, stainless steel and organic cementitious, was selected todetermine the cytotoxicity potential.
Several instruction days at CRECEP and a first inter-calibration comparison exercise wereconducted at the beginning of the project. Differences in the test conditions between the threelaboratories and difficulties in the implementation of the test in TW lead the WP2 partners toreconsider some issues. The effect of various parameters was studied to try to make themethod robust and reliable for any laboratory. The following topics were investigated: theleachates preparation and storage, the cell viability, the cell growth, the "cell-leachate"incubation time, the uridine batches.
The experiments at UBA and at CRECEP clear showed that the leachates should be testedimmediately after preparation and can't be stored. The cytotoxic effect may change duringstorage of the leachate.
An assessment of cell viability (trypan blue dye) prior to RNA synthesis determination wasdecided as well as a calculation of the percentage of cell growth.
An acceptance limit of 80 % of viable cells after incubation of the cells for the blank was setto allow the experiments to be pursued with the kinetics. A threshold of "greater than 50 % ofgrowth" in the blank was set too.
To improve and insure the quality of the cell growth in the different laboratories, variousparameters were checked (degree of cell confluence, incubation time, cell viability, quality ofthe reference water, etc.).
In order not to modify the results, uridine batches of high quality grade were selected. Takinginto account the information deduced from these surveys, a harmonised cytotoxicityprocedure was obtained and was used to test the selected CPDW.
Eleven materials were tested with the final draft protocol. Three methods of calculation wereapplied to the data, complied with the French acceptance criteria of "greater than 70 %". Agood intra- and inter- laboratory reproducibility could be pointed out for 8 materials (RSDmax = 5.08 % and VCR max = 11.7 %, first mode of calculation, RSD max = 5.35 % and VCRmax = 19 %, second mode of calculation, RSD max = 10.55 % and VCR max = 22.6 %, thirdmode of calculation).
10
Two types of materials seemed to vary depending on the migration water and, consequently,the assessment of toxicity. This variability might not be due to the cytotoxicity protocol itselfbut be dependent of two major factors, i.e. the nature of the material and the absence of awashing step prior to leachate preparation. This phenomenon should be studied in more detail.
Therefore, the reproducibility of the test, defined as the coefficient of variation ofreproducibility VCR, ranged from 1.52 % to 141.42 % with a median value of 10.52 % (firstmode of calculation), from 0.89 % to 141.42 % with a median value of 11.25 % (second modeof calculation) and from 1.74 % to 138.24 % with a median value of 7.32 % (third mode ofcalculation).
Different materials were tested successfully by the cytotoxicity test, supporting the fact, thatthis test system is a useful screening test for exposures, which may be cytotoxic. Moreover,the test seems to satisfy many criteria for routine use in regulatory practices. It is verysensitive, quantitative, reliable, reproducible and requires no concentration procedures of thesample to be tested (UBA and CRECEP findings). However, no robust positive material wasfound among the selected CPDW and positive materials are necessary to well-establish thetest.
In conclusion, the validation of the test system should be achieved to include it as a CENstandard. A number of aspects need further investigations, including: • a first agreement about the influencing factors of cell cultures; the storage, handling and
quality of uridine; the nature of the culture vessel and its cleaning• the test automation (use of 96-well microplate equipped with GF/C glass filters and direct
radioactivity counting in a top count microplate reader)• an inter-validation of the assay with known chemical and/or biological toxicants• a second agreement for material investigation : the storage of the materials, the material
preconditioning, the preparation and handling of the leachates, the mode of treatment ofthe results
• an inter-validation of the test by analysing a wide variety of CPDW, which should cover alarge range of toxicity levels in order to assess the discriminatory power of the method.The results of the tests should meet specific requirements e.g. repeatability < 25% andreproducibility < 30%.
Further studies to establish pass-fail criteria for CPDW, based on RNA synthesis inhibition inhuman cells. A 70% acceptance limit was previously set because, below this level, cellularsublethal changes occur. But no instructions are clearly established concerning materialswhich give percentages of RNA synthesis ranged from 70 to 100 %.
Once the cytotoxicity assay will be presented as a CEN standard, recommendations could bemade for the RG-CPDW concerning acceptance criteria for the European Acceptance Scheme(EAS).
The next step would be the implementation of a set of genotoxic assays. As it was shown, atthe end of this work, the detection of mutagenic effects (Ames test) provides additionalinformation about the quality of materials.
The cytotoxicity assay associated with a suitable battery of genotoxicity tests should be, in thefuture, able to assess the global cytotoxicity of compounds leached from CPDW and give asound answer concerning the health risk incurred by the consumers.
11
CONTENTS
Preface ........................................................................................................................................5Abbreviations..............................................................................................................................7Abstract.......................................................................................................................................9Contents ....................................................................................................................................11INTRODUCTION....................................................................................................................13
Necessity of an European approval system for material in contact with drinking water .....13Cytotoxicity tests for CPDW................................................................................................13Genotoxicity tests for CPDW...............................................................................................15Research objectives ..............................................................................................................15
MATERIALS AND METHODS .............................................................................................16Project structure....................................................................................................................16
Stage 1: review of applied cytotoxicity and genotoxicity tests ........................................16Stage 2: harmonisation of the cytotoxicity test ................................................................16Stage 3: Application of the harmonised method on various types of CPDW ..................16Stage 4: Statistical interpretation of the results ................................................................17Stage 5: Drafting the cytotoxicity protocol ......................................................................17
Materials ...............................................................................................................................18Nature and S/V ratio .........................................................................................................18Preconditioning step .........................................................................................................18Preparation of the leachates..............................................................................................19
Waters composition/quality..................................................................................................21Purified water ...................................................................................................................21Reference water ................................................................................................................21Migration water ................................................................................................................21
Cell line ................................................................................................................................22Reagents................................................................................................................................23
Media and reagents for cell culture ..................................................................................23Chemical products ............................................................................................................23Radio-labelled tracer.........................................................................................................23
Equipment.............................................................................................................................25Equipment for the migration test ......................................................................................25Equipment for the preparation of the leachates ................................................................25Equipment for cell culture ................................................................................................25Equipment for the cytotoxicological inspection...............................................................25
Cleaning of the glassware.....................................................................................................27General information..........................................................................................................27Cleaning liquids for glassware .........................................................................................27Glassware cleaning procedure ..........................................................................................27
The cytotoxicity test method ................................................................................................29Principle............................................................................................................................29Blank or reference control ................................................................................................29Positive control .................................................................................................................29Description of the cytotoxicity test...................................................................................29
STAGE 1: REVIEWS OF APPLIED CYTOTOXICITY AND GENOTOXICITY TESTS...33Objectives .............................................................................................................................33Cytotoxicity review ..............................................................................................................33
Toxicity evaluation by aquatic organisms ........................................................................33Toxicity evaluation by yeast.............................................................................................35Toxicity evaluation by bacteria ........................................................................................35

12
Toxicity evaluation by animal or human cell................................................................... 37References ........................................................................................................................ 48
Genotoxicity review ............................................................................................................ 50References ........................................................................................................................ 52
STAGE 2: HARMONISATION OF THE CYTOTOXICITY TEST...................................... 55Part1: Inter-calibration of the cytotoxicity test .................................................................... 55
Introduction...................................................................................................................... 55Instruction days ................................................................................................................ 55Inter-calibration comparison exercise.............................................................................. 55Conclusion ....................................................................................................................... 58
Part 2: Study of the impact of different test variables.......................................................... 59Introduction...................................................................................................................... 59Preparation of the leachates ............................................................................................. 59Effect of the leachate storage on the cytotoxicity test ..................................................... 61Study of the cell viability, the cell growth and the incubation time ................................ 62Importance of the nature of the incubation vessel on the cytotoxicity test...................... 65Study of the tritiated uridine decomposition over time.................................................... 66Importance of uridine batches of high quality grade ....................................................... 67Additional CRECEP experiment ..................................................................................... 69
Conclusions of stage 2 ......................................................................................................... 69STAGE 3: APPLICATION OF THE HARMONISED CYTOTOXICITY METHOD TOVARIOUS TYPES OF CPDW................................................................................................ 71
Objectives............................................................................................................................. 71Selected materials ................................................................................................................ 71Cytotoxicity investigation .................................................................................................... 71Results.................................................................................................................................. 71Conclusions.......................................................................................................................... 85Genotoxicity tests................................................................................................................. 86
GENERAL CONCLUSION .................................................................................................... 87Annexes.................................................................................................................................... 89
13
INTRODUCTION
Necessity of an European approval system for material in contact with drinking water
An increasing number of (synthetic) products are used in the construction of drinking waterstorage, transportation and water distribution systems. Construction Products in contact withDrinking Water (CPDW) may affect water quality by releasing compounds that could havetoxic properties, undesirable taste/odour, or promote microbial growth.
CPDW selection is regulated in various EC countries. CPDW must pass tests included in thenational approval schemes in order to protect the health of the consumer. These nationalapproval schemes differ significantly in their concept, their methodologies and approvalcriteria.
In order to reduce CPDW testing in Europe and to open the European Market for CPDW, aworking group was set up to prepare a European Approval System (EAS). This RegulatorGroup for these products (RG-CPDW) identified the necessity to harmonise four tests, whichcould become part of the EAS. The aim of this research project was to determine if fourcurrent test methodologies were suitable for inclusion in the proposed EAS. And therefore, itwas logical to divide the project into four work packages (WP):• WP 1: enhancement of microbial growth• WP 2: assessment of cytotoxicity / genotoxicity• WP 3: GC-MS of non-target compounds• WP 4: potential to form disinfectant by-products
The scope of the present report is to describe and summarise the work (both bibliographic andexperimental) performed by the laboratories involved in WP2.
Cytotoxicity tests for CPDW
Maintaining the quality of drinking water during its storage and its distribution is a mainconcern in water supply. A broad range of chemical substances may be present in drinkingwater, essentially as trace amounts.
These chemicals may originate from two different sources: the tap water and/or the CPDW. Afew of them can present a risk for public health. Organic chemicals will be regulated in theEAS by a Positive List (PL), which will contain all substances known from the formulation.Limits for drinking water at the consumers' tap will be set in the PL. However, it is unclear upto what detail industry should know the formulation of their products including the toxicity ofthe substances. More specifically, the role of impurities of raw materials and reaction productsshould be clarified. This gap can be covered by toxicity tests.
Two types of toxicity towards human cells can be described: metabolic toxicity and genetictoxicity. Metabolic toxicity refers to the ability of a molecule to interact reversibly withcellular functions and to create disturbances, which can eventually lead to the death of thecell. Genotoxic agents have the capacity to interact directly or indirectly with the geneticmaterial of the cell and to generate changes within it. The metabolic toxicity can be assessedby a cytotoxicity test. The aim of this kind of assays is to give an overall judgement on thetoxicity of the product, not only synergetic or antagonistic effects of compounds but also thepresence of unexpected chemicals such as impurities or reaction products. It is of public
14
interest that consumers are not exposed to toxic chemicals and that toxicity analysis is widelydeveloping.
Among the available chemical methods, the GCMS is applied to CPDW testing to detectunsuspected substances. This technique aims to identify and to semi-quantify the organiccompounds that are present in the migration water, by comparison with existing standards.The GCMS method is obviously necessary in order to control that the levels of detectedsubstances are not higher than the authorised limits. But unsuspected substances are, bynature, unknown and only a small percentage can be detected, identified and quantified.Actually, the technique requires a concentration step of the leachate and only a part of organicsubstances are extracted depending on the solvent. The efficiency of the extraction is, inaddition, related to the nature of the compounds themselves. More important is that thetoxicity of different compounds is not comparable at the same concentration. Even if thecompounds are identified, their effects on the human health can not be completely predictedbecause of synergetic or antagonistic effects between individual compounds. Keeping in mindthose limitations, GCMS appears not to be enough adequate to make sure a CPDW is nothazardous for consumers.
The low concentration and the large diversity of toxic agents make them difficult to identifyand, therefore, several different methods are, indeed, needed to correctly assess the toxicpotential of these leached substances. Only global biological tests, including both cytotoxicityand genotoxicity tests, are able to ensure a sufficient consumer's protection.
Currently, cytotoxicity tests are only used in two European countries. In the United Kingdom,CPDW leachates are tested for cytotoxicity using the British Standard (BS 6920) procedure.This method is subjective as it measures the degree of inhibition of growth of monkey kidneycells on the basis of morphological modifications. This test must be performed in triplicateand if growth of more than one of the test leachates causes inhibition of the culture the CPDWis not approved.
In France, the normalised tests (Association Française de Normalisation or AFNOR, XP P 41-250-3 and AFNOR XP P 41-260-3) measure the inhibition of the RNA synthesis in humancells. In these assays, the effects of a compound on the cellular RNA synthesis are followedby kinetic uptake of radiolabelled uridine. The synthesis of RNA is one of the vital cellularfunctions and is directly proportional to the square of cellular growth rate. Furthermore, it issensitive to any kind of disturbances. Thus, it indicates early toxic effect at cellular level evenbefore any other detectable cellular damage has occurred: decrease in the rate of RNAsynthesis reflects sub-lethal toxic effects. Moreover, due to its high sensitivity, this test doesnot require preliminary concentration of the toxic chemicals leached from materials in contactwith drinking water. The noxious effect of poorly controlled extractions is well known astoxicity varies according to the concentration procedure (Fauris et al, 1985 a and 1985 b;Annual report Biosafe Paper 2001-2002; Lefebvre, 1994).
The validation of this method by the French Department of Health was based on the• close correlation found with the attachment inhibition tests (Fauris et al, 1986) • qualitative and quantitative analysis of a large variety of toxics (potassium dichromate,
colchicin, dimethyl sulfoxide (DMSO), cupper sulfate, cadmium chloride…) (PhD ofOmaya Hiddeh (1987))
• deep knowledge of the test from studies of numerous water cytotoxicity evaluations(surface water, drinking water, underground water, treated water, mineral water), studies ofa large number of materials in contact with drinking water or foodstuffs.

15
During the initial planning stages of this research project, the experts considered the twoexisting cytotoxicity methods and agreed that the existing RNA synthesis inhibition test (theFrench test) was the best candidate for use as a European cytotoxicity standard.
Genotoxicity tests for CPDW
Cytotoxicity tests only measure the potential metabolic effect of products released by thematerial but do not allow conclusions to be drawn about the potential genotoxic effects ofthose.
To make sure of the innocuity of a CPDW, genotoxicity tests should be applied along with thecytotoxicity test. For the moment, no genotoxicity test is used in national approval scheme forCPDW in Europe, despite the fact that a wide range of assay systems exists (from simplesystems as bacteria to the most complex eukaryote cell as whole mammalian individuals). Toselect the suitable genotoxicity test or "battery of tests", further investigations are needed andshould take into account the following aspects:• preparation of leachates should represent the actual genotoxicity of the tested sample• the various mechanisms, in which genotoxic agents interact with DNA, inducing different
types of lesions on DNA (changes at the bases' level, at the structure of individual genes'level, on the chromosomes).
Research objectives
The objectives of the project are:• to make a review of the available cytotoxicity and genotoxicity tests • to have endpoints relevant to actual consumer safety• to set up and to cross-validate the RNA synthesis inhibition method among different
partners• to propose an harmonised procedure to test the cytotoxicology of leachates from CPDW
which can serve as a basis for a CEN standard in the EAS program• to gather information to provide international approved pass/fail criteria regarding
cytotoxicity
The final procedure must fulfil the following properties:• fast response• high sensitivity towards a wide range of toxic• discriminatory power • reproducibility • good adaptability to routine analysis• low cost

16
MATERIALS AND METHODS
Project structure
The research was divided into five stages in which the participants were involved in relationto their specific knowledge and competence.
Stage 1: review of applied cytotoxicity and genotoxicity tests
Cytotoxicity DTC, UAB, CRECEP reviewed and compared the existing cytotoxicity tests. The scope ofthis part was to summarise the existing tests, practices, guidelines and regulations in order todetermine the improvements which could be applied on the RNA synthesis inhibition test.These participants were to review information from their own country and establish a networkof information about other countries not directly involved in this research.
GenotoxicityDTC, UAB, CRECEP carried out the review of existing genotoxicity tests in the same manneras for the cytotoxicity test review. The main aim was to determine if one of the presentlyavailable tests could be applied to CPDW.
Stage 2: harmonisation of the cytotoxicity test
part 1: Intercalibration of the cytotoxicity testDetailed instructions were given by CRECEP to the participating institute (TW and UBA)about the cell culture procedures and about the cytotoxicity method. A training stay was, also,performed in CRECEP.
Then, an initial intercalibration comparison exercise was carried out between the threelaboratories testing leachates from three organic materials (two EPDM seal type and a PE-Xpipe).
part 2: Study of the impact of various parameters upon the cytotoxicity testThe selection of appropriate conditions is relevant for a correct determination of cytotoxicity.Therefore, the effects of factors introducing variability in the analysis were investigated bythe three laboratories (cell viability, cell growth, incubation time, preparation of the migrationwater, S/V ratio…).
Stage 3: Application of the harmonised method on various types of CPDW
Further inter-laboratory tests were conducted by CRECEP, UBA and TW with a number ofselected materials to assess the applicability and the reproducibility of the method wherever itis proceeded.
Materials tested in these investigations were :• PVC-R pipe, PVC-C pipe, EPDM rubber hose, PE-Xc pipe, nitrile rubber O seal, stainless
steel, EPDM rubber O seal, organic cementitious, EPDM rubber washers• Each test included if possible, a positive control, i.e. potassium dichromate (2 mg/L) and a
blank or reference control called reference water (autoclaved purified and pyrodistilledwater for TW and CRECEP, autoclaved purified water for UBA).

17
A negative control was only realised by CRECEP and consisted of a borosilicated glass jarfilled with reference water without any material.
Stage 4: Statistical interpretation of the results
Statistical analysis of the results was performed mainly by CRECEP on the basis on thefindings that had been obtained.
Stage 5: Drafting the cytotoxicity protocol
A procedure for an harmonised cytotoxicity test that could be considered as a potential CENstandard was developed. Recommendations might be made for the RG-CPDW concerningacceptance criteria for the EAS.
18
Materials
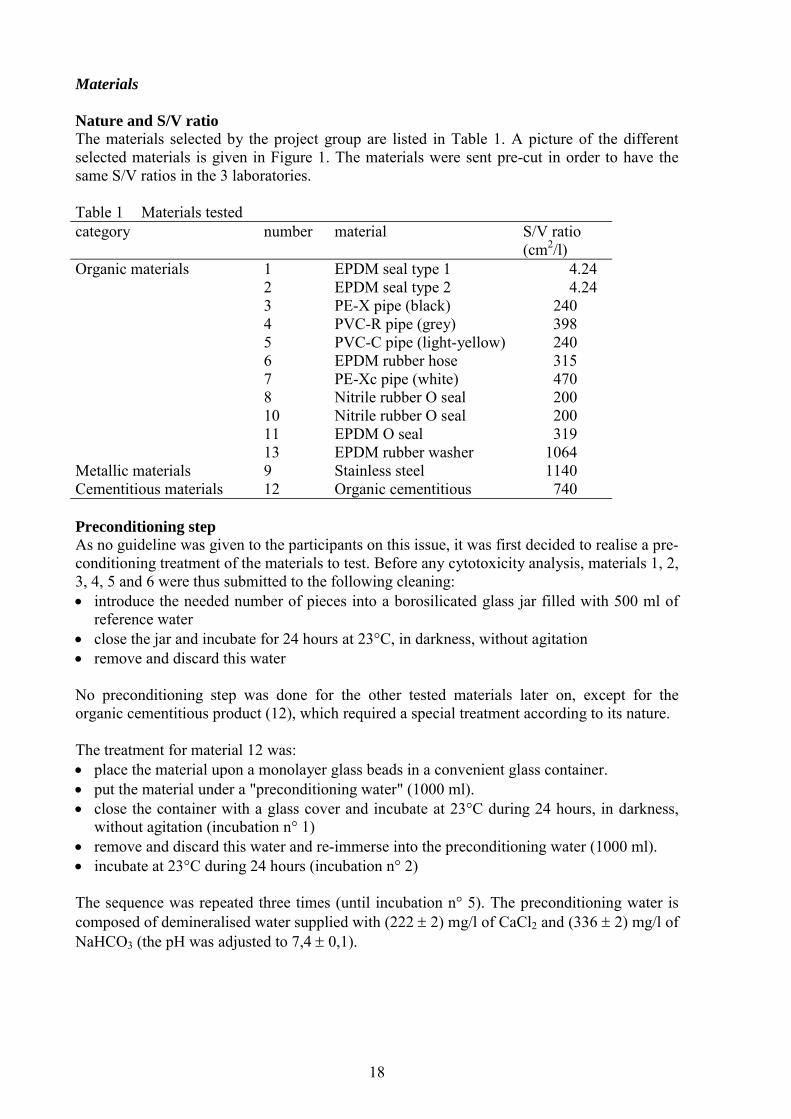
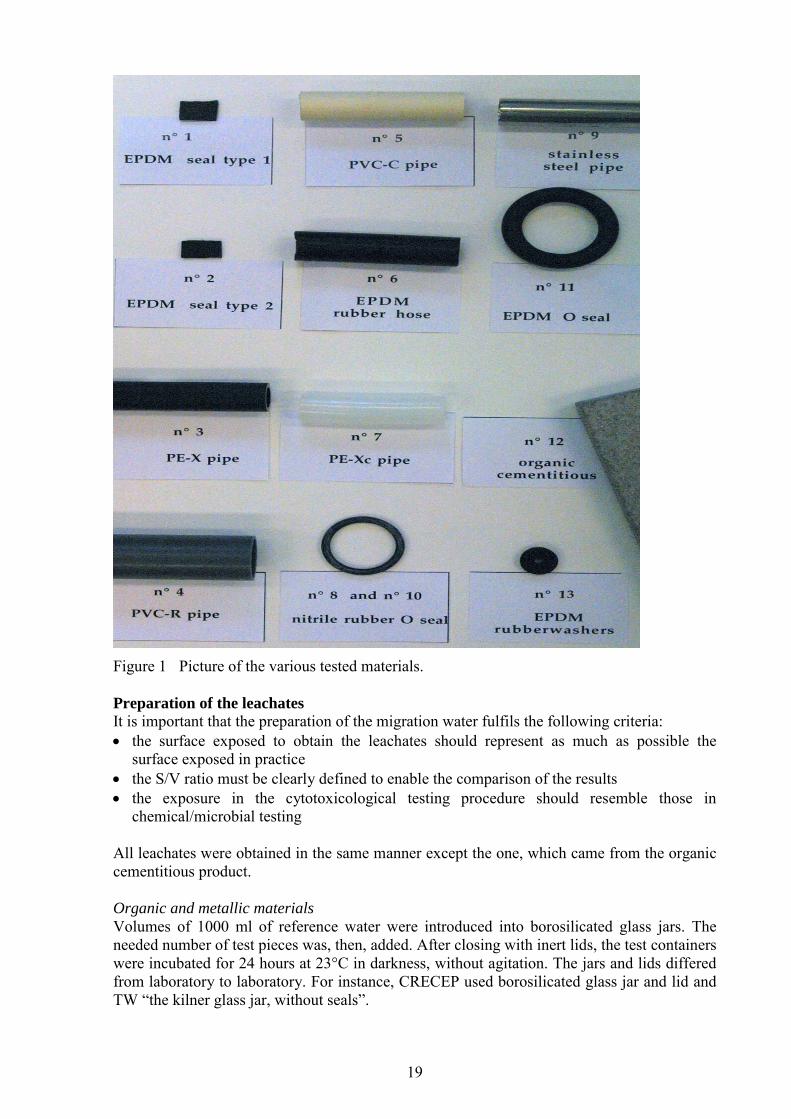
Nature and S/V ratioThe materials selected by the project group are listed in Table 1. A picture of the differentselected materials is given in Figure 1. The materials were sent pre-cut in order to have thesame S/V ratios in the 3 laboratories.
Table 1 Materials testedcategory number material S/V ratio
(cm2/l)Organic materials
Metallic materialsCementitious materials
12345678101113912
EPDM seal type 1EPDM seal type 2PE-X pipe (black)PVC-R pipe (grey)PVC-C pipe (light-yellow)EPDM rubber hosePE-Xc pipe (white)Nitrile rubber O sealNitrile rubber O sealEPDM O sealEPDM rubber washerStainless steelOrganic cementitious
4.244.24
240398240315470200200319
10641140740
Preconditioning stepAs no guideline was given to the participants on this issue, it was first decided to realise a pre-conditioning treatment of the materials to test. Before any cytotoxicity analysis, materials 1, 2,3, 4, 5 and 6 were thus submitted to the following cleaning:• introduce the needed number of pieces into a borosilicated glass jar filled with 500 ml of
reference water • close the jar and incubate for 24 hours at 23°C, in darkness, without agitation• remove and discard this water
No preconditioning step was done for the other tested materials later on, except for theorganic cementitious product (12), which required a special treatment according to its nature.
The treatment for material 12 was:• place the material upon a monolayer glass beads in a convenient glass container. • put the material under a "preconditioning water" (1000 ml). • close the container with a glass cover and incubate at 23°C during 24 hours, in darkness,
without agitation (incubation n° 1)• remove and discard this water and re-immerse into the preconditioning water (1000 ml).• incubate at 23°C during 24 hours (incubation n° 2)
The sequence was repeated three times (until incubation n° 5). The preconditioning water iscomposed of demineralised water supplied with (222 ± 2) mg/l of CaCl2 and (336 ± 2) mg/l ofNaHCO3 (the pH was adjusted to 7,4 ± 0,1).
19
Figure 1 Picture of the various tested materials.
Preparation of the leachatesIt is important that the preparation of the migration water fulfils the following criteria:• the surface exposed to obtain the leachates should represent as much as possible the
surface exposed in practice• the S/V ratio must be clearly defined to enable the comparison of the results• the exposure in the cytotoxicological testing procedure should resemble those in
chemical/microbial testing
All leachates were obtained in the same manner except the one, which came from the organiccementitious product.
Organic and metallic materialsVolumes of 1000 ml of reference water were introduced into borosilicated glass jars. Theneeded number of test pieces was, then, added. After closing with inert lids, the test containerswere incubated for 24 hours at 23°C in darkness, without agitation. The jars and lids differedfrom laboratory to laboratory. For instance, CRECEP used borosilicated glass jar and lid andTW “the kilner glass jar, without seals”.

20
cementitious materialThe material was placed upon a monolayer glass beads in a convenient glass container and putunder mineral water (1000 ml). The container was closed with a glass cover and incubated at23°C during 24 hours, in darkness, without agitation. The mineral water should fulfil thefollowing recommendations: • conductivity = 50µS/cm• pH = 8 ± 0,2• oxidability to KMnO4 < 0,5 mg/l O2• TOC < 0,5 mg/l C• TAC = 5 ± 0,1 °F or HCO3- = 61 ± 1.2 mg/L• silica = 25 -30 mg/l SiO2
These leachates were immediately investigated in cytotoxicity.

21
Waters composition/quality
The composition /quality of the different waters used in the test are described below
Purified water
Purified water is produced from tap water by successively conducting the followingtreatments: softening, reverse osmosis, passing through granular activated carbon, thenthrough mixed bed ion exchange micro-resin cartridges, ultra-filtration (cut-off threshold at10kd) and UV photo-oxidation. This purified water is used for the cleaning of the glasswareand for the production of the reference water.
Reference water
Pyrodistilled water or any water in glass bottle, which respects characteristics as follow:• resistivity (at 20°C) 6250-6750 ohm.cm• pH 6.9-7.4• SiO2 30-38 mg/l• Ca 10-11 mg/l• Mg 6.9-7.5 mg/l• Na 10-11 mg/l• K 5.5-6.2 mg/l• Cl 10-11 mg/l• NO3 5.5-6.2 mg/l• SO4 6-9 mg/l• HCO3 67-70 mg/l
The water shall be free from pyrogens and from any other organic substances, which couldinterfere with normal cell growth. It corresponds to the blank in the experiments and it wasused to prepare the culture media and leachates (with the exception of the experiments wherecementitious materials were tested).
UBA used purified water as reference water. The blanks, which were performed whenever anexperiment was carried out, always gave similar and good results showing that this water didnot affect the results of the test.
Migration water
Reference water that has been in contact with a specimen of the material under specifiedconditions.

22
Cell line
HeLa S3 cells (ATCC CCL 2.2) are derived from human cervical carcinoma cells. It is thefirst aneuploid, epithelial-like cell line to be derived from human tissue and maintained byserial cell culture. The three laboratories used the same cell line provided by CRECEP, thusall the partners performed the cytotoxicity using cells from a common origin and history.When a stock culture of the cell line was needed, it was stored in liquid nitrogen, after beingpreserved in the culture medium supplemented with DMSO (10 % V/V final) or glycerol (10% V/V final).
23
Reagents
Media and reagents for cell culture
The culture media, the foetal serum and the solutions used for the cell culture were sterile.Media should be stored in accordance with the manufacturer’s instructions.All the reagents must be of high quality grade.
Medium for maintenance of the monoloyer cells (1X medium)The following ingredients were mixed in a sterile bottle containing 800ml of sterile referencewater:• 100 ml of 10X Eagle minimal essential (Ref. Gibco-BRL 21430-020)• 30 ml of 7,5% sodium bicarbonate solution• 10 ml of 200mM glutamine solution• 10 ml of 100X solution of non-essential amino acids (Ref. Gibco-BRL 11140-035)• up to 1000 ml with reference water• 50 ml of bovine foetal serum• pH adjusted to 7.2± 0.1 with a solution of NaOH 1N (or HCl)
The HeLa S3 cells were maintained and cultivated without antibiotics as their presence couldinterfere with the assessment of CPDW leachate cytotoxicity. So, the absence of an eventualcontamination by mycoplasma was periodically controlled.
Concentrated culture medium (5,25X) for the cytotoxicological evaluation:• 50ml of 10X Eagle minimal essential medium• 15ml of 7.5% sodium bicarbonate solution• 5ml of 200mM glutamine solution• 5ml of 100X non essential amino acids• 25ml of bovine foetal solution
This last medium was not kept more than 3 days. When it was possible, fresh medium wasprepared for each experiment.
Solution for rinsing the monoloyer cells : PBS 1X
Dissociation reagent : 1 : 5000 versene solution
Chemical products
All the reagents must be of high quality grade.• 96% ethanol• Whatman paper 3MM for chromatography (46x57 cm).• Trypan blue 0.4% (P/V)• scintillation liquid for the counting of the tritium on dry filter.• a 3% (P/V) solution of sodium dodecyl sulfate (SDS) prepared in reference water• a 5% (P/V) trichloroacetic acid (TCA) prepared in reference water• potassium dichromate
Radio-labelled tracer

24
The measure of the RNA synthesis requires the use of a sterile radioisotope [5,6-3H] uridine(1.29 – 1.85 TBeq/mmol; 37 MBeq/ml). The tritium is a beta-particle emitter and as such issubmitted to regulation. Laboratories must get a specific authorisation and licences for itshandling and its disposal. Nevertheless, the tritium is included in the group 4 (lowradioactivity): it does not present any risk of irradiation or of external contamination, butcould lead to a risk in case of internal contamination (after accidental consumption).

25
Equipment
Equipment for the migration test
• Incubator or room, capable of maintaining the requested test temperature
Equipment for the preparation of the leachates
• Borosilicated glass jars with borosilicated glass lids• Glass containers• kilner glass jars without seals
The jars should have wide openings to allow the introduction of the samples.
Equipment for cell culture
• sterile culture flasks 150 cm2 (products Corning, Nunc, Falcon)• sterile bottles (1000 ml and 100 ml) made in borosilicated glass with lid in polypropylene,
used for the preparation of the culture media• sterile borosilicated glass tubes (incubation tube) with round-bottom and polypropylene
screw cap (16x100 mm), used for the incubation of the cells with the migration water• sterile PTFE magnetic bars (10x6 mm) (for the incubation tubes)• sterile centrifuge polypropylene conical-bottomed tubes (50 ml, single use and suitable for
the cell culture)• sterile pipettes (1, 2, 5, 10 and 25ml), (single use)• a laminar airflow work area, integrated, as far as possible, in a controlled dust room• an incubator capable of maintaining a temperature of (37±1)°C• a contrasting phase inverted microscope• usual laboratory equipment for cell culture
Equipment for the cytotoxicological inspection
• a centrifuge capable of centrifugation at 1000 X g• a stirring water bath calibrated to (37±0.5)°C• a multiposition (15-60 positions) magnetic stirrer without a motor• sterile polypropylene round-bottomed tubes with cap (6ml, for single use), used for
realisation of the kinetics• sterilised syringe filters 0.2 µm (Sartorius, Minisart NML etc…)• sterile syringes (5 and 20 ml) and needles for mixing the cells• variable volume micropipettes (10 or 20 µl, 100 µl, 1000 µl)• sterile tips for micropipettes• descending chromatography tank• vortexes• liquid scintillation counting system for measuring the tritium (β radioactivity)• scintillation vials• quartz drying-lamp (epiradiator) (this equipment is not essential)• pH meter (pH Boy type)• thermometer• Bunsen burner• cell counter (automated particle counter, haemocytometer, etc…)

26
• radioactive waste containers• a stop watch• an autoclave• refrigerator and freezers (-20°C and –80°C)• apparatus for purified water production• apparatus for pyrodistilled water production• an oven (550°C and 180°C)• 1.5 ml microtubes

27
Cleaning of the glassware
General information
• The cleaning of the glassware must be done very properly as it could affect the results.• When the tubes or the bottles become damaged or scratched, they should be replaced at
once. They are dedicated to this test and must not to be used for any other purpose.Moreover, they must never be in contact with any kind of non-ultra-pure water.
Cleaning liquids for glassware
• laboratory detergent : 5% (V/V) RBS 25 or 1% (V/V) Aquet, prepared in the referencewater or in purified water
• nitric acid bath : 5% (V/V) solution, prepared by dilution of 65% analytical grade nitricacid in the reference water or in purified water
• rinsing water for the glassware :• purified water or reference water• a calcium chloride solution (3,30g of analytical grade CaCl2.2H2O in 20 l of reference
water or purified water)
Glassware cleaning procedure
first step: rinsing and soakingRinse the glassware with reference water then soak it for 12 hours into detergent.Note : the incubation tubes lids should not come into contact with detergent. The lids are justrinsed with reference water and air dried.
second step (excluding magnetic bars)Two methods can be chosen for cleaning glassware at this stage: by hand or with a washingmachine supplied with purified water.
a) Use of a washing machine The washing up is taken out of the detergent bath, drained and washed in the machine usingthe following cycle:• warm rinsing at 85°C • cold rinsing • rinsing with a 20% acetic acid solution • cold rinsing • warm rinsing at 80°C.
The washing up is dried at room temperature.
b) hand washing The washing up is taken out of the detergent bath, drained and rinsed carefully with calciumchloride solution until the detergent is completely removed. It is dipped into a 5% nitric acidbath for at least 2 hours. Then it is rinsed with reference water and dried at room temperature.
third step• The incubation tubes are baked for 4 hours in a 550°C oven. After cooling, the magnetic
bars are added and the caps are fastened and autoclave for 20 min at 120°C under 3 barspressure.

28
• The lids are loosely screwed on the bottles for the preparation of the culture media. Thewhole is sterilised by autoclaving at 120°C under 3 bars pressure, during 20 minutes.
• The borosilicate glass containers and others jars are heated for 2 hours in a 180°C oven.
Special case: magnetic barsThe magnetic bar should only be washed by hand using the following method:• soak in detergent for 12 hours• drain and rinse with calcium chloride solution• rinse with reference water • air dry.
29
The cytotoxicity test method
Principle
Human cells (HeLa S3) are incubated, in suspension, in a culture medium reconstituted withthe leachate. After (19±2) hours, tritiated uridine is added to the culture and its speed ofincorporation into the cellular RNA is measured. After a lag phase of approximately 4minutes (which represents the time required by the uridine to penetrate into the cells), theRNA synthesis rate is linear. This linear phase lasts for at least 30 minutes and can be used toestimate cytotoxicity. The RNA synthesis rate is determined by calculating the slope of thestraight regression line corresponding to the experimental values of the kinetic ofincorporation of uridine. This rate is then plotted against that obtained for the blank,arbitrarily fixed to 100%. The results are expressed as a percentage of RNA synthesis inrelation to the blank. Thus, the total absence of toxicity of a sample is equal to 100%. Thistest was originally developed by Fauris et al (1985) to monitor raw water quality.
Blank or reference control
The blank or reference control consists of autoclaved purified pyrodistilled or only purifiedwater
Positive control
A positive control was analysed in all experiments in order to check the test system. It allowsto show, on the one hand, that the test truly measures the effect of toxic compounds on thecells and, on the other hand, that the test gives similar responses to a known toxic. It wasagreed to use potassium dichromate as positive control at the concentration of 2 mg/L (CI50),as it is done routinely by CRECEP (Hiddeh, 1987; Fauris and Vilaginès, 1998).
Description of the cytotoxicity test
Each leachate was submitted to a cytotoxicity investigation (or test) that was carried outsimultaneously in triplicate (three suspension cultures were prepared). Moreover, it wasstrongly recommended to test each leachate twice, aiming to perform two cytotoxicityinvestigations on the same leachate. Therefore, the RNA synthesis rate was measured twice,each measure being the average of three straight lines. CRECEP and UBA followed thisinstruction, if possible. The initial protocol described below concerned one cytotoxicityinvestigation (or test). The procedure has undergone modifications during this work.
Part one: Incubation of the cells with a potential toxicHeLa S3 cells were grown in a 1X medium in culture flasks at 37°C until confluentmonolayers were obtained. The cells were detached from monolayer cultures and countedprecisely. 12x106 cells were placed into a 50ml tube and were centrifuged. The resultingsupernatant was decanted and the cells re-suspended in 20ml of media containing the sample(dilution of the 5,25X medium with the negative control, the blank, the positive control or theleachate, resulting in a 1X medium), giving final concentration of about 600.000 cells/ml. 5mlof this cellular suspension were transferred into 3 glass tubes with a bar magnet, priorincubation for about 19 hours at 37°C, under agitation. The agitation must be homogeneousfrom one tube to another and must be adapted so that the cells are maintained in suspensionwithout any alteration of their integrity.
30
Part two: Measurement of RNA synthesisAfter homogenisation of the cellular suspension, a 500µl aliquot of these cells was treatedwith the 5,6 3H uridine to allow the RNA synthesis rate to be measured (at 37°C) over a 30minutes times period. This was done by sub-sampling the 500µl aliquot after the uridine isadded. In practice, 40µl sub-samples were immobilised on chromatography paper (pre-treatedwith SDS that lyses cells) 5, 10, 15, 20, 25 and 30 minutes after the addition of the uridine.The descending chromatography was then realised in TCA in order to separate the variouscomponents of the cells: those that are acido-soluble were swept along by the TCA. Nucleicacids (RNA and DNA) and proteins only remained on the area of the deposits. The amount ofuridine in the areas where each aliquot had been deposited was measured by scintillationcounting.
Duplicate 40µl sub-samples were also immobilised on un-treated chromatography paper.These samples did not undergo chromatography and were counted directly by scintillationcounting to determine the total amount of radioactivity that had been introduced in each tube.This allows to compare the amount of radioactivity incorporated by the cells and the initialamount of radioactivity introduced into their contact.
Part three: Treatment of the resultsThe scintillation counter gave a reading of uridine activity in counts per minute (cpm) units.The cpm values of uridine incorporated into the cells were compared to the total radioactivityintroduced in the tube and the results were expressed as a percentage of tritium incorporation.
In addition to the original French method of calculation, two new methods were applied to thedata (only for the cytotoxicity assessment of the various materials) in order to compare thedifferent ways of calculation. The participants wanted to ascertain that the original Frenchmethod of calculation do not have an influence on the results.
a) First mode of calculation: French calculationPercentage incorporation of uridine in each sample was plotted on a graph against time and aline of best fit was added. The equation of the straight line (y=ax+b) and the correlationcoefficient (R2) were determined. Three replicates were performed for each cytotoxicityinvestigation, therefore three straight lines of best fit were produced.
The data of the different kinetics are given in an excel document to make the calculations(linear regression equation, average of rna synthesis percentage…) and to draw thecorresponding graphs. Information for easy reading and understanding of these excel files arepresented in Annex 1.
The kinetics are validated when:• "a" is greater than 1,75 in the blank tubes. In absence of a toxic, cells must be in perfect
health. In this case, the incorporation of the uridine in the cellular RNA is not affected. Thestudy of blanks during 10 years in CRECEP showed that a good incorporation of the radio-element was obtained only if the slope of the straight line of the blank reaches at least 1.75.This criteria was integrated in the French Standard XP P 41-250-3 in 1996.
• "b" is negative in all the experimental tubes. After labelled uridine was added, a fewminutes is required for it to enter the cells. b represents this lag period and, accordingly, itmust be negative.
• the coefficient correlation (R2) is ≥ 0.98 (a perfect straight line has a R2 equal to 1).• at least two out of the three slopes (a) values are in the same accuracy range
But two additional comments must be taken into account for the treatment of the results:
31
1) Usually a kinetic is plotted taking the 6 experimental values (points 5, 10, 15, 20, 25 and30 minutes), but sometimes, it happens that one value is obviously outside the straight lineof best fit. This point is, therefore, omitted and the linear regression equation is determinedaccording to the 5 other time points. Under certain circumstances, the last data (30minutes) is omitted because the limit of linearity of the kinetic is reached.
2) One of the three straight lines can be excluded from the calculation, because of a differentaccuracy of range and/or of the pointing out of disturbing events in an incubation tube suchas white clumps (bad physiological condition of the cells, inadequate agitation etc…) orred colour (changes of the medium pH due to scratched vessels or insufficient cleaning ofthe glassware).
The slope of the validated straight lines for each sample (RNA synthesis rate) wasdetermined. The average slope value of the leachate, positive control and the blank were,then, calculated. The percentage of RNA synthesis of the blank is arbitrarily fixed at 100 %(absence of toxicants). The percentages of RNA synthesis of the leachate or the positivecontrol were expressed in relation to the blank: (average slope value of the leachate or thepositive control / average slope value of the blank) x 100. One further criteria for satisfactorycytotoxicity test performance should be met : Cell concentration should increase by 50%during incubation in the blank tubes (proof of a sufficient growth of the cells during theincubation)
b) Second mode of calculationAs previously, the cpm values of uridine incorporated into the cells were compared to thetotal radioactivity introduced in the tube and the results were expressed as a percentage oftritium incorporation. For each cytotoxicity investigation, 3 (or 6) replicates were obtained.So, for each time of a kinetic, the average of these 3 (or 6) values and the associated standarddeviation were calculated using Graph Pad Prism 4 software. The replicate values can beaveraged because they represent replicate measurements from the same organism. Thissoftware is currently used for toxicity assessment (IC 50 etc…). Further analysis wasconducted by plotting the mean of percentage incorporation of uridine of the sample as afunction of time. Thus, only one straight line of best fit was produced. The best fit for thislinear regression was chosen by the software under the option "robust to outliers". This robustmethod basically replaces the assumption of a Gaussian distribution with a Lorentzian one.Therefore the possible effects of outliers are minimised. It shall become part of a new versionof Prism along with detailed explanation.
Validation of the regression line was done when "a" was greater than 1.75 in the blank(perfect cell fitness) and "b" was negative in all the samples (correct uridine incorporationinto the cells). Data points were only excluded based on experimental grounds (a tube lookingfunny, abnormal microscopic blank cell aspect, bacterial contamination of the cells, vessel'sproblem…).
c) Third mode of calculationAs previously described, the cpm values of uridine incorporated into the cells were comparedto the total radioactivity introduced in the tube and the results were expressed as a percentageof tritium incorporation. For each cytotoxicity investigation, 3 (or 6) replicates were obtained.So, for each time of a kinetic, the average of these 3 (or 6) values and the associated standarddeviation were calculated using Excell software. Further analysis was conducted by plottingthe mean of percentage incorporation of uridine of the sample as a function of time. Thus,only one straight line of best fit was produced. The best fit for this linear regression waschosen by the software using a Gaussian distribution (linear regression option), where the
32
effects of outliers are not minimised. The slope and the corresponding standard deviationwere determined taking into account all the data, and not by using the average values.
The validation of the regression line was made as mentioned above [a > 1.75 ; b < 0 ; absenceof experimental problems]. Data points were only excluded based on experimental grounds.
The pass/fail criteria for first mode of calculation
The RNA synthesis rate results were used to determine whether each material was suitable orunsuitable for use in water distribution systems.• materials with ≥ 70% RNA synthesis rate compared to the blank pass the test (French
Standard).• materials with ≤ 70% RNA synthesis rate compared to the blank fail the test (French
Standard).
The 70 % limit is set because, below this level, cellular modifications are observed such asincreased granulations, lysosomal hypertrophy, release of proteolytic and nucleolytic enzymes(acid RNAses) or decrease of rRNA /m RNA. It signifies that this parameter measures adegree of dysfunction of the cell, which occurs before cell death (Fauris and Vilaginès, 1998;Fauris et al, 1988). Comparison between this test and the cellular attachment inhibitionmethod confirms this limit too (Fauris et al, 1986).
33
STAGE 1: REVIEWS OF APPLIED CYTOTOXICITY AND GENOTOXICITYTESTS
Objectives
The main purposes of this stage were:• to make a review of the cytotoxicity tests that are currently applied in various countries
(description, and guidelines, regulations, practices if possible). That bibliographic workmight lead us to point out the improvements that could be achieved on the selectedcytotoxicity test, the RNA uptake inhibition test.
• to make a review of the presently available genotoxicity tests to determine if one or a set ofthem could be adapted for assessing CPDW.
During the last decades, numerous toxicity tests have been developed based on • animal experiments• studies on a whole organism
− aquatic organisms as daphnia, algae, mollusc, protozoan, phytoplankton, fish etc…− yeast− bacteria
• studies on animal or human tissue or cell.
In the environmental field, hazard identification and risk evaluation were related to resultsderived from animal experiments. This reliance on animal data , however, brings up a numberof problems and concerns. Such traditional tests are time consuming, expensive andassociated with ethical questions. Moreover, the results must be extrapolated from animalmodels to humans in order to assess their relevance and this can't be accomplished withoutintroducing a significant degree of uncertainty (Balls et al, 1990 ; Koëter, 1995). Thus, newalternative approaches have been proposed (Koëter, 1995 ; Ekwall, 1983). They aresummarised in this bibliographic review. We have not attempted to give an exhaustiveaccount of the published literature, but have instead focused on tests, which either have beenfrequently used in aquatic ecosystems (waste water, surface water…) or could be candidatesfor the assessment of CPDW toxicity.
Cytotoxicity review
Cellular toxicity mechanism interferes with membrane integrity and metabolic pathways. Itinhibits or stimulates enzymatic reactions leading to cellular damage and death (Fauris et al,1997).
Toxicity evaluation by aquatic organisms
The assays described in this chapter are of great interest to detect the degree of pollution of anaquatic ecosystem. Nevertheless, the main drawback is often a lack of reproducibility becauseof the variability in maintenance conditions and the differences in tested organisms (healthstatus, age, species, genetic uniformity…) (Buikema et al, 1982; Fauris et al, 1997). Specialattention is given to these tests due to their use at large scale in environmental toxicology,even though they are not suitable for the detection of toxics in trace amounts as required forCPDW (low sensitivity).

34
PhytoplanktonDue to its crucial role in aquatic systems, several surveys have been concerned with the use ofphytoplankton as model organisms for assessment of the toxicity of chemicals. The testsdetermine the mortality increase of the exposed populations. However, the sensibility ofphytoplankton varies widely, depending upon both the species and environmental conditions.Actually, phytoplankton show a high degree of diversity and the composition and structuresof the cell wall (which mainly govern the entry of xenobiotics into the cell) differ among thedifferent species. Moreover, the results can't be easily extrapolated from these aquaticorganisms to humans. The predictive value of these toxicity tests in a sanitary point of view istherefore limited (Isomaa et al, 1994).
AlgaeBioassays with single-celled algae have been exploited extensively over the past 20 years forthe determination of toxicity of complex effluents, polluted freshwater aquatic systems andspecific chemicals. The standard test measures the inhibition of algal growth rate over 72 hrexposure to a toxic (Kooijman et al, 1996; El Jay, 1996).
These growth inhibition tests are time-consuming, rather costly and present a lowreproducibility. They can't detect sub-acute endpoints and therefore show a lack of sensitivity.Alternative toxicity test based on enzymatic activity in algae has been developed but their useis also limited to effluents and freshwater aquatic systems (Peterson and Stauber, 1996).
ProtozoanToxicity tests utilising Protozoans differ strongly in their methodologies : The techniqueseither measure the growth inhibition, the decrease of respiration, the inhibition ofchemoattraction or the loss of coordinated movements (Isomaa et al, 1994). These methods are quite adequate to monitor the quality of polluted waters but are notsufficiently sensitive to detect toxic agents at concentrations within the limits specified fordrinking water and accordingly for CPDW (Slabbert and Morgan, 1982).
MolluscsMany different species of molluscs have frequently been used in water quality screening testsand many different methods have been applied in toxicity testing (enzymatic inhibition,activity behaviour, lethality…).The same drawbacks, as those described above, can beacknowledged (Isomaa et al, 1994).
FishesFishes as rainbow trout can act as indicators of sub-lethal toxicity. Four measures of theirbehaviour can be easily tested (spontaneous swimming activity, swimming capacity, feedingand vulnerability towards Micropterus salmoides). These behavioural responses can yield amore comprehensive assessment than would be provided by mortality alone. Thus, thismethod can predict the toxicity of single chemicals (present in adequate amounts) or complexeffluents very well (Little et al, 1990; Lee et al, 1995).
DaphniaDaphnia magna has been extensively used as indicator of toxicity for several decades andtests to assess both acute and chronic toxicity have been standardised (European Standard NFEN ISO 6341, 1996 - OECD guideline 202). The assays are usually performed with less than24 hour-old Daphnia neonates.
In the acute toxicity tests, immobility after 24h or 48h of contact with potential toxics is usedas an endpoint equivalent to death, as death may be difficult to ascertain. An effective
35
inhibitory concentration, called CE50, is calculated. It corresponds to the initial concentrationof products which causes a 50 % of immobility of the tested Daphnia neonates (Isomaa et al,1984 ; Lilius et al, 1995).
Under good culture, Daphnia females reproduce parthenogenetically, and a parthenogeneticclone derived from a single female is genetically uniforme. Cultures with geneticallyhomogenous animals are, therefore, obtained. Nevertheless, the sensitivity of Daphniatowards toxic agents can vary according to their age and their origin (Isomaa et al, 1994).In the chronic tests, survival time and number of young produced per female are used asendpoint. The female neonates are exposed to a range of concentrations of the potential toxicsduring a period of 21 days. Survival and number of offspring are observed on a daily basiswhen food is supplied. Variability in the results can be noticed because of lack ofreproducibility in Daphnia reproduction. Reproduction can, indeed, be affected indirectly viaeffects on feeding, growth or maintenance (Kooijman and Bedaux, 1996).
Toxicity evaluation by yeast
Another approach for assessing toxicity is to monitor sensitive, non-specific, subcellulartarget sites such as mitochondria. Changes in mitochondrial function (respiratory activity) canindicate a toxic effect. It was found that the respiratory function of the yeasts is aphysiological function very sensitive to the action of the toxic substances. As this function isdependent on the concentration of oxygen in solution, it can be assessed by means of anamperometric oxygen sensor (Haubenstricker et al, 1990; Campanella et al, 1995). Methodsbased on the changes of the respiratory activity of Saccharomyces cerevisiae, immobilised onan agar gel containing the culture medium have been developed. Several toxic substances (heavy metals, organic pollutants) can be detected by this test.However, biosensor sensitivity to agents clearly varies related to the chemical nature of thepollutant. This method can be adapted to industrial waste water control (Campella et al,1995).
Toxicity evaluation by bacteria
Bacteria, as a prokaryotic organism, differs strongly from eucaryotic cells (lack of nucleus,presence of a cell wall and/or a capsule, absence of numerous intra-cellular structures…).Furthermore, they possess a high adaptive ability. For these reasons, bacteria may be lesssensitive to toxicants than animal or human cells, and their reliance as models in toxicityassessments may be limited.
Though, much attention has been paid to the effects of pollutants on bacteria, because they arecheap to culture, easy to handle, have a rapid growth rate and give reproducible results underthe same experimental conditions. Measurements can be taken quickly, and automation of theprocedures is often possible (Isomaa et al, 1994; Fauris et al, 1997). Several tests have beenproposed and divided into five categories, according to the kind of parameter used to assessthe toxic effect. The sensitivity of the different assays differ greatly accordingly with theparameter used (Torslov, 1992).
Bacterial growth assaysLiu et al (1989) developed a simple and rapid method, known as "the growth zone inhibitiontest", for determining the toxicity of a chosen chemical or a mixture of substances, using.Bacillus cereus as the test organism. The potential toxicity can be easily demonstrated at alow concentration and a linear relationship between the concentration of toxicant and thediameter of the clear inhibition zone on the agar plate can be established. Variations in the

36
results may be due to differences in experimental conditions and to differences in theassessment of the diameter of the halos (Ghosh et al, 1996).
Other methods detect the inhibition of growth by measuring the increase in cell density with aspectrophotometer (optical density values) after a 16h incubation time (Torslov, 1992).
Cell energy assaysATP is an energy carrier in all living bacterial cells, linking catabolism and biosynthesis. Theturnover time for the intracellular ATP pool in bacteria is very short (< 1s) enabling a rapidresponse of the micro-organism to changes. Its rate decreases rapidly when the cell dies or issubjected to an harmful compound which creates injury of membrane functions and /orrespiratory system. Bacterial ATP content is determined by the ATP-dependent firefly-luciferase reaction which is known to be the most rapid, sensitive and reproducible assay forquantitation of this nucleotide (Steinberg et al, 1995).
Motility assaysSpirillum volutans (ATCC 19 554) exhibits a characteristic reversing motility pattern due tothe presence of a fascilce of polar flagella at each end of the cell. In the presence of pollutants,the bacteria loses its coordination and motility. Three endpoints (loss of reversing motility,loss of forward motility and total loss of both flagella movement) are used to determineeffective concentration of a toxic agent required to remove typical motility in 90 % or aboveof bacterial cells (Gosh et al, 1996).
Enzyme activity assaysInhibition or activation of enzymes which are linked to metabolic pathways can assessdamages occurred in the cell. Esterase activity is involved in intra- and extracellulardegradation of organic substances and act as indicator of general heterotrophic activity. Thismethod is not sensitive to all chemicals reflecting their specific modes of action. Thus, it canbe applied for detecting specific pollutants but not for giving a global health risk assessment(Torlov, 1993).
Bioluminescence assaysBacterial luminescence has been extensively used as a tool in toxicity assessment of aquaticecosystems. A bioassay is commercially available under the trade name Microtox whichmeasures the inhibition of bioluminescence of Vibrio fisheri (formerly identified asPhotobacterium phosphoreum). The experimental procedure has been adapted for the officialstandards of several countries (NF EN 11348-1,2 or 3…).
This bioassay is a direct test measuring bioluminescence reduction or stimulation in livingcell suspension of Vibrio fisheri. The process of bioluminescence involves luciferase andseveral other related enzymes (e.g. electron transport). These enzyme systems are modified byone, or both, of two possible mechanisms : a direct action on bioluminescence activity or anindirect action by general cytoplasmic poisons which interfere with essential and relatedmetabolic processes. The changes in the light output of the luminescent bacteria are detectedphotometrically and are proportional to the degree of toxicity. The method is simple and rapid(the incubation time is usually between 5 and 15 minutes (Thomulka et al, 1993; Ribo, 1997).It has been validated by comparison with other bioassays and by inter-laboratory surveys,testing a large variety of products : it appears to be sensitive, reproducible and suitable for theassessment of the global toxicity of polluted waters (Kahru and Borchardt, 1994; Ribo, 1997). However, the very short incubation time may be a drawback. This time could be too short forsome compounds to equilibrate between the external medium and the cytoplasm and, also, for

37
certain cellular damage to manifest itself (Isomaa et al, 1994). CRECEP compared themicrotoxicity of pesticides assessed by the Microtox method and the uridine uptake inhibitionassay. Measurements performed with the Microtox kit appeared to be less sensitive and lessreproducible. The lack of reproducibility could be explained by the difficulties encountered todetect the toxicity of low water soluble compounds ((Somarundaram et al, 1990; Lefebvre,1994).
This procedure has been adapted to create a biocaptor that uses the immobilised luminescentVibrio fischeri bacteria as a continuous biological reagent in order to follow in situ the qualityof complex effluents (Osbild et al, 1998). Another possible application has been theconstruction of recombinant Escherichia coli cells, containing stress specific promoters orconstitutive promoters fused to luciferase genes originating from Vibrio fischeri. Thesegenetically engineered cells are immobilised in 96 well plates. Bioluminescence outputsdecreased or increased dose-dependently upon adding test chemicals. This new biosensorhave not yet been compared enough with other toxicity tests, but it could be furtherharmonised and could become an adequate tool for the evaluation of toxicity (Kim et al,2003).
Toxicity evaluation by animal or human cell
A number of cell types are capable of survival and division in vitro. Monolayer cell culturesexhibit a morphology that is related to tissue architecture and allow cell migration, adhesionand contact regulation to be studied. Suspension cultures, on the other hand, are mostly usedwhen large cell population are required, e.g when low enzymatic activities is to be checked,metabolic pathways studied.
Cell cultures are usually classified as primary cultures, cell lines or cell strains. Primary cellcultures are obtained by culturing, for more than 24h, dispersed cells from tissues or organstaken directly from organisms. Cell lines are subcultures derived from a primary culture ; theymay be diploid, established or clonal. For cell line to be diploid means that no less than 75 %of all its cells must be of the same standard karyotype as the origin species. Established celllines derive from primary cultures or diploid cell lines by transformation processes which areeither spontaneous or induced by viruses, chemical or physical agents.
Clonal cell lines derive from the mitosis of a single cell. They can be obtained from primaryculture, diploid or established lines by several techniques. A cell strain is obtained from aprimary culture, diploid or established cell line by selecting a small number of cells that havea common biological characteristic. This characteristic must persist during subsequentculturing but the ability of specialized cells to perform specific functions in culture issometimes difficult to maintain (Paganuzzi Stammati et al, 1981).
Because they are far easier to handle and give more reproducible results, cell lines are ratherpreferred to primary cultures. Consequently, only toxicity tests performed with cell lines aredescribed in this chapter.
Some factors are known to be important to the quality of cell culture response to toxic agents: • the way the cells are exposed to compounds as well as the physical and chemical
environment in which the experiment is carried out:− The sample to be tested may be present in a solid form : a preparation of migration
water or an extraction are therefore required. These procedure should be clearly defined,because toxicity varies according to the concentration or extraction techniques, for theymay distort the actual sample chemical composition

38
− Testing volatile chemicals leads, on the one hand, to a significant loss of the chemicalduring the test, the results becoming thus altered, and, on the other hand, to a possiblecross contamination if other tests are realised in the same incubator.
− The choice of the best exposure time period should be also taken into consideration. Asthere is no standard by which these criteria can be decided and as it is related to thegrowth rate (an adequate number of cells in perfect health is necessary to obtain reliableand reproducible results), a preliminary study of this last parameter should beundertaken before any analysis.
− Experiments should be performed in conditions where environmental factors(temperature, sterility, humidity, gas composition…) are closely controlled.
• the cell culture medium may modify the behaviour of the toxicant. The most importantcomponent in the medium is the serum, which, through binding the test substance, maycause a masking of toxicity (Syversen, 1994; Frasier and Bradlaw, 1989). Metabolismmodifications can be acknowledged with diverse organic buffers such as Hepes (ClaudeDanglot, personal communication).
• The use of plastic dishes and containers can interfere with the sample (adsorption onto theplastic surface), with the culture medium (adsorption of proteins onto the plastic surface)or can release chemicals (Syversen, 1994).
• The cell culture conditions (cells in suspension, monolayers) can also affect the results.When cells are in suspension, their surface in contact with the toxic compounds is moreimportant than the one available in monolayer cells (Claude Danglot, personalcommunication).
• The selection of the adequate biological system should reflect the purpose of the researchas numerous cell lines are available : HeLa cells, HepG2 cells, human lymphocytes, CHOcells etc…. The cell line must be subjected to a constant scientific evaluation (cellcharacterisation biochemically and morphogenically, absence of contamination, origin,number of passages etc…). Confounding factors can affect cell growth and thereforeshould be closely controlled : pH of the culture medium after addition of the sample to betested, osmolarity of the culture medium, cleanliness of the glassware… Thus, it isessential that these tests are carried out and supervised by scientific staff experienced withculture techniques and cell line morphology (Syversen, 1994; Frasier and Bradlaw, 1989).
It is often advantageous to select human cell lines that are closer to harmful human response.One should, also, keep in mind that the results must be extrapolated from cells to an entirecomplex organism in order to assess their reliance.
The aim of these cytotoxicity tests is to show the degree of cellular damage caused byexposure to a sample which contains potential toxicants. A control cell population is tested inparallel and the objective is to determine the difference between the control and treatedpopulation. Many endpoints are possible and they do not necessary provide comparableinformation. The range includes loss of membrane integrity, release of cytoplasmic enzymes,loss or decrease in metabolic processes, cessation / reduction of DNA or RNA synthesis,inability to continue cell replication etc. (Harbell et al, 1997).
Counting methods a) Direct cell-counting assays
Methods of direct cell counting have been extensively used since their set up in 1959 (Harris,1959). Cell number determination can be achieved using a contrasting phase invertedmicroscope and a haemocytometer or using an automated particle counter. Dose-response curves to pollutants can be plotted, the values of IC50 are deduced showingpotential toxic effect of the substances. Most reproducible results are obtained when countingis performed with a multisizer particle counter (Jantova et al, 1996).
39
b) The cellular attachment inhibition methodCells in perfect physiological condition possess the ability of anchorage on any surface. It hasbeen demonstrated that cells incubated with a toxic present a delay in their adhesion propertyby changes in the cytoskeletal organisation (Sit, 1996). The importance of the delay is closelyrelated to the concentration of the toxics.
Typically, cells are grown in suspension in a culture medium reconstituted with the sample toanalyse. After growth, they are placed in a flask filled with culture medium at a controlledtemperature and the cells still in suspension are counted at regular periods of time. Thepercentage of non anchored-cells is compared to the one obtained with the blank and gives anestimation of cellular damages.
This method has been applied for the measurement of the amounts of toxic compoundsleached from materials used in water distribution networks. Measurements has beenperformed on a great number of different materials and allowed to classify the materials froma sanitary point of view. Though, this technique is labour intensive, is not easily adaptable forroutine analysis and presents a wide inter-laboratory variability which affect the results(Fauris et al, 1986).
c) Colony forming ability (CFA) assaysThis technique determines the proportion of single cells in a cellular population able to giverise to growing colonies. Actually it measures cell recovery or cellular sublethal damages /cell death after exposure to a toxicant. The cells are generally treated with the sample to betested and then subcultured at low density in absence of the toxicants. Only the reallysurviving cells are able to divide and form colonies (Wite et al, 1996 ; Biosafe Paper report2002). A number of considerations limit the usefulness of the CFA test:• single cell suspensions are not always obtained after trypsinization and clumps may form
with the consequence of survival being either under or overestimated• the plating efficiency of each cell types tested should be determined because it varies
widely among cell lines ranging from 1 to 90 %• the results of an experiment may require waiting from 1 to 3 weeks depending on the cells
(different growth rates)• this test can be expensive, time consuming and labour intensive, particularly when many
samples are being processed.
However, when used properly, the CFA assay is highly sensitive (Cook and Mitchell, 1989).
Biochemical methodsThese tests mainly include the determination of the major intracellular components (DNA andproteins) which reflects the cells number and the measurement of DNA or proteins synthesis.
a) DNA and total protein content assaysWhen a toxic substance interferes with growth or causes the death of all or a part of theexposed cell population, a decrease occurs in the cell number and therefore a decrease inglobal DNA and protein amounts. The total protein or DNA contents are compared to those ofcontrol cultures (Clemedson et al, 1996).
Cells are treated with the test agents for 24, 48 or 72h. Then the total protein content isdetermined, after lysis of the cells, according to Lowry or Bradford procedures, using bovineserum albumin as a standard. The method can be adapted into an automated microplate assayin order to be able to test numerous samples at one and the same time. Dose-response curves
40
tend to be very different for various types of cells and for different classes of toxicants.(Clemedson et al, 1996; Jantova et al, 1996 Harbell et al, 1997). Moreover, this method isnot sensitive enough to detect trace amounts of toxicants (Fauris and Vilaginès, 1992).
An automated micro-method has been set up for quantitation of DNA using the Hoechst33342 dye that possesses the ability to bind DNA.
b) DNA and protein synthesis assaysThese tests are based upon the measurement of the inhibition of DNA or protein synthesis incells in presence of toxicants. DNA synthesis and protein synthesis are known to be directlyproportional to growth rate (Witte et al, 1996). The synthesis can be determined either by anend-point method or by a kinetic assay. The first method is not described in this reviewbecause of its obvious lack of reproducibility.
For DNA synthesis investigations, cells are incubated in a culture medium prepared with thetoxics or blank solution. The reaction is then started by addition of [3H]thymidine to the cells.The DNA synthesis is measured by kinetic uptake of the radiolabelled thymidine. The resultsare expressed as a percentage of DNA synthesis in relation to the blank. As DNA synthesisjust takes place in the S-phase of the cell cycle, the sensitivity of the assay strongly decreaseswhen the cells divide randomly. A synchronous cultivation system should be introduced in theprocedure.
Protein synthesis is determined as described for DNA by replacing [3H]thymidine by[3H]leucine. This method requires, for cell growth, the preparation of a specific culturemedium without any leucine. It has been shown that this method possesses a lowreproducibility (Fauris et al, 1985).
Protein precipitation can also measure a chemical-induced cytotoxicity. The endpoint of thisnew method corresponds to the minimum effect concentration (MEC) that induces proteinprecipitation in 5 hours exposure with respect to the negative control. Its low sensitivity ispossibly due to its shorter exposure period and because precipitation is the ultimate event inthe sequence of a protein disturbance. However, this assay is simple, inexpensive and rapidbut further investigations are required to obtain a complete characterization of the test(Novillo et al, 2001).
Viability assaysViability assays are based on the integrity of the cell membrane. Different kinds of dyes canbe used to assess the membrane damages of cells exposed to toxics. According to itscharacteristics, the dye may enter and be retained into viable or dead cells. The cell populationviability is directly related to the dye concentration.
The counting of the two populations (dead and alive) can be assessed by microscopyexamination, by flow cytometric technique, or more often, by microplate spectrophotometricor spectrofluorimetric reader (Cooke and Mitchell, 1989).
a) Exclusion or lethal dyesMembrane damages can allow large bulky, charged molecules which are normally excludedby cells to access to the cytoplasm. If the molecules have special light-absorbing orfluorescent properties, then damaged cells can be readily identified by conventionalmicroscopy or by spectrofluorimetric techniques (Fauris et al, 1997).
41
The classical example is the trypan blue exclusion assay. Under bright field microscopy, deador damaged cells are stained light purple violet whereas undamaged cells appear translucide.Other variations include fluorescent dyes, for instance, propidium iodide that in the case ofmembrane damage can bind to nucleic acids and becomes highly fluorescent, the cellcounting is therefore carried out using flow cytometric reader (Marsteinstredet et al, 1997). Several serious drawbacks of die exclusion essays have been figured out:• the subjectivity of microscopic methods : the operator counts dead, damaged and viable
cells according to his own appreciation under microscopic observation• the lack of reproducibility of the tests : the procedure needs to be closely standardized to
prevent the interaction of factors, such as dye concentration, pH, dye contact period,presence of serum, on the results (Tolnai, 1975).
• the low sensitivity of the technique : a pre-concentration of the sample for CPDWcytotoxicity assessment is required and can modify its toxic properties (Fauris et al, 1997)
• the possible underestimation of cellular damage : the detection of toxicants does not occuruntil membrane integrity is lost within the population. This implies that cytotoxic eventsthat produce damage at other sites of the cells may go unnoticed (Cook and Mitchel, 1989).
b) Inclusion or vital dyesThese dyes only enter living cells. Thus, after treatment with a toxicant, viable cells appearstained whereas damaged or dead cells are still translucide.
The neutral red assay (NR assay) has been extensively used and is based on incorporation ofthe dye into lysosomes of viable cells by passive transport across the plasma membrane due tothe differential pH between the inside of the lysosome and the surrounding cytoplasm. The amount of neutral red taken up by the cell population is directly proportional to thenumber of viable cells in the culture. A test using 96 wells microplates has been developedand allow an automated spectrophotometric reading (Harbell et al, 1997; Zuang, 2001).
The rhodamine 123 gives information concerning the total mitochondrial activity andtherefore can be used to evaluate the cytotoxicity of samples. The method is sensitive butlabour intensive and not easily adaptable to routine analysis (Biosafe Paper, 2002).
Enzymatic activities assaysTechniques that measure isolated enzymatic activities often present a good sensitivity towardsspecific toxic agents but, a lack of sensitivity towards other toxicants. Consequently they aretoo selective and not suitable for global cytotoxicity assessment (Fauris and Vilaginès, 1992).Two pesticides (lindane and an organochloride pesticide), for instance, are known to inducefree radical toxicity which can be specifically detected by following the activity of twoenzymes involved in xenobiotics detoxication process : superoxide dismutase and glutathiontransferase (Descampiaux et al, 1999).
a) The MTT (3 (-4,5-dimethylthiazol-2-yl) 2-5 diphenyl tetrazolium bromide) activityassay
This assay is the most widely used for cytotoxicity assessments regarding cosmetic industryor materials safety (polymers, cements, ceramic…) (Chiba et al, 1989; Taniguchi et al, 1994;Schweikl and Schmalz, 1996; de Souza Costa et al, 2003). It has been developed byMosmann in 1983 and improved by Denisot and Lang in 1986 (Sauvant et al, 1997).
It measures the cell ability to produce ATP by evaluation of mitochondrial succinatedehydrogenase activity with a tetrazolium dye.. In this NADH-dependent reaction catalysedby succinate dehydrogenase, MTT dye serves as hydrogen acceptor and is reduced toformazan. In its oxydized form, MTT is yellow and somewhat water-soluble, on reduction the
42
colour turns blue-black and the dye precipitates. This reduced form can be measured byspectrophotometry. Under defined conditions, the amount of reduced MTT per unit of time isproportional to the cell number.
Typically, two sets of cells, treated and untreated, are allowed to grow for several days. Then,the dye is added and the quantity of formazan produced is determined at 565 nm. The treatedcells exhibit a lower production of formazan (Cook and Mitchell, 1989 ; Harbell et al, 1997).This test is rapid, reliable, inexpensive, with an automated processing that allows thetreatment of a large number of samples in a short time (Schweikl and Schmalz, 1996).Though, it should be noted that diverse toxicants can interfere with the mitochondrial activityby increasing the reduction of MTT (as surfactants at doses which increase membranepermeability without lysis the cells). Moreover, an extraction step is required to solubilize theformazan in an organic solvent (DMSO, isopropanol). This step introduces a factor ofvariability in the results (Ishiyama et al, 1996).
Lastly, although cells may be mortally wounded by a drug, they may still retain membraneintegrity for a relatively long time. Under these circumstances, this method misses criticalcytotoxic effects, so feared in cytotoxicity screening (Slater, 2001).
b) Lactate dehydrogenase (LDH) activity assayThis test is based on the release of a cytoplasmic enzyme , the LDH, after the loss of cellmembrane integrity in presence of a toxic agent. The release of LDH into the culture mediumis detected quantitatively by a chromogenic substrate. This method has been improved byusing 96-well microplates for growth and measurement of the enzyme activity; However, asthe membrane leakage is required, this assay often only detects the last stages just before celldeath (Harbell et al, 1997).
c) EROD (7-ethoxyresorufin-O-deethylase) activity assayThe main pathways of detoxication are processed through liver cells. This process transformshydrophobic compounds to more hydrophilic forms which are readily excreted from the body(elimination in the urine and/or the bile). Two steps (functionalisation and conjugaison) arerequired for this metabolism, but occasionally may lead to increased toxicity.
Across this process, diverse enzyme systems are activated, for example, cytochrome P450monooxygenase (CYPs) family. Consequently, the increase in CYPs activity can be regardedas an indicator of subacute toxic effects. (Dubois et al, 1996; Biosafe Paper 2002). Theactivity of CYP 4501 A1 isoenzyme can be easily measured using EROD as a diagnosticcatalytic marker. Immortalized human or murine liver cell lines (HepG2, Hepa-1) which haveretained some essential components of the hepatic xenobiotic metabolising enzyme system areselected for these surveys (Radice et al, 1997).
Typically, liver cells are cultured in multi well plates and exposed to samples for 24 to 72h.Subsequently, ethoxyresorufin is added and the EROD reaction is started by adding NADPH.Fluorescence of resofurin is measured using excitation/emission wavelength of 530/590 nm,and total proteins by using a wavelength of 405/460 nm respectively. Resorufin and bovineserum albumin standard curves are realised in parallel.
If inducers of CYP 4501 A1 are present in the tested sample, the enzymatic activity indicatedby EROD is higher in exposed culture compared to the control culture. This technique appearsto be rapid and reliable (Dubois et al, 1996; Biosafe Paper 2002).
43
d) Bioluminescent assaysThe previously described assay (bioluminescence assay - micotox) use a prokaryotic systemwhere as these assays are performed in an eukaryotic system. ATP plays a central role inenergy exchanges in eukariotic systems. It serves as the principal donor of free energy and ispresent in all metabolically active cells. Cell injury and death result in the rapid decrease ofATP. An high-throughput screening has been developed using a 384-well microplate and theluciferase-luciferine bioluminescence reaction to quantify ATP cell content. It appears to be asimple, sensitive and reliable method (Slater, 2001). But, the ATP extraction procedures maymodify the results, as yields are not controlled, and lead to a lack of reproducibility of the test.
Boar spermatozooan motility testSperm cells are known to be very sensitive to toxic agents. This test measures damage to themitochondria and signalling systems and plasma membrane integrity. Boar semen is exposedto the chemical substances for 1, 2, 3 and 4 days. Sperm motility is measured and compered tothat of control sperm cells. An EC50 can be calculated and is defined as the concentrationwhere motility is decreased by 50 % as compared to the control. The results must beextrapolated from animals to humans to assess their reliance and this can't be easilyaccomplished (Biosafe Paper, 2002).
Morphological modifications assays A number of large-scale morphological changes that occur in the cytoplasm or at the cellsurface can be followed and related to cell viability (cell size, irregular shaping of the cells,signs of rounding-off of the cells, granular inclusions, changes in the cytoskeleton …) (Cookand Mitchell, 1989).
The British Standard (BS 6920) for the assessment of CPDW toxicity is based on thisparameter. Material is immersed in the test water for 24h. The extract is collected and togetherwith a control (test water) it is utilised in the preparation of culture media used for the growthof African green monkey kidney cells (VERO ATCC CCL81). After incubation for 24h, thecells are observed microscopically.
If no initial signs of toxicity are observed, the material may be approved for use in contactwith potable water. If granular inclusions, irregular shaping of the cells or other signs oftoxicity are detected, the cells are re-examined at daily intervals for three to four days. Inparallel the confluence of the cell line is investigated.
If confluent growth of the cell line does not occur in the presence of the extract of the testmaterial and if signs of morphological changes are still observed, this is interpreted asindicating cytotoxicity. One problem that limits morphological tests is the transient nature ofmorphological changes. Moreover, the method is subjective as it takes into account the degreeof growth inhibition (microscopic evaluation) which can vary according to the operator.
Cell morphology can also be assessed by scanning electron microscopy (de Souza Costa et al,2003).
The RNA synthesis inhibition assaysThe test has been extensively described in the previous chapters of this report. Briefly, it isbased on the RNA synthesis inhibition of human cells in the presence of toxic compoundswith regard to blank control. The RNA synthesis is one of the major cellular functions andcan be correlated with the cellular growth rate (RNA synthesis is proportional to the square ofcellular growth rate). It indicates early toxic effects at cellular level (sublethal toxic effect)even before any other detectable damages have occurred (Fauris et al, 1986; Descampiaux et
44
al, 1994). The RNA synthesis inhibition assay was set up in 1981 by Fauris et al and has beenclosely related to the cellular attachment inhibition assay (Fauris et al, 1986) or to the Draizetest used in pharmaceutical and cosmetic industry (Descampiaux et al, 1994).
As cellular RNA synthesis is sensitive to a wide range of pollutants, this method is, therefore,very useful for global health risk evaluation. Actually, uridine is involved in several cellularpathways (Figure 2), and the inhibition of its incorporation in RNA can point out numerousdysfunctions in the cell (membrane modifications, changes in cell regulations, metabolismdisturbance etc…).
A great number of measures were carried out for 25 years to assess safety or toxicity of waters(drinking and polluted water, sea waters, mineral waters and renal dialysis waters), ofmaterials in contact with potable water (normalised tests AFNOR, XP P 41-250-3 andAFNOR XP P 41-260-3), of products used in pharmaceutical and cosmetic industry and ofpaper and board for food contact (Fauris , 1982; Fauris et al, 1986; Fauris et al, 1988;Descampiaux et al, 1994; Biosafe Paper 2002). Consequently, this test shows a wideapplication field.
Moreover, it requires a lower number of cells than the other generally applied methods. Itpresents a better sensitivity, a higher reproducibility, a faster response and a betteradaptability to routine analysis than most other assays (morphological modifications, cellgrowth, cloning efficiency, protein, DNA and RNA contents, cellular ATP concentration, theMicrotox method) (Fauris et al, 1985; Descampiaux et al, 1994; Lefebvre, 1994; Valentin-Severin et al, 2002). In fact, its sensibility is so high that all the samples can be tested withoutany concentration. The drawbacks of concentration are serious : yields are not controlled andthe compounds could be modified during the process. Consequently, the extract does notreflect the actual chemical composition of the sample (Fauris and Vilaginès, 1992).
The reproducibility of the method allows the results of seven independent measures of thesame sample to fall within a 2 % standard deviation. Its response is fast enough to requireonly 2h to 24h incubation for the samples according to their toxicity (Fauris et al, 1985). It iseasily adaptable to routine analysis and appears both sensitive and rapid enough for high-thoughput daily screening.
Modifications of the original test has been introduced using hepatic cells which retains acertain capacity towards metabolism of xenobiotics (Valentin-Severin et al, 2002).
Finally, another European project, Biosafe Paper aims at the development, validation andintercalibration of a short-term biological test battery for safety assessment of food contactpaper. It is a pre-normative research effort, which will be used to launch regulatoryharmonisation at EU level on the safety of food contact paper and board. The emphasis willbe on cost effective tests with toxicological relevant end points.
The chosen methods for assessing cytotoxicity were the RNA synthesis inhibition test, theboar spermatozooan motility test, the Photobacterium test, the EROD induction test, the totalprotein content test, the colony forming ability test, the viability test (neutral red assay). Thefirst part of the research program was to evaluate the relative sensitivities of the differentproposed test systems.
For this purpose, positive controls were prepared and sent to the various laboratories involvedin the project. The first conclusions seem to confirm that RNA synthesis inhibition is a rather

45
sensitive early indication of toxic effects at cellular level and that this method is the bestcandidate for an European cytotoxicity standard.
Apoptosis detection assaysOf great importance to the study of cell death is the differentiation between the two principlemodes, namely, apoptosis and necrosis. Necrosis is the passive result of cellular injury leadingto complete loss of cell integrity and the release of cellular components into the surroundingenvironment (membrane breakdown, DNA dissolution (karyolysis), increase of cell sizeetc…). Apoptosis, on the other hand, is an active process that is accompanied by a series ofdistinct cellular and molecular events that form an integral part of normal physiologicalreactions (reduction of cell size, condensation of nuclear chromatin, DNA fragmentation,activation of endogeneous endonucleases and proteases etc…) (Slater, 2001).
Numerous methods exist to quantify cells in apoptosis. Some of them refers either toelectronic microscopy to reveal ultrastructural changes in the cells (Searle et al, 1995) or tofluorescent microscopy to visualise DNA structure after staining with specific dyes (eosin,DAPI, Hoechst 33342 etc…) (Marsteinstredet et al, 1997).
Other techniques for assessment of apoptosis are based upon the internucleosomal DNAfragmentation. The most widely used test consists of the DNA analysis by agarose gelelectrophoresis. After gel staining, a apoptosis characteristic ladder pattern is obtained.Nevertheless, this method has a low sensitivity.
The DNA clivage can also be detected by labelling the end of the DNA strands in situ. Twosensitive methods are available : the TUNEL and the ISEL techniques, but they are too labourintensive.
Flow cytometric analysis combined with microscopic examination remains the method ofchoice for the study of apoptosis. It reveals membrane modifications as a loss of phospholipidasymmetry (Marstrienstredet et al, 1997).

46
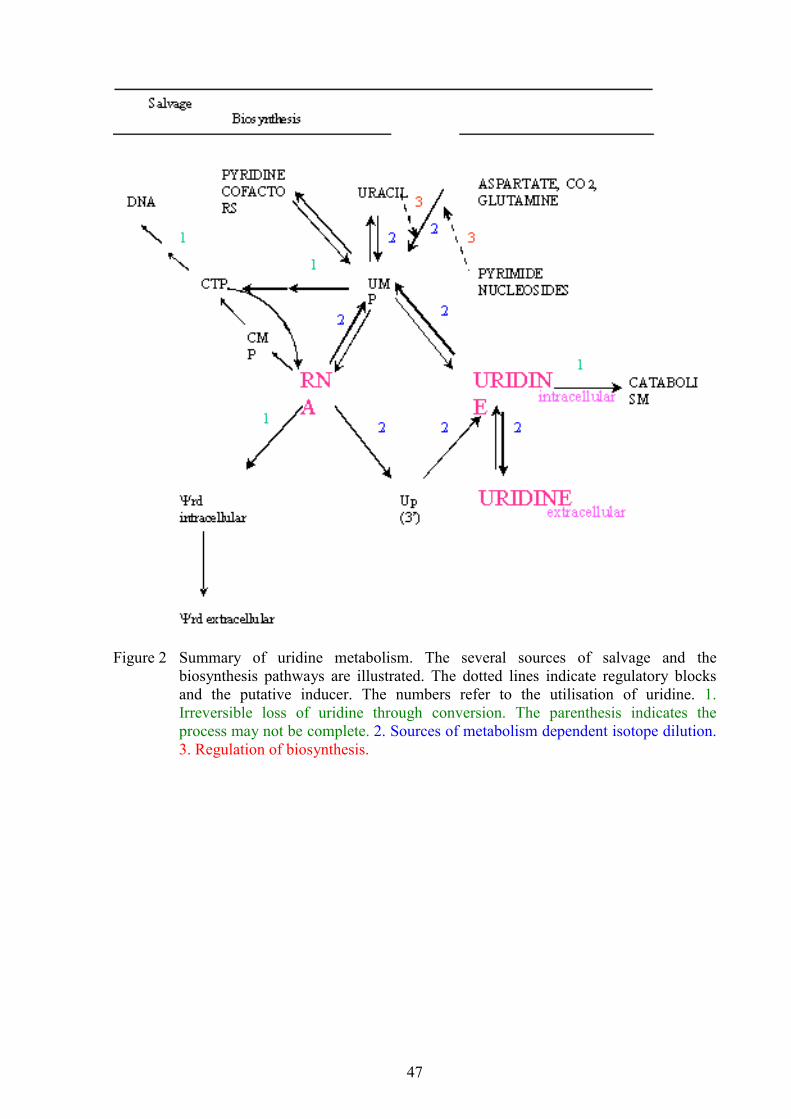
47
Figure 2 Summary of uridine metabolism. The several sources of salvage and thebiosynthesis pathways are illustrated. The dotted lines indicate regulatory blocksand the putative inducer. The numbers refer to the utilisation of uridine. 1.Irreversible loss of uridine through conversion. The parenthesis indicates theprocess may not be complete. 2. Sources of metabolism dependent isotope dilution.3. Regulation of biosynthesis.
48
References
• Balls, M. et al.,1990. Report and recommendations of the CATT/ERGATT workshop onthe validation of toxicity test procedures. ATLA 18:313-337.
• Biosafe-Paper, prenormative report 2002. Application of bioassays for safetyassessment of paper and board for food contact. E.U. project
• Buikema, A. L. et al., 1982. Biological monitoring. Part IV - Toxicity testing. Wat. Res.16:239-262
• Campanella, L. et al.,1995. Immobilised yeasts cells biosensor for total cytotoxicitytesting. The science of total environment 171:227-234.
• Chiba, K. et al.,1999. Interlaboratory validation of the in vitro eye irritation test forcosmetic ingredients (9). Evaluation of cytotoxicity test on HeLa cells. Toxic. in Vitro13:189-198.
• Clemedson, C. et al., 1996. MEIC evaluation of acute toxicity for the first 30 referencechemicals : Part II. In vitro results from 68 methods and a comparative cytotoxicityanalysis. ATLA - Alternative to laboratory animals 24:251-272.
• Cook, J. A. et al.,1989. Viability measurements in mammalian cell systems. AnalyticalBiochemistry 179:1-7.
• Descampiaux, B. et al., 1999. Cytotoxicity of lindane and paraquat to human hepatomacell lines. Bull. Environ. Contam. Toxicol. 62:16-24.
• Dubois, M. 1996. et al.,Hierarchical cluster analysis of environmental pollutants throughP450 induction in cultured hepatic cells. Ecotoxicology and environmental safety 34:205-215.
• E.Haubenstricker, M. et al.,1990. Rapid toxicity testing based on yeast respiratoryactivity. Bull. Environ. Contam. Toxicol. 44:669-674.
• Ekwall, B. et al., 1983. Screening of toxic compounds in mammalian cell cultures. ANN NY Acad Sci. 407:64-77.
• Fauris, C. et al., 1981.Mesure de la cytotoxicité des eaux par inhibition de la synthèsed'ARN cellulaire : mise au point d'une microméthode de mesure de la synthèse d'ARNcellulaire et domaines d'application. Presented at the Les colloques de l'INSERM.
• Fauris, C. et al.,1985. Rapidity of RNA synthesis in human cells. Wat. Res. 6.• Fauris, C. et al.,1986. Mesure de la cytotoxicité au contact de l'eau potable. Journal
Français d'Hydrologie 17:131-142.• Fauris, C. et al.,1988. Evaluation de la qualité des matériaux en contact avec l'eau : 7 ans
de recul. Journal Français d'Hydrologie 19:39-49.• Fauris, C. et al.,1992. Biological monitoring of water quality. Presented at the Water
Quality Technology Conference, Toronto, Ontario, USA.• Fauris, C. et al.,1992. Global evaluation of water microtoxicity (article in french). Spectra
2000 167:41-46.• Fauris, C. et al., 1997. The cytotoxicity tests applied to water intended for human
consumption (article in french). TSM (AGHTM publication) 11:27-36.• Frazier. et al., 1989. Technical problems associated with in vitro toxicity testing sytems.
CAAT technical Workshop May 17-18.• Ghosh, S. K. et al., 1996. Toxicity of Zinc in three microbial test systems. Environmental
toxicology and water quality 9:13-19.• Harbell, J. W. et al., 1997. Cell cytotoxicity assays. Food and Chemical Toxicology
35:79-126.• Isomaa, B. et al., 1994. Aquatic toxicology in vitro : a brief review. ATLA 22:243-253.• Isomaa, B. et al., 1994. The urgent need for in vitro tests in ecotoxicology. Toxic. in Vitro
9:821-825.
49
• Jantova, S. et al., 1996. Comparison of three in vitro cytotoxicity tests : neutral red assay,protein content measurement and direct cell counting. Biologia (Bratislava) 51:305-311.
• Jay, A. E. et al.,1996. Toxic effects of organic solvants on the growth of Chlorella vulgarisand Selenastrum capricornutum. Bull. Environ. Contam. Toxicol. 57:191-198.
• Kahru, A. et al., 1994. Toxicity of 39 MEIC chemicals to biolumunescent photobacteria(the BIOTOX test) : correlation with other tests systems. ATLA 22:147-160.
• Kim, B. C. et al.,2003. Evaluation of a high throughput toxicity biosensor and comparisonwith a Daphnia magna bioassay. Biosens. Bioelectron. 18:821-6.
• Koëter, H. B. W. M. et al., 1995. Validation : a highly charged concept. Toxic. in Vitro9:851-856.
• Kooijman, S. A. L. M. et al.,1996. Analysis of toxicity tests on Daphnia survival andreproduction. Wat. Res. 30:1711-1723.
• Kooijman, S. A. L. M. et al., 1996. No-effect concentration in algal growth inhibitontests. Wat. Res. 30:1625-1632.
• Lee, G. et al.,1990. Predicting chronic lethality of chemicals to fishes from acute toxicitytest data : multifactor probit analysis. Environmental toxicology and chemistry 14:345-349.
• Lilius, H. et al., 1995. A comparison of the toxicity of 30 references chemicals to Daphniamagna and Daphnia pulex. Environmental toxicology and chemistry 14:2085-2088.
• Little, E. E. et al.,1990. Behaviorial indicators of sublethal toxicity in rainbaw trout. Arch.Environ. Contam. Toxicol. 19:380-385.
• Liu, D. Y. K. et al.,1989. Rapid toxicity assessment of water soluble and water insolublechemicals using a modified agar plate method. Wat. Res. 23:333-339.
• Marsteinstredet, U. et al.,1997. Apoptosis in HL-60 cells induced by 3-chloro-4-(dichloromethyl)-5-hydroxy-2{5H}-furanone (MX). Chemico-Biological interactions106:89-107.
• Novillo, A. et al.,2001. Protein precipitation in vitro as a measure of chemical-inductedtoxicity : an EDIT sub-programme. Altern. Lab. Anim. 29:309-324.
• Osbild, D. et al.,1998. On-line measurement of water toxicity using immobilizedlumunescent bacteria : the "Toxibio" (article in french). TSM (AGHTM publication)janvier 1998:53-58.
• Paganuzzi-Stammati, A. L. et al.,1981. Toxicology investigations with cell culturesystems. Toxicology 20:91-153.
• Peterson, S. M. et al.,1996. New algal enzyme bioassay for the rapid assessment ofaquatic toxicity. Bull. Environ. Contam. Toxicol. 56:750-757.
• Radice, S. et al.,1997. Carbendazim and n-butylisocyanate : metabolites responsible forbenomyl double action on cytochrome P450 in HepG2 cells. Toxicology 123:135-142.
• Ribo, J. M. et al.,1997. Interlaboratory comparison studies of luminescent bacteria toxicitybioassay.
• Sauvant, M. P. et al.,1997. Toxicity assessment of 16 inorganic environmental pollutantsby six bioassays. Ecotoxicology and environmental safety 37:131-140
• Schweikl, H. et al.,1996. Toxicity parameters for cytotoxicity testing of dental materials intwo different mammalian cell lines. Eur. Oral Sci. 104:292-299.
• Searle, J. et al.,1995. An electromicroscope study on the mode of cell death induced bycancer-chemotherapeutics agents in populations of proliferating normal and néoplasic cels.J. Pathol. 116:129-138.
• Sit, K. H. et al.,1996. Cell rounding with "rip off" detachment. Histol Histopathol 11:215-227
• Slabbert, J. L. et al.,1982. A bioassay technique using Tetrahymena pyriformis for therapid assessment of toxicants in water. Wat. Res. 16:517-523.
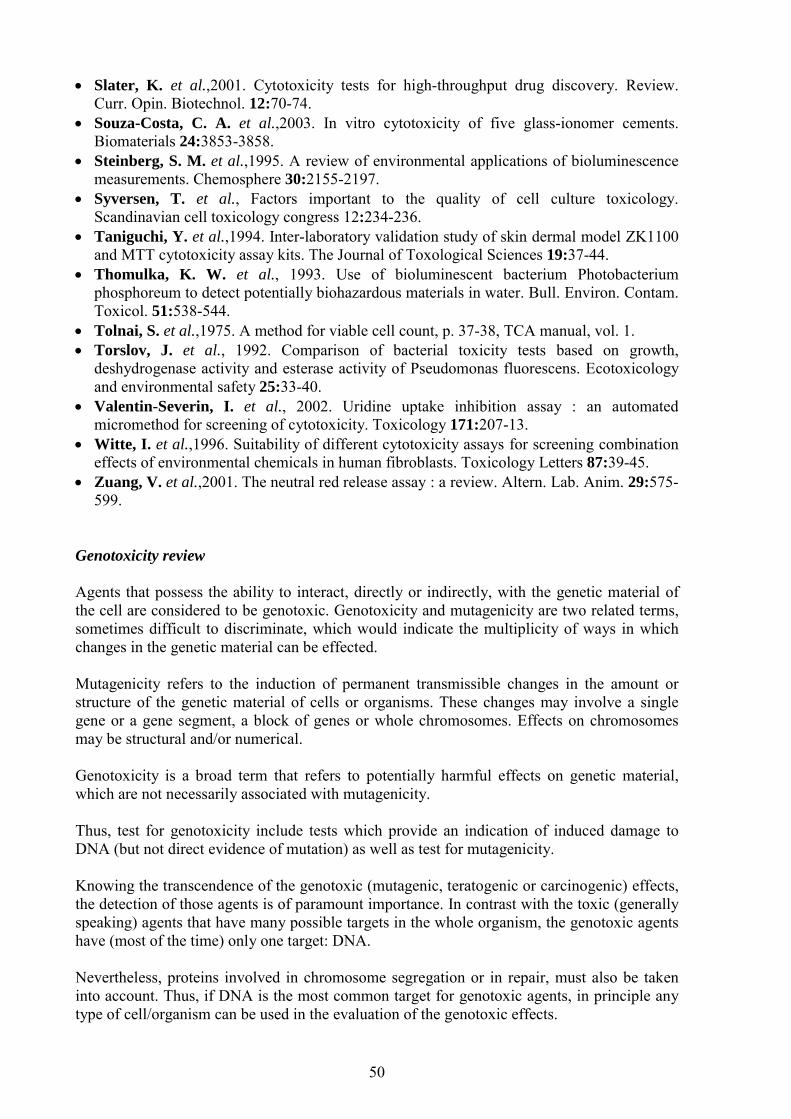
50
• Slater, K. et al.,2001. Cytotoxicity tests for high-throughput drug discovery. Review.Curr. Opin. Biotechnol. 12:70-74.
• Souza-Costa, C. A. et al.,2003. In vitro cytotoxicity of five glass-ionomer cements.Biomaterials 24:3853-3858.
• Steinberg, S. M. et al.,1995. A review of environmental applications of bioluminescencemeasurements. Chemosphere 30:2155-2197.
• Syversen, T. et al., Factors important to the quality of cell culture toxicology.Scandinavian cell toxicology congress 12:234-236.
• Taniguchi, Y. et al.,1994. Inter-laboratory validation study of skin dermal model ZK1100and MTT cytotoxicity assay kits. The Journal of Toxological Sciences 19:37-44.
• Thomulka, K. W. et al., 1993. Use of bioluminescent bacterium Photobacteriumphosphoreum to detect potentially biohazardous materials in water. Bull. Environ. Contam.Toxicol. 51:538-544.
• Tolnai, S. et al.,1975. A method for viable cell count, p. 37-38, TCA manual, vol. 1.• Torslov, J. et al., 1992. Comparison of bacterial toxicity tests based on growth,
deshydrogenase activity and esterase activity of Pseudomonas fluorescens. Ecotoxicologyand environmental safety 25:33-40.
• Valentin-Severin, I. et al., 2002. Uridine uptake inhibition assay : an automatedmicromethod for screening of cytotoxicity. Toxicology 171:207-13.
• Witte, I. et al.,1996. Suitability of different cytotoxicity assays for screening combinationeffects of environmental chemicals in human fibroblasts. Toxicology Letters 87:39-45.
• Zuang, V. et al.,2001. The neutral red release assay : a review. Altern. Lab. Anim. 29:575-599.
Genotoxicity review
Agents that possess the ability to interact, directly or indirectly, with the genetic material ofthe cell are considered to be genotoxic. Genotoxicity and mutagenicity are two related terms,sometimes difficult to discriminate, which would indicate the multiplicity of ways in whichchanges in the genetic material can be effected.
Mutagenicity refers to the induction of permanent transmissible changes in the amount orstructure of the genetic material of cells or organisms. These changes may involve a singlegene or a gene segment, a block of genes or whole chromosomes. Effects on chromosomesmay be structural and/or numerical.
Genotoxicity is a broad term that refers to potentially harmful effects on genetic material,which are not necessarily associated with mutagenicity.
Thus, test for genotoxicity include tests which provide an indication of induced damage toDNA (but not direct evidence of mutation) as well as test for mutagenicity.
Knowing the transcendence of the genotoxic (mutagenic, teratogenic or carcinogenic) effects,the detection of those agents is of paramount importance. In contrast with the toxic (generallyspeaking) agents that have many possible targets in the whole organism, the genotoxic agentshave (most of the time) only one target: DNA.
Nevertheless, proteins involved in chromosome segregation or in repair, must also be takeninto account. Thus, if DNA is the most common target for genotoxic agents, in principle anytype of cell/organism can be used in the evaluation of the genotoxic effects.
51
In fact, there exist a wide range of assay systems detecting genotoxicity, ranging from simplesystems as bacteria to the most complex eukaryote cell of whole mammalian individuals.Nevertheless, and in spite of the simplistic view above designed, genotoxic agents can interactwith DNA in different ways, inducing different types of effects and, as consequence, differentassays can measure particular ways of how a defined compound can show its genotoxicpotential.
The genotoxicity assays can be classified according to different aspects:• according to the test organism used: prokaryotes vs eukaryotes• according to the complexity of the test system: in vitro vs in vivo• according to the level: genic vs. chromosomic
Taking into account the above aspects, the following table gives a complete view of the typesof assays that can be used in the detection of genotoxicity:
In vitro Primary DNA damage in prokaryotesPrimary DNA damage in low eukaryotesPrimary DNA damage in mammalian cellsGene mutation in prokaryotes (Ames test)Gene mutation in low eukaryotesGene mutation in mammalian cellsAneuploidy in low eukaryotesAneuploidy in mammalian cellsSister chromatid exchanges in mammalian cellsChromosome aberrations in mammalian cells (AC test)Cell transformation in mammalian cellsMicronucleus test (MN test)Comet test
In vivo DNA repair in mammalian somatic cellsSomatic gene mutation in DrosophilaSpot test in miceMicronuclei in mammalsGerminal damage in DrosophilaLocus specific test in mammalsDominant lethal in mammalsHeritable translocations in mammalsSperm morphology in mammals
Although each one of the assays by itself can measure genotoxicity, not all them measure thesame type of genetic damage. Thus, to solve this apparent dilemma, different assays are usedtogether to have a complete picture on the genotoxicity risk associated with the exposure infront of a particular compound. This approach is denominated as a battery approach.In spite that all the assays are able to measure genotoxicity, the complexity of the indicatedtests is very different. It is not the same to use whole animals than cells culture; it is not thesame to detect germinal damage than somatic damage; and so on.Several genotoxicity assays are widely used as routine in many laboratories worldwide (seeTable 2). Thus, it is easy to select those which fulfil the appropriate requirements: reliance,rapidity and inexpensiveness. Among the most used assays, those that can accomplish suchrequirements are as follows:• The Ames test. This is perhaps the most used test. It measures the induction of point
mutation in a prokaryote organism (Salmonella thyphimurium). Among its advantagesmust be indicated the rapidity, sensitivity, and the wide database on the response on front
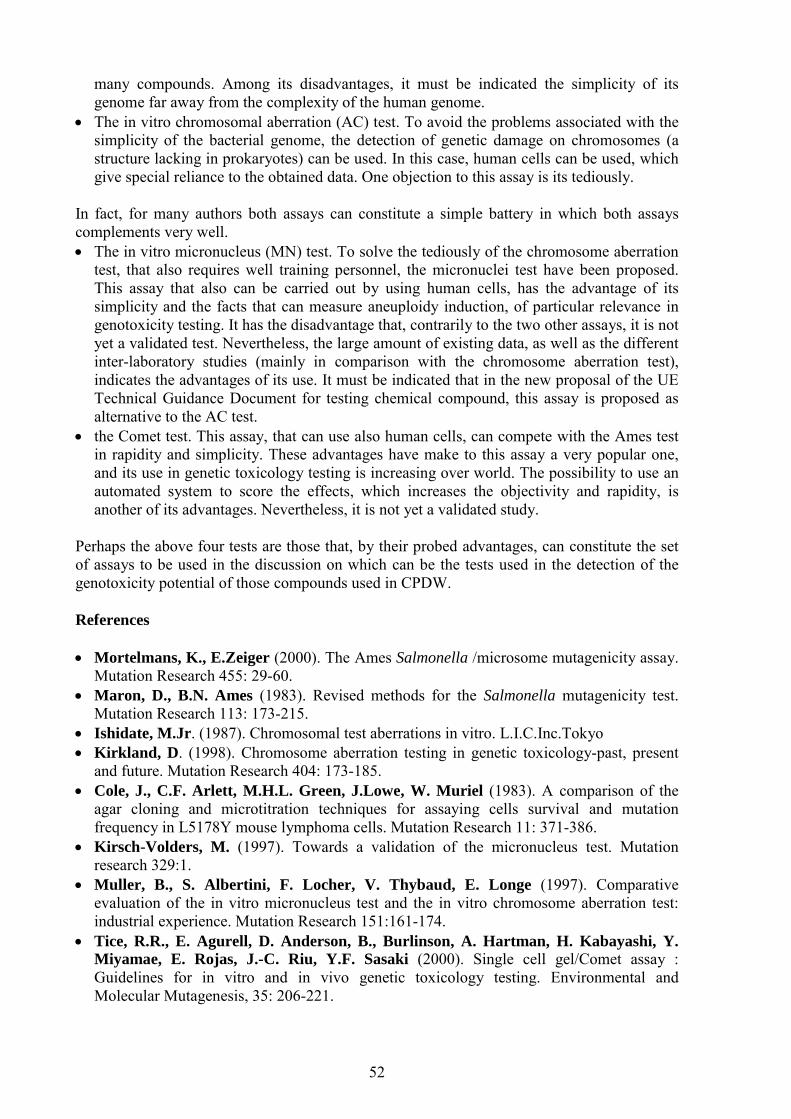
52
many compounds. Among its disadvantages, it must be indicated the simplicity of itsgenome far away from the complexity of the human genome.
• The in vitro chromosomal aberration (AC) test. To avoid the problems associated with thesimplicity of the bacterial genome, the detection of genetic damage on chromosomes (astructure lacking in prokaryotes) can be used. In this case, human cells can be used, whichgive special reliance to the obtained data. One objection to this assay is its tediously.
In fact, for many authors both assays can constitute a simple battery in which both assayscomplements very well.• The in vitro micronucleus (MN) test. To solve the tediously of the chromosome aberration
test, that also requires well training personnel, the micronuclei test have been proposed.This assay that also can be carried out by using human cells, has the advantage of itssimplicity and the facts that can measure aneuploidy induction, of particular relevance ingenotoxicity testing. It has the disadvantage that, contrarily to the two other assays, it is notyet a validated test. Nevertheless, the large amount of existing data, as well as the differentinter-laboratory studies (mainly in comparison with the chromosome aberration test),indicates the advantages of its use. It must be indicated that in the new proposal of the UETechnical Guidance Document for testing chemical compound, this assay is proposed asalternative to the AC test.
• the Comet test. This assay, that can use also human cells, can compete with the Ames testin rapidity and simplicity. These advantages have make to this assay a very popular one,and its use in genetic toxicology testing is increasing over world. The possibility to use anautomated system to score the effects, which increases the objectivity and rapidity, isanother of its advantages. Nevertheless, it is not yet a validated study.
Perhaps the above four tests are those that, by their probed advantages, can constitute the setof assays to be used in the discussion on which can be the tests used in the detection of thegenotoxicity potential of those compounds used in CPDW.
References
• Mortelmans, K., E.Zeiger (2000). The Ames Salmonella /microsome mutagenicity assay.Mutation Research 455: 29-60.
• Maron, D., B.N. Ames (1983). Revised methods for the Salmonella mutagenicity test.Mutation Research 113: 173-215.
• Ishidate, M.Jr. (1987). Chromosomal test aberrations in vitro. L.I.C.Inc.Tokyo• Kirkland, D. (1998). Chromosome aberration testing in genetic toxicology-past, present
and future. Mutation Research 404: 173-185.• Cole, J., C.F. Arlett, M.H.L. Green, J.Lowe, W. Muriel (1983). A comparison of the
agar cloning and microtitration techniques for assaying cells survival and mutationfrequency in L5178Y mouse lymphoma cells. Mutation Research 11: 371-386.
• Kirsch-Volders, M. (1997). Towards a validation of the micronucleus test. Mutationresearch 329:1.
• Muller, B., S. Albertini, F. Locher, V. Thybaud, E. Longe (1997). Comparativeevaluation of the in vitro micronucleus test and the in vitro chromosome aberration test:industrial experience. Mutation Research 151:161-174.
• Tice, R.R., E. Agurell, D. Anderson, B., Burlinson, A. Hartman, H. Kabayashi, Y.Miyamae, E. Rojas, J.-C. Riu, Y.F. Sasaki (2000). Single cell gel/Comet assay :Guidelines for in vitro and in vivo genetic toxicology testing. Environmental andMolecular Mutagenesis, 35: 206-221.
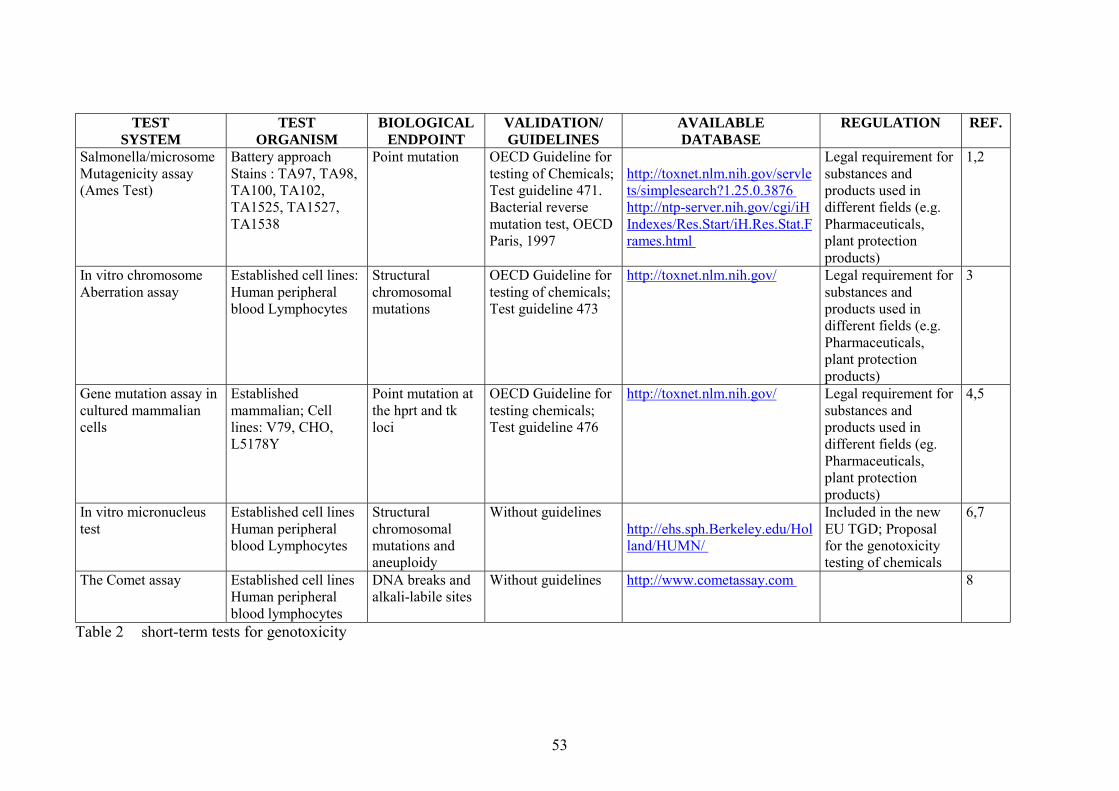
53
TESTSYSTEM
TESTORGANISM
BIOLOGICALENDPOINT
VALIDATION/GUIDELINES
AVAILABLEDATABASE
REGULATION REF.
Salmonella/microsomeMutagenicity assay(Ames Test)
Battery approachStains : TA97, TA98,TA100, TA102,TA1525, TA1527,TA1538
Point mutation OECD Guideline fortesting of Chemicals;Test guideline 471.Bacterial reversemutation test, OECDParis, 1997
http://toxnet.nlm.nih.gov/servlets/simplesearch?1.25.0.3876 http://ntp-server.nih.gov/cgi/iHIndexes/Res.Start/iH.Res.Stat.Frames.html
Legal requirement forsubstances andproducts used indifferent fields (e.g.Pharmaceuticals,plant protectionproducts)
1,2
In vitro chromosomeAberration assay
Established cell lines:Human peripheralblood Lymphocytes
Structuralchromosomalmutations
OECD Guideline fortesting of chemicals;Test guideline 473
http://toxnet.nlm.nih.gov/ Legal requirement forsubstances andproducts used indifferent fields (e.g.Pharmaceuticals,plant protectionproducts)
3
Gene mutation assay incultured mammaliancells
Establishedmammalian; Celllines: V79, CHO,L5178Y
Point mutation atthe hprt and tkloci
OECD Guideline fortesting chemicals;Test guideline 476
http://toxnet.nlm.nih.gov/ Legal requirement forsubstances andproducts used indifferent fields (eg.Pharmaceuticals,plant protectionproducts)
4,5
In vitro micronucleustest
Established cell linesHuman peripheralblood Lymphocytes
Structuralchromosomalmutations andaneuploidy
Without guidelineshttp://ehs.sph.Berkeley.edu/Holland/HUMN/
Included in the newEU TGD; Proposalfor the genotoxicitytesting of chemicals
6,7
The Comet assay Established cell linesHuman peripheralblood lymphocytes
DNA breaks andalkali-labile sites
Without guidelines http://www.cometassay.com 8
Table 2 short-term tests for genotoxicity


55
STAGE 2: HARMONISATION OF THE CYTOTOXICITY TEST
This stage was divided into two parts.
Part1: Inter-calibration of the cytotoxicity test
Introduction
The main tasks of this part were to introduce the cytotoxicity test to the participating institutes(TW and UBA), and to check the quality of the set up of the test in the different laboratoriesin an inter-calibration comparison exercise.
Instruction days
CRECEP set up the test in 1981, optimised it afterwards and has used it for more then 20years. Training stays were organised at CRECEP in the beginning of the project. Detailedinstructions were given to the two other participants about the culture of HeLa S3 cells insuspension, the preparation of leachates, the precautions to be taken for using 3H-uridine, themeasurement of RNA synthesis, the information regarding the treatment of the results and thecritical points and difficulties of the method.
During these days, various samples (negative controls, a CPDW and a paper for food contact)were analysed simultaneously by UBA and CRECEP or TW and CRECEP. No particulardifficulties were encountered and the results obtained by TW, UBA and CRECEP were in thesame range of values (results not shown).
Inter-calibration comparison exercise
Once the training stays were over, a cross validation of the protocol was realised by testing 3organic materials manufactured as seals or pipes.
MaterialsThe materials used in stage 2 - part 1 are listed in Table 3. They had been prepared anddistributed by CRECEP.
Table 3 Materials used in inter-calibration comparison exerciseMaterial number Material Product S/V ratio
cm2/L1 EPDM type 1 seal 4.242 EPDM type 2 seal 4.243 PE-X pipe 240
The RNA synthesis inhibition testThe test (leachate preparation and cytotoxical assessment) was conducted as described inMaterials and Methods.
Results and discussionThe raw data regarding materials 1, 2 and 3 are reported in the Annex 2. The slopes values ofthe regression lines and the percentages of RNA synthesis are summarised in
56
Table 4 and Table 5, respectively, with the corresponding standard deviations.
Various replicates or points were omitted in the first way of calculation:• concerning UBA, one replicate for material 1 was excluded because of a different accuracy
of range and one data of a replicate was omitted (last point of the straight line) for material3.
• regarding TW, two points were omitted for the blank, two replicates were excluded formaterial 1 (first replicate : positive intercept, R2 < 0.98, second replicate : differentaccuracy of range), one replicate for material 2 was not taken into account (R2 < 0.98), onereplicate was omitted (positive intercept, R2 < 0.98).
• concerning CRECEP, one data point (30 minutes) was excluded for material 1 and one formaterial 2 too.
The required slope value of "higher than 1.75" was obtained by the three institutes. Theconstant b was for all calculation methods negative, as required. The blanks gave similarresults for CRECEP, TW and UBA. The relative standard deviation RSD of the slopes wasfor all replicates and calculation methods smaller than 10 %. This low RSD value clearlyshow the good reproducibility of the measures.
Analysis of positive controls revealed a toxic effect of potassium dichromate only inCRECEP experiments. TW shows a relatively high SD of 22 %, whereas for the blank and themigration waters of the three materials the SD values were in the same range and much lower.One disturbing factor could be that no information about the preparation of the dichromatepotassium solutions and their conditions of storage was given to the participants. CRECEPobserved that the standard solution should be kept at room temperature, as a 4°C storage ofthe solution leads to a decrease in cell toxicity. The protocol should include a checking of theaccuracy of the dichromate potassium dilutions and the validity of the standard solution, bythe determination of an IC50 curve.
As the experiments were not performed at the same time in the three institutes, comparison ofthe results obtained for the materials was not easy. Some materials can be unstable over a longperiod storage and external effects (air quality, dust …) can occur. However the selectedmaterials did not seem to behave significantly differently in the tests, the percentage of RNAsynthesis was always greater than 70% (from 81 to 122), pointing out the absence or the verylow toxicity of the 3 leachates. The inter-laboratory reproducibility was good with acoefficient of variation of reproducibility (VCR) of 11.8 % for material 1, 10.5 % for material2 and 10.8 % for material 3 (first calculation method), of 6.9 % for material 1, 12.2 % formaterial 2 and 19% for material 3 (second calculation method) and of 7.2 % for material 1,9.8 % for material 2 and 11.5 % for material 3 (third calculation method).
The results in Table 5 show that the omission of data according to the French calculationmethod may cause a deviation of up to 15 % with a median value of 7% and up to 20% with amedian value of 2% in relation to the second method of calculation and the third onerespectively.
Nevertheless, whatever the mode of calculation was, no big differences in the percentages ofRNA synthesis could be observed for the three tested materials (values always higher than70%). Further materials should be analysed, with a back up by statistical treatment, to makesure the three ways of calculation give identical assessment of cytotoxicity.

57
Table 4 The linear regression parameters for materials 1, 2 and 3 calculated by the threemethods
Slope a (cpm) ± SD (R2 or Rf) a
Material Institute Date First methodFrenchb
Second methodGraph Padc
Third methodExcel
Blank TWUBA
CRECEP
14/12/0105/07/0112/07/0131/05/01
2.46 ± 0.012.52 ± 0.252.49 ± 0.172.06 ± 0.04c
2.54 ± 0.05 (0.99)2.67 ± 0.10 (0.98)2.54 ± 0.05 (0.99)2.10 ± 0.02 (0.99)
2.48 ± 0.11 (0.98)2.52 ± 0.13 (0.96)2.49 ± 0.10 (0.99)2.06 ± 0.04 (0.99)
EPDM seal(1)
TWUBACRECEP
14/12/0112/07/0131/05/01
2.99d
2.44 ± 0.06e
2.11 ± 0.11f
2.81 ± 0.24 (0.87)2.44 ± 0.10 (0.96)2.12 ± 0.03 (0.99)
2.41 ± 0.38 (0.97)2.18 ± 0.21 (0.99)2.07 ± 0.04 (0.99)
EPDM seal(2)
TWUBACRECEP
14/12/0112/07/0131/05/01
2.22 ± 0.09e
2.09 ± 0.182.15 ± 0.08f
2.26 ± 0.10(0.97)2.06 ± 0.08 (0.98)2.15 ± 0.03 (0.99)
2.41 ± 0.19 (0.99)2.10 ± 0.11 (0.99)2.11 ± 0.04 (0.99)
PE-X pipe(3)
TWUBACRECEP
14/12/0112/07/0131/05/01
2.09 ± 0.182.17 ± 0.102.11 ± 0.08f
2.20 ± 0.16 (0.94)2.14 ± 0.05 (0.99)2.45 ± 0.03 (0.99)
2.33 ± 0.28 (0.97)2.01 ± 0.10 (0.99)2.11 ± 0.05 (0.99)
K2Cr2 O7(2 mg/L)
TWUBA
CRECEP
14/12/0105/07/0112/07/0131/05/01
2.13 ± 0.47e
2.24 ± 0.16e
2.07 ± 0.191.35 ± 0.10
2.60 ± 0.22 (0.90)2.24 ± 0.16 (0.92)2.12 ± 0.06 (0.99)1.28 ± 0.02 (0.99)
2.46 ± 0.34 (0.97)1.62 ± 0.43 (0.46)2.07 ± 0.09 (0.99)1.35 ± 0.05 (0.99)
a Each result is the average of 3 replicates b R2 per definition ≥ 0.98c Rf (robustness factor) was calculated automatically by Graph Prism software (second
method). It replaces the usual R2 as a witness of goodness of fit.d 1 replicate, of which one data point was omitted (30 minutes)e 2 replicatesf 6 replicatesNote: CRECEP observed cell growth of 68 ± 7.3 % during incubation of the blank; TW and
UBA did not measured cell growth at this stage.
Table 5 Percentages of RNA synthesis for materials 1, 2 and 3 calculated by the threemethods. The percentages of RNA synthesis of the leachates were expressed inrelation to the blank: (average slope value of the leachate/average slope value of theblank)*100. The percentage of RNA synthesis of the blank is fixed at 100 % (totalabsence of toxicants).
% of RNA synthesisMaterial Institute Date First method
FrenchSecond method
Graph PadThird method
ExcelEPDM seal
(1)TWUBACRECEP
14/12/0112/07/0131/05/01
12298 ± 2
103 ± 6
110 ± 996 ± 4
101 ± 2
97 ± 1587 ± 8
100 ± 2EPDM seal
(2)TWUBACRECEP
14/12/0112/07/0131/05/01
90 ± 484 ± 7
104 ± 4
89 ± 481 ± 3
103 ± 2
97 ± 884 ± 4
102 ± 2PE-X pipe
(3)TWUBACRECEP
14/12/0112/07/0131/05/01
85 ± 987 ± 4
102 ± 4
87 ± 684 ± 2
117 ± 2
94 ± 1181 ± 4
102 ± 2

58
Different experimental conditions in the three laboratories were pointed out, after discussion: • UBA and TW checked cell viability with Trypan blue. UBA fixed the acceptance limit at
80 % viability.• CRECEP verified the percentage of cell growth in the blank tubes between the beginning
and the end of the incubation time: an adequate number of cells in perfect health isrequired to obtain reliable and reproducible results, 50 % growth rate should be reached.
• CRECEP performed a negative control of the cleanness of glassware and of thesurrounding environment: a borosilicated glass jar identical to those used for leachatespreparation was filled with reference water and kept at 23°C for 24 hours, the resultingwater was tested for cytotoxicity. No deviation was observed compared to the referencecontrol.
TW carried out the assays six month later than the two other participants did. Actually, itunderlined difficulties in controlling cell cultures in suspension. Consequently, actions andadvice were given by CRECEP (and UBA) in order to figure out exactly what the problemswere and afterwards to remedy cell growth issue (Annex 3).1) Further training periods were planned and undertaken at CRECEP, at UBA and at TW to
explain the procedure again and to try to understand the encountered difficulties. It isimportant to note that inter-comparison, at the same place and with exactly the sameprocedure, did not show a difference in performance of the technician.
2) TW was supplied with some equipment to check if it could improve the results.3) Detailed glassware cleaning procedures were provided by CRECEP (see materials and
method) as this parameter can affect greatly the cell growth rate.4) A new stirring apparatus was purchased by TW to suspend cell cultures during the
incubation period. At the beginning of the project, a Bibby monoposition magnetic stirrerserved for agitation. As the cells in all these tubes must exactly be subjected to the sameconditions of agitation, it is more convenient and reproducible to use a multipositionmagnetic stirrer on which agitation is homogenous.
5) Centrifugation conditions were closely defined to avoid the high loss of cells observed inthis step by TW: an increasing centrifuge speed was applied (300X g for 5 minutes) with aSorvall apparatus. Thus, the correct number of cells (approximately 600.000 cells/ml)could be introduced into the glass tubes.
6) The suspension culture conditions were also checked by CRECEP as several parametersare known to be essential for cell growth (the state of confluence of the cells, media pH,initial number of cells : approximately 600 000 / ml, incubation time…).
7) Different cell counting methods can be applied to determine cell concentrations: automaticparticle counters or haemocytometers. Automatic particle counters give the most accuratecell counts, but they are very expensive. These apparatus should be calibrated once a year.This point was achieved at CRECEP by cell counts comparison between the automaticcounter and the Nageotte cell counter. UBA used an automatic particle counter too.Alternative cell counting method can consists in using haemocytometers but this methodcan’t be easily adaptable to routine analysis. The Nageotte haemocytometer appears to bemore accurate (lower standard deviation) than the Neubauer one, but the grids do notcontain subdivisions and consequently the work is far more tedious. TW used theNeubauer counting method all along the project.
Conclusion
TW problems and discussions with WP2 partners led us to fix diverse requirements and tostudy the effect of various parameters in order to make the assay robust and reliable for anylaboratory:• the preparation and the storage of the leachates
59
• the assessment of cell viability and cell growth• the best incubation prior to RNA synthesis determination• the choice of uridine batches (importance of a convenient supplier) etc…
Moreover, the laboratories were requested by CRECEP to record further informationregarding each experiment: cell counting before and after incubation, colour of the culturemedia after incubation.
Part 2: Study of the impact of different test variables
Introduction
The aim of this chapter was to define diverse factors in order to harmonise the cytotoxicityassay and to obtain reproducible and reliable results when testing CPDW where ever it isproceeded. These experiments were mainly conducted by CRECEP due to its advancedknowledge of the technique, but UBA and TW actively participated on some of them too. Apart of these investigations was carried out in parallel to the stage 3.
The following topics were studied :• the leachates preparation• the leachates storage• the cell viability• the percentage of cell growth in the blank tubes• the best "cell-leachate" incubation time• the use of glass or plastic tubes for "cell-leachate" incubation• the uridine batches
In this chapter, the raw data were treated only with the first mode of calculation.
Preparation of the leachates
ObjectivesThe procedure to follow to prepare leachates may influence their resulting cytotoxicity.Various factors may modify the characteristics of the migration waters such as the vessel, theair/water ratio in the flask, the S/V ratio of the material, the reference water, the experimentalconditions etc…Different experiments were conducted to try to draft a detailed procedure forthe preparation of the leachates.
Verification of the absence of impact of the jar on the cell response towards toxicityCRECEP performed a set of negative controls that can validate the cleanness of glassware andof the surrounding environment. A borosilicated glass jar is filled with reference waterwithout any material and kept at 23°C for 24 hours without agitation, the resulting water istested for cytotoxicity. No deviation was observed compared to the reference control (Table6), pointing out the quality of the cleaning of the glassware.
Effect of S/V ratioCRECEP selected two different S/V ratios for material 8 (Table 7), which is known to releasetoxic agents as shown in WP 1, in order to investigate the possible variation in thecytotoxicity response. The first S/V ratio corresponded to 200 cm2/L (WP 1 ratio) and thesecond to 10 cm2/L. Table 6 presents the obtained results.
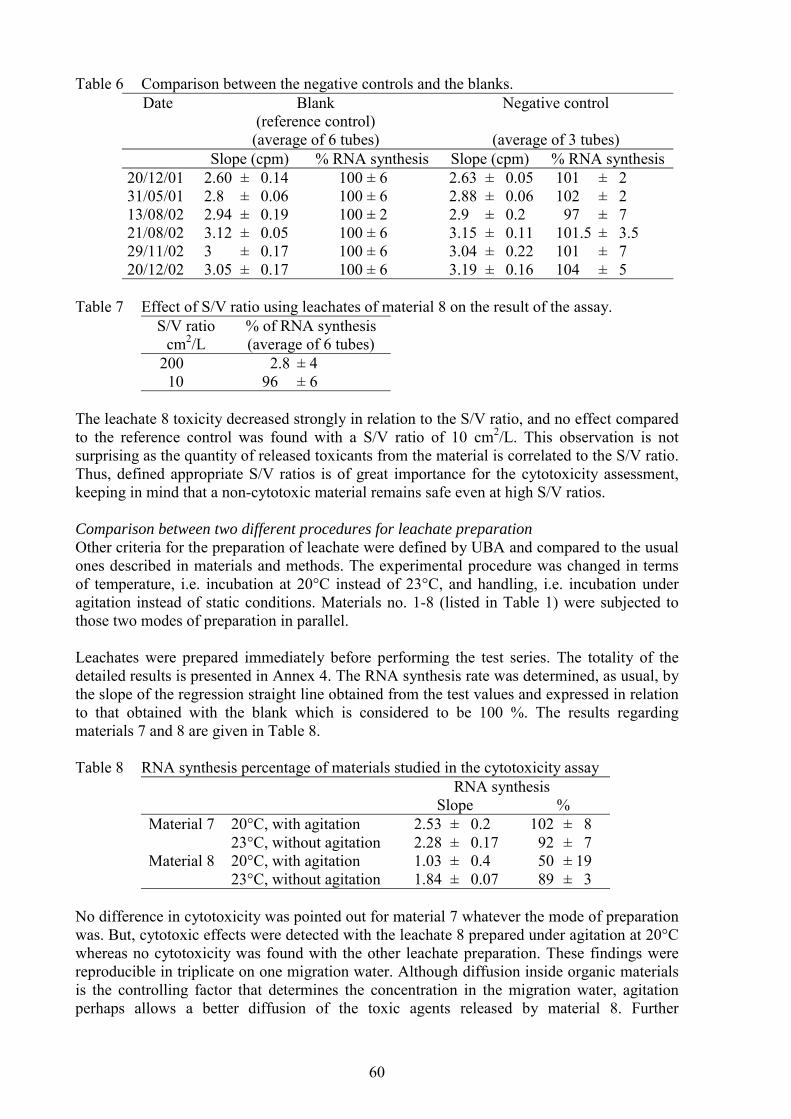
60
Table 6 Comparison between the negative controls and the blanks.Date Blank
(reference control)(average of 6 tubes)
Negative control
(average of 3 tubes)Slope (cpm) % RNA synthesis Slope (cpm) % RNA synthesis
20/12/01 2.60 ± 0.14 100 ± 6 2.63 ± 0.05 101 ± 231/05/01 2.8 ± 0.06 100 ± 6 2.88 ± 0.06 102 ± 213/08/02 2.94 ± 0.19 100 ± 2 2.9 ± 0.2 97 ± 721/08/02 3.12 ± 0.05 100 ± 6 3.15 ± 0.11 101.5 ± 3.529/11/02 3 ± 0.17 100 ± 6 3.04 ± 0.22 101 ± 720/12/02 3.05 ± 0.17 100 ± 6 3.19 ± 0.16 104 ± 5
Table 7 Effect of S/V ratio using leachates of material 8 on the result of the assay.S/V ratio
cm2/L% of RNA synthesis(average of 6 tubes)
200 2.8 ± 410 96 ± 6
The leachate 8 toxicity decreased strongly in relation to the S/V ratio, and no effect comparedto the reference control was found with a S/V ratio of 10 cm2/L. This observation is notsurprising as the quantity of released toxicants from the material is correlated to the S/V ratio.Thus, defined appropriate S/V ratios is of great importance for the cytotoxicity assessment,keeping in mind that a non-cytotoxic material remains safe even at high S/V ratios.
Comparison between two different procedures for leachate preparationOther criteria for the preparation of leachate were defined by UBA and compared to the usualones described in materials and methods. The experimental procedure was changed in termsof temperature, i.e. incubation at 20°C instead of 23°C, and handling, i.e. incubation underagitation instead of static conditions. Materials no. 1-8 (listed in Table 1) were subjected tothose two modes of preparation in parallel.
Leachates were prepared immediately before performing the test series. The totality of thedetailed results is presented in Annex 4. The RNA synthesis rate was determined, as usual, bythe slope of the regression straight line obtained from the test values and expressed in relationto that obtained with the blank which is considered to be 100 %. The results regardingmaterials 7 and 8 are given in Table 8.
Table 8 RNA synthesis percentage of materials studied in the cytotoxicity assayRNA synthesis
Slope %Material 7 20°C, with agitation 2.53 ± 0.2 102 ± 8
23°C, without agitation 2.28 ± 0.17 92 ± 7Material 8 20°C, with agitation 1.03 ± 0.4 50 ± 19
23°C, without agitation 1.84 ± 0.07 89 ± 3
No difference in cytotoxicity was pointed out for material 7 whatever the mode of preparationwas. But, cytotoxic effects were detected with the leachate 8 prepared under agitation at 20°Cwhereas no cytotoxicity was found with the other leachate preparation. These findings werereproducible in triplicate on one migration water. Although diffusion inside organic materialsis the controlling factor that determines the concentration in the migration water, agitationperhaps allows a better diffusion of the toxic agents released by material 8. Further
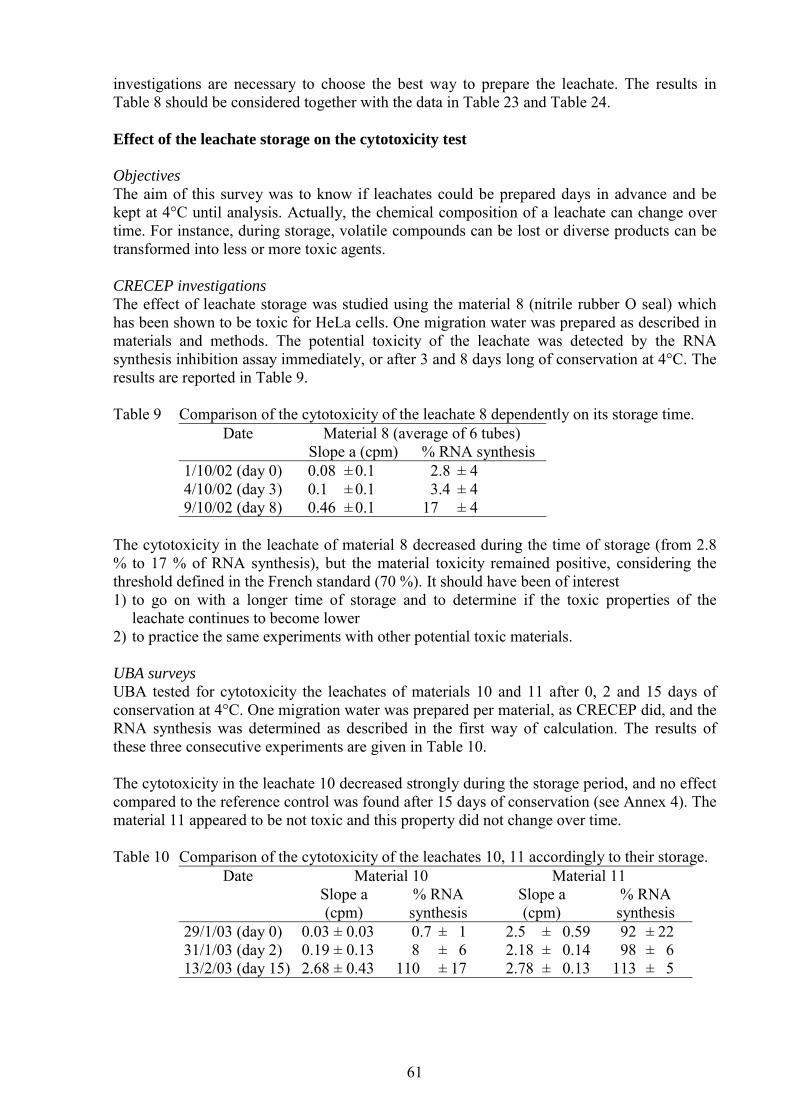
61
investigations are necessary to choose the best way to prepare the leachate. The results inTable 8 should be considered together with the data in Table 23 and Table 24.
Effect of the leachate storage on the cytotoxicity test
ObjectivesThe aim of this survey was to know if leachates could be prepared days in advance and bekept at 4°C until analysis. Actually, the chemical composition of a leachate can change overtime. For instance, during storage, volatile compounds can be lost or diverse products can betransformed into less or more toxic agents.
CRECEP investigationsThe effect of leachate storage was studied using the material 8 (nitrile rubber O seal) whichhas been shown to be toxic for HeLa cells. One migration water was prepared as described inmaterials and methods. The potential toxicity of the leachate was detected by the RNAsynthesis inhibition assay immediately, or after 3 and 8 days long of conservation at 4°C. Theresults are reported in Table 9.
Table 9 Comparison of the cytotoxicity of the leachate 8 dependently on its storage time.Date Material 8 (average of 6 tubes)
Slope a (cpm) % RNA synthesis1/10/02 (day 0) 0.08 ± 0.1 2.8 ± 44/10/02 (day 3) 0.1 ± 0.1 3.4 ± 49/10/02 (day 8) 0.46 ± 0.1 17 ± 4
The cytotoxicity in the leachate of material 8 decreased during the time of storage (from 2.8% to 17 % of RNA synthesis), but the material toxicity remained positive, considering thethreshold defined in the French standard (70 %). It should have been of interest 1) to go on with a longer time of storage and to determine if the toxic properties of the
leachate continues to become lower 2) to practice the same experiments with other potential toxic materials.
UBA surveysUBA tested for cytotoxicity the leachates of materials 10 and 11 after 0, 2 and 15 days ofconservation at 4°C. One migration water was prepared per material, as CRECEP did, and theRNA synthesis was determined as described in the first way of calculation. The results ofthese three consecutive experiments are given in Table 10.
The cytotoxicity in the leachate 10 decreased strongly during the storage period, and no effectcompared to the reference control was found after 15 days of conservation (see Annex 4). Thematerial 11 appeared to be not toxic and this property did not change over time.
Table 10 Comparison of the cytotoxicity of the leachates 10, 11 accordingly to their storage.Date Material 10 Material 11
Slope a(cpm)
% RNAsynthesis
Slope a(cpm)
% RNAsynthesis
29/1/03 (day 0) 0.03 ± 0.03 0.7 ± 1 2.5 ± 0.59 92 ± 2231/1/03 (day 2) 0.19 ± 0.13 8 ± 6 2.18 ± 0.14 98 ± 613/2/03 (day 15) 2.68 ± 0.43 110 ± 17 2.78 ± 0.13 113 ± 5

62
ConclusionThese experiments clearly show that the leachates should be tested at once and could not bekept over time without taking the risk to introduce modifications in the toxicity assessment.
Study of the cell viability, the cell growth and the incubation time
ObjectivesIn order to obtain reproducible and reliable results in each laboratory, HeLa cells insuspension must be in a constant healthy physiological state. Consequently different aspectsmight be taken into account to assess this constant cell physical fitness. To identify if the cellviability and the ability to divide, were relevant for this purpose, a set of experiments wasconducted testing simultaneously the microscopic cell aspect, the percentage of viability, thepercentage of growth and the percentage of RNA synthesis in blanks and positive controls.
MethodsCell viability can easily be assessed by an exclusion dye method. As UBA and TW routinelyused Trypan blue as a lethal colorant, it was decided to transpose this technique to theCRECEP institute. Briefly, after cell coloration with Trypan blue (0.4 % P/V), dead ordamaged cells are stained light purple violet whereas undamaged cells appear uncolouredunder a conventional microscopic observation. The ratio of counted coloured cells and totalcells is determined before and after incubation and the percentages of viable cells can bededuced. A criterion of cell viability was set to ± 80% in the blank tubes by UBA: thisthreshold should be reached to allow the experiment to be pursued with the kinetics.
Percentage of growth can be established by counting the number of cells before and afterincubation using an automatic particle counter (UBA and CRECEP) or a Neubauerhaemocytometer (TW). A 50 to 100% of growth is generally reached, conditionally with theincubation time and with the initial number of cells. The effect of different incubation timeswere investigated in parallel (from 17h to 23h).
ResultsPrior to any investigation, the macroscopic and microscopic cell aspects of each blank has tobe examined before and after incubation. White clumps must not be observed and the mediummust be yellowish. Cellular aggregates and/or fragments must be absent in the sample.
Results from TW and CRECEP are reported in Table 11 to Table 13 and Figure 3, which wasdrawn with Prism 3.03 software. The raw data corresponding to the CRECEP experiments aredetailed in Annex 5.
No correlation between the percentage of viable cells and the percentage of growth can beestablished. For instance, in Table 11 the percentage of growth of the blank is strongly altered(7 %) while the percentage of viable cells still remains at 97 % (above the UBA acceptancelimit of 80 %). Moreover, the percentage of cell viability can remain high (close to 90 %) inthe presence of the known toxic (potassium dichromate) whereas the cell growth is stronglyinhibited (close to 10 %) (Table 13). Exclusion dye methods only detect membrane modifications of the cell. but other harmfulevents (sublethal effects) can occur in the cell leading to an injured physiological state whichwon’t be revealed by those methods. Consequently, assessment of cell viability can't providesufficient information concerning the cell physical fitness.
High SD values were found for the assessment of growth rate in Table 12 that confirm thedifficulties TW encountered in getting a correct growth of the HeLa cells (lack of
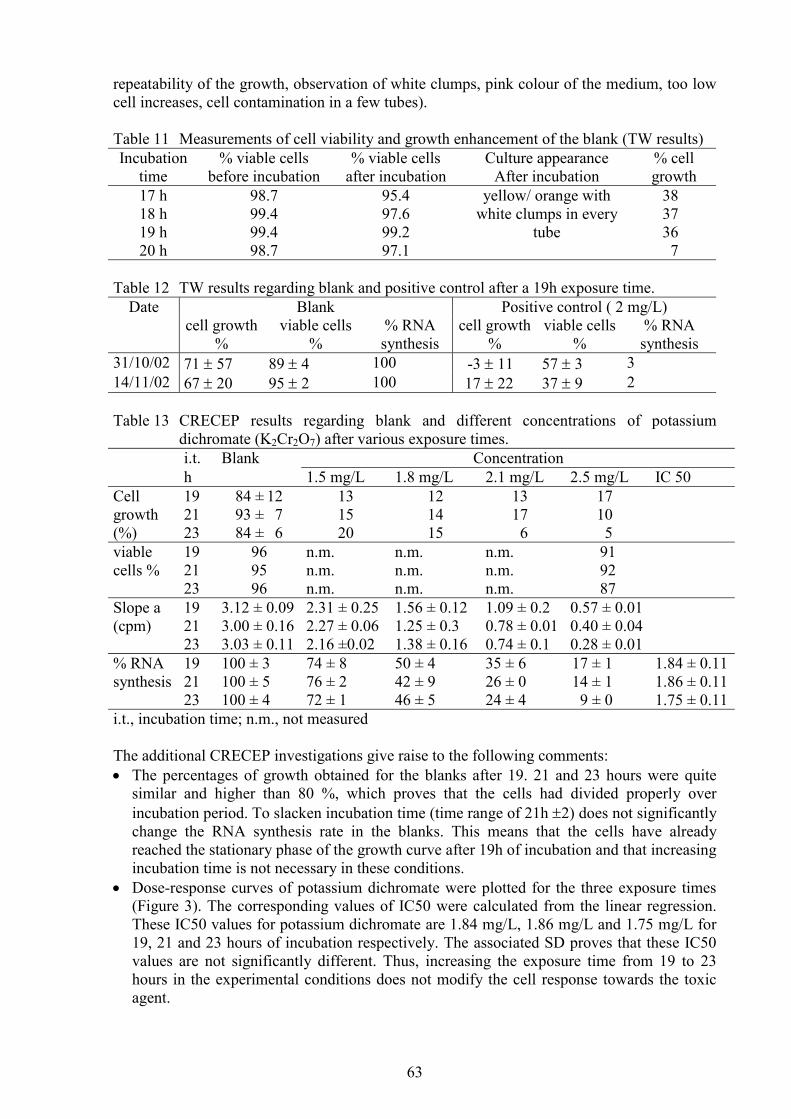
63
repeatability of the growth, observation of white clumps, pink colour of the medium, too lowcell increases, cell contamination in a few tubes).
Table 11 Measurements of cell viability and growth enhancement of the blank (TW results)Incubation
time% viable cells
before incubation% viable cells
after incubationCulture appearance
After incubation% cellgrowth
17 h18 h19 h20 h
98.799.499.498.7
95.497.699.297.1
yellow/ orange withwhite clumps in every
tube
3837367
Table 12 TW results regarding blank and positive control after a 19h exposure time.Date Blank Positive control ( 2 mg/L)
cell growth%
viable cells%
% RNAsynthesis
cell growth%
viable cells%
% RNAsynthesis
31/10/02 71 ± 57 89 ± 4 100 -3 ± 11 57 ± 3 314/11/02 67 ± 20 95 ± 2 100 17 ± 22 37 ± 9 2
Table 13 CRECEP results regarding blank and different concentrations of potassiumdichromate (K2Cr2O7) after various exposure times.i.t. Blank Concentrationh 1.5 mg/L 1.8 mg/L 2.1 mg/L 2.5 mg/L IC 5019 84 ± 12 13 12 13 1721 93 ± 7 15 14 17 10
Cellgrowth(%) 23 84 ± 6 20 15 6 5
19 96 n.m. n.m. n.m. 9121 95 n.m. n.m. n.m. 92
viablecells %
23 96 n.m. n.m. n.m. 8719 3.12 ± 0.09 2.31 ± 0.25 1.56 ± 0.12 1.09 ± 0.2 0.57 ± 0.0121 3.00 ± 0.16 2.27 ± 0.06 1.25 ± 0.3 0.78 ± 0.01 0.40 ± 0.04
Slope a(cpm)
23 3.03 ± 0.11 2.16 ±0.02 1.38 ± 0.16 0.74 ± 0.1 0.28 ± 0.0119 100 ± 3 74 ± 8 50 ± 4 35 ± 6 17 ± 1 1.84 ± 0.1121 100 ± 5 76 ± 2 42 ± 9 26 ± 0 14 ± 1 1.86 ± 0.11
% RNAsynthesis
23 100 ± 4 72 ± 1 46 ± 5 24 ± 4 9 ± 0 1.75 ± 0.11i.t., incubation time; n.m., not measured
The additional CRECEP investigations give raise to the following comments:• The percentages of growth obtained for the blanks after 19. 21 and 23 hours were quite
similar and higher than 80 %, which proves that the cells had divided properly overincubation period. To slacken incubation time (time range of 21h ±2) does not significantlychange the RNA synthesis rate in the blanks. This means that the cells have alreadyreached the stationary phase of the growth curve after 19h of incubation and that increasingincubation time is not necessary in these conditions.
• Dose-response curves of potassium dichromate were plotted for the three exposure times(Figure 3). The corresponding values of IC50 were calculated from the linear regression.These IC50 values for potassium dichromate are 1.84 mg/L, 1.86 mg/L and 1.75 mg/L for19, 21 and 23 hours of incubation respectively. The associated SD proves that these IC50values are not significantly different. Thus, increasing the exposure time from 19 to 23hours in the experimental conditions does not modify the cell response towards the toxicagent.

64
y = -284,7x + 119,58R2 = 0,9888
y = -254,16x + 117,13R2 = 0,9948
y = -275,85x + 118,5R2 = 0,9483
0
10
20
30
40
50
60
70
80
90
100
0,1 0,2 0,3 0,4 0,5log conc. (mg/l)
RN
A s
ynth
esis
23 h19 h21 h
Figure 3 Dose-response curves with potassium dichromate after different exposure times.
Moreover, 26 independent measurements of RNA synthesis after cells exposure to potassiumdichromate at 2 mg/L were realised by CRECEP. The results are summarised in Table 14. Anaverage of RNA synthesis of 52.65 % was deduced from these raw data with a SD of 6.58 %and a relative standard deviation (RSD) of 12.5 %, proving that the method is veryreproducible (Table 12).
The conclusions on these surveys are as follow:• the measurement of viable cells gives an additional information on the physiological state
of the cells. But only considering this criterion is far from being sufficient to verify thehealthy status of the cells. Beside this limitation, it was decided to check cell viabilitybefore and after the incubation step in the blanks, with an acceptance limit of 80 % ofviable cells.
• Dose-response curves of potassium dichromate clearly show the toxic effect of thisproduct, with an IC50 value of approximatel g/L, proving the ability of the RNAsynthesis inhibition assay to give a quantita repeatable response towards toxicchemicals. Independent measurements of RNAdichromate at 2 mg/L point out the high reprod
• The determination of the percentage of growthstate of the cells but also an indication oinadequate temperature or pH medium, for inswhatever was the healthy status of the cells acell growth of 50 to 100 % is supposed to be(CRECEP acceptance limit). This threshold w
• Slackening incubation time from 19h to 23hpercentage of viable cells remains close to 95RNA synthesis rate in the cells. Thus, if thegrowth are correct, an incubation time close to
• If the expected number of cells is not reachedfactors may have affected the cell growth: insor not tightly tubes, temperature changes in tinappropriate culture medium (pH, bacterial cThese parameters must be carefully checked. with a not enough accurate method, leading to
y 1.8 mtive and
synthesis after cells exposure to potassiumucibility of the method (RSD = 12.5 %). gives not only another data about the healthn the cell culture conditions. Actually, antance, leads to a poorly percentage of growtht the beginning of the incubation. A required reached in the blank tubes after incubation
as added to the final procedure. does not cause the death of the cells: the %. Neither does it cause any change in the cells are not injured and the conditions of 21 hours is quite appropriate. after a sufficient incubation period, differentufficient glassware cleaning, use of scratchedhe incubator, unsuitable speed of the stirrer,ontamination), bad cell physical fitness etc.Problems in the cell counting can also occur false cell number assessments.

65
• Each laboratory has to search for its doubling cell time and afterwards has to select the bestincubation time to measure RNA synthesis rate. Actually, the incubation time variesaccording to the length of the lag phase before the growth starts in suspension. This lagphase is correlated to the degree of confluence of the cells used in the survey. This couldbe an explanation of the difficulties encountered by TW, and sometimes, by UBA. Thisincubation time should be included in a time range of 21 ± 2 h for the HeLa S3 cells, aspreviously shown.
Table 14 Cytotoxicity measurements after cells exposure to dichromate potassium 2 mg/L.Date % of RNA synthesis Average of
% of RNA synthesisSD RSD
RSD = (100xSD)/avg26/04/0115/05/0131/05/011/06/0115/06/0120/06/0110/08/0114/09/0126/09/013/10/015/10/0112/10/0117/05/0224/05/0214/06/0221/08/0220/09/026/12/0219/12/0228/02/0321/03/0323/05/033/06/036/11/03
5757 - 57656941 - 4756525763515552465341544850505046515348
52.65 ± 6.58 12.5
Importance of the nature of the incubation vessel on the cytotoxicity test
The three institutes did not use the same vessel for the incubation step: UBA tookpolypropylene round bottom tubes (Falcon) whereas CRECEP and TW realised theincubation of the cells in borosilicated glass tubes. Therefore CRECEP decided to verify thatplastic tubes did not interfere with the test results (release of compounds. adsorption oftoxicants…). One sample, a toxic leachate from material 8 (nitrile rubber O seal), wasprepared as usual. Cells were incubated in the culture medium reconstituted with the leachate,either in plastic tubes, or in glass tubes. The percentage of RNA synthesis was measured asalready described. The resulting information is presented in Table 15.
Table 15 Comparison of two types of vessel for incubation on 8/10/02.Slope a % RNA synthesis
Blank in glass 2.7 ± 0.33 100 ± 12Material 8 in glass 0.46 ± 0.1 17 ± 4Blank in plastic 2.74 ± 0.33 100 ± 12Material 8 in plastic 0.93 ± 0.2 34 ± 7.5
The blanks show that the plastic containers do not release toxic compounds relative to glass.The toxicity of material 8 appears to be higher in glass tubes than in plastic ones : thepercentage of RNA synthesis is twice superior in case of plastic tubes. This might confirm thepossibility of adsorption effects of the toxic compounds to plastic. But further investigationsmust be planned to validate this hypothesis.
66
Study of the tritiated uridine decomposition over time
Radiolabelled uridine decreases in aqueous solution. The decomposition rate of radiolabelleduridine is determined by a combination of chemical, radiolytic and microbiological processes.
CRECEP investigated the radiolytic decomposition of tritiated uridine (AmershamBioscience) by kinetics of uridine uptake in the HeLa cells and by carrying on achromatography on 3MM paper in n-butanol-ethanol-water (104-66-30) as solvent. Theresults are summarised just below (Figure 1) and show a decrease in the peak of uridinerelated to the storage time.
Figure 4 shows the decrease of the peak of undamaged uridine overtime. As, the percentage ofincorporated uridine in the cells is proportional to the quantity of undamaged uridine, theassessment of the decomposition rate should be checked by chromatography or more easily bythe slope values of the blanks (keeping in mind that other factors can affect these slopevalues).
No experiment was conducted to evaluate the chemical and bacterial degradation of uridine,as uridine can be considered as a suitable metabolite by bacteria. Initially, TW sampled itsuridine with sterile pipette tips but not under sterile conditions (problem of laboratoryfunctionality). This repetitive contamination of the uridine solution over a long period of timecould lead to a diminution of its incorporation percentage in the HeLa cell. Thus, after theinitial experiments. TW used new batches of uridine for each experiment to reduce the chanceof the results being affected by bacterial contamination.
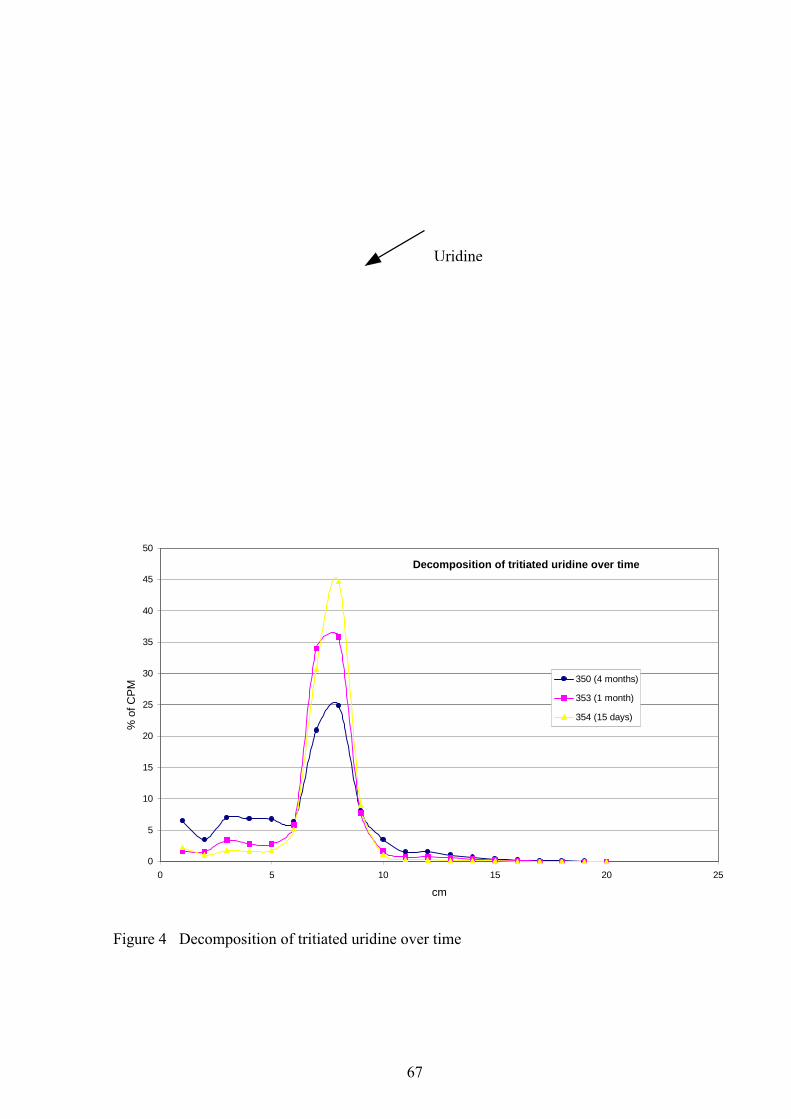
67
Decomposition of tritiated uridine over time
0
5
10
15
20
25
30
35
40
45
50
0 5 10 15 20 25
cm
% o
f CPM
350 (4 months)
353 (1 month)
354 (15 days)
Figure 4 Decomposition of tritiated uridine over time
Uridine

68
Importance of uridine batches of high quality grade
ObjectivesAs the quality of the 3H-uridine can affect the cytotoxicity test response (low cpm, lowincorporation rate, contamination), it seemed of interest to check the variability in the uridinebatches applied in this work. The degree of quality of the 3H-uridine can differ from batch tobatch, from supplier to supplier or can change over time after the opening of the bottle.
MethodsThe blanks were analysed in relation to the use of various uridine batches at CRECEP andUBA over a one year period.
ResultsTable 16 and Table 17 summarise the available results at CRECEP and UBA, respectively. Adecrease in the slope value of the linear regression would reveal the bad cell physiologicalstate as well as the quality of 3H-uridine.
Table 16 Impact of the uridine batches (Amersham Bioscience) on the cytotoxicity assay atCRECEP
Uridine batches (n°)
Number of blankmeasurements
Blank Average slopecpm
Standard Deviationcpm
364 30 3 ± 0.3 (10 %)362-1. -2. 364. 365. 366.367. 368. 369
271 3.01 ± 0.34 (11 %)
Table 17 Impact of the uridine batches purchased from ICN Biomedicals Inc. on thecytotoxicity assay at UBA
Number of testedurdine batches
Number of blankmeasurements
Blank Average slopecpm
Standard deviationcpm
> 2 41 2.5 ± 0.4 (16 %)
Using 8 different uridine batches of high quality grade (Amersham Bioscience) did notsignificantly change the results (Table 16). This point indicates that the use of various 3H-uridine batches from this supplier did not influence the cytotoxicity measurement.
Moreover, the absence of contamination of the uridine solution over time was checked: thirtymeasures were performed at CRECEP with a single uridine batch. The average slope valuewas greater than 1.75 with a SD of 10 %, which proves not only the absence of contaminationof the uridine batch, but also the constant fitness of the HeLa cell cultures and the goodreproducibility of the blank control measurements. The sampling of the radiolabelledcompound is always done under sterile conditions at CRECEP, thus avoiding anycontamination as mentioned before.
Similar investigations were undertaken at UBA and similar results were obtained (Table 17).Actually, the average slope values differ slightly between CRECEP and UBA: this reflects theproper but different growth culture conditions of each laboratory.
ConclusionEach laboratory should maintain a Shewart chart of the blank average slope values, whichserves as a tool to detect deviating blank slopes. Laboratories should check the purity(absence of microbial contamination) and the quality (choice of a good supplier) of the 3H-
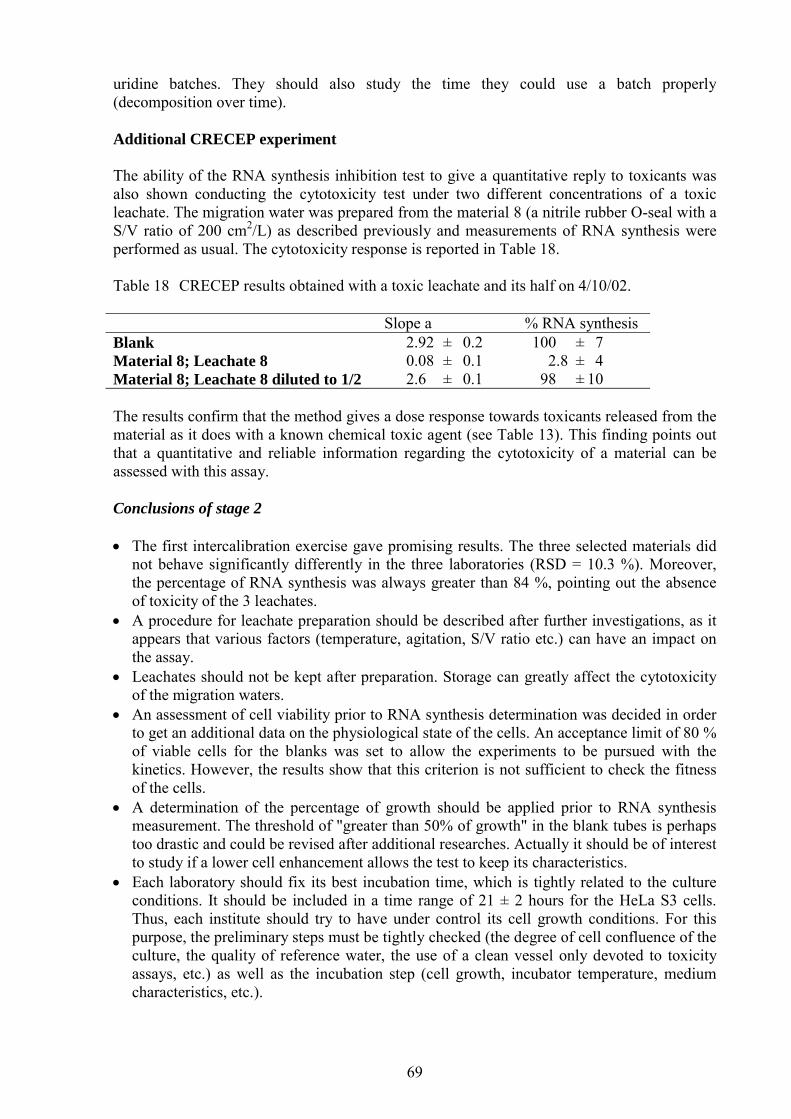
69
uridine batches. They should also study the time they could use a batch properly(decomposition over time).
Additional CRECEP experiment
The ability of the RNA synthesis inhibition test to give a quantitative reply to toxicants wasalso shown conducting the cytotoxicity test under two different concentrations of a toxicleachate. The migration water was prepared from the material 8 (a nitrile rubber O-seal with aS/V ratio of 200 cm2/L) as described previously and measurements of RNA synthesis wereperformed as usual. The cytotoxicity response is reported in Table 18.
Table 18 CRECEP results obtained with a toxic leachate and its half on 4/10/02.
Slope a % RNA synthesisBlank 2.92 ± 0.2 100 ± 7Material 8; Leachate 8 0.08 ± 0.1 2.8 ± 4Material 8; Leachate 8 diluted to 1/2 2.6 ± 0.1 98 ± 10
The results confirm that the method gives a dose response towards toxicants released from thematerial as it does with a known chemical toxic agent (see Table 13). This finding points outthat a quantitative and reliable information regarding the cytotoxicity of a material can beassessed with this assay.
Conclusions of stage 2
• The first intercalibration exercise gave promising results. The three selected materials didnot behave significantly differently in the three laboratories (RSD = 10.3 %). Moreover,the percentage of RNA synthesis was always greater than 84 %, pointing out the absenceof toxicity of the 3 leachates.
• A procedure for leachate preparation should be described after further investigations, as itappears that various factors (temperature, agitation, S/V ratio etc.) can have an impact onthe assay.
• Leachates should not be kept after preparation. Storage can greatly affect the cytotoxicityof the migration waters.
• An assessment of cell viability prior to RNA synthesis determination was decided in orderto get an additional data on the physiological state of the cells. An acceptance limit of 80 %of viable cells for the blanks was set to allow the experiments to be pursued with thekinetics. However, the results show that this criterion is not sufficient to check the fitnessof the cells.
• A determination of the percentage of growth should be applied prior to RNA synthesismeasurement. The threshold of "greater than 50% of growth" in the blank tubes is perhapstoo drastic and could be revised after additional researches. Actually it should be of interestto study if a lower cell enhancement allows the test to keep its characteristics.
• Each laboratory should fix its best incubation time, which is tightly related to the cultureconditions. It should be included in a time range of 21 ± 2 hours for the HeLa S3 cells.Thus, each institute should try to have under control its cell growth conditions. For thispurpose, the preliminary steps must be tightly checked (the degree of cell confluence of theculture, the quality of reference water, the use of a clean vessel only devoted to toxicityassays, etc.) as well as the incubation step (cell growth, incubator temperature, mediumcharacteristics, etc.).
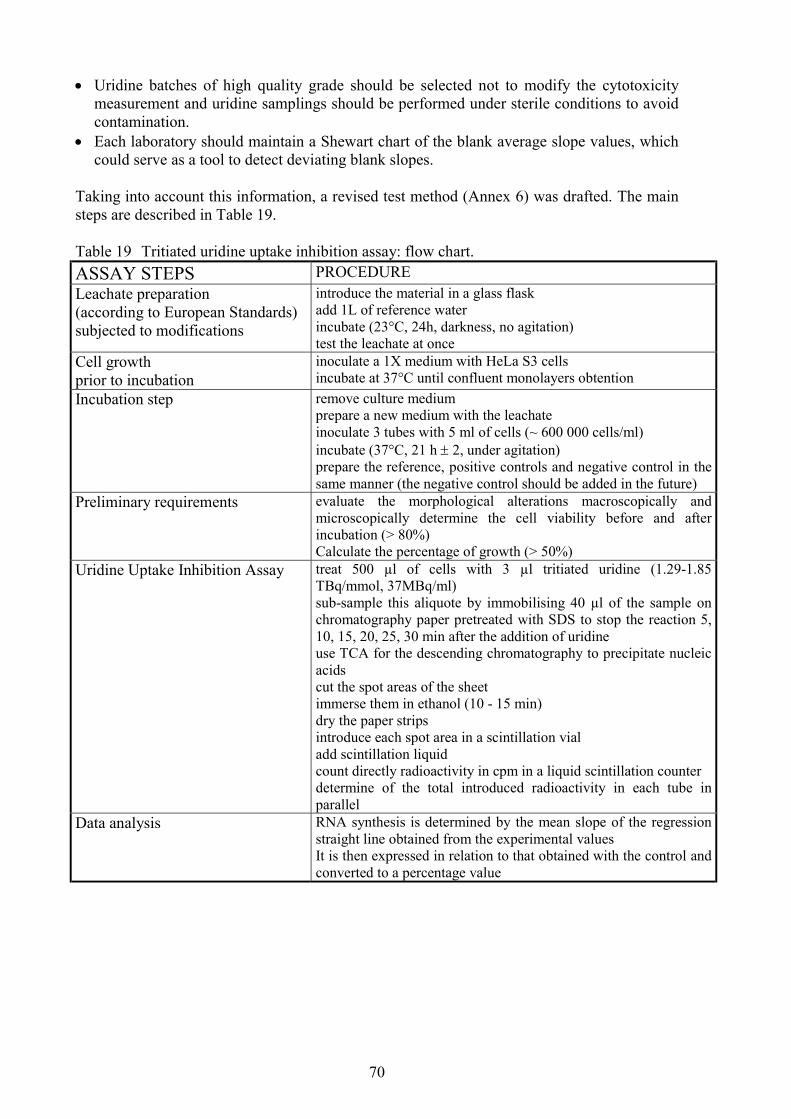
70
• Uridine batches of high quality grade should be selected not to modify the cytotoxicitymeasurement and uridine samplings should be performed under sterile conditions to avoidcontamination.
• Each laboratory should maintain a Shewart chart of the blank average slope values, whichcould serve as a tool to detect deviating blank slopes.
Taking into account this information, a revised test method (Annex 6) was drafted. The mainsteps are described in Table 19.
Table 19 Tritiated uridine uptake inhibition assay: flow chart.ASSAY STEPS PROCEDURELeachate preparation(according to European Standards)subjected to modifications
introduce the material in a glass flaskadd 1L of reference waterincubate (23°C, 24h, darkness, no agitation)test the leachate at once
Cell growth prior to incubation
inoculate a 1X medium with HeLa S3 cells incubate at 37°C until confluent monolayers obtention
Incubation step remove culture mediumprepare a new medium with the leachateinoculate 3 tubes with 5 ml of cells (~ 600 000 cells/ml)incubate (37°C, 21 h ± 2, under agitation)prepare the reference, positive controls and negative control in thesame manner (the negative control should be added in the future)
Preliminary requirements evaluate the morphological alterations macroscopically andmicroscopically determine the cell viability before and afterincubation (> 80%)Calculate the percentage of growth (> 50%)
Uridine Uptake Inhibition Assay treat 500 µl of cells with 3 µl tritiated uridine (1.29-1.85TBq/mmol, 37MBq/ml)sub-sample this aliquote by immobilising 40 µl of the sample onchromatography paper pretreated with SDS to stop the reaction 5,10, 15, 20, 25, 30 min after the addition of uridineuse TCA for the descending chromatography to precipitate nucleicacidscut the spot areas of the sheetimmerse them in ethanol (10 - 15 min)dry the paper stripsintroduce each spot area in a scintillation vialadd scintillation liquidcount directly radioactivity in cpm in a liquid scintillation counterdetermine of the total introduced radioactivity in each tube inparallel
Data analysis RNA synthesis is determined by the mean slope of the regressionstraight line obtained from the experimental valuesIt is then expressed in relation to that obtained with the control andconverted to a percentage value
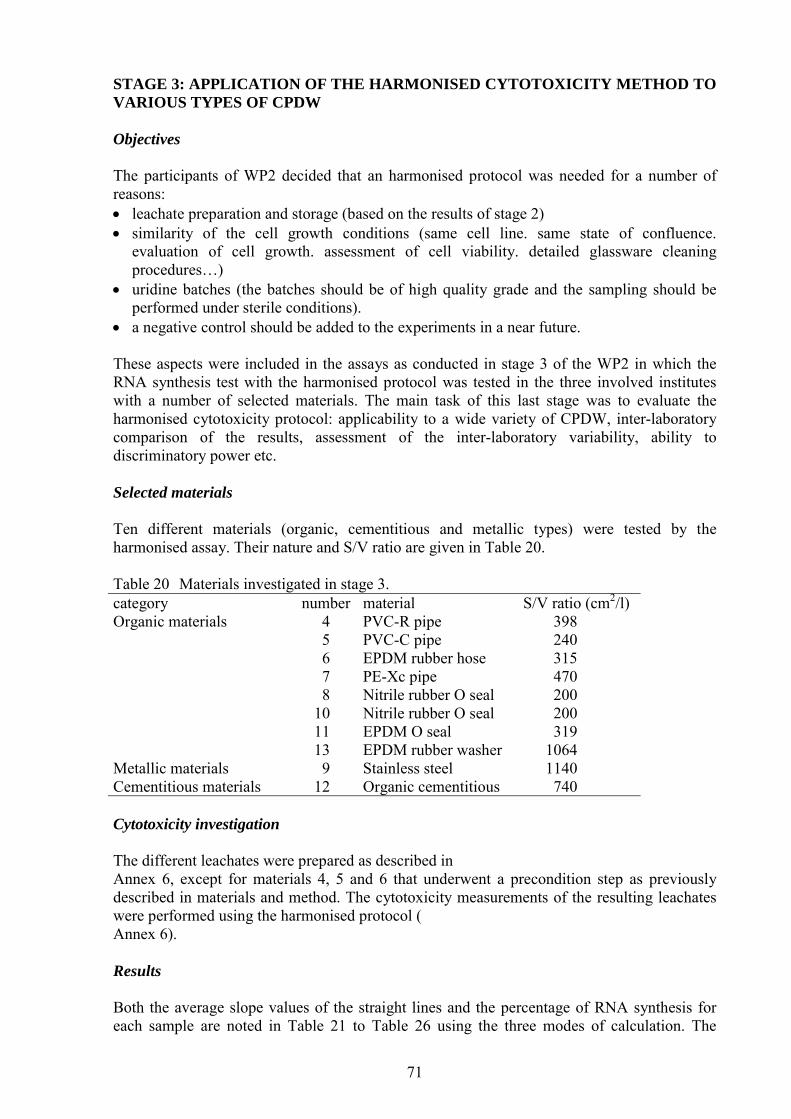
71
STAGE 3: APPLICATION OF THE HARMONISED CYTOTOXICITY METHOD TOVARIOUS TYPES OF CPDW
Objectives
The participants of WP2 decided that an harmonised protocol was needed for a number ofreasons:• leachate preparation and storage (based on the results of stage 2)• similarity of the cell growth conditions (same cell line. same state of confluence.
evaluation of cell growth. assessment of cell viability. detailed glassware cleaningprocedures…)
• uridine batches (the batches should be of high quality grade and the sampling should beperformed under sterile conditions).
• a negative control should be added to the experiments in a near future.
These aspects were included in the assays as conducted in stage 3 of the WP2 in which theRNA synthesis test with the harmonised protocol was tested in the three involved instituteswith a number of selected materials. The main task of this last stage was to evaluate theharmonised cytotoxicity protocol: applicability to a wide variety of CPDW, inter-laboratorycomparison of the results, assessment of the inter-laboratory variability, ability todiscriminatory power etc.
Selected materials
Ten different materials (organic, cementitious and metallic types) were tested by theharmonised assay. Their nature and S/V ratio are given in Table 20.
Table 20 Materials investigated in stage 3.category number material S/V ratio (cm2/l)Organic materials
Metallic materialsCementitious materials
45678
1011139
12
PVC-R pipePVC-C pipeEPDM rubber hosePE-Xc pipeNitrile rubber O sealNitrile rubber O sealEPDM O sealEPDM rubber washerStainless steelOrganic cementitious
398240315470200200319
10641140740
Cytotoxicity investigation
The different leachates were prepared as described in Annex 6, except for materials 4, 5 and 6 that underwent a precondition step as previouslydescribed in materials and method. The cytotoxicity measurements of the resulting leachateswere performed using the harmonised protocol (Annex 6).
Results
Both the average slope values of the straight lines and the percentage of RNA synthesis foreach sample are noted in Table 21 to Table 26 using the three modes of calculation. The
72
EPDM rubber washer and the organic cementitious were received by CRECEP at the end ofthe project and, therefore, were only investigated by this institute; the obtained results aresummarised in Table 27 and Table 28. The raw data for the whole materials are presented in Annex 7 to Annex 10.
Various replicates or points were discarded in the first way of calculation, however, for theother two methods of calculation these data points were not excluded:• concerning UBA, one data of two replicates was omitted (last point of the straight line) for
material 4 and material 5 (9/11/01), one data of one replicate was not taken into account(last point of the straight line) and one replicate was excluded (R2< 0.98) for material 6,one duplicate was removed (R2< 0.98, a< 1.75) for the blank (6/9/02), one data of tworeplicates was not taken into account (last point of the straight line) for the blank (20/9/02),one duplicate was removed (R2< 0.98) for the blank (11/9/02), one data of one replicatewas omitted for material 7 (20/9/02), one data of one replicate was omitted (13/2/03) andone replicate was discarded (different accuracy of range) (31/1/03) for material 11.
• concerning TW, one replicate was excluded for material 5 (positive intercept. R2< 0.98).• concerning CRECEP, one of the six replicates was not taken into account (R2< 0.98) for
material 4, one data of two replicates was removed (last point of the straight line) and onereplicate was omitted (R2< 0.98) for the blank (13/8/02), one data of two replicates wasomitted (last point of the straight line) for the blank (29/11/02), one data of three replicateswas omitted (last point of the straight line) and one replicate discarded (R2< 0.98) for theblank (29/11/02), one data of five replicates was discarded (last point of the straight line)and one replicate removed (a< 1.75) for the blank (21/8/02), one data of three replicateswas not taken into account (last point of the straight line) for material 7 (13/8/02), one dataof six replicates was omitted (last point of the straight line) for material 7 (21/8/02), onereplicate was removed (red tube) for the blank (20/12/02), one data of one replicate wasdiscarded for material 9, one data of one replicate was not taken into account (last point ofthe straight line) and one replicate was excluded (R2< 0.98) for material 10 (29/11/02), onedata of five replicates was omitted (last point of the straight line) for material 10 (6/12/02),one data of one replicate was discarded (20 minutes point) and one duplicate was removed(different accuracy of range) for material 11 (6/12/02), one data of two replicates was nottaken into account (last point of the straight line) for material 12.
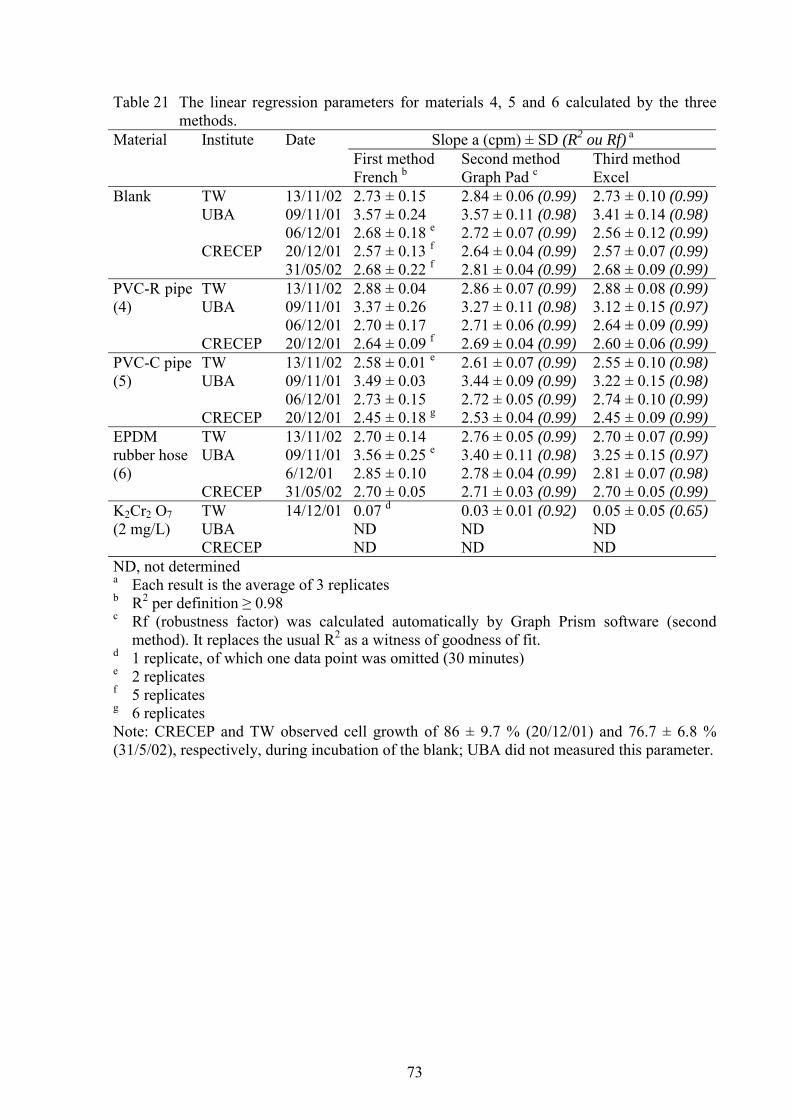
73
Table 21 The linear regression parameters for materials 4, 5 and 6 calculated by the threemethods.
Material Institute Date Slope a (cpm) ± SD (R2 ou Rf) a
First methodFrench b
Second methodGraph Pad c
Third methodExcel
Blank TWUBA
CRECEP
13/11/0209/11/0106/12/0120/12/0131/05/02
2.73 ± 0.153.57 ± 0.242.68 ± 0.18 e2.57 ± 0.13 f2.68 ± 0.22 f
2.84 ± 0.06 (0.99)3.57 ± 0.11 (0.98)2.72 ± 0.07 (0.99)2.64 ± 0.04 (0.99)2.81 ± 0.04 (0.99)
2.73 ± 0.10 (0.99)3.41 ± 0.14 (0.98)2.56 ± 0.12 (0.99)2.57 ± 0.07 (0.99)2.68 ± 0.09 (0.99)
PVC-R pipe(4)
TWUBA
CRECEP
13/11/0209/11/0106/12/0120/12/01
2.88 ± 0.043.37 ± 0.262.70 ± 0.172.64 ± 0.09 f
2.86 ± 0.07 (0.99)3.27 ± 0.11 (0.98)2.71 ± 0.06 (0.99)2.69 ± 0.04 (0.99)
2.88 ± 0.08 (0.99)3.12 ± 0.15 (0.97)2.64 ± 0.09 (0.99)2.60 ± 0.06 (0.99)
PVC-C pipe(5)
TWUBA
CRECEP
13/11/0209/11/0106/12/0120/12/01
2.58 ± 0.01 e3.49 ± 0.032.73 ± 0.152.45 ± 0.18 g
2.61 ± 0.07 (0.99)3.44 ± 0.09 (0.99)2.72 ± 0.05 (0.99)2.53 ± 0.04 (0.99)
2.55 ± 0.10 (0.98)3.22 ± 0.15 (0.98)2.74 ± 0.10 (0.99)2.45 ± 0.09 (0.99)
EPDMrubber hose(6)
TWUBA
CRECEP
13/11/0209/11/016/12/0131/05/02
2.70 ± 0.143.56 ± 0.25 e2.85 ± 0.102.70 ± 0.05
2.76 ± 0.05 (0.99)3.40 ± 0.11 (0.98)2.78 ± 0.04 (0.99)2.71 ± 0.03 (0.99)
2.70 ± 0.07 (0.99)3.25 ± 0.15 (0.97)2.81 ± 0.07 (0.98)2.70 ± 0.05 (0.99)
K2Cr2 O7(2 mg/L)
TWUBACRECEP
14/12/01 0.07 dNDND
0.03 ± 0.01 (0.92)NDND
0.05 ± 0.05 (0.65)NDND
ND, not determineda Each result is the average of 3 replicates b R2 per definition ≥ 0.98c Rf (robustness factor) was calculated automatically by Graph Prism software (second
method). It replaces the usual R2 as a witness of goodness of fit.d 1 replicate, of which one data point was omitted (30 minutes)e 2 replicatesf 5 replicatesg 6 replicatesNote: CRECEP and TW observed cell growth of 86 ± 9.7 % (20/12/01) and 76.7 ± 6.8 %(31/5/02), respectively, during incubation of the blank; UBA did not measured this parameter.
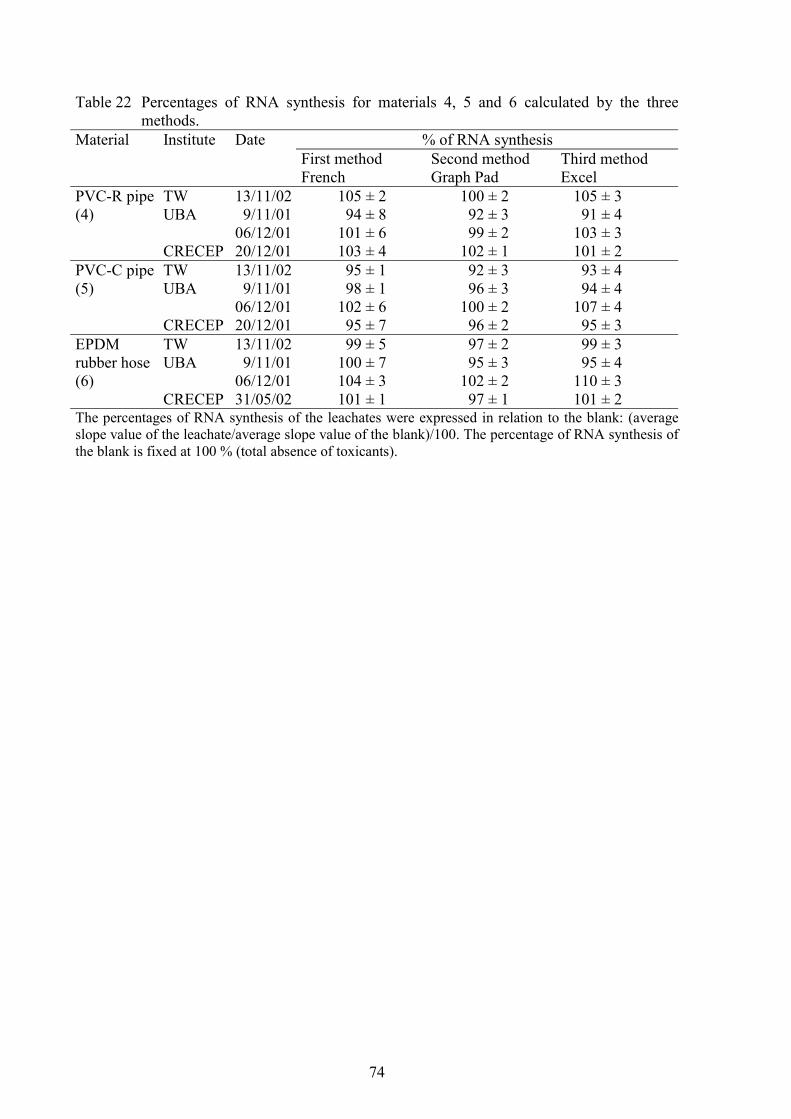
74
Table 22 Percentages of RNA synthesis for materials 4, 5 and 6 calculated by the threemethods.
Material Institute Date % of RNA synthesisFirst methodFrench
Second methodGraph Pad
Third methodExcel
PVC-R pipe(4)
TWUBA
CRECEP
13/11/029/11/01
06/12/0120/12/01
105 ± 294 ± 8
101 ± 6103 ± 4
100 ± 292 ± 399 ± 2
102 ± 1
105 ± 391 ± 4
103 ± 3101 ± 2
PVC-C pipe(5)
TWUBA
CRECEP
13/11/029/11/01
06/12/0120/12/01
95 ± 198 ± 1
102 ± 695 ± 7
92 ± 396 ± 3
100 ± 296 ± 2
93 ± 494 ± 4
107 ± 495 ± 3
EPDMrubber hose(6)
TWUBA
CRECEP
13/11/029/11/01
06/12/0131/05/02
99 ± 5100 ± 7104 ± 3101 ± 1
97 ± 295 ± 3
102 ± 297 ± 1
99 ± 395 ± 4
110 ± 3101 ± 2
The percentages of RNA synthesis of the leachates were expressed in relation to the blank: (averageslope value of the leachate/average slope value of the blank)/100. The percentage of RNA synthesis ofthe blank is fixed at 100 % (total absence of toxicants).
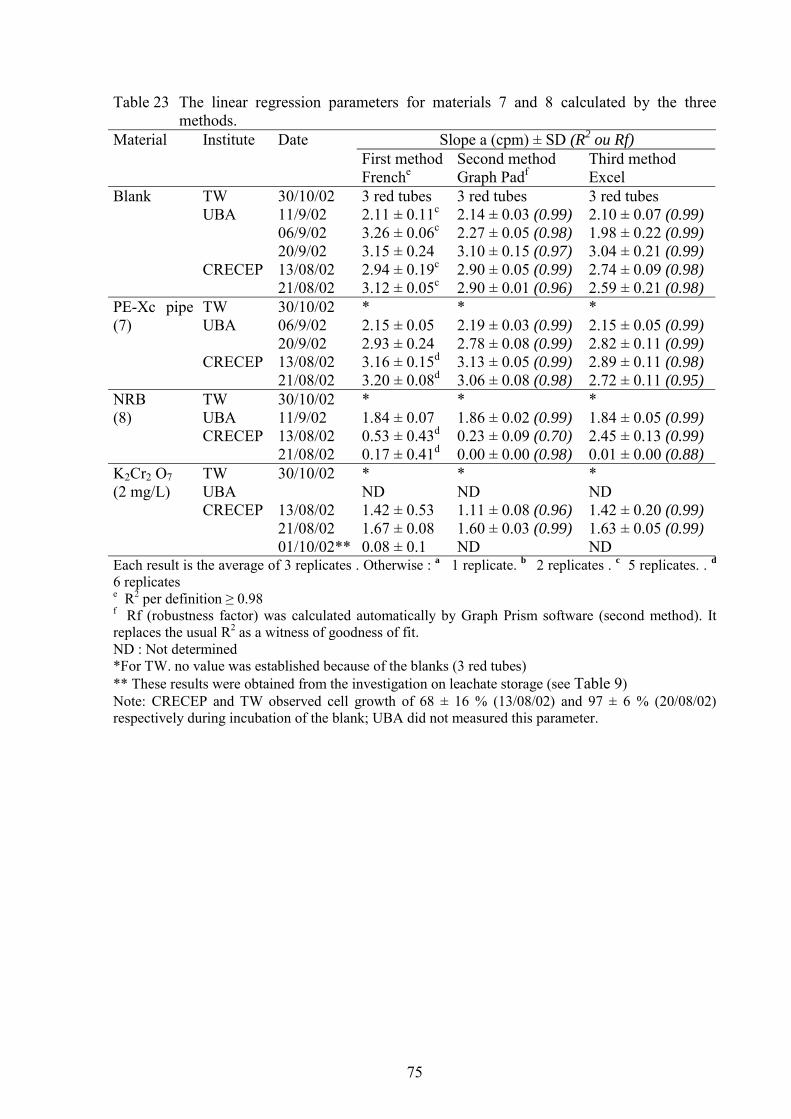
75
Table 23 The linear regression parameters for materials 7 and 8 calculated by the threemethods.
Material Institute Date Slope a (cpm) ± SD (R2 ou Rf)First methodFrenche
Second methodGraph Padf
Third methodExcel
Blank TWUBA
CRECEP
30/10/0211/9/0206/9/0220/9/0213/08/0221/08/02
3 red tubes2.11 ± 0.11c
3.26 ± 0.06c
3.15 ± 0.242.94 ± 0.19c
3.12 ± 0.05c
3 red tubes2.14 ± 0.03 (0.99)2.27 ± 0.05 (0.98)3.10 ± 0.15 (0.97)2.90 ± 0.05 (0.99)2.90 ± 0.01 (0.96)
3 red tubes2.10 ± 0.07 (0.99)1.98 ± 0.22 (0.99)3.04 ± 0.21 (0.99)2.74 ± 0.09 (0.98)2.59 ± 0.21 (0.98)
PE-Xc pipe(7)
TWUBA
CRECEP
30/10/0206/9/0220/9/0213/08/0221/08/02
*2.15 ± 0.052.93 ± 0.243.16 ± 0.15d
3.20 ± 0.08d
*2.19 ± 0.03 (0.99)2.78 ± 0.08 (0.99)3.13 ± 0.05 (0.99)3.06 ± 0.08 (0.98)
*2.15 ± 0.05 (0.99)2.82 ± 0.11 (0.99)2.89 ± 0.11 (0.98)2.72 ± 0.11 (0.95)
NRB(8)
TWUBACRECEP
30/10/0211/9/0213/08/0221/08/02
*1.84 ± 0.070.53 ± 0.43d
0.17 ± 0.41d
*1.86 ± 0.02 (0.99)0.23 ± 0.09 (0.70)0.00 ± 0.00 (0.98)
*1.84 ± 0.05 (0.99)2.45 ± 0.13 (0.99)0.01 ± 0.00 (0.88)
K2Cr2 O7(2 mg/L)
TWUBACRECEP
30/10/02
13/08/0221/08/0201/10/02**
*ND1.42 ± 0.531.67 ± 0.080.08 ± 0.1
*ND1.11 ± 0.08 (0.96)1.60 ± 0.03 (0.99)ND
*ND1.42 ± 0.20 (0.99)1.63 ± 0.05 (0.99)ND
Each result is the average of 3 replicates . Otherwise : a 1 replicate. b 2 replicates . c 5 replicates. . d
6 replicatese R2 per definition ≥ 0.98f Rf (robustness factor) was calculated automatically by Graph Prism software (second method). Itreplaces the usual R2 as a witness of goodness of fit.ND : Not determined*For TW. no value was established because of the blanks (3 red tubes)** These results were obtained from the investigation on leachate storage (see Table 9)Note: CRECEP and TW observed cell growth of 68 ± 16 % (13/08/02) and 97 ± 6 % (20/08/02)respectively during incubation of the blank; UBA did not measured this parameter.
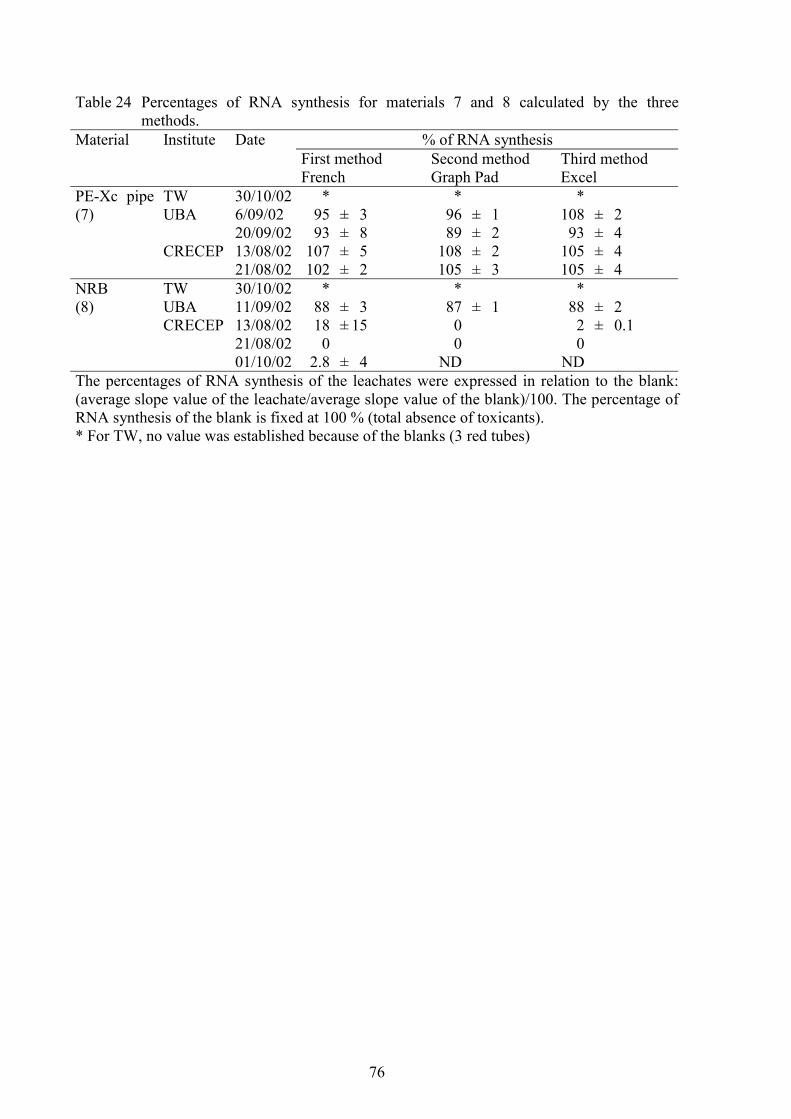
76
Table 24 Percentages of RNA synthesis for materials 7 and 8 calculated by the threemethods.
Material Institute Date % of RNA synthesisFirst methodFrench
Second methodGraph Pad
Third methodExcel
PE-Xc pipe(7)
TWUBA
CRECEP
30/10/026/09/0220/09/0213/08/0221/08/02
*95 ± 393 ± 8
107 ± 5102 ± 2
*96 ± 189 ± 2
108 ± 2105 ± 3
*108 ± 293 ± 4
105 ± 4105 ± 4
NRB (8)
TWUBACRECEP
30/10/0211/09/0213/08/0221/08/0201/10/02
*88 ± 318 ± 150
2.8 ± 4
*87 ± 100
ND
*88 ± 22 ± 0.10
NDThe percentages of RNA synthesis of the leachates were expressed in relation to the blank:(average slope value of the leachate/average slope value of the blank)/100. The percentage ofRNA synthesis of the blank is fixed at 100 % (total absence of toxicants).* For TW, no value was established because of the blanks (3 red tubes)
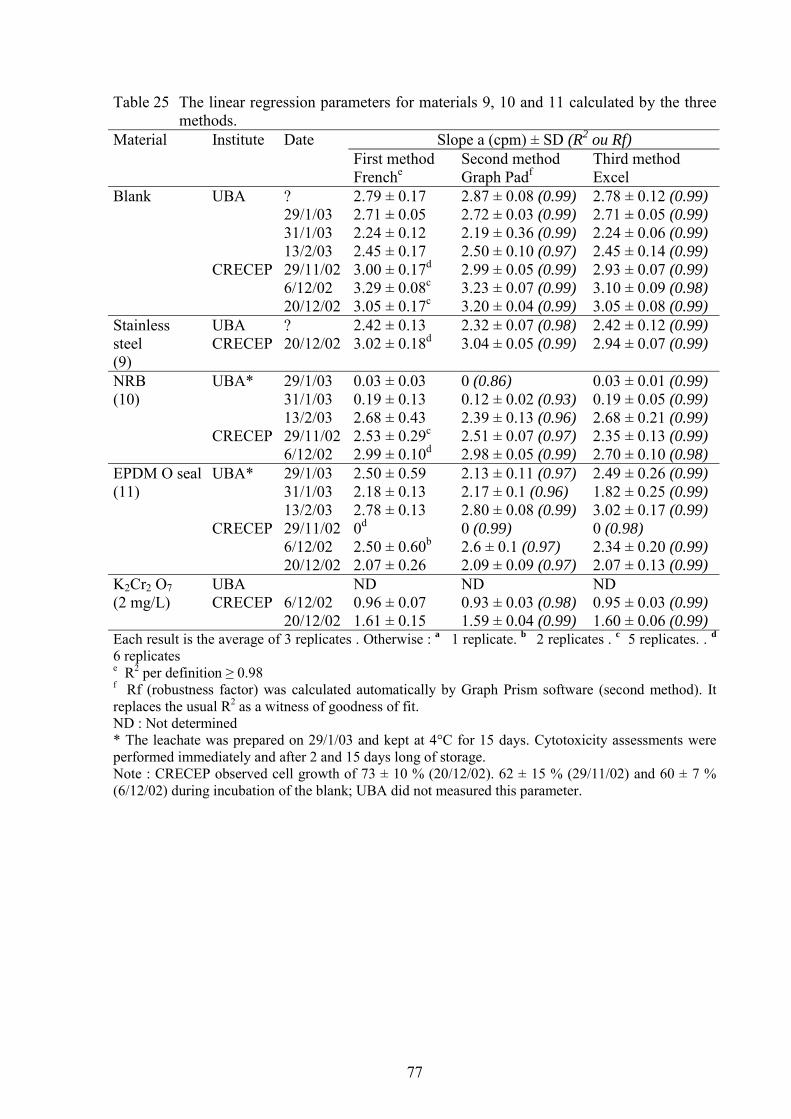
77
Table 25 The linear regression parameters for materials 9, 10 and 11 calculated by the threemethods.
Material Institute Date Slope a (cpm) ± SD (R2 ou Rf)First methodFrenche
Second methodGraph Padf
Third methodExcel
Blank UBA
CRECEP
?29/1/0331/1/0313/2/0329/11/026/12/0220/12/02
2.79 ± 0.172.71 ± 0.052.24 ± 0.122.45 ± 0.173.00 ± 0.17d
3.29 ± 0.08c
3.05 ± 0.17c
2.87 ± 0.08 (0.99)2.72 ± 0.03 (0.99)2.19 ± 0.36 (0.99)2.50 ± 0.10 (0.97)2.99 ± 0.05 (0.99)3.23 ± 0.07 (0.99)3.20 ± 0.04 (0.99)
2.78 ± 0.12 (0.99)2.71 ± 0.05 (0.99)2.24 ± 0.06 (0.99)2.45 ± 0.14 (0.99)2.93 ± 0.07 (0.99)3.10 ± 0.09 (0.98)3.05 ± 0.08 (0.99)
Stainlesssteel(9)
UBACRECEP
?20/12/02
2.42 ± 0.133.02 ± 0.18d
2.32 ± 0.07 (0.98)3.04 ± 0.05 (0.99)
2.42 ± 0.12 (0.99)2.94 ± 0.07 (0.99)
NRB(10)
UBA*
CRECEP
29/1/0331/1/0313/2/0329/11/026/12/02
0.03 ± 0.030.19 ± 0.132.68 ± 0.432.53 ± 0.29c
2.99 ± 0.10d
0 (0.86)0.12 ± 0.02 (0.93)2.39 ± 0.13 (0.96)2.51 ± 0.07 (0.97)2.98 ± 0.05 (0.99)
0.03 ± 0.01 (0.99)0.19 ± 0.05 (0.99)2.68 ± 0.21 (0.99)2.35 ± 0.13 (0.99)2.70 ± 0.10 (0.98)
EPDM O seal(11)
UBA*
CRECEP
29/1/0331/1/0313/2/0329/11/026/12/0220/12/02
2.50 ± 0.592.18 ± 0.132.78 ± 0.130d
2.50 ± 0.60b
2.07 ± 0.26
2.13 ± 0.11 (0.97)2.17 ± 0.1 (0.96)2.80 ± 0.08 (0.99)0 (0.99)2.6 ± 0.1 (0.97)2.09 ± 0.09 (0.97)
2.49 ± 0.26 (0.99)1.82 ± 0.25 (0.99)3.02 ± 0.17 (0.99)0 (0.98)2.34 ± 0.20 (0.99)2.07 ± 0.13 (0.99)
K2Cr2 O7(2 mg/L)
UBACRECEP 6/12/02
20/12/02
ND0.96 ± 0.071.61 ± 0.15
ND0.93 ± 0.03 (0.98)1.59 ± 0.04 (0.99)
ND0.95 ± 0.03 (0.99)1.60 ± 0.06 (0.99)
Each result is the average of 3 replicates . Otherwise : a 1 replicate. b 2 replicates . c 5 replicates. . d
6 replicatese R2 per definition ≥ 0.98f Rf (robustness factor) was calculated automatically by Graph Prism software (second method). Itreplaces the usual R2 as a witness of goodness of fit.ND : Not determined* The leachate was prepared on 29/1/03 and kept at 4°C for 15 days. Cytotoxicity assessments wereperformed immediately and after 2 and 15 days long of storage.Note : CRECEP observed cell growth of 73 ± 10 % (20/12/02). 62 ± 15 % (29/11/02) and 60 ± 7 %(6/12/02) during incubation of the blank; UBA did not measured this parameter.
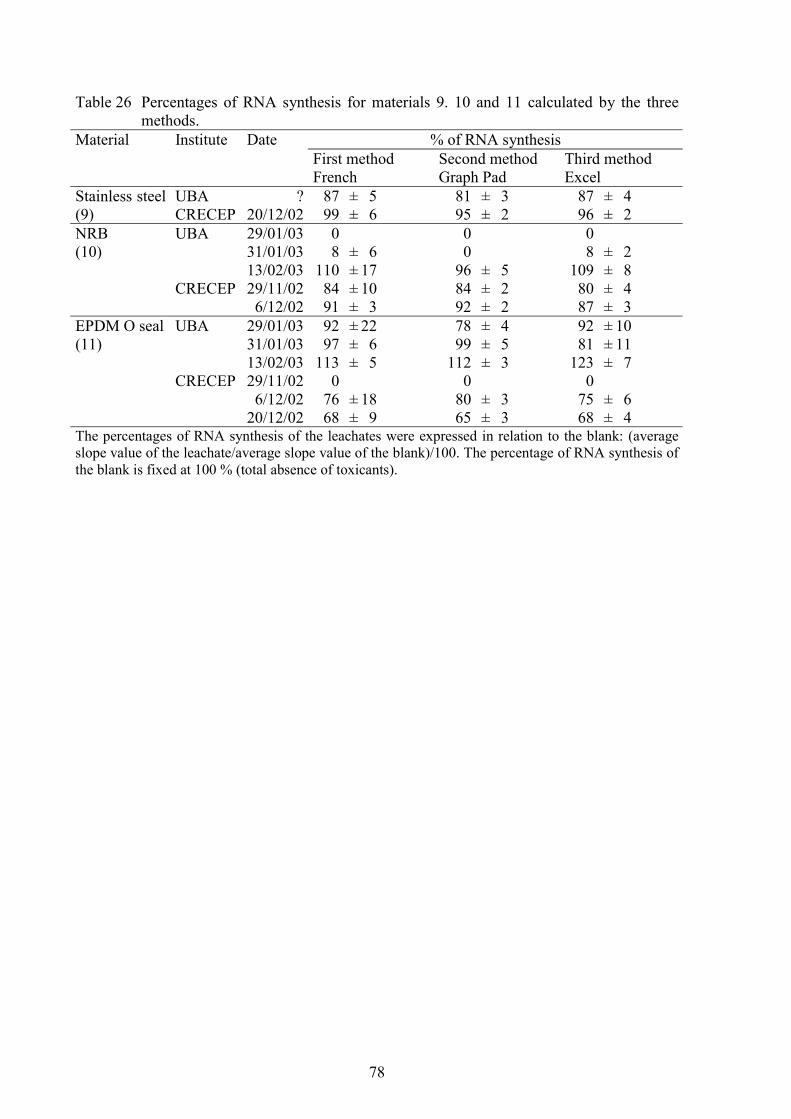
78
Table 26 Percentages of RNA synthesis for materials 9. 10 and 11 calculated by the threemethods.
Material Institute Date % of RNA synthesisFirst methodFrench
Second methodGraph Pad
Third methodExcel
Stainless steel(9)
UBACRECEP
?20/12/02
87 ± 599 ± 6
81 ± 395 ± 2
87 ± 496 ± 2
NRB (10)
UBA
CRECEP
29/01/0331/01/0313/02/0329/11/026/12/02
08 ± 6
110 ± 1784 ± 1091 ± 3
00
96 ± 584 ± 292 ± 2
08 ± 2
109 ± 880 ± 487 ± 3
EPDM O seal(11)
UBA
CRECEP
29/01/0331/01/0313/02/0329/11/026/12/02
20/12/02
92 ± 2297 ± 6
113 ± 50
76 ± 1868 ± 9
78 ± 499 ± 5
112 ± 30
80 ± 365 ± 3
92 ± 1081 ± 11
123 ± 70
75 ± 668 ± 4
The percentages of RNA synthesis of the leachates were expressed in relation to the blank: (averageslope value of the leachate/average slope value of the blank)/100. The percentage of RNA synthesis ofthe blank is fixed at 100 % (total absence of toxicants).
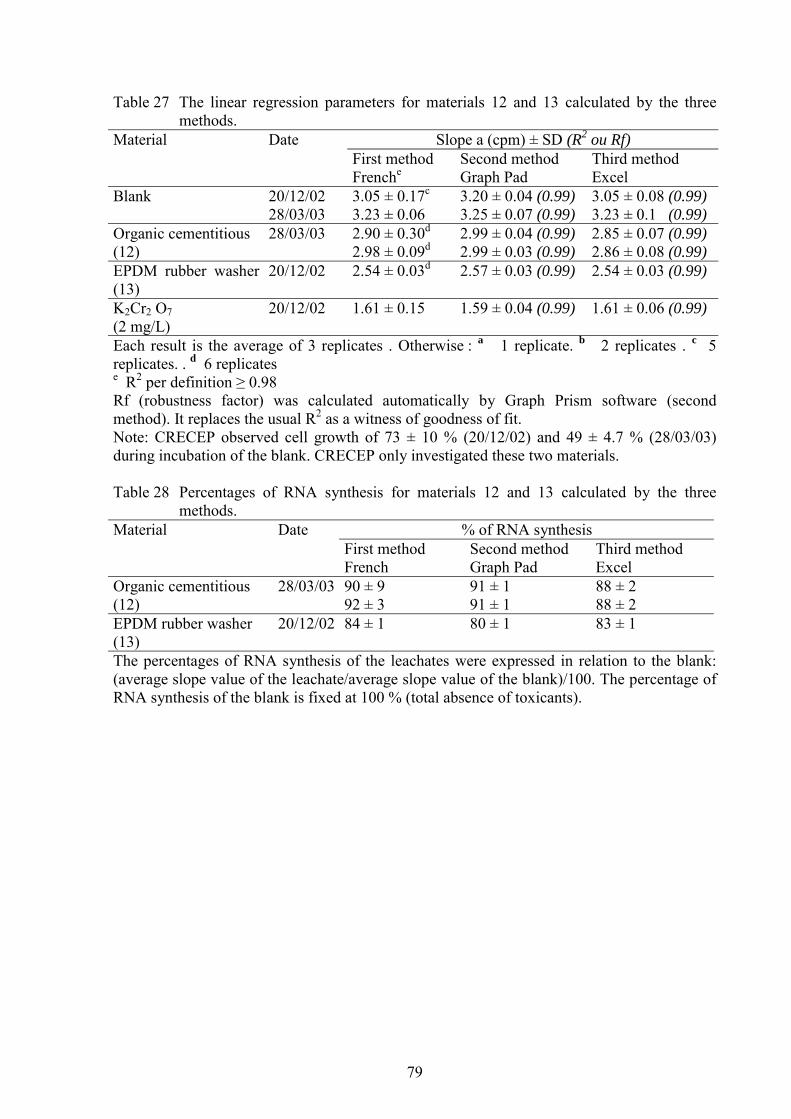
79
Table 27 The linear regression parameters for materials 12 and 13 calculated by the threemethods.
Material Date Slope a (cpm) ± SD (R2 ou Rf)First methodFrenche
Second methodGraph Pad
Third methodExcel
Blank 20/12/0228/03/03
3.05 ± 0.17c
3.23 ± 0.063.20 ± 0.04 (0.99)3.25 ± 0.07 (0.99)
3.05 ± 0.08 (0.99)3.23 ± 0.1 (0.99)
Organic cementitious(12)
28/03/03 2.90 ± 0.30d
2.98 ± 0.09d2.99 ± 0.04 (0.99)2.99 ± 0.03 (0.99)
2.85 ± 0.07 (0.99)2.86 ± 0.08 (0.99)
EPDM rubber washer(13)
20/12/02 2.54 ± 0.03d 2.57 ± 0.03 (0.99) 2.54 ± 0.03 (0.99)
K2Cr2 O7(2 mg/L)
20/12/02 1.61 ± 0.15 1.59 ± 0.04 (0.99) 1.61 ± 0.06 (0.99)
Each result is the average of 3 replicates . Otherwise : a 1 replicate. b 2 replicates . c 5replicates. . d 6 replicatese R2 per definition ≥ 0.98Rf (robustness factor) was calculated automatically by Graph Prism software (secondmethod). It replaces the usual R2 as a witness of goodness of fit.Note: CRECEP observed cell growth of 73 ± 10 % (20/12/02) and 49 ± 4.7 % (28/03/03)during incubation of the blank. CRECEP only investigated these two materials.
Table 28 Percentages of RNA synthesis for materials 12 and 13 calculated by the threemethods.
Material Date % of RNA synthesisFirst methodFrench
Second methodGraph Pad
Third methodExcel
Organic cementitious (12)
28/03/03 90 ± 992 ± 3
91 ± 191 ± 1
88 ± 288 ± 2
EPDM rubber washer(13)
20/12/02 84 ± 1 80 ± 1 83 ± 1
The percentages of RNA synthesis of the leachates were expressed in relation to the blank:(average slope value of the leachate/average slope value of the blank)/100. The percentage ofRNA synthesis of the blank is fixed at 100 % (total absence of toxicants).
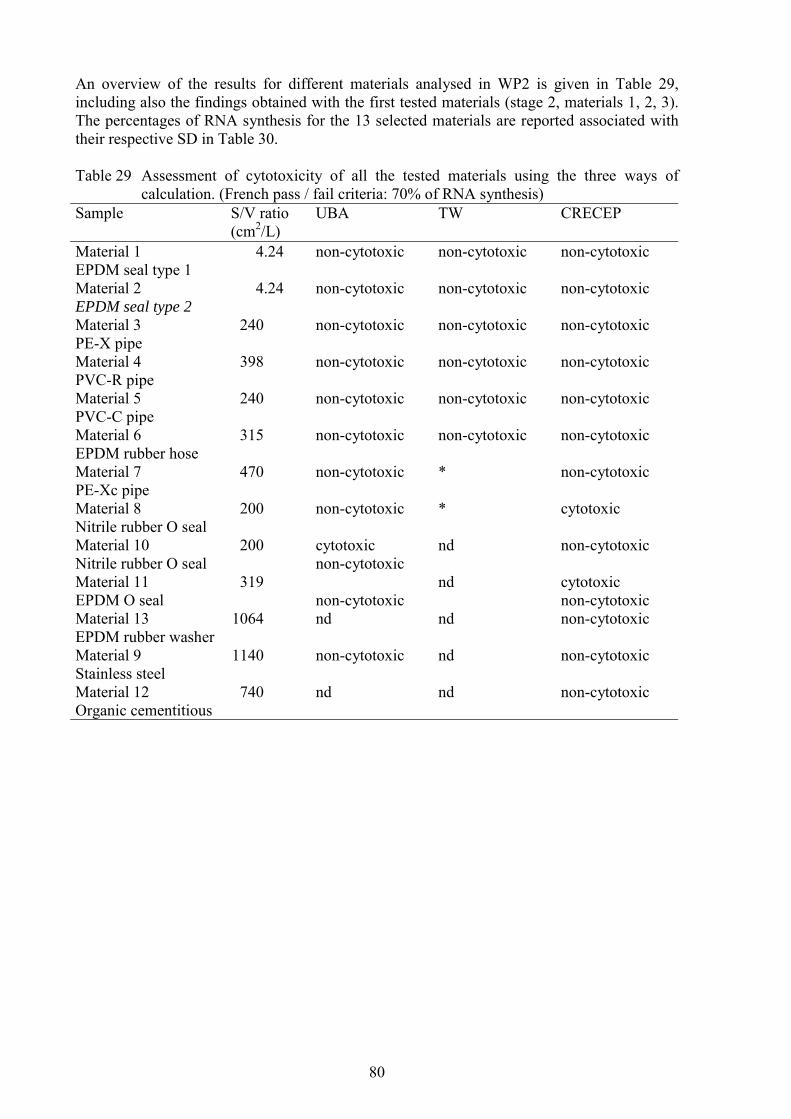
80
An overview of the results for different materials analysed in WP2 is given in Table 29,including also the findings obtained with the first tested materials (stage 2, materials 1, 2, 3).The percentages of RNA synthesis for the 13 selected materials are reported associated withtheir respective SD in Table 30.
Table 29 Assessment of cytotoxicity of all the tested materials using the three ways ofcalculation. (French pass / fail criteria: 70% of RNA synthesis)
Sample S/V ratio(cm2/L)
UBA TW CRECEP
Material 1 EPDM seal type 1
4.24 non-cytotoxic non-cytotoxic non-cytotoxic
Material 2EPDM seal type 2
4.24 non-cytotoxic non-cytotoxic non-cytotoxic
Material 3PE-X pipe
240 non-cytotoxic non-cytotoxic non-cytotoxic
Material 4PVC-R pipe
398 non-cytotoxic non-cytotoxic non-cytotoxic
Material 5PVC-C pipe
240 non-cytotoxic non-cytotoxic non-cytotoxic
Material 6EPDM rubber hose
315 non-cytotoxic non-cytotoxic non-cytotoxic
Material 7PE-Xc pipe
470 non-cytotoxic * non-cytotoxic
Material 8Nitrile rubber O seal
200 non-cytotoxic * cytotoxic
Material 10Nitrile rubber O seal
200 cytotoxicnon-cytotoxic
nd non-cytotoxic
Material 11EPDM O seal
319non-cytotoxic
nd cytotoxic non-cytotoxic
Material 13EPDM rubber washer
1064 nd nd non-cytotoxic
Material 9Stainless steel
1140 non-cytotoxic nd non-cytotoxic
Material 12Organic cementitious
740 nd nd non-cytotoxic
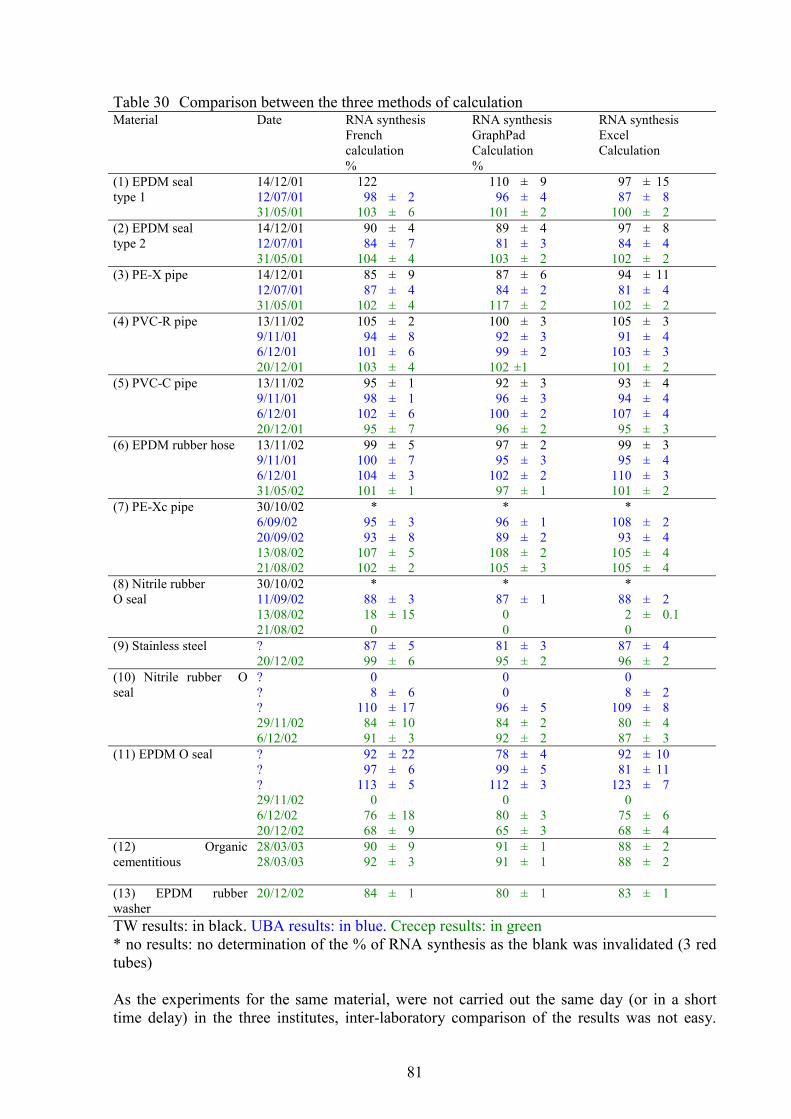
81
Table 30 Comparison between the three methods of calculationMaterial Date RNA synthesis
French calculation%
RNA synthesisGraphPad Calculation%
RNA synthesisExcelCalculation
(1) EPDM seal type 1
14/12/0112/07/0131/05/01
12298 ± 2
103 ± 6
110 ± 996 ± 4
101 ± 2
97 ± 1587 ± 8
100 ± 2(2) EPDM seal type 2
14/12/0112/07/0131/05/01
90 ± 484 ± 7
104 ± 4
89 ± 481 ± 3
103 ± 2
97 ± 884 ± 4
102 ± 2(3) PE-X pipe 14/12/01
12/07/0131/05/01
85 ± 987 ± 4
102 ± 4
87 ± 684 ± 2
117 ± 2
94 ± 1181 ± 4
102 ± 2(4) PVC-R pipe 13/11/02
9/11/016/12/0120/12/01
105 ± 294 ± 8
101 ± 6103 ± 4
100 ± 392 ± 399 ± 2
102 ±1
105 ± 391 ± 4
103 ± 3101 ± 2
(5) PVC-C pipe 13/11/029/11/016/12/0120/12/01
95 ± 198 ± 1
102 ± 695 ± 7
92 ± 396 ± 3
100 ± 296 ± 2
93 ± 494 ± 4
107 ± 495 ± 3
(6) EPDM rubber hose 13/11/029/11/016/12/0131/05/02
99 ± 5100 ± 7104 ± 3101 ± 1
97 ± 295 ± 3
102 ± 297 ± 1
99 ± 395 ± 4
110 ± 3101 ± 2
(7) PE-Xc pipe 30/10/026/09/0220/09/0213/08/0221/08/02
*95 ± 393 ± 8
107 ± 5102 ± 2
*96 ± 189 ± 2
108 ± 2105 ± 3
*108 ± 2
93 ± 4105 ± 4105 ± 4
(8) Nitrile rubber O seal
30/10/0211/09/0213/08/0221/08/02
*88 ± 318 ± 15
0
*87 ± 1
00
*88 ± 2
2 ± 0.10
(9) Stainless steel ?20/12/02
87 ± 599 ± 6
81 ± 395 ± 2
87 ± 496 ± 2
(10) Nitrile rubber Oseal
???29/11/026/12/02
08 ± 6
110 ± 1784 ± 1091 ± 3
00
96 ± 584 ± 292 ± 2
08 ± 2
109 ± 880 ± 487 ± 3
(11) EPDM O seal ???29/11/026/12/0220/12/02
92 ± 2297 ± 6
113 ± 50
76 ± 1868 ± 9
78 ± 499 ± 5
112 ± 30
80 ± 365 ± 3
92 ± 1081 ± 11
123 ± 70
75 ± 668 ± 4
(12) Organiccementitious
28/03/0328/03/03
90 ± 992 ± 3
91 ± 191 ± 1
88 ± 288 ± 2
(13) EPDM rubberwasher
20/12/02 84 ± 1 80 ± 1 83 ± 1
TW results: in black. UBA results: in blue. Crecep results: in green* no results: no determination of the % of RNA synthesis as the blank was invalidated (3 redtubes)
As the experiments for the same material, were not carried out the same day (or in a shorttime delay) in the three institutes, inter-laboratory comparison of the results was not easy.
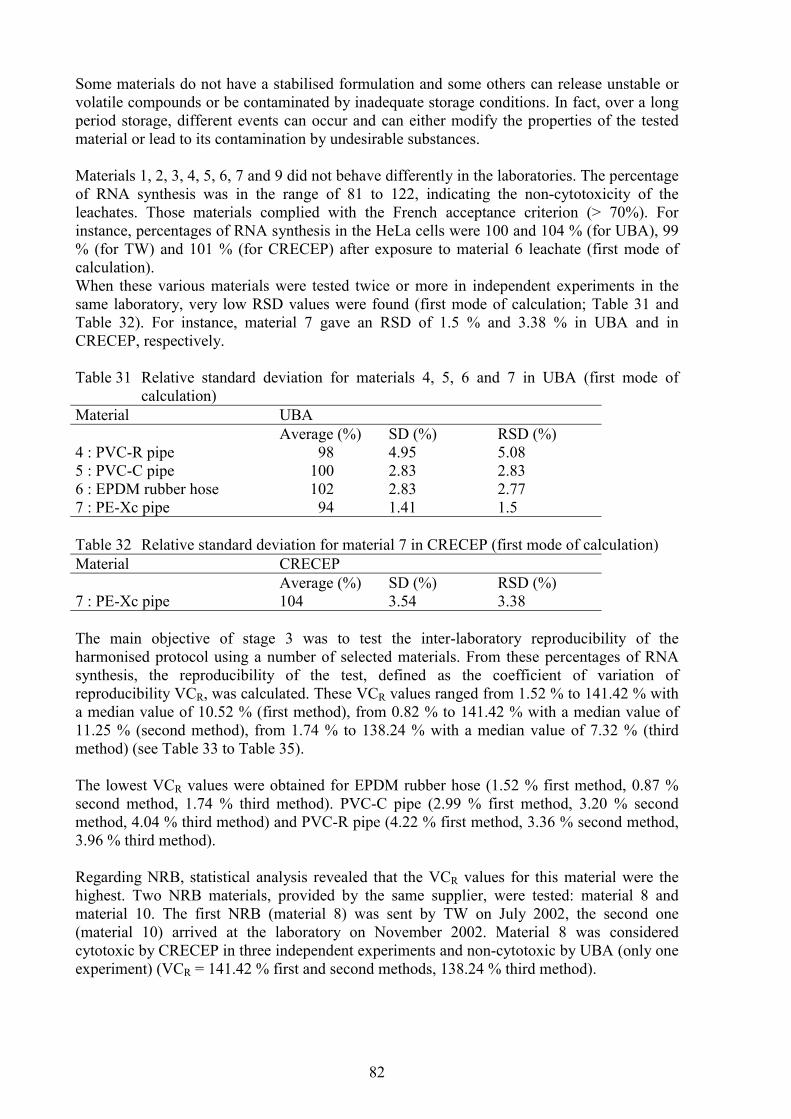
82
Some materials do not have a stabilised formulation and some others can release unstable orvolatile compounds or be contaminated by inadequate storage conditions. In fact, over a longperiod storage, different events can occur and can either modify the properties of the testedmaterial or lead to its contamination by undesirable substances.
Materials 1, 2, 3, 4, 5, 6, 7 and 9 did not behave differently in the laboratories. The percentageof RNA synthesis was in the range of 81 to 122, indicating the non-cytotoxicity of theleachates. Those materials complied with the French acceptance criterion (> 70%). Forinstance, percentages of RNA synthesis in the HeLa cells were 100 and 104 % (for UBA), 99% (for TW) and 101 % (for CRECEP) after exposure to material 6 leachate (first mode ofcalculation).When these various materials were tested twice or more in independent experiments in thesame laboratory, very low RSD values were found (first mode of calculation; Table 31 andTable 32). For instance, material 7 gave an RSD of 1.5 % and 3.38 % in UBA and inCRECEP, respectively.
Table 31 Relative standard deviation for materials 4, 5, 6 and 7 in UBA (first mode ofcalculation)
Material UBA
4 : PVC-R pipe5 : PVC-C pipe6 : EPDM rubber hose7 : PE-Xc pipe
Average (%)98
10010294
SD (%)4.952.832.831.41
RSD (%)5.082.832.771.5
Table 32 Relative standard deviation for material 7 in CRECEP (first mode of calculation)Material CRECEP
7 : PE-Xc pipeAverage (%)104
SD (%)3.54
RSD (%)3.38
The main objective of stage 3 was to test the inter-laboratory reproducibility of theharmonised protocol using a number of selected materials. From these percentages of RNAsynthesis, the reproducibility of the test, defined as the coefficient of variation ofreproducibility VCR, was calculated. These VCR values ranged from 1.52 % to 141.42 % witha median value of 10.52 % (first method), from 0.82 % to 141.42 % with a median value of11.25 % (second method), from 1.74 % to 138.24 % with a median value of 7.32 % (thirdmethod) (see Table 33 to Table 35).
The lowest VCR values were obtained for EPDM rubber hose (1.52 % first method, 0.87 %second method, 1.74 % third method). PVC-C pipe (2.99 % first method, 3.20 % secondmethod, 4.04 % third method) and PVC-R pipe (4.22 % first method, 3.36 % second method,3.96 % third method).
Regarding NRB, statistical analysis revealed that the VCR values for this material were thehighest. Two NRB materials, provided by the same supplier, were tested: material 8 andmaterial 10. The first NRB (material 8) was sent by TW on July 2002, the second one(material 10) arrived at the laboratory on November 2002. Material 8 was consideredcytotoxic by CRECEP in three independent experiments and non-cytotoxic by UBA (only oneexperiment) (VCR = 141.42 % first and second methods, 138.24 % third method).
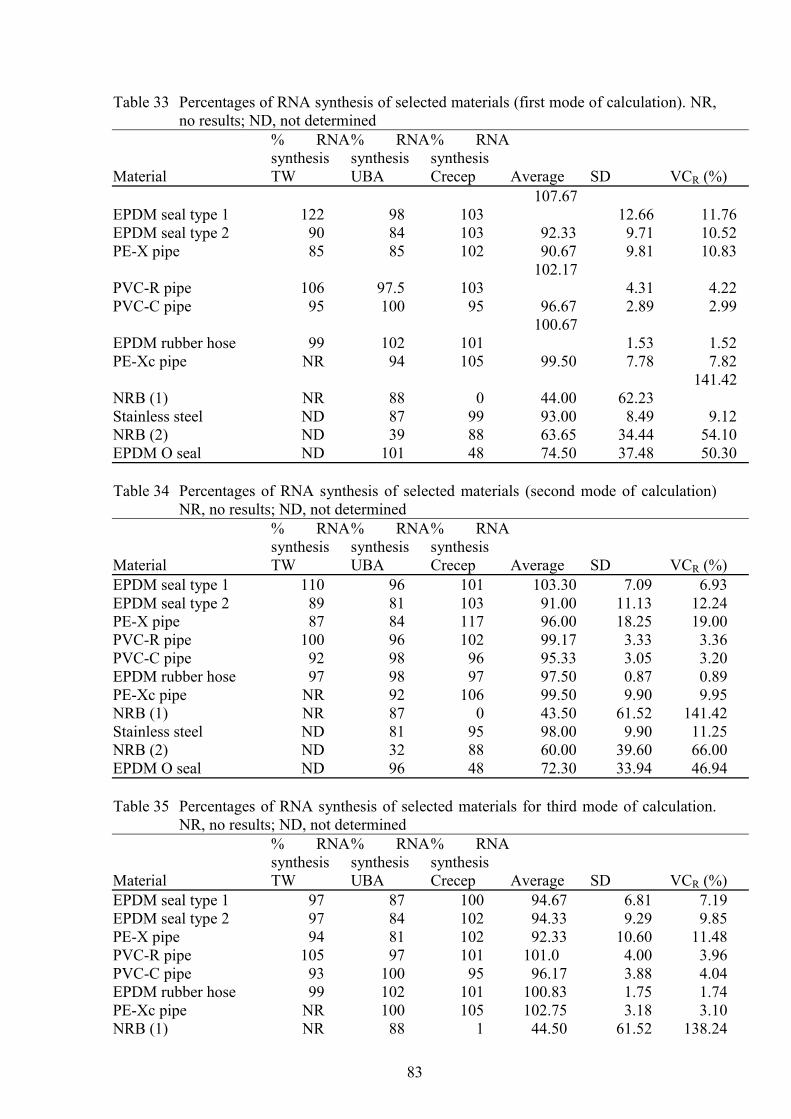
83
Table 33 Percentages of RNA synthesis of selected materials (first mode of calculation). NR,no results; ND, not determined
Material
% RNAsynthesisTW
% RNAsynthesisUBA
% RNAsynthesisCrecep Average SD VCR (%)
EPDM seal type 1 122 98 103 107.67
12.66 11.76 EPDM seal type 2 90 84 103 92.33 9.71 10.52 PE-X pipe 85 85 102 90.67 9.81 10.83
PVC-R pipe 106 97.5 103 102.17
4.31 4.22 PVC-C pipe 95 100 95 96.67 2.89 2.99
EPDM rubber hose 99 102 101 100.67
1.53 1.52 PE-Xc pipe NR 94 105 99.50 7.78 7.82
NRB (1) NR 88 0 44.00 62.23 141.42
Stainless steel ND 87 99 93.00 8.49 9.12 NRB (2) ND 39 88 63.65 34.44 54.10 EPDM O seal ND 101 48 74.50 37.48 50.30
Table 34 Percentages of RNA synthesis of selected materials (second mode of calculation)NR, no results; ND, not determined
Material
% RNAsynthesisTW
% RNAsynthesisUBA
% RNAsynthesisCrecep Average SD VCR (%)
EPDM seal type 1 110 96 101 103.30 7.09 6.93EPDM seal type 2 89 81 103 91.00 11.13 12.24PE-X pipe 87 84 117 96.00 18.25 19.00PVC-R pipe 100 96 102 99.17 3.33 3.36PVC-C pipe 92 98 96 95.33 3.05 3.20EPDM rubber hose 97 98 97 97.50 0.87 0.89PE-Xc pipe NR 92 106 99.50 9.90 9.95NRB (1) NR 87 0 43.50 61.52 141.42Stainless steel ND 81 95 98.00 9.90 11.25NRB (2) ND 32 88 60.00 39.60 66.00EPDM O seal ND 96 48 72.30 33.94 46.94
Table 35 Percentages of RNA synthesis of selected materials for third mode of calculation.NR, no results; ND, not determined
Material
% RNAsynthesisTW
% RNAsynthesisUBA
% RNAsynthesisCrecep Average SD VCR (%)
EPDM seal type 1 97 87 100 94.67 6.81 7.19EPDM seal type 2 97 84 102 94.33 9.29 9.85PE-X pipe 94 81 102 92.33 10.60 11.48PVC-R pipe 105 97 101 101.0 4.00 3.96PVC-C pipe 93 100 95 96.17 3.88 4.04EPDM rubber hose 99 102 101 100.83 1.75 1.74PE-Xc pipe NR 100 105 102.75 3.18 3.10NRB (1) NR 88 1 44.50 61.52 138.24
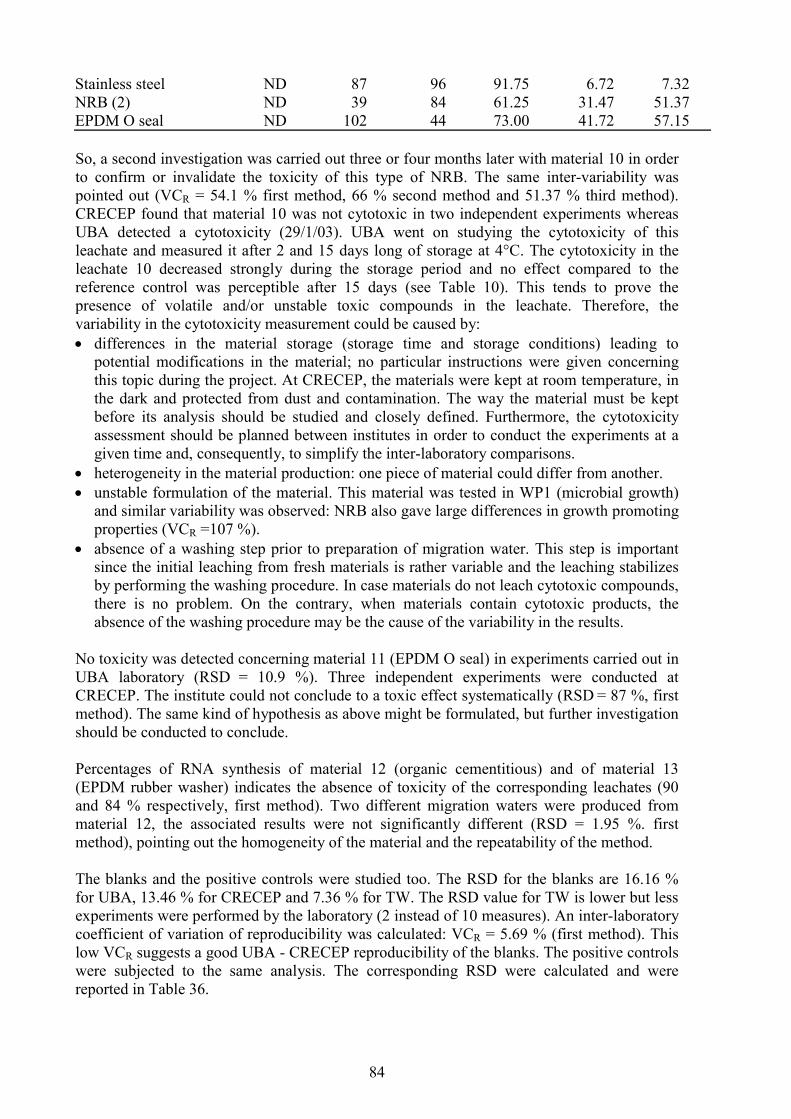
84
Stainless steel ND 87 96 91.75 6.72 7.32NRB (2) ND 39 84 61.25 31.47 51.37EPDM O seal ND 102 44 73.00 41.72 57.15
So, a second investigation was carried out three or four months later with material 10 in orderto confirm or invalidate the toxicity of this type of NRB. The same inter-variability waspointed out (VCR = 54.1 % first method, 66 % second method and 51.37 % third method).CRECEP found that material 10 was not cytotoxic in two independent experiments whereasUBA detected a cytotoxicity (29/1/03). UBA went on studying the cytotoxicity of thisleachate and measured it after 2 and 15 days long of storage at 4°C. The cytotoxicity in theleachate 10 decreased strongly during the storage period and no effect compared to thereference control was perceptible after 15 days (see Table 10). This tends to prove thepresence of volatile and/or unstable toxic compounds in the leachate. Therefore, thevariability in the cytotoxicity measurement could be caused by:• differences in the material storage (storage time and storage conditions) leading to
potential modifications in the material; no particular instructions were given concerningthis topic during the project. At CRECEP, the materials were kept at room temperature, inthe dark and protected from dust and contamination. The way the material must be keptbefore its analysis should be studied and closely defined. Furthermore, the cytotoxicityassessment should be planned between institutes in order to conduct the experiments at agiven time and, consequently, to simplify the inter-laboratory comparisons.
• heterogeneity in the material production: one piece of material could differ from another.• unstable formulation of the material. This material was tested in WP1 (microbial growth)
and similar variability was observed: NRB also gave large differences in growth promotingproperties (VCR =107 %).
• absence of a washing step prior to preparation of migration water. This step is importantsince the initial leaching from fresh materials is rather variable and the leaching stabilizesby performing the washing procedure. In case materials do not leach cytotoxic compounds,there is no problem. On the contrary, when materials contain cytotoxic products, theabsence of the washing procedure may be the cause of the variability in the results.
No toxicity was detected concerning material 11 (EPDM O seal) in experiments carried out inUBA laboratory (RSD = 10.9 %). Three independent experiments were conducted atCRECEP. The institute could not conclude to a toxic effect systematically (RSD = 87 %, firstmethod). The same kind of hypothesis as above might be formulated, but further investigationshould be conducted to conclude.
Percentages of RNA synthesis of material 12 (organic cementitious) and of material 13(EPDM rubber washer) indicates the absence of toxicity of the corresponding leachates (90and 84 % respectively, first method). Two different migration waters were produced frommaterial 12, the associated results were not significantly different (RSD = 1.95 %. firstmethod), pointing out the homogeneity of the material and the repeatability of the method.
The blanks and the positive controls were studied too. The RSD for the blanks are 16.16 %for UBA, 13.46 % for CRECEP and 7.36 % for TW. The RSD value for TW is lower but lessexperiments were performed by the laboratory (2 instead of 10 measures). An inter-laboratorycoefficient of variation of reproducibility was calculated: VCR = 5.69 % (first method). Thislow VCR suggests a good UBA - CRECEP reproducibility of the blanks. The positive controlswere subjected to the same analysis. The corresponding RSD were calculated and werereported in Table 36.
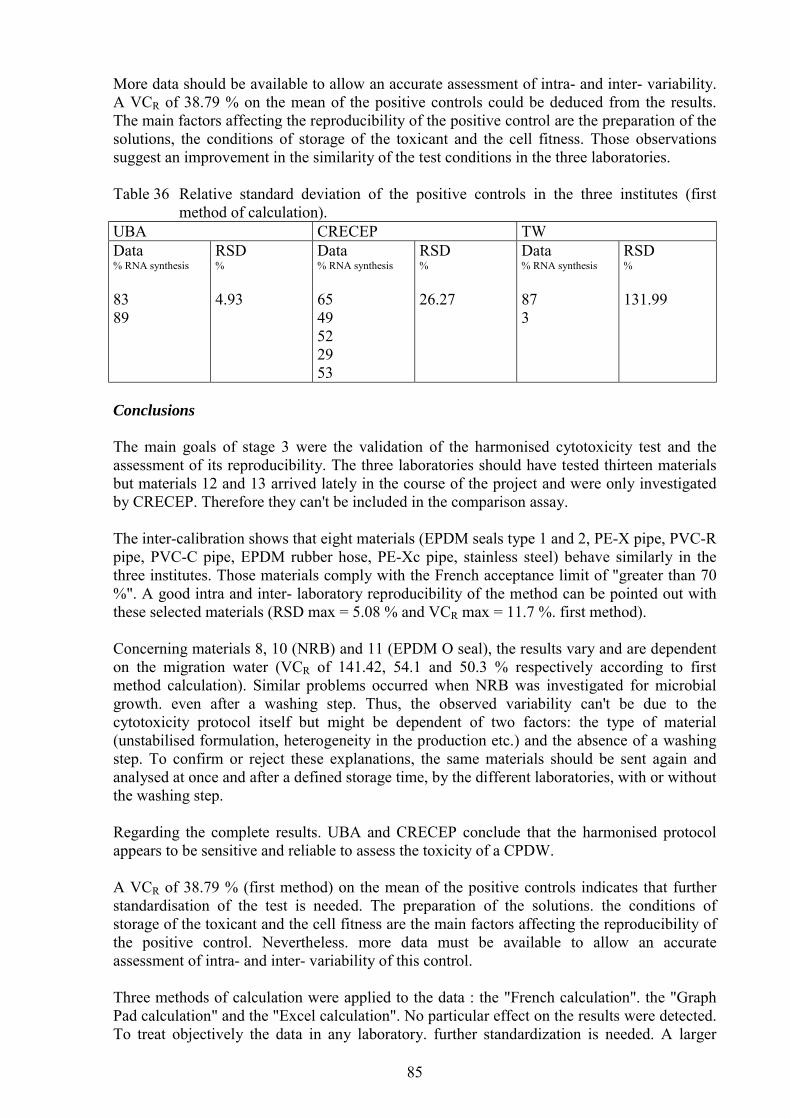
85
More data should be available to allow an accurate assessment of intra- and inter- variability.A VCR of 38.79 % on the mean of the positive controls could be deduced from the results.The main factors affecting the reproducibility of the positive control are the preparation of thesolutions, the conditions of storage of the toxicant and the cell fitness. Those observationssuggest an improvement in the similarity of the test conditions in the three laboratories.
Table 36 Relative standard deviation of the positive controls in the three institutes (firstmethod of calculation).
UBA CRECEP TWData% RNA synthesis
8389
RSD %
4.93
Data% RNA synthesis
6549522953
RSD%
26.27
Data% RNA synthesis
873
RSD%
131.99
Conclusions
The main goals of stage 3 were the validation of the harmonised cytotoxicity test and theassessment of its reproducibility. The three laboratories should have tested thirteen materialsbut materials 12 and 13 arrived lately in the course of the project and were only investigatedby CRECEP. Therefore they can't be included in the comparison assay.
The inter-calibration shows that eight materials (EPDM seals type 1 and 2, PE-X pipe, PVC-Rpipe, PVC-C pipe, EPDM rubber hose, PE-Xc pipe, stainless steel) behave similarly in thethree institutes. Those materials comply with the French acceptance limit of "greater than 70%". A good intra and inter- laboratory reproducibility of the method can be pointed out withthese selected materials (RSD max = 5.08 % and VCR max = 11.7 %. first method).
Concerning materials 8, 10 (NRB) and 11 (EPDM O seal), the results vary and are dependenton the migration water (VCR of 141.42, 54.1 and 50.3 % respectively according to firstmethod calculation). Similar problems occurred when NRB was investigated for microbialgrowth. even after a washing step. Thus, the observed variability can't be due to thecytotoxicity protocol itself but might be dependent of two factors: the type of material(unstabilised formulation, heterogeneity in the production etc.) and the absence of a washingstep. To confirm or reject these explanations, the same materials should be sent again andanalysed at once and after a defined storage time, by the different laboratories, with or withoutthe washing step.
Regarding the complete results. UBA and CRECEP conclude that the harmonised protocolappears to be sensitive and reliable to assess the toxicity of a CPDW.
A VCR of 38.79 % (first method) on the mean of the positive controls indicates that furtherstandardisation of the test is needed. The preparation of the solutions. the conditions ofstorage of the toxicant and the cell fitness are the main factors affecting the reproducibility ofthe positive control. Nevertheless. more data must be available to allow an accurateassessment of intra- and inter- variability of this control.
Three methods of calculation were applied to the data : the "French calculation". the "GraphPad calculation" and the "Excel calculation". No particular effect on the results were detected.To treat objectively the data in any laboratory. further standardization is needed. A larger
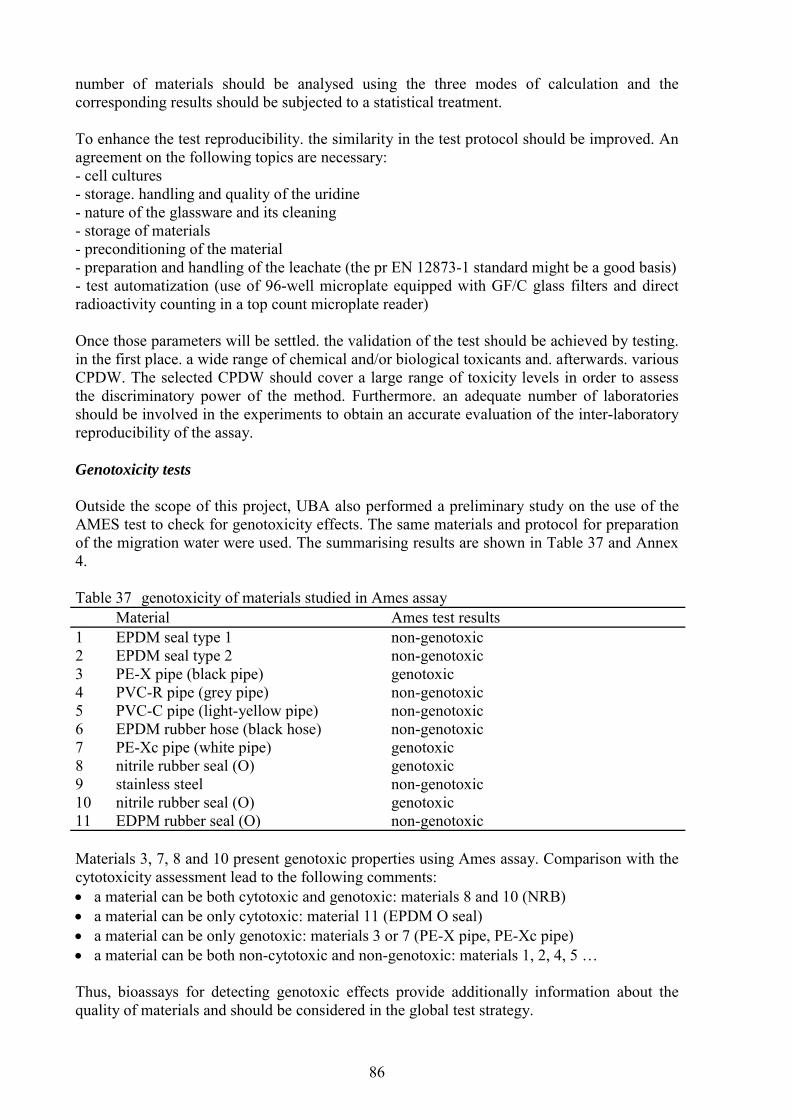
86
number of materials should be analysed using the three modes of calculation and thecorresponding results should be subjected to a statistical treatment.
To enhance the test reproducibility. the similarity in the test protocol should be improved. Anagreement on the following topics are necessary:- cell cultures- storage. handling and quality of the uridine- nature of the glassware and its cleaning- storage of materials- preconditioning of the material - preparation and handling of the leachate (the pr EN 12873-1 standard might be a good basis)- test automatization (use of 96-well microplate equipped with GF/C glass filters and directradioactivity counting in a top count microplate reader)
Once those parameters will be settled. the validation of the test should be achieved by testing.in the first place. a wide range of chemical and/or biological toxicants and. afterwards. variousCPDW. The selected CPDW should cover a large range of toxicity levels in order to assessthe discriminatory power of the method. Furthermore. an adequate number of laboratoriesshould be involved in the experiments to obtain an accurate evaluation of the inter-laboratoryreproducibility of the assay.
Genotoxicity tests
Outside the scope of this project, UBA also performed a preliminary study on the use of theAMES test to check for genotoxicity effects. The same materials and protocol for preparationof the migration water were used. The summarising results are shown in Table 37 and Annex4.
Table 37 genotoxicity of materials studied in Ames assayMaterial Ames test results
1 EPDM seal type 1 non-genotoxic2 EPDM seal type 2 non-genotoxic3 PE-X pipe (black pipe) genotoxic4 PVC-R pipe (grey pipe) non-genotoxic5 PVC-C pipe (light-yellow pipe) non-genotoxic6 EPDM rubber hose (black hose) non-genotoxic7 PE-Xc pipe (white pipe) genotoxic8 nitrile rubber seal (O) genotoxic9 stainless steel non-genotoxic10 nitrile rubber seal (O) genotoxic11 EDPM rubber seal (O) non-genotoxic
Materials 3, 7, 8 and 10 present genotoxic properties using Ames assay. Comparison with thecytotoxicity assessment lead to the following comments:• a material can be both cytotoxic and genotoxic: materials 8 and 10 (NRB)• a material can be only cytotoxic: material 11 (EPDM O seal)• a material can be only genotoxic: materials 3 or 7 (PE-X pipe, PE-Xc pipe)• a material can be both non-cytotoxic and non-genotoxic: materials 1, 2, 4, 5 …
Thus, bioassays for detecting genotoxic effects provide additionally information about thequality of materials and should be considered in the global test strategy.

87
GENERAL CONCLUSION
The cytotoxicity assay, selected to check the safety of CPDW, measures the inhibition ofRNA synthesis in human cells in relation to that obtained with a control. Thirteen CPDWwere investigated.
Eleven materials complied with the French acceptance criteria of "greater than 70 %". A goodintra- and inter- laboratory reproducibility could be pointed out for eight materials (RSD max= 5.08 % and VCR max = 11.7 % first mode of calculation; RSD max = 5.35 % and VCR max= 19 % second mode of calculation; RSD max = 10.55 % and VCR max = 22.6 % third modeof calculation).
Two types of materials seemed to vary depending on the migration water and, consequently,the assessment of toxicity too. This variability seems not to be due to the cytotoxicity protocolitself but mainly dependent on the nature of the material and on the absence of a washing stepprior to leachate preparation. Therefore, the reproducibility of the test, defined as thecoefficient of variation of reproducibility VCR, ranged from 1.52 % to 141.42 % with amedian value of 10.52 % (first mode of calculation), from 0.89 % to 141.42 % with a medianvalue of 11.25 % (second mode of calculation) and from 1.74 % to 138.24 % with a medianvalue of 7.32 % (third mode of calculation).
Three methods of calculation were applied to the data: the "French calculation", the "GraphPad calculation" and the "Excel calculation". No particular effect on the results could havebeen detected. The behaviour of the different tested materials remained similar (same order ofmagnitude of the results. same materials accepted or refused) whatever the calculation modewas. An appropriate statistical technique should be selected with which it can be decided ifcertain data of the kinetics are outliers.
In conclusion, different materials were tested successfully by the cytotoxicity test, supportingthe fact, that this test system is an useful screening test for exposures which may be cytotoxic.Moreover, the test seems to satisfy many criteria for routine use in regulatory practices. It isvery sensitive, quantitative, reliable, reproducible and requires no concentration procedures ofthe sample to be tested (UBA and CRECEP findings). However, no robust positive materialwas found among the selected CPDW and positive materials are necessary to well-establishthe test.
Contrarily to traditional short term tests for cellular toxicity, the present cytotoxicity testmeasures sublethal effects: therefore it provides sensitive means for early detection ofpotentially harmful compounds at sublethal cellular levels rather than after cell death.Additionally, as RNA synthesis can be inhibited by numerous mechanisms it provides ageneral target for multiple toxic effects. The RNA synthesis inhibition assay can be regardedas a robust safety test, keeping in mind the difficulty to extrapolate the significance of such acellular toxicity test to a specific organ or even to a whole human being.
Though, the RNA synthesis inhibition assay requires a highly trained staff regarding cellculture, a special care to the glassware cleaning, a specific equipment and licence for thehandling and disposal of radioactivity. The use of tritium does not involve a special healthrisk for humans as far as basic precautions are followed. But, using radioactivity is a part ofthe test sensitivity. Moreover no other alternative marker is available nowadays.The validation of the test system should be achieved to include it as a CEN standard. Furtherinvestigations must be performed:• setting a first agreement about the following topics:
88
− the influencing factors of cell cultures (percentage of confluence of the monolayer cells,passage from monolayer cells to cells under suspension conditions, constant cell fitness,cell growth etc.)
− the storage, handling and quality of uridine− the nature of the vessel and its cleaning− the test automation (use of 96-well microplate equipped with GF/C glass filters and
direct radioactivity counting in a top count microplate reader)• inter-validation of the assay with known chemical and/or biological toxicants• setting a second agreement afterwards for material investigation:
− the storage of the materials (conditions and time)− the material preconditioning before the leachate preparation− the preparation and handling of the leachate (negative control, temperature, agitation,
S/V ratio, air/V ratio etc...)− the time of contact between the potential toxicant (leachate) and the cells (a longer
period of contact simulates a potential chronic toxicity effect whereas a short time ofcontact takes only into account the accurate toxicity)
− the best treatment of the results (mode of calculation), with a statistically design in orderto treat all materials equally under regulation.
• the inter-laboratory validation of the test, by analysing a wide variety of CPDW, whichcover a large range of toxicity levels.
Once the cytotoxicity assay will be presented as a CEN standard, recommendations could bemade for the RG-CPDW concerning acceptance criteria for the EAS (instructions concerningmaterials which give percentages of RNA synthesis ranged from 70 to 100 %).
The next step would be the implementation of a set of genotoxic assays. As it was shown, atthe end of this work, the detection of mutagenic effects (Ames test) provides additionalinformation about the quality of materials.
The cytotoxicity assay associated with a suitable battery of genotoxicity tests should, in thefuture, be able to assess the global potential toxicity of compounds in leachates of CPDW andgive a correct answer concerning the risk borne by the consumers.

89
ANNEXES
Annex 1 Explanation tables
Annex 2 Results materials 1, 2 and 3 with 3 calculation methods
Annex 3 Final report TW, 24 February 2003
Annex 4 Final report UBA, 21 February 2003
Annex 5 Effect of incubation time and concentration of potassium dichromate on percentageof RNA synthesis
These annexes are presented in a separate document


91
Annex 6 Cytotoxicity evaluation – RNA synthesis inhibition test – harmonised protocol
CYTOTOXICITY EVALUATIONRNA SYNTHESIS INHIBITION TEST
Harmonised protocol
A- CELL LINE :
1- Cell line providersThe cell line HeLa S3 is purchased from the American Type Culture Collection (HeLa S3CCL 2.2).
2- Maintenance of the cell strainThe cells are cultivated without antibiotics as their presence could interfere with theassessment of CPDW leachate cytotoxicity. So the absence of an eventual contamination bymycoplasma must be periodically checked.
3- Monolayer cellsHeLa S3 cells are grown in a 1X medium in culture flasks at 37°C until confluent monolayersare obtained. The medium is removed and the monolayer sheet is rinced twice with PBS. Themonolayer sheet is covered with a versene solution and the flask is placed at (37±1)°C untilthe cells can be separated by gentle shaking. Then a few ml of 1X medium are added in orderto stop the reaction. The cells are homogenised by repeated pipetting and counted precisely.
4- Preservation of the cell strainWhen a stock culture of the cell line is needed, it is stored in liquid nitrogen, after beingpreserved in the culture medium with dimethylsulfoxide (10% V/V final) or glycerol (10%V/V final).
B- PREPARATION OF THE MIGRATION WATER :
1- Pre-conditioning step
No pre-conditioning step is conducted, except for organic cementitious products whichrequires a special treatment according to its nature.The material is placed upon a monolayer glass beads in a convenient glass container, then putunder the "preconditioning water" (1000 ml). The container is closed with a glass cover and isincubated at 23°C during 24 hours, in darkness, without agitation (incubation n° 1). Thiswater is removed and discarded and the material is re-immersed into the preconditioningwater (1000 ml). The container is incubated again at 23°C during 24 hours (incubation n° 2)The sequence is repeated three times (until incubation n° 5).The preconditioning water is composed of demineralised water supplied with (222 ± 2) mg/lof CaCl2 and (336 ± 2) mg/l of NaHCO3 (the pH was adjusted to 7,4 ± 0,1).
2- Preparation of leachates
* Organic and metallic materials :
92
1000 ml of reference water (pyrodistilled water for TW and CRECEP, purified water forUBA) are introduced into borosilicated glass jars. The needed number of test pieces are, then,added. After closing with inert lids, the test containers are incubated for 24 hours at 23°C indarkness, without agitation.
* Cementitious materialThe material is placed upon a monolayer glass beads in a convenient glass container and putunder mineral water (1000 ml). The container is closed with a glass cover and incubated at23°C during 24 hours, in darkness, without agitation.The mineral water should fulfil the following recommendations:
- conductivity = 50µS/cm- pH = 8 ± 0,2- oxidability to KmnO4 < 0,5 mg/l O2
- TOC < 0,5 mg/l C- TAC = 5 ± 0,1 °F- silice = 25 -30 mg/l SiO2
Once the migration water is prepared, it should be immediately investigated in cytotoxicity.
C- CYTOTOXICOLOGICAL EVALUATION :
1- Definitions :
- Blank/ Reference control :It consists of the cytotoxicity assessment of a culture medium prepared with reference water.
- Negative control :The negative leachate is prepared by introducing 1000 ml of reference water in a borosilicatedglass jar and by incubating the flask at 23°C for 24 hours, in darkness without shaking.The negative control consists, therefore, of the cytotoxicity assessment of a culture mediumprepared with the negative leachate.
- Positive control :It consists of the cytotoxicity assessment of a culture medium prepared with a standardsolution of potassium dichromate (final concentration : 2 mg/L).Note : a fresh solution of potassium dichromate should be prepared every time a cytotoxicity
test has to be performed. The standard solution must be kept at room temperature.
- Sample evaluation :It consists of the cytotoxicity assessment of a culture medium prepared with a materialleachate.
2- Preparation of the different culture media :
- blank/Reference mediaThe reference water is delivered into 50ml centrifuge tubes on the basis of 21,25 ml per tube.5 ml of 5,25X medium is added to each tube. The medium is then sterilized through a singleuse syringe fitted with a filter into a second sterile tube.
- positive control media
93
The standard solution of potassium dichromate is sampled into 50ml centrifuge tubes on thebasis of 21,25 ml per tube. 5 ml of 5,25X medium is added to each tube, the finalconcentration of potassium dichromate must be of 2mg/L. The medium is then sterilizedthrough a single use syringe fitted with a filter into a second sterile tube.
- negative and sample mediaThe negative or material leachate are distributed into 50ml centrifuge tubes on the basis of21,25 ml per tube. 5 ml of 5,25X medium is added to each tube. The medium is then sterilizedthrough a single use syringe fitted with a filter into a second sterile tube.
3- Incubation of the HeLa S3 cells with the different media :
After dispersion of the cells from confluent monolayer cells, the cell viability * and the cellnumber are assessed. Then the cell suspension is dispensed into 50ml centrifuge tubes on thebasis of 12.106 cells per tube. The cells are centrifuged at 300g, 5 min. The supernatant isdiscarded and the cells re-suspended in 20 ml of either the sample media, the positive controlmedia, the negative control media or the blank media, giving final concentration of about600.000 cells/ml. 3 x 5 ml of this cellular suspension are transferred into three glass tubeswith a bar magnet. The tubes are closed tightly and incubated for 21 h ± 2 at 37°C, underagitation. The agitation must be homogenous from one tube to another and must be adapted sothat the cells are maintained in suspension without any alteration of their integrity.
* The cell viability is determined by microscopic observation, after cell staining. The cellstaining can be carried out as described below :
Trypan blue 0,4% in PBS 1X 250µl PBS 1X 200µl Cell suspension 50µl.
4- Preparation of the chromatography paper
This should be done prior to the kinetics to allow the paper to dry.
The chromatography paper sheets are cut into 4 pieces (23x28,5 cm).Rectangles (h=3 cm ;b=1,5cm) are drawn on each piece of paper with a soft pencil. They are then soaked with aSDS 3% P/V solution either with a pipette or by immersion into a tray containing the SDSsolution.
*preparation of paper for measuring the total radioactivity (TR)Another sheet of paper is prepared in the same way , but without SDS treatment. Rectangles(h= 3 cm and b = 2 cm)are drawn on this sheet.
5- Kinetics of incorporation of the uridine
The tubes appearance is checked in order to detect an obvious culture problem (red tubes,white clumps…) before performing the kinetics.
Sterile materials must be used even if the experiment is conducted outside the sterile workarea. Because of the use of radioactive tracer, the work surface must be protected fromradioactive contamination with either aluminium foil or BENCHKOTE type paper.
Each 3MM paper sheet, prepared as described previously, is folded to avoid the spot area tobe in contact with the work area :
94
The incubation tubes are removed from the magnetic stirrer and each cell suspension ishomogenised with a syringe and needle. 500µl of each cell suspension is transferred with amicropipette into a 6ml propylene tube. The tubes are closed and put into a water bath at (37 ±0,5°C). The required volume of uridine (1,29 1,85 TBq/mmol, 37MBq/ml) is taken understerile conditions and put into a tube. 3µl of uridine are introduced in the first 6 ml tube andthe chronometer is started up. The introduction of the uridine into the subsequent tubes isperformed successively at equal time ranges using the same micropipette tip. The time rangeis a function of the total number of tubes and of the experience of the operator. The kineticsare performed by spotting 40 µl from each tube onto 3MM pretreated paper sheet at 5, 10, 15,20, 25 and 30 minutes.In order to determine the total radioactivity (TR) introduced in the different tubes, twosamples (40µl) are taken from each tube, at the end of the kinetics, and are spotted onto the3MM non pre-treated sheet.
6- Observation of the cells after the incubation :
After the kinetics, an aliquot fraction of the cell suspension is removed from every blank. Theaspect of the cells is examined under a microscope and the cells are counted with anautomatic counter or an heamocytometer. An ideal growth of at least 50% is expected, but thisissue is subject to changes. The percentage of cell viability is, also, assessed after stainingwith Trypan blue. An acceptance limit of 80 % of viable cells has been set.
7- Measurements of the RNA synthesis
When the spots are dry, the chromatography sheets is put into the descending chromatographytank. The descending chromatography is realised in TCA with a migration time ofapproximately 1h30 to 2h. After migration, the spot area should be free from any trace ofmedium. The sheets are removed from the tank. The spot area of each sheet is cut andimmersed into a glass dish containing ethanol, for 10 to 15 min. Then the paper is air-dried ordried using a heater. Each rectangle is cut and introduced into a scintillation vial on the samemanner, the spot side being outside. The scintillation vial is then filled up with thescintillation liquid and closed. The radioactivity is assessed by a scintillation counter.
8- Graphic exploitation of the results
- generalities :The excel table (annex n° 01) is used to calculate the percentage of RNA synthesis. The countobtained for each tube is reported on the Excel table by referring to the serial number youattributed to it. The two counts of total radioactivity (TR) obtained per tube is averaged for total radioactivityevaluation. Each count of the kinetic is then recalculated towards the average of the totalradioactivity which is equal to 100 cpm. Thus corrected values are obtained which representsthe quantity of uridine incorporated into the cells by comparison to the 100 cpm initiallyintroduced in each tube.For each kinetic, the six corrected values are used to draw the straight regression line of bestfit (only five values are sometimes taken into account if one of them turns out to be aberrant).The equation of each straight regression line : y=ax+b, and its correlation coefficient R2 aredetermined.
- validity of the test :The following conditions must be respected to satisfactory cytotoxicity test performance :
95
♦ regarding the blank, positive control and samples :The three conditions below are simultaneously required before taking into account any of thestraight regression line obtained :
- the ordinate on the origin (b). must be negative- the coefficient of correlation R2 must be greater than 0.98.- At least two of the three values of the slopes (a) must be in the same accuracyrange. If one slope appears to be outside this accuracy range, it is rejected andthe mean slope only corresponds to two resulting values.
♦ regarding the blank :An additional criteria must be respected :
- the slope (a) must be greater than 1,75
If the previous criteria are met, the mean slope of the straight lines of best fit of the blank iscalculated, and an arbitrary value of 100% is attributed to this average.The mean slopes of the straight lines of best fit of the positive control and the samples arecalculated and each mean value is compared to that obtained for the blank. The results areexpressed as a percentage of RNA synthesis in relation to the blank.
9- Interpretation of the results :
If the percentage obtained for the sample by comparison to those obtained for the blank is lessthan 70%, the material is not accepted (French standard acceptance criteria). If event, anothercytotoxicity test has to be conducted in order to confirm (or not) the first result obtained. Thisthreshold of 70 % should be discussed in the future.

96
Annex 7 Results materials 4, 5 and 6 with 3 calculation methods
Annex 8 Results materials 7 and 8 with 3 calculation methods
Annex 9 Results materials 9, 10 and 11 with 3 calculation methods
Annex 10 Results materials 12 and 13 with 3 calculation methods
Annex 11
Annex 12
These annexes are presented in a separate document