cpb-us-east-1-juc1ugur1qwqqqo4.stackpathdns.com · web viewname:_____ math 7r—unit 4 statistical...
TRANSCRIPT

Name:_______________________ Math 7R—Unit 4
Statistical Analysis & ProbabilityUnit 4 Goals:Established Goals: 7.SP.1 Understand that statistics can be used to gain information about a population by examining a sample of the population; generalizations about a population from a sample are valid only if the sample is representative of that population. Understand that random sampling tends to produce representative samples and support valid inferences.
7.SP.2 Use data from a random sample to draw inferences about a population with an unknown characteristic of interest. Generate multiple samples (or simulated samples) of the same size to gauge the variation in estimates or predictions. For example, estimate the mean word length in a book by randomly sampling words from the book; predict the winner of a school election based on randomly sampled survey data. Gauge how far off the estimate or prediction might be.
7.SP.3 Informally assess the degree of visual overlap of two numerical data distributions with similar variabilities, measuring the difference between the centers by expressing it as a multiple of a measure of variability. For example, the mean height of players on the basketball team is 10 cm greater than the mean height of players on the soccer team, about twice the variability (mean absolute deviation) on either team; on a dot plot, the separation between the two distributions of heights is noticeable.
7.SP.4 Use measures of center and measures of variability for numerical data from random samples to draw informal comparative inferences about two populations. For example, decide whether the words in a chapter of a seventh grade science book are generally longer than the words in a chapter of a fourth-grade science book.
7.SP.5 Understand that the probability of a chance event is a number between 0 and 1 that expresses the likelihood of the event occurring. Larger numbers indicate greater likelihood. A probability near 0 indicates an unlikely event, a probability around 1/2 indicates an event that is neither unlikely nor likely, and a probability near 1 indicates a likely event.
7.SP.6 Approximate the probability of a chance event by collecting data on the chance process that produces it and observing its long-run relative frequency, and predict the approximate relative frequency given the probability. For example, when rolling a number cube 600 times, predict that a 3 or 6 would be rolled roughly 200 times, but probably not exactly 200 times.
7.SP.7 Develop a probability model and use it to find probabilities of events. Compare probabilities from a model to observed frequencies; if the agreement is not good, explain possible sources of the discrepancy.
a. Develop a uniform probability model by assigning equal probability to all outcomes, and use the model to determine probabilities of events. For example, if a student is selected at random from a class, find the probability that Jane will be selected and the probability that a girl will be selected.
b. Develop a probability model (which may not be uniform) by observing frequencies in data generated from a chance process. For example, find the approximate probability that a spinning penny will land heads up or that a tossed paper cup will land open-end down. Do the outcomes for the spinning penny appear to be equally likely based on the observed frequencies?
7.SP.8 Find probabilities of compound events using organized lists, tables, tree diagrams, and simulation. a. Understand that, just as with simple events, the probability of a compound event is the fraction of
outcomes in the sample space for which the compound event occurs. b. Represent sample spaces for compound events using methods such as organized lists, tables and
tree diagrams. For an event described in everyday language (e.g., “rolling double sixes”), identify the outcomes in the sample space which compose the event.
c. Design and use a simulation to generate frequencies for compound events. For example, use random digits as a simulation tool to approximate the answer to the question: If 40% of donors have type A blood, what is the probability that it will take at least 4 donors to find one with type A blood?
Student self-assessment checklist:

1. I can determine if a sample is a random sample. 2. I can use data from a random sample to draw inferences about the population.2. I can calculate, compare and analyze measures of central tendency.3. I can interpret data using dot plots, box plots, frequency tables and histograms.4. I can create a dot plot, box plot, frequency table and histogram.5. I can use mean and mean absolute deviation (MAD) to compare data.6. I can determine the difference between Theoretical and Experimental Probability.7. I can determine the probability of a single event. 8. I can determine the difference between independent and dependent events.9. I can determine the probability of compound events. (more than one event)10. I can use a tree diagram and the Basic Counting Principle to determine the number of outcomes, the sample space and answer questions about outcomes.11. I can make predictions based on a sample set or experiment.
Aim: SWBAT understand random samples and make inferences based on the population using random samples. What is Statistics? Statistics is the study of how to collect, organize, analyze, and interpret numerical information from data.What is a random (unbiased) sample?

A food service company supplies meals for 21 different schools. How might the company get information about students’ favorite lunch? Surveying every student in every school would take a lot of time and effort. It would be more efficient to survey a random sample that represents the “whole group,” or population. What makes a sample representative of the population?
A sample that looks at a group from a random, even mix is representative of the population.
In order for a sample to be considered random, every object or event has to have an equal chance of being selected. Imagine a jar filled with slips of paper which contain the names of each student at Felix Festa. Suppose you pick 10 slips of paper from the top of the jar to give out 10 prizes. Do all the names have an equal chance of being selected?
Maybe the slips at the top belong to the last class that put their names in the jar . . . Selecting from the top does not give the names at the bottom of the jar an equal chance.
This would be a biased sample because it does NOT represent the whole population.
How could we fix this and create an unbiased sample (a random sample)? Suppose, instead that you put your hand in and mix all the slips around. You
do this each time you pick the ten names. With this method, all the names get an equal chance of being selected.
This would be a random sample (unbiased sample).
Here are some ways to select a representative random sample: Use a pattern, such as selecting every fourth person who enters the
cafeteria. Use a method, such as drawing names out of a hat, where everyone has an
equal chance of being selected. Divide the population into groups, such as grade level, and randomly select
people from each group.Here are some ways of selecting a sample that might result in a biased sample:
Let people volunteer to take a survey Choose people who are easy to reach, such as the students who happen to
be in the cafeteria when you are available to give surveys Choose people as a group, such as students on the honor roll
Example 1) Carla has a list of all 720 students in her middle school. She writes the names of each student on a slip of paper and puts each slip in the box. Then she pulls 30 names from the box to decide who she will survey about the upcoming school election.
How many students are in Carla’s sample? __________
How many students are in the population? __________
One of Carla’s friends suggests that she survey only eighth-graders because they are the oldest and probably know more about the election than younger students. Do you think this suggestion creates a random sample? (Yes or No) Explain.
________ because ______________________________________________________

_____________________________________________________________________
_____________________________________________________________________Another one of Carla’s friends suggests that she make the sample larger and survey 100 students. Which sample size is more likely to represent the population? Explain.
_____________________________________________________________________
_____________________________________________________________________
_____________________________________________________________________Drawing Inferences from a Random SampleYou can use data from a random sample to generalize about a population. You can also use data from random samples to make predictions about a population.
Maybe about half of the students in a sample say that pizza is their favorite lunch item from the cafeteria.
You might predict that about half of the population has the same preference. The data collected might be used for making menu choices and for determining food orders.
Using Carla’s survey above . . . If 16 out of the 30 people surveyed by Carla and her friends said they would vote for Ben, how many of the 720 middle school students could Carla predict would vote for Ben? (Set up and solve a proportion)
Example 2) Colin asked every eighth student entering the school which of four subjects was
his or her favorite. The table below shows the results of Colin’s survey:
1) Does Colin’s survey represent a random sample? __________2) Why or why not? ___________________________________________________
_________________________________________________________________ 3) If there are 400 students at Colin’s school, predict the number of students who
would say that Language Arts is their favorite subject? (Set up and solve a proportion)
Favorite SubjectSubject Number of Students
Math 15Science 20Language Arts 10Social Studies 5

4) If there are 642 students at Colin’s school, predict the number of students who would say that Math is their favorite subject? (Set up and solve a proportion)
Variation among Random SamplesRandom samples can differ from one another due to random variation. The amount of variation is usually small, but occasionally, the variation is much larger.
For example If Ms. Jennings has a “mystery bag” of 100 marbles. Some of the marbles are red and the rest of them are blue. She wants her class to estimate how many of the marbles are red, without actually counting all the marbles in the bag. Instead, the class will use random samples of 10 marbles each.
Part A Suppose Joey had 4 red marbles in his sample. Use a proportion to estimate the number of red marbles in the bag.
Part B Ms. Jennings put Joey’s marbles back in the bag. Then she let Angela choose 10 marbles. Suppose Angela had 6 red marbles in her sample. After replacing the Angela’s marbles, Isabella chose 10 marbles and she got 9 red marbles. Why do you think the amount of red marbles was different in each sample?
____________________________________________________________
____________________________________________________________
** In order to get a better estimate of the number of red marbles in the bag, Ms. Jennings decided the class needed to draw more random samples. Drawing more random samples would help you decide how “typical” the samples from Joey, Angela and Isabella are.
By plotting the data on a dot plot, you can look for clusters around the same value and you can be more confident about using that value to estimate about the population.
You can also increase the sample size. If you drew 25 marbles instead of 10, the number of red marbles drawn would probably be clustered closer together.
Part C Ms. Jennings decided to let each of her 20 students draw a random sample from the mystery bag. The data are plotted on the dot plot below.
Marbles Experiment 1
Proportion of Red Marbles
0.5
0.6
0.70.
40.8
0.9
1.04

How are the numbers distributed on the dot plot? Do you notice a cluster? _____________________________________________________________________
_____________________________________________________________________
Part D Use a proportion to best estimate the number of red marbles in the “mystery bag.”
Homework – Random Samples1. The School board wants to study computer literacy among teachers. Which would
represent a random sample of teachersa. All high school math teachersb. Teachers from the middle school whose name begins with Nc. All male teachersd. Every eighth teacher on an alphabetical list
2. An on-line bookseller randomly chooses 200 book buyers from its database and then surveys those book buyers to find out if they were satisfied with the time it took to deliver their orders. Explain if the bookseller’s survey is biased or not.___________________________________________________________________________________________________________________________________________________________________________________________________
3. Milena surveys 80 high school students who are leaving a jazz concert to determine the favorite type of music among high school students. Explain whether or not Milena’s survey is biased.___________________________________________________________________________________________________________________________________________________________________________________________________
4. Max wants to find out the exercise habits of local children. He plans to survey every third child he sees coming out of a sporting goods store. Max says his sample is not biased. Do you agree or disagree? Explain.___________________________________________________________________________________________________________________________________________________________________________________________________
Marbles Experiment 1
Proportion of Red Marbles

5. A researcher catches 60 fish from different locations in a lake. He then tags the fish and puts them back in the lake. Two weeks later, the researcher catches 40 fish from the same locations. 8 of these fish are tagged. Predict the number of fish in the lake using a proportion.
6. A high school has 1800 students. A random sample of 80 shows that 24 kids have cell phones. Predict the number of students in the entire high school who have cell phones using a proportion.
7. In a random sample, 3 of 400 computer chips are found to be defective. Based on the sample, about how many chips out of 100,000 would you expect to be defective
a. 750b. 3000c. 4000d. Cannot be Determined
8. A mint produces 150,000 souvenir coins each year. In a random sample of 400 coins, 3 have a misprint. Predict the number of coins that will have misprints in a year.
9. Zach chooses a random sample of 50 out of 400 students. He finds that 7 of them have traveled to a foreign country. Zach claims that over 50 out of all 400 students have traveled to a foreign country. Do you agree or disagree. Explain your answer on the lines below.
Circle one: agree disagree____________________________________________________________________________________________________________________________________________________________________________________________________________________________________________________________________

Aim: SWBAT use measures of central tendency to describe and interpret data.Do Now: Read the notes below and try Example 1.Measures of Central TendencyMeasures of central tendency help to describe and interpret a data set. They are used to interpret the “average item” of a data set. The table below shows the measures of central tendency (mean, median & mode) for this data set: 5, 1, 1, 6 and 7
Measure of Central Tendency ExampleThe mean is equal to the sum of the terms in a data set divided by the number of terms in the data set.
Mean = ∑ of termsnumber of terms
Mean = 5+1+1+6+75
=205
=4
The median is the middle term in a data set ordered from least to greatest. If there is an even number of terms in the data set, the median is the mean of the two middle numbers.
The data ordered from least to greatest are: 1, 1, 5, 6, 7The middle term, 5, is the median.
The mode is the term or terms that appear the most often in a data set. A data set may have no mode, one mode, or more than one mode.
1, 1, 5, 6, 7The number 1 appears twice in the data set. Every other number appears only once. So, 1 is the mode.
Example 1) The scores on a science quiz are: 7, 7, 9, 7, 10, 8, 6, 9, 10 and 7.What are the mean, median and mode of the science quiz scores?
Mean
Median
Mode
Choosing the BEST Measure of Central Tendency for the data setTo choose which measure of central tendency is most appropriate for a situation, look at
the distribution of the ordered data from a sample.
If there is a value that is much less or much greater than the other values in the set of data, the median or mode better represents the sample data better than the mean.
If the mode occurs at either extreme of the data, the mean or median are better choices to represent the sample data.
Example 2) Karen randomly surveyed some classmates to see how many books each of them
read over the summer. The results of her survey are shown in the dot plot.

Part A Find the mean, median and mode of the data.
Mean
Median
Mode
Part B Which measure(s) of central tendency best represents the data. ______________
** Measures of Central Tendency can also be used to analyze and compare two populations. **
Example 3) Students in Mrs. Becker’s class and Mr. Rolland’s class sold boxes of popcorn for a school fundraiser. The tables below show the number of boxes that each student sold. Popcorn Boxes Sold
Mrs. Becker’s Class5 8 76 1516 84 7 1217 11 13
How does the average number of boxes sold by each class compare? First find the measures
of central tendency for each class, then analyze and compare them.
Mean Mean
Median Median
Mode Mode Mrs. Becker’s Class: Mean: ______ Median: ______ Mode: ______
Mr. Rollands’s Class: Mean: ______ Median: ______ Mode: ______
The mean for Mrs. Becker’s class is _________________________ the mean for Mr. Rolland’s class.
Mr. Rolland’s Class9 10 12 208 34 6 2714 10 3 51

The median for Mrs. Becker’s class is ________________________ the median for Mr. Rolland’s class.Why can’t we compare the modes? ___________________________________________Conclusion: The average number of boxes sold by Mrs. Becker’s students was ____________
than the average number sold by Mr. Rolland’s students.
Homework – Measures of Central Tendency
Use the dot plot to answer questions 1 – 4. The dot plot shows the number of miles Jamal biked per week for 10 weeks.
1) What is the mean number of miles that Jamal bikes per week?
2) What is the median number of miles that Jamal biked per week?
3) What is the mode of the data? (What number of miles did Jamal bike most often?)
4) Which measure of central tendency best represents the average number of miles that Jamal bikes per week?A) mean or modeB) mean or medianC) median or modeD) mean, median or mode

Use the table to answer questions 5 – 9. Quiz Scores
The tables show the quiz scores in two seventh grade social studies classes.
5) Find the mean quiz score for each class.
6) Find the median quiz score for each class.
7) Find the mode quiz score for each class.
8) Which best describes the comparison between the mode quiz scores?
A) The modes are the same.B) The mode score for Class A is 2 points higher than for Class B.C) The mode score for Class A is 1 point higher than for Class B.D) The mode score for Class A is 1 point lower than for Class B.
9) Which best describes the comparison between the mean quiz scores?
E) The means are the same.F) The mean score for Class A is 0.5 points higher than for Class B.G) The mean score for Class A is 1 point higher than for Class B.H) The mean score for Class A is 1 point lower than for Class B.
Aim: SWBAT interpret data using dot plots and box plots (also called box-and-wiskers plots).
Do Now: Read the notes below and try Example 1.NotesWhen we use measures of central tendency we are describing the center (average) of a set of data. Now we are going to learn how to describe the spread of the data.
Class B9 10 8 10
10 9 10 65 7 8 10
Class A9 8 8 9
10 9 8 109 9 10

Measures of Variation show how spread out or close together the data in the set are, or how much the data points vary.
We learned in the previous lesson that when the data are arranged from least to greatest, the median divides the data into two equal halves.
The quartiles and the median divide the date into four quarters. The first quartile is the median of the data values that are less than the median. The third quartile is the median of the data values that are greater than the
median. The range measures the spread of all of the data. The range is the difference between the greatest value and the least value in the
data set. The IQR (interquartile range) measures the spread of the two middle quarters of
the data. The interquartile range (IQR), is the difference between the third quartile and
the first quartile.
For the data set (above): the median is 3 The first quartile is 2 (the mean of 2 and 2) The third quartile is 3.5 (the mean of 3 and 4) The range is 4 (5 – 1) The IQR (interquartile range) is 1.5 (3.5 – 2)
In a set of data, a number that is much less or much greater than the other numbers in the data set is called an outlier. A data set may contain one or more outliers. An outlier will affect the range, but will not affect the interquartile range. This is why the median is not as affected by outliers as the mean is.
Example 1) Use the data set to answer the following questions.2, 3, 5, 6, 8, 10, 23
a) What is the median of the data? __________b) What is the first quartile of the data? __________c) What is the third quartile of the data? __________d) What is the range of the data? __________e) What is the IQR of the data? __________f) Are there any outliers in this data set? _____ If so, what are they? __________

g) What would the range be without the outlier? __________
Example 2) The dot plot below shows the grades students received on a grammar test in Ms. Parson’s class.
a) What is the range of the grades? ______________________________b) How many students are in in Ms. Parson’s class? _________c) What is the median grade? _________d) Which grade(s) would be considered outliers? ____________________
A box plot, also known as a box-and-wiskers plot, is a method of visually displaying a distribution of data values by using the median, quartiles and extremes (least and greatest values) of the data set. The box shows the middle 50% of the data.
*A box plot is a good way to show the spread of the data.*Example 3) The box plot below shows the ages of Mr. Morehouse’s grandchildren.
a) Find the median of their ages. _________b) Find the first quartile of their ages. _________c) Find the third quartile of their ages. _________d) Find the interquartile range. _________
Example 4) The double box-plot below shows the number of points scored in games by two basketball players on the same team.

Find the range and interquartile range for each player. Who is the more consistent scorer?Let’s compare the range and interquartile ranges for each player . . .
Missy Range: ____________________ IQR: ____________________
Luisa Range: ____________________ IQR: ____________________
Conclusion: _____________________________________________________________
_____________________________________________________________________
_____________________________________________________________________
Homework – Interpreting Data using Dot Plots & Box PlotsThe double box plot below shows the weights, in pounds, of Labrador Retrievers and Cocker Spaniels from a veterinarian’s office.
Which type of dog shows greater variability in weight? Answer the following questions to help you decide.
1) The least weight for the Cocker Spaniel is ________ pounds.2) The greatest weight for the Cocker Spaniel is ________ pounds.3) Find the range of the Cocker Spaniels’ weights. ______ - ______ = ______ pounds4) The third quartile weight for the Cocker Spaniel is ________ pounds.5) The first quartile weight for the Cocker Spaniel is ________ pounds.6) Find the IQR for the Cocker Spaniels’ weights: 27 – ________ = ________7) The IQR for the weights of the Cocker Spaniels is ________ pounds8) The least weight for the Labrador Retrievers is ________ pounds.

9) The greatest weight for the Labrador Retrievers is ________ pounds.10) Find the range of the Labrador Retrievers’ weights. ______
- ______ = ______ lbs11) The third quartile weight for the Labrador Retrievers is
________ pounds.12) The first quartile weight for the Labrador Retrievers is
________ pounds.13) Find the IQR for the Labrador Retrievers’ weights: ______ –
________ = ________14) The IQR for the weights of the Labrador Retrievers is
________ pounds15) The range and the IQR for Cocker Spaniels are
_______________ than for Labrador Retrievers. Conclusion: ____________________ have greater variability in weight than _________________________.Use the dot plot to answer questions 16 & 17. The dot plot shows the grades that a class of studentsreceived on their social studies homework assignment.
16) What is the first quartile grade?A) 75 B) 80 C) 85 D) 90
17) What is the third quartile grade?A) 85 B) 90 C) 95 D) 100
Use the dot plot to answer questions 18 & 19.The double box plot shows the vocabulary quiz scoresFor Mr. Edelman’s first and second period classes.
18) What is the interquartile range of the first period quiz scores?
A) 5 B) 10 C) 15 D) 20
19) Which statement is true about the quiz scores?A) The range of the scores is the same for both classes.B) The interquartile range of the scores was the same for both classes. C) The median score was the same for both classes.

D) About 25% of the students in both classes scored 95% or higher on the quiz.
20) The box-and-wisker plot shows the number of miles run per week by the members of the running club. What is the range of the data?
A) 9 miles B) 12 miles
C) 15 miles
D) 18 miles
21) The box-and-wisker plot shows the ages of the participants in a park clean-up. What is the interquartile range of the ages in years?
A) 12 C) 20B) 16 D) 32

Aim: SWBAT construct dot plots, box plots (also known as box-and-wiskers plots) frequency tables and histograms. Do Now:
1) Use the box plot to find the min, lower quartile, median, upper quartile, and max
Minimum: __________Quartile 1: __________Median: __________Quartile 3: __________Maximum: __________Inter-Quartile Range: __________
2) Use the dot plot to create a list. Then find the mean, median, mode, and range.
List the data: ___________________________________________________________
Mean
Median: __________
Mode: __________
Range: __________
Minimum (Min) - The smallest number Maximum (Max) – The largest numberLower Quartile (Quartile 1 or Q1) - The midpoint of the minimum and median. 25% of the data lies before this point.Median – The midpoint of the data. 50% of the data lies before this point.Upper Quartile (Quartile 3 or Q3) - The midpoint of the median and maximum. 75% of the data lies before this point.Inter-quartile Range (IQR) - The difference of the quartiles (Q3 - Q1)Box and Whisker Plot - A graph that depicts five key statistical data: Min, Q1, Median, Q3, and Max.Dot Plot – A statistical diagram that represents a list by placing a dot over the corresponding number. The more dots tells you how often a number is repeated in a list.Now let’s review how to construct a box plot from a set of data. A random sample of teenagers, ages 13 and 14, were asked “on average, how many text messages do you send per day?” The results were: 0, 10, 10, 10, 10, 20, 20, 20, 30, 50, 50, 50, 90, 100, 100

Example 1) The following are Robert’s test scores for math class: 77, 83, 83, 88, 92, 94, 99 Construct a box and whisker plot for the data. Don’t forget to give your graph a title and label its axis.
Minimum: __________ Quartile 3: __________Quartile 1: __________ Maximum: __________Median: __________ Inter-Quartile Range: __________
Now let’s review how to construct a dot plot from a set of data. For each number in the data set, make a dot above that number. The number of dots above a number represents the number of times that number appears in the data set.
Example 2) Maria counts the number of cars that go by as she waits for the school bus in the morning. Construct a dot plot on the number line for her data. Don’t forget to give your graph a title and label its axis.
0, 1, 2, 2, 3, 4, 4, 5, 5, 6, 6, 6, 6, 7, 7, 8, 8, 9, 11, 12
78 80 82 84 86 88 90 92 94 96 98

Now let’s review frequency tables and histograms. Interval – A group of numbers such as 1-10 or 50-79Frequency Table – A diagram that shows the amount of times an interval appearsHistogram - A bar graph like diagram used to show compare intervals with their frequency.
Intervals must go on the x-axis and the bars must touch. Frequencies go on the y-axis. Be sure that each interval contains the same number of values. Be sure to label your axes and give your graph a title.
Example 2) The following data shows the player weights below (in lbs.) for the town wrestling team. Complete the frequency table below and then create a histogram for the data using the grid. Be sure to:
Give your graph a title Label both axes Make your bars the same width (# of boxes) Make your bars touch Choose a scale on the y-axis is appropriate
Player Weights: 121, 140, 165, 172, 110, 105, 178, 145, 133, 155, 103, 170, 122, 131, 119, 125, 127, 162, 113, 121
Frequency Table
Histogram

CLASSWORK 1A) Construct a dot plot on the number line for the following data. Don’t forget to give your graph a title and label its axis.
Heights in inches of 20 students in a class:53, 60, 61, 63, 64, 65, 65, 65, 65, 66, 66, 67, 67, 68, 69, 70, 70, 71, 71,
73
1B) Now, construct a box plot on the number line for the same data. . Don’t forget to give your graph a title and label its axis.
Heights in inches of 20 students in a class:
53, 60, 61, 63, 64, 65, 65, 65, 65, 66, 66, 67, 67, 68, 69, 70, 70, 71, 71, 73
Minimum: __________ Quartile 3: __________
Quartile 1: __________ Maximum: __________
Median: __________ Inter-Quartile Range: __________
52 54 56 58 60 62 64 66 68 70 72

1C) Describe the shape of the dot plot. _________________________________________
_______________________________________________________________________
_______________________________________________________________________
_______________________________________________________________________
1D) In your opinion, which graph shows a better display of the data set? Why? ____________
_______________________________________________________________________
_______________________________________________________________________
_______________________________________________________________________
_______________________________________________________________________2A) The following set of data represents the scores on a mathematics quiz:
58, 79, 81, 99, 68, 92, 76, 84, 53, 57, 81, 91, 77, 50, 65, 57, 51, 72, 84, 89Complete the frequency table and then, on the grid below, create a histogram for the quiz scores. Don’t forget your labels etc.
Mathematics Quiz ScoresInterval TALLY FREQUENCY50 – 5960 – 6970 – 7980 – 8990 - 99

Answer the following questions based on your frequency histogram.2B) Which quiz score interval was the most frequent? __________
2C) How many students scored at most 79? __________
2D) How many students scored a quiz score of at least 80? __________
2E) What percent of the students scored less than 80? __________ (round your answer to the nearest percent)
Homework – Creating GraphsBox Plots, Dot Plots and Histograms
1) In class, we looked at the box plot for this situation: A random sample of teenagers, ages 13 and 14, were asked “on average, how many text messages do you send per day?” The results were: 0, 10, 10, 10, 10, 20, 20, 20, 30, 50, 50, 50, 90, 100, 100
a) Create a dot plot for the data:
b) How many teenagers were surveyed? _______
c) Explain how you can determine this using the dot plot. ________________________
______________________________________________________________________
d) Describe the shape of the graph. ___________________________________________
______________________________________________________________________
______________________________________________________________________

e) Count the number of dots at 0 and 10. What do these numbers mean? ____________
______________________________________________________________________
f) What is one conclusion you can draw from this dot plot. ______________________
______________________________________________________________________
______________________________________________________________________2) The data below show the cost of cell phone cases at a local store. Create a box plot for the data. Don’t forget to give your graph a title and label its axis.
$67, $53, $41, $33, $52, $28, $70, $56, $54, $48, $65, $72, $44, $59, $62
Minimum: __________ Quartile 3: __________Quartile 1: __________ Maximum: __________Median: __________ Inter-Quartile Range: __________
3) Given the data set below, calculate each of the following measures of central tendency and variation.
5, 13, 9, 31, 25, 21, 25, 18, 23, 14, 32, 3, 22, 11, 16
a) Minimum: __________ f) Maximum: __________
b) Median: __________ g) Range: __________
c) Quartile 1: __________ h) Mean: __________
d) Quartile 3: __________ i) Mode: __________

e) Inter-Quartile Range: __________
4) The scores earned by students on a 100-point Biology test were as follows:
83, 81, 75, 72, 79, 89, 86, 79, 58, 95, 78, 70, 74, 82, 73, 79, 84, 66, 75, 90,
81, 97, 71, 77, 80, 68, 85, 96, 93, 88
A) Complete the frequency table for the biology test scores.
Biology Test ScoresInterval TALLY FREQUENCY95 – 9990 – 9485 – 8980 - 8475 – 7970 - 7465 - 6960 - 64
55 – 59B) Complete the frequency histogram (on the next page) for the biology test scores.
Use the frequency table and frequency histogram (on the next page) to answer the following questions.
C) How many students took the test? __________
D) How many students scored below 70 on the biology test? __________
E) What percent of the students scored below 70 on the biology test? __________ (round your answer to the nearest percent)
F) What percent of the students scored 90 or above on the biology test? __________ (round your answer to the nearest percent)
G) What is the mean test score? __________
H) What is the range of the test scores? __________
I) Which test score appeared the most often? __________
Be sure to: Give your graph a title Label both axes Make your bars the same width (# of boxes) Make your bars touch

Choose a scale on the y-axis is appropriate
AIM: SWBAT find the Mean Absolute Deviation and understand what it means about a set of data.
DO NOW:The school nurse measured all of the boys’ heights during their physical education class. She made a list of the basketball players’ heights and the soccer players’ heights.
Basketball Players’ Heights (in.)69, 70, 72, 73, 73, 73, 74, 75, 75, 76
Soccer Players’ Heights (in.)65, 66, 68, 69, 69, 70, 70, 70, 71, 72

Create a dot plot for the basketball players and another dot plot for the soccer players.
What can you conclude about the data sets based on your dot plots?
Notes:You have found measures of center to describe the middle of a set of data and you have used the interquartile range to describe the spread of a set of data. The mean absolute deviation is the average distance between each data value and the mean. A data set with a greater mean absolute deviation has data values that are more spread out from the mean. A data set with a lower mean absolute deviation has data values that are more clustered around the mean.
To find the Mean Absolute Deviation (MAD): Find the mean of the data. Take the absolute value of the difference between the mean and each data point. Then find the mean of those absolute values
Find the MAD for the basketball players.
1) Calculate the mean.
2) Take the absolute value of the difference between the mean and each data point.
Basketball Players’ Heights (in.)69, 70, 72, 73, 73, 73, 74, 75, 75, 76

3) Find the mean of the absolute values. This is the MAD.
Soccer Players’ Heights (in.)65, 66, 68, 69, 69, 70, 70, 70, 71, 72
Find the MAD for the soccer players.
1) Calculate the mean.
2) Take the absolute value of the difference between the mean and each data point.
3) Find the mean of the absolute values. This is the MAD.
How are the mean and the MAD reflected in the dot plots you created in the do now?
If two data sets have the same mean but different MADs, how does that reflect in the dot plot?
The points scored by a basketball player in his last seven games were: 17, 22, 17, 30, 15, 17 & 8. Find the mean and the MAD. Describe what the MAD represents in this situation.

The number of tomatoes in five boxes was 18, 21, 16, 19 and 20. Find the mean and the MAD. Describe what the MAD represents in this situation.
Homework – Mean Absolute Deviation1) The number of pages in books read by sixth and seventh grade students during one
semester are shown below.Sixth Grade: 125, 132, 150, 137Seventh Graders: 198, 174, 208, 120
A) Find the Mean Absolute Deviation (MAD) of pages read by sixth graders.
B) Find the Mean Absolute Deviation (MAD) of pages read by seventh graders.
C) Compare the MAD’s. The variability in the number of pages read by the seventh graders is almost _____ times the variability in the number of pages read by the sixth graders.
Use the following information to answer questions 2 & 3.Paula’s grades on her history tests this semester are 79, 93, 92, 86, and 90. 2) Which shows the deviation of each of her grades from her mean grade?
a. -9, 5, 4, -2, 2b. -8, 6, 3, -3, 2
c. -11, 6, 5, -4, 4d. -14, 9, 5, -3, 2

3) What is the mean absolute deviation (MAD) of Paula’s history grades?
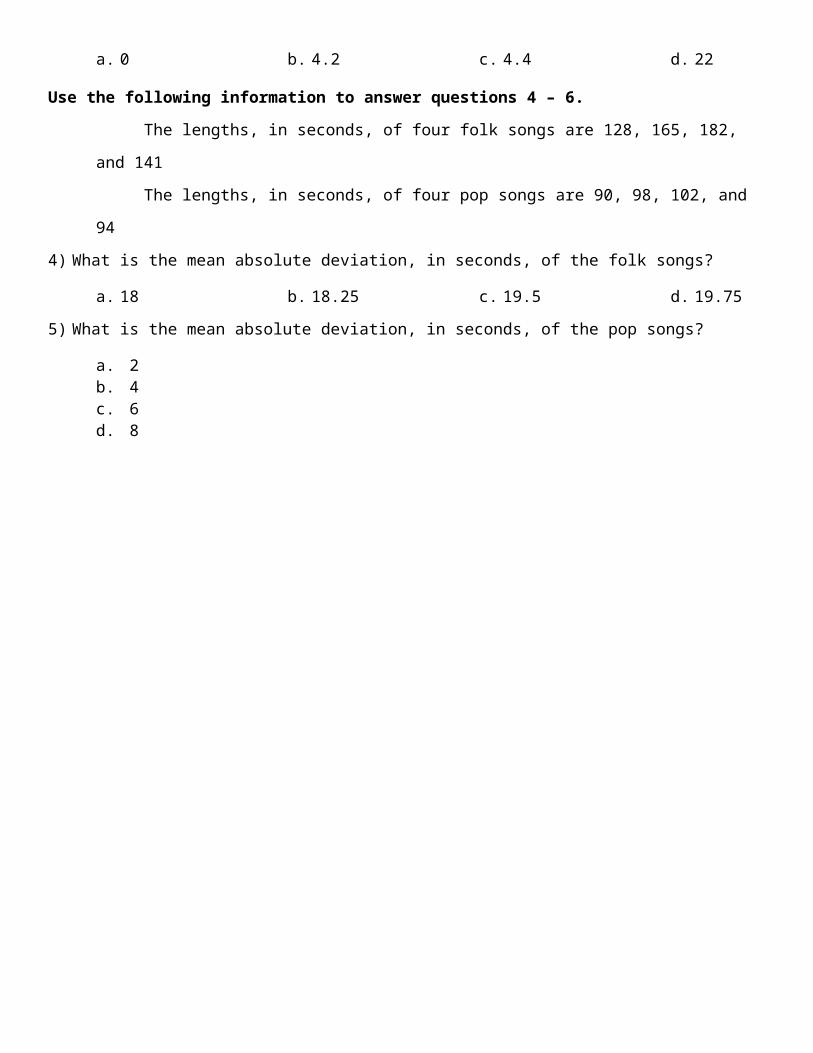
a. 0 b. 4.2 c. 4.4 d. 22Use the following information to answer questions 4 – 6.
The lengths, in seconds, of four folk songs are 128, 165, 182, and 141The lengths, in seconds, of four pop songs are 90, 98, 102, and 94
4) What is the mean absolute deviation, in seconds, of the folk songs?a. 18 b. 18.25 c. 19.5 d. 19.75
5) What is the mean absolute deviation, in seconds, of the pop songs?a. 2b. 4c. 6d. 8

6) Which of the following statements is true?a. The variability in the times of the folk songs is about half that of the pop songsb. The variability in the times of the folk songs is about twice that of the pop songs
c. The variability in the times of the folk songs is about 3 times that of the pop songs d. The variability in the times of the folk songs is about 4 times that of the pop songs
7) The lengths, in minutes, of the school band and orchestra practices are shown in the dot plots below.
A. What is the mean absolute deviation, in minutes, of the length of each group’s practice?
B. Compare the MADs. (How does the variability in the length of band practice compare to the variability in the length of orchestra practice?) Explain your thinking.
_______________________________________________________________
_______________________________________________________________
_______________________________________________________________
_______________________________________________________________
_______________________________________________________________
Quiz Review Topics Random Samples (fair and biased surveys)
Making Inferences About a Population

Measures of Central Tendency o Calculate mean, median and modeo Compare and analyze using the measures of central tendency
Measures of Variationo Calculate/Find – extremes, range, 1st Quartile, 3rd Quartile, Inter Quartile
Range (IQR)o Describe the spread of the data using the measures of variationo Compare and analyze using the measures of central tendency
Interpreting Data using Dot Plots, Box Plots and histograms
Create Dot Plots, Box Plots, Frequency Tables and Histogramso Remember Every graph needs a Title and always label all axes
Find the Mean Absolute Deviation (MAD) given a set of data.o Describe the MAD of a set of data
Aim: SWBAT ace the Unit 4 Quiz on Statistical Analysis.
Do Now: 1) Check your homework answers on the answer sheet. If you have extra time, review
for your quiz. 2) Prepare for Unit 4 Quiz
HOMEWORK: AT HOME toss any coin 50 times. Make a tally chart to record the number of
heads and the number of tails you got. Fill in your results on the next page in the Do Now section.
Aim: SWBAT determine the probability of a single event AND explore the difference between experimental and theoretical probability.
Do Now: Take out your homework and answer the questions below:
I tossed my coin 50 times and I got ________ heads and ________ tails.If you did the same experiment again, would you expect to get the same results? _____
Why or why not? _______________________________________________________

Probability of an event =
____________________________________________________________________Notes. Probability is the likelihood an event will happen; written as a ratio (fraction).
***** All probabilities are theoretical unless an experiment is discussed *****Simple Probability – the probability of a single event.
number of favorableoutcomesnumber of poss ible outcomes
What is an outcome? An outcome is the possible result of an action.For example: You roll a die. There are 6 possible outcomes.
What is a sample space? A sample space is list of all the possible outcomes.For example: You roll a die (number cube). The sample space is 1, 2, 3, 4, 5, 6
Practice Problems: Let’s look at some examples of simple probability:If you roll a die (number cube), P (1) means “What is the probability of rolling the die and getting a 1”? When what you want includes more than one item, you think about all of the items together. 1) Find each probability The sample space is: ____________________________
a) P (1) = __________
b) P (even number) = __________
c) P (1 or 2) = __________
d) P (5 or 8) = __________
e) P (prime number) = __________
f) P (a number less than 10) = _____
g) P (7) = __________
h) P (not a 4) = __________
i) P (factor of 12) = __________
j) P (5 or 6) = __________
When an event will definitely happen, the probability of the event is said to be certain. A certain event has a probability equal to 1.
When an event will definitely not happen, the probability of the event is said to be impossible. An impossible event has a probability equal to 0.
Other ways to describe probabilities using words include “more likely than not,” “as likely as not,” and less likely than likely.
Let’s see how these words apply to tossing a die (number cube) Outcome Probability
number less than 10 certainnumber 7 impossible
even number as likely as notfactor of 12 more likely than not
number 5 or 6 less likely than likely
Numbers between 0 and 1 describe probabilities.

Look at the diagram below. It shows how the words used to describe probabilities relate to numbers used to describe probabilities.
When an outcome is impossible, the outcome has a probability of 0.
When an outcome is as likely as not, the outcome has a probability of 12.
When an outcome is certain, the outcome has a probability of 1.
Outcomes with probabilities between 0 and 12 are less likely than likely.
Outcomes with probabilities between 12 and 1 are more likely than not.
If the names Jessica, Joshua, Jill and Jimmy are written on slips of paper and are placed in a bag.
Name an outcome that is impossible. ________________________________________
Name an outcome that is certain. __________________________________________
Name an outcome that is as likely as not. _____________________________________
Name an outcome that is more likely than not. _________________________________
You Try! You have a jar of gumballs. In the jar are 7 blue gumballs, 5 red gumballs and 3 white gumballs. Find each of the following probabilities as fractions in simplest form.
1) P (red) = _______
2) P (blue) = _______
3) P (white) = _______
4) P (red or white) = _______
5) P (blue or white) = _______
6) P (red or blue or white) = ______
7) P (green) = _______
8) P (white or green) = _______
------------------------------------------------------------------------------------------------------
Experimental Vs. Theoretical ProbabilityWhat is theoretical probability? Theoretical probability is what SHOULD happen in an experiment. It describes how likely it is than an event will happen based on all the possible outcomes and uses the ratio:

P (event) = Number of favorable outcomes Number of possible outcomes
Example) When you toss a coin 50 times, you SHOULD get 25 heads and 25 tails.
The theoretical probability of tossing a coin and getting heads is 12.
The theoretical probability of tossing a coin and getting tails is 12.
What is experimental probability?
Experimental probability is the probability based on experimental data that are found by repeating the experiment several times (like your homework assignment on tossing the coin) and using the ratio:
P (event) = Number of times an event happens _ # of times experiment was performed
Example) If when I tossed my coin 50 times, I got 20 heads and 30 tails.
The experimental probability of tossing the coin and getting heads is 2050
∨25 .
The experimental probability of tossing the coin and getting tails is 3050
∨35 .
Homework – Introduction to ProbabilityUse the spinner to answer questions 1 – 101) P (3) ________ 2) P (9) ________
3) P (#) ________ 4) P (not C) ________
5) P (Prime #) ________ 6) P (3 or B) ________
7) P (A, 2, or 5) ________ 8) P (consonant) ________
9) P (not a 1 or B) ________ 10) P(# less than 4) ________
A bag has 24 marbles: 6 green, 6 red, 12 blue. Lucy reaches in the bag and picks 1 marble.
11) What is the total number of marbles? __________________________________
12) What is half the total number of marbles? ______________________________
13) Name an outcome that is impossible. ___________________________________
432
1
DCB
A

14) Name an outcome that is certain. _____________________________________
15) Name an outcome that is as likely as not. _______________________________
16) Name an outcome that is more likely than not. ____________________________
17) Name an outcome that is less likely than likely. ___________________________
You randomly draw a tile from a bag that contains 10 A-tiles, 7 E-tiles, 6 I-tiles, 5 O-tiles and 2 U-tiles. Find the theoretical probability of the each event. Write as a fraction in simplest form.
18) P (you draw an A) 19) P (you draw an I) 20) P (you draw
an I or an O)
21) P (you draw an E or a U) 22) P (you draw a Z) 23) P (you draw a
vowel)
Aim: SWBAT understand the difference between theoretical and experimental probability AND use experimental probability to make predictions.
Do Now: Use the spinner to answer the questions. 1) P (spin a letter) ________2) P (spin an even #) ________3) P (spin a # greater than 6) ________4) P (spin a vowel) ________5) P (spin a consonant or an odd #) ________
Notes. Remember . . . Theoretical probability is what SHOULD happen in an experiment. It describes how likely it is than an event will happen based on all the possible outcomes and uses the ratio:
P (event) = Number of favorable outcomes Number of possible outcomes
Experimental probability is probabilities that are based on frequencies obtained by conducting an experiment. Experimental probabilities usually vary when an experiment is repeated and are based on what has happened in the past.
Experimental Probability = # of favorable outcomes # of times experiment was performed
Example 1) Let’s explore the difference between theoretical and experimental probability.
What is the theoretical probability of getting heads on a coin? __________
(this means “what should happen”?)What is the theoretical probability of getting tails on a coin?
__________If Maria tosses a coin 20 times. She gets 12 heads and 8 tails.
What is the experimental probability of Maria getting heads? __________(this means to find the probability of heads based on Mari’s experiment)What is the experimental probability of Maria getting tails? __________(this means to find the probability of tails based on Mari’s experiment)
Example 2) You roll a die. A) Find the theoretical probability of rolling a 6. __________
E7H
F
4D8
6

B) Find the theoretical probability of rolling a 3. __________C) Find the theoretical probability of rolling a 1. __________D) Find the theoretical probability of rolling a 4. __________E) Find the theoretical probability of rolling a 2. __________F) Find the theoretical probability of rolling a 5. __________
Example 3) You roll a die 100 times. Your results are given in the table below.
A) Find the experimental probability of rolling a 6. __________
B) Find the experimental probability of rolling a 3. __________
C) Find the experimental probability of rolling a 1. __________
D) Find the experimental probability of rolling a 4. __________
E) Find the experimental probability of rolling a 2. __________
F) Find the experimental probability of rolling a 5. __________
G) If you roll the die 350 times, what would be a good prediction for the number of times
the number cube would land on 6?
Method #1 OR Method #2 Set up a proportion. Multiply your probability by 350.
1) A company manufactures buttons. A quality control inspector finds 2 defective buttons in a batch of 300 buttons. About how many buttons would you expect to be defective in a shipment of 30,000 buttons?
First: Find the experimental probability of a button being defective. __________
Number
1 2 3 4 5 6
Rolls 17
15
20
16
14
18

Next: Multiply the probability by the total number of buttons OR set up a proportion
and solve. (Use either method from the example on the front)
2) Over the last 8 years, the probability that corn seeds planted by Ms. Diaz produce
corn is 56 . If Ms. Diaz wants to have 10,000 corn-bearing plants, how many seeds
should Ms. Diaz plant?
Use the following information to answer questions 3 and 4.Jill stood outside her school and watched the cars that went by. She counted 35 white cars, 23 red cars, 12 green cars and 20 black cars.
3) Out of the next 225 cars, how many would you expect to be red?
4) Out of the next 540 cars, how many would you expect to be white?
Homework “Theoretical Vs. Experimental Probability”
1) Explain the difference between theoretical and experimental probability.
_____________________________________________________________________
_____________________________________________________________________

_____________________________________________________________________
_____________________________________________________________________
2) A spinner was spun 40 times. The results are shown in the table below. Complete the table, and then answer questions A - F below.
A) What is the experimental probability of spinner landing on the color green? __________
B) What is the experimental probability of spinner landing on the color red? __________
C) What is the experimental probability of spinner landing on the color blue? __________
D) What is the experimental probability of spinner landing on the color yellow? __________
Based on the results of the experiment, make the following predictions if you were to spin the spinner 240 times. SHOW ALL WORK!E) # of times the spinner would F) # of times the spinner would land on green land on red
3) In a keyboarding class, Chris made 4 typing errors in 60 words. If Chris was writing a 1000-word essay, how many typing errors would you expect him to make?
Use the information in the table to answer questions 4 – 6.
Favorite Snack While Watching TelevisionFavorite Snack Number of StudentsPotato Chips 55Corn Chips 40Popcorn 35Pretzels 15
Color Green Red Blue Yellow
TallyMarks
|||| |||||||
|||| |||| |||| |||| |||| |||
Total

Candy 5
4) How many times was this experiment conducted? ___________
5) Out of 450 people, how many would you expect to choose corn chips?
6) Out of 600 people, how many would you expect to choose pretzels?
7) In the first 40 school days, Gretta’s school bus was late 8 times. If the school year is 180 days long, how many times should Gretta expect her bus to be late this year?
Aim: SWBAT determine the probability of two or more independent and dependent events.Do Now: Given the following three spinners, answer the questions that follow.
Spinner #1 Spinner #2 Spinner #3
1) Which spinner would be considered fair? ______ Why? _______________________________________________________________________________________
2) What fraction of spinner #1 is represented by A? __________3) What fraction of spinner #3 is represented by A? __________4) What fraction of spinner #1 is represented by D? __________5) On which spinner would you have the best chance of getting B? __________6) On which section is spinner #1 most likely to land on? __________
Notes.
B
D
CA
DB
BAC
DB
A

When there are 2 events, the probability is written as an ordered pair. The 1st number is for the first event, the 2nd number is for the second event.
For Example: If you roll a die: P (2, 5) means you want to find the probability that the first time you roll the die it lands on 2 and the second time you roll it, it lands on 5.
Also, when you want to find the probability of 2 or more events there are two possible situations. The two events can be either independent or dependent.
Independent Events are when the two events DO NOT affect each other. (Remember, working independently means working all by yourself)
o Example : If you are rolling a die and tossing a coin what you get on the die has absolutely no effect on what you get when you toss the coin.
Dependent Events are when the first event HAS AN AFFECT on the second event.o Example : If you have a bag of 3 black pens and 2 red pens and you want to
choose 2 red pens and not replace them once they are chosen the pen you choose first, has an effect on the next pen chosen because the bag does not have the same possible choices after the first pen is taken out. DEPENDING on what color pen is chosen first, the probability of what you get next will change.
** When finding the probability of two or more events, you find the probability of each event and then multiply them together.
Practice Problems: Tell whether the events are independent or dependent.1) You randomly choose a marble from a jar. You replace ____________________
the marble and randomly choose another marble.2) Your teacher randomly chooses you to give a report. ____________________
The teacher then chooses Pam from the remaining students. 3) You randomly choose a password from a list of words. ____________________
Then your friend chooses a password from the remaining words.4) You randomly draw a card from a deck of cards. You ____________________
Replace the card and then randomly choose another card.
In Class Examples: Show your work and DO NOT use your calculator.Independent Probability (AKA probability with replacement)Part A – You toss a coin and then roll a standard die, find each probability:
1) P (H, 3) = _______
2) P (T, 2 or 5) = _______
3) P (T, even #) = _______
4) P (H, 7) = _______
Part B – You have a container of 3 red pens, 6 black pens, 4 purple pens and 2 blue pens. Once a pen is selected, it is replaced. Find each probability:
Total # of pens = _____

5) P (red, purple) = _______
6) P (blue, red) = _______
7) P (black, black) = _______
8) P (purple, red, blue) = _______
9) P (red or blue, and then black) = _______
Dependent Probability (AKA probability without replacement)Part C – In a bag, there are 3 red marbles, 2 white marbles and 4 blue marbles. Once a marble is selected, it is NOT replaced. Find each probability:
10) P (red, blue) = _______
11) P (white, red) = _______
12) P (blue, blue) = _______
13) P (red, red, white) = _______
14) P (white, white, white) = _______
Homework – Independent & Dependent ProbabilityTell whether the events are independent or dependent. Then find the probability in each part.
1) You draw a button from a jar that contains 10 red buttons, 2 yellow buttons, 4 black buttons and 5 blue buttons. Without replacing the first button, you draw another.
(Circle one) Independent Dependent
a) What is the probability that you draw a red button and then a yellow button?
b) What is the probability that you draw a yellow button and then a blue button?
c) What is the probability that you draw a black button and then another black button?

d) What is the probability that you draw a red button and then a green button?

2) At a banquet, you can order a main course of a chef’s salad, salmon and potatoes, ham and beans or steak and rice. You can drink water, juice, milk, coffee, or iced tea. All choices are equally likely. What is the probability that a person chooses a chef’s salad and juice?
(Circle one) Independent Dependent
3) You have a basket of rolls: 5 wheat, 6 sourdough, 8 sesame, and 9 cheese. You randomly choose a roll, keep it, and then choose another.
(Circle one) Independent Dependenta) What is the probability that you will choose a sesame roll and then a cheese roll?
b) What is the probability that you will choose a cheese roll and then a sourdough roll?
c) What is the probability that you will choose a wheat roll and then a sesame roll?
d) What is the probability that you will choose a wheat roll and then another wheat roll?
4) You toss a coin and then roll a standard die. Find the probability that the coin lands on heads and the die lands on the number 3.
(Circle one) Independent Dependent
5) You toss a coin and then roll a standard die. Find the probability that the coin lands on heads and the die lands on a number greater than 4.
(Circle one) Independent Dependent
Aim: SWBAT find the possible outcomes in a sample space by drawing a tree diagram and by using
the basic counting principal.Do Now: Suppose you roll two dice. Fill in the diagram below to show the sample space.
( 1 , 1 ) ( 2 , 1 ) ( , ) ( , ) ( , ) ( , )

( 1 , 2 ) ( , ) ( , ) ( , ) ( , ) ( , )
( 1 , 3 ) ( , ) ( , ) ( , ) ( , ) ( , )
( , ) ( , ) ( , ) ( , ) ( , ) ( , )
( , ) ( , ) ( , ) ( , ) ( , ) ( , )
( , ) ( , ) ( , ) ( , ) ( , ) ( , )
Total # of outcomes = _________
Notes. A tree diagram is simply a way of representing a sequence of events. Tree diagrams are particularly useful in probability since they record all possible outcomes in a clear and uncomplicated manner. You will find out how many outcomes there are and you also get to see what each of the those outcomes is.
The Basic Counting Principle: When there are m ways to do one thing, and n ways to do another,
then there are m×n ways of doing both.
Using the Basic Counting Principle is quicker than making a tree diagram. It will also tell you how many outcomes there are. However, it will not SHOW you what those outcomes are. Therefore, if you need to know what your options are, you will NEED to draw the tree diagram. The basic counting principal is useful when you only need to know how many choices you have.
Example 1) A restaurant offers 4 different soups; tomato, onion, chicken and vegetable. They also offer two sizes; a cup or a bowl. How many different ways can you order soup?Let’s use the basic counting principle to see how many choices you have?There are 4 types of soup and 2 sizes of soup.
_______________ × _______________ = __________ possible outcomes Types Sizes
Now that we know there are ______ possible outcomes, let’s make a tree diagram and SEE what our possible choices are.
Tree Diagram: Tomato

Onion
Chicken
Vegetable
Now, let’s make a table to list all the possible choices (the sample space)Sample Space
Now, use your tree diagram and sample space to answer the following questions.
A) If know you want a cup of soup, how many choices do you have? __________
B) If you do not like onion soup, how many choices do you have? __________
C) If you want a bowl of soup and you do not like tomatoes, how many choices do you have? List them below. __________
Example 2) At a smoothie stand, you can order a fruit smoothie in three different sizes: small, medium or large. You can choose strawberries, mango or both fruits. Then you can choose to add yogurt or not. What is the probability that someone will order a smoothie with strawberries and yogurt in it?First, use the basic counting principle to see how many choices you have? __________
Next, draw a tree diagram to help you understand the problem.

Now, identify and list the favorable outcomes.
Finally, answer the question: What is the probability that someone will order a smoothie with strawberries and yogurt in it?
You Try!A sandwich shop offers a choice of white or wheat bread, three choices for meat (turkey, ham, or no meat), and four choices for cheese (Swiss, American, cheddar or no cheese).
A) Represent the sample space with a model. (Draw a tree diagram) How many outcomes are possible?

There are __________ outcomes
B) What is the probability that someone will order wheat bread with either turkey or ham?
C) What is the probability that someone will order their sandwich without cheese?
Homework – Tree Diagrams & the Basic Counting Principle1) At the school cafeteria, Bill has three choices for lunch; hot dog, salad or pizza. He
can choose soda, milk or lemonade to drink and he can choose pudding or ice cream for dessert.
A) Represent the sample space with a model. How many outcomes are possible?
There are __________ outcomes

B) What is the probability that Bill will choose a lunch that includes a hot dog? _________
C) What is the probability that Bill will choose a lunch that includes lemonade? _________
D) What is the probability that Bill will choose a lunch that includes pudding? _________
E) What is the probability that Bill will choose a lunch that includes soda and ice cream? _________
F) What is the probability that Bill will choose a lunch that includes pizza and milk? _________
Find the number of possible outcomes for each situation.
2) You have a choice of toast or muffin 3) A die is thrown four times. with juice, milk or coffee.
4) You have a choice of hamburger, fish or 5) You may choose fried eggs, Frenchhot dog. The vegetable choices are corn, toast, or cereal. The beverage
choicesor broccoli. The beverage choices are are coffee, tea, hot chocolate
ormilk, soda or water. Water. You may also have a
grapefruit half or orange juice.
6) If you have 4 shirts, 3 pairs of slacks 7) Five coins are tossed.and 2 ties, how many possible outfits doyou have?
8) Each spinner below is spun once.
