cpap performance verification device
TRANSCRIPT

CPAP Performance Verification Device
ECE 445 Design Document
Joseph Latocha, Zichong Wu, and Joe Zinnen Team 77
TA: Kexin Hui
2
1 Introduction 1.1 Objective
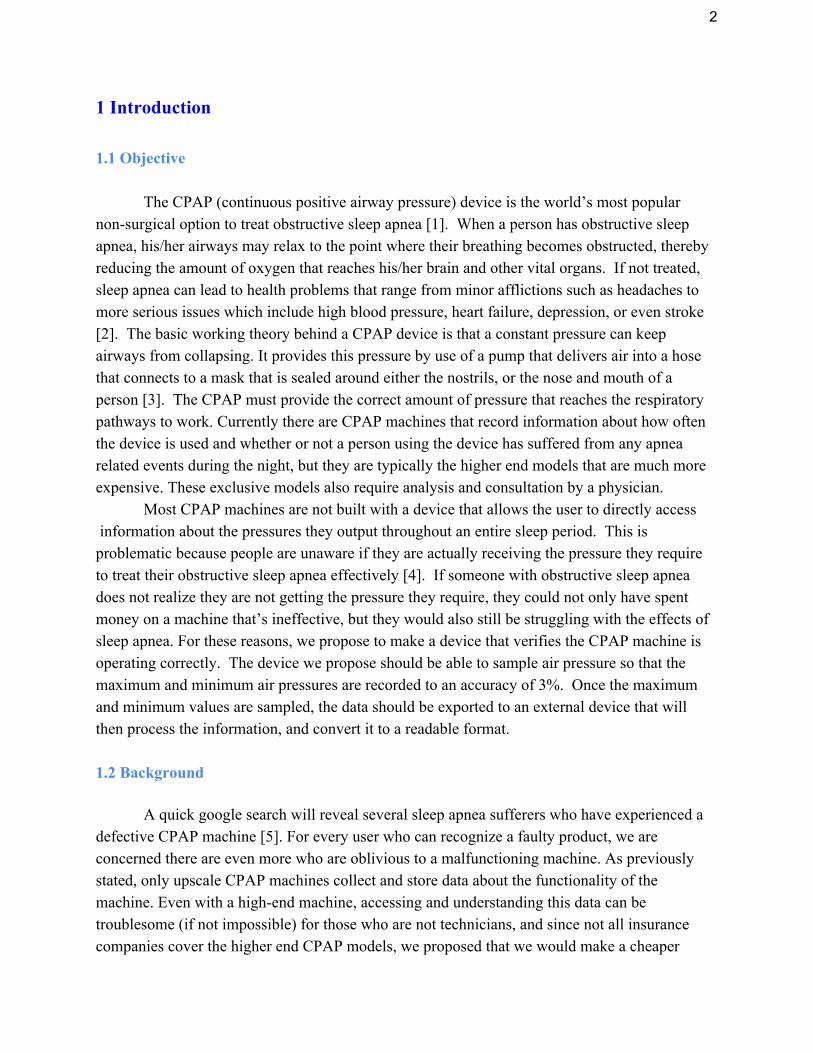
The CPAP (continuous positive airway pressure) device is the world’s most popular non-surgical option to treat obstructive sleep apnea [1]. When a person has obstructive sleep apnea, his/her airways may relax to the point where their breathing becomes obstructed, thereby reducing the amount of oxygen that reaches his/her brain and other vital organs. If not treated, sleep apnea can lead to health problems that range from minor afflictions such as headaches to more serious issues which include high blood pressure, heart failure, depression, or even stroke [2]. The basic working theory behind a CPAP device is that a constant pressure can keep airways from collapsing. It provides this pressure by use of a pump that delivers air into a hose that connects to a mask that is sealed around either the nostrils, or the nose and mouth of a person [3]. The CPAP must provide the correct amount of pressure that reaches the respiratory pathways to work. Currently there are CPAP machines that record information about how often the device is used and whether or not a person using the device has suffered from any apnea related events during the night, but they are typically the higher end models that are much more expensive. These exclusive models also require analysis and consultation by a physician.
Most CPAP machines are not built with a device that allows the user to directly access information about the pressures they output throughout an entire sleep period. This is problematic because people are unaware if they are actually receiving the pressure they require to treat their obstructive sleep apnea effectively [4]. If someone with obstructive sleep apnea does not realize they are not getting the pressure they require, they could not only have spent money on a machine that’s ineffective, but they would also still be struggling with the effects of sleep apnea. For these reasons, we propose to make a device that verifies the CPAP machine is operating correctly. The device we propose should be able to sample air pressure so that the maximum and minimum air pressures are recorded to an accuracy of 3%. Once the maximum and minimum values are sampled, the data should be exported to an external device that will then process the information, and convert it to a readable format.
1.2 Background
A quick google search will reveal several sleep apnea sufferers who have experienced a defective CPAP machine [5]. For every user who can recognize a faulty product, we are concerned there are even more who are oblivious to a malfunctioning machine. As previously stated, only upscale CPAP machines collect and store data about the functionality of the machine. Even with a high-end machine, accessing and understanding this data can be troublesome (if not impossible) for those who are not technicians, and since not all insurance companies cover the higher end CPAP models, we proposed that we would make a cheaper

3
attachment to the hose that would gather information about the pressure of the device throughout a person’s sleep cycle. There are also manual, handheld devices that test the pressure of the CPAP, but they do not provide the user of the CPAP machine with the ability to check if their CPAP machine lost pressure at any point during their sleep cycle . There is currently no device on the market that can provide a sleep apnea patient with accurate and thorough data throughout his/her sleep cycle at a low cost. Without direct access to this information, it is possible that one never realizes that their device is not operating correctly, and they could still unknowingly continue to suffer from obstructive sleep apnea. 1.3 High Level Requirements
● The verification device should be as cheap as possible, in no case should it cost more than 50% of a CPAP machine
● Information from the pressure sensors must be able to be accessed and analyzed each night for a full sleep cycle using an integrated circuit (6-8 hours, preferably even longer). The data stored by the IC should be simple to understand and displayed graphically
● The user must be alerted if there is any irregular activity throughout the sleep period so he/she can access the data.
2 Design 2.1 Block Diagram
Figure 1: Block Diagram of Hardware for CPAP Verification Device
4
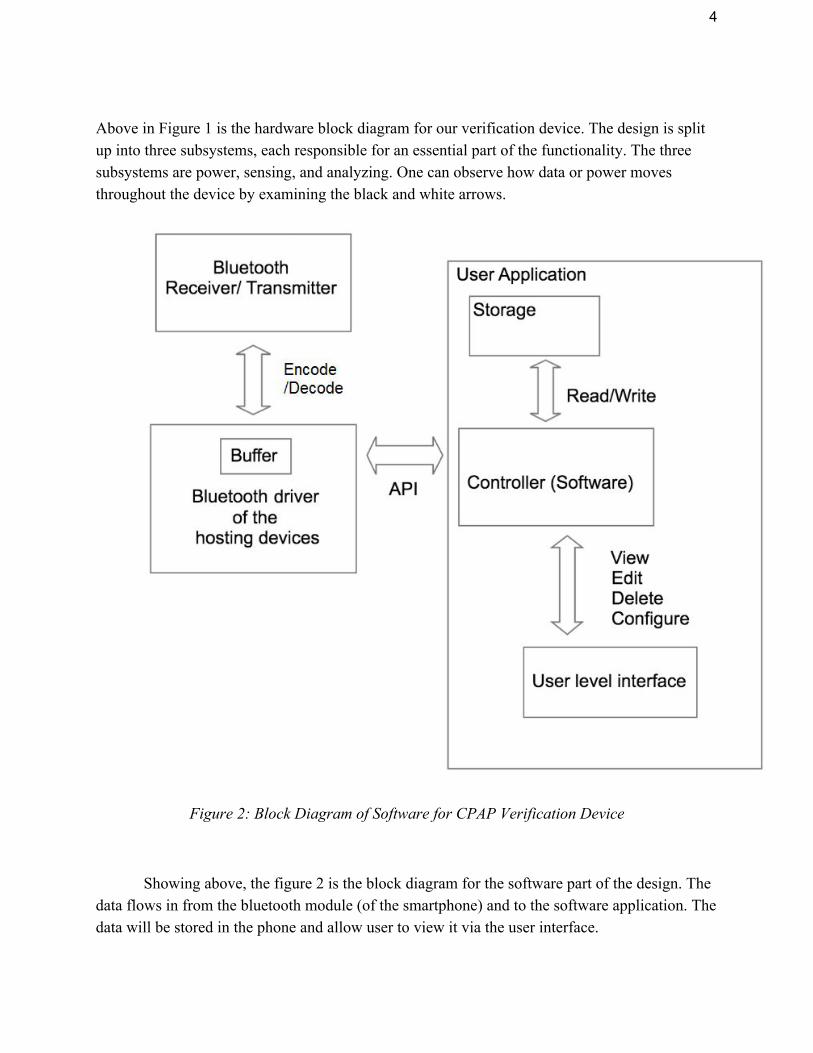
Above in Figure 1 is the hardware block diagram for our verification device. The design is split up into three subsystems, each responsible for an essential part of the functionality. The three subsystems are power, sensing, and analyzing. One can observe how data or power moves throughout the device by examining the black and white arrows.
Figure 2: Block Diagram of Software for CPAP Verification Device
Showing above, the figure 2 is the block diagram for the software part of the design. The data flows in from the bluetooth module (of the smartphone) and to the software application. The data will be stored in the phone and allow user to view it via the user interface.
5
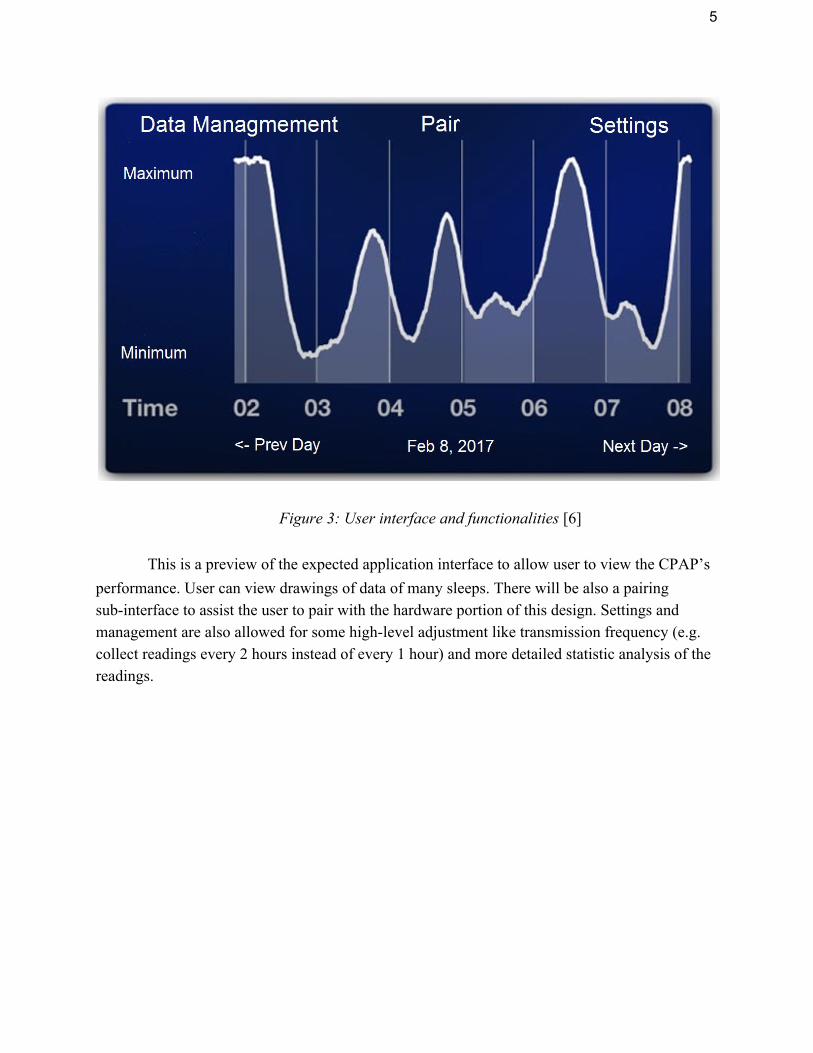
Figure 3: User interface and functionalities [6]
This is a preview of the expected application interface to allow user to view the CPAP’s performance. User can view drawings of data of many sleeps. There will be also a pairing sub-interface to assist the user to pair with the hardware portion of this design. Settings and management are also allowed for some high-level adjustment like transmission frequency (e.g. collect readings every 2 hours instead of every 1 hour) and more detailed statistic analysis of the readings.

6
2.2 Design Overview
Figure 4: Physical Representation of CPAP Verification Machine
Figure 4 is a rough sketch of the complete verification device. The physical dimension of
the project will be much smaller than the CPAP machine.
2.3 Block Design Components 2.3.1 Functional Overview: Hardware Design
The backbone of the hardware design is based around a pressure sensor and bluetooth module. The sensor output will be connected to the bluetooth module, and that will send the data to the device being used to store, analyze, and evaluate the pressure data. When the data does not fall into the range of a fully functional CPAP machine for longer than a minute (this functional range is determined by the degree of therapy the user requires), the analyzing system will turn on
7
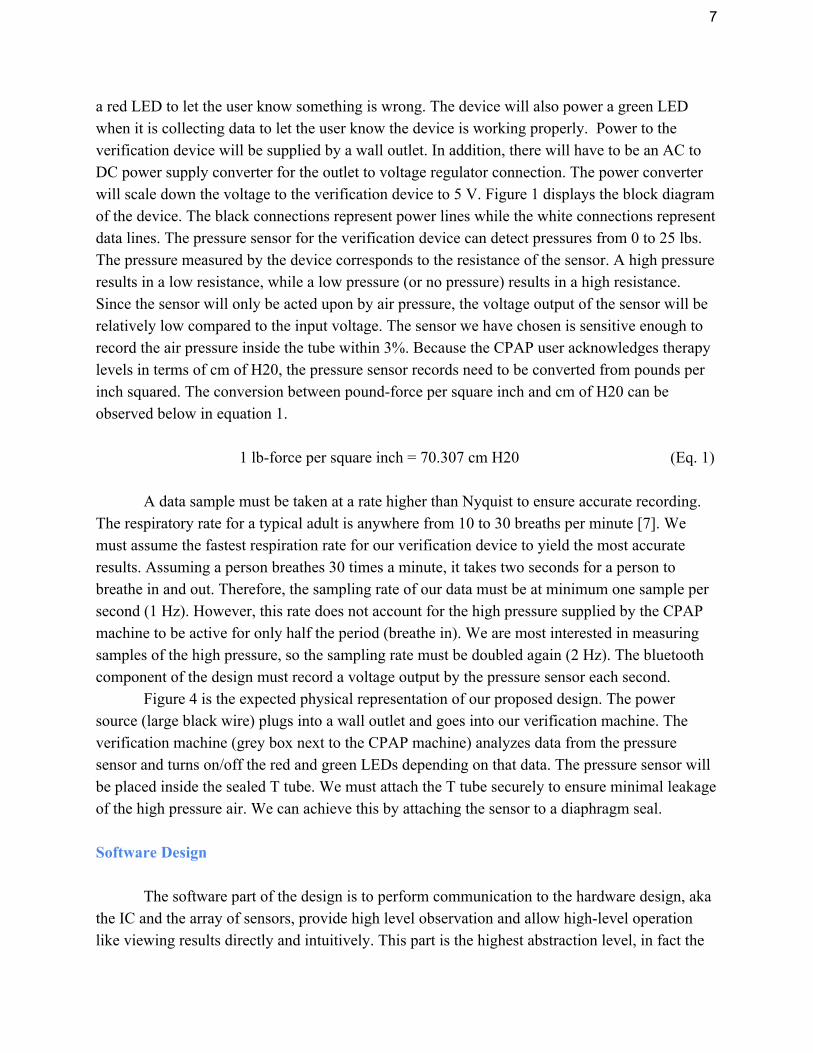
a red LED to let the user know something is wrong. The device will also power a green LED when it is collecting data to let the user know the device is working properly. Power to the verification device will be supplied by a wall outlet. In addition, there will have to be an AC to DC power supply converter for the outlet to voltage regulator connection. The power converter will scale down the voltage to the verification device to 5 V. Figure 1 displays the block diagram of the device. The black connections represent power lines while the white connections represent data lines. The pressure sensor for the verification device can detect pressures from 0 to 25 lbs. The pressure measured by the device corresponds to the resistance of the sensor. A high pressure results in a low resistance, while a low pressure (or no pressure) results in a high resistance. Since the sensor will only be acted upon by air pressure, the voltage output of the sensor will be relatively low compared to the input voltage. The sensor we have chosen is sensitive enough to record the air pressure inside the tube within 3%. Because the CPAP user acknowledges therapy levels in terms of cm of H20, the pressure sensor records need to be converted from pounds per inch squared. The conversion between pound-force per square inch and cm of H20 can be observed below in equation 1.
1 lb-force per square inch = 70.307 cm H20 (Eq. 1)
A data sample must be taken at a rate higher than Nyquist to ensure accurate recording.
The respiratory rate for a typical adult is anywhere from 10 to 30 breaths per minute [7]. We must assume the fastest respiration rate for our verification device to yield the most accurate results. Assuming a person breathes 30 times a minute, it takes two seconds for a person to breathe in and out. Therefore, the sampling rate of our data must be at minimum one sample per second (1 Hz). However, this rate does not account for the high pressure supplied by the CPAP machine to be active for only half the period (breathe in). We are most interested in measuring samples of the high pressure, so the sampling rate must be doubled again (2 Hz). The bluetooth component of the design must record a voltage output by the pressure sensor each second.
Figure 4 is the expected physical representation of our proposed design. The power source (large black wire) plugs into a wall outlet and goes into our verification machine. The verification machine (grey box next to the CPAP machine) analyzes data from the pressure sensor and turns on/off the red and green LEDs depending on that data. The pressure sensor will be placed inside the sealed T tube. We must attach the T tube securely to ensure minimal leakage of the high pressure air. We can achieve this by attaching the sensor to a diaphragm seal. Software Design
The software part of the design is to perform communication to the hardware design, aka the IC and the array of sensors, provide high level observation and allow high-level operation like viewing results directly and intuitively. This part is the highest abstraction level, in fact the
8
user level, of the entire project. Users can examine and assess the entire CPAP performance verification device via this interface level.
The software should store data collection on the hosting device(either smartphone or computer). It should store at least 7 days of CPAP performance data and give tool to compare them as well as provide statistics like average maximum and average minimum pressure of the CPAP. When the current day value is over or under some thresholds, the software can perform operation to notify users that CPAP is underperforming.
For the operation part. The following is the list of the functionalities contained: Pairing : Establish communication with the hardware device and become the hosting device of the unit (permission to receive data) Turn On/Off Collection : When turned on, the data recorded on the IC unit will be
sent to this hosting device. When turned off, the current hosting device will not receive any data
Pairing : Establish communication with the hardware device and become the hosting device of the unit (permission to receive data)
Delete : delete the specific day of readings Alert : sends a notification to the hosting device when the performance is under a
threshold required. Or requires the hardware LED(if mounted) to flash. Adjust IC Settings : Sets the communication period (for example, sets the IC to
send data to host every one hours), and sets the specific number of a periods of data that IC buffers.
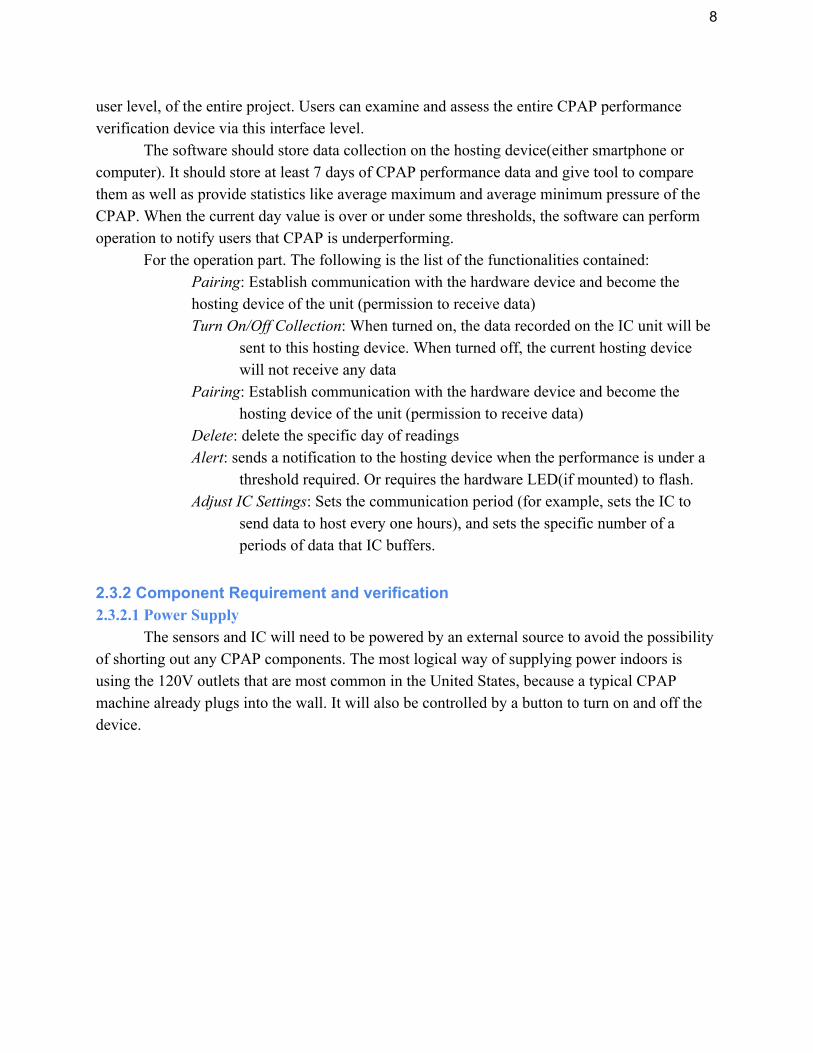
2.3.2 Component Requirement and verification 2.3.2.1 Power Supply
The sensors and IC will need to be powered by an external source to avoid the possibility of shorting out any CPAP components. The most logical way of supplying power indoors is using the 120V outlets that are most common in the United States, because a typical CPAP machine already plugs into the wall. It will also be controlled by a button to turn on and off the device.
9
Requirement Verification
The device we build/obtain should be able to plug into a typical 120 V AC outlet found in a household.
We can verify that the device correctly functions from a two prong outlet by measuring the voltage supplied to the output. We can place a voltmeter at the output of the regulator to measure the voltage output from the 120 V AC. If the voltage at the output of the regulator is 5 V, the device is working properly.
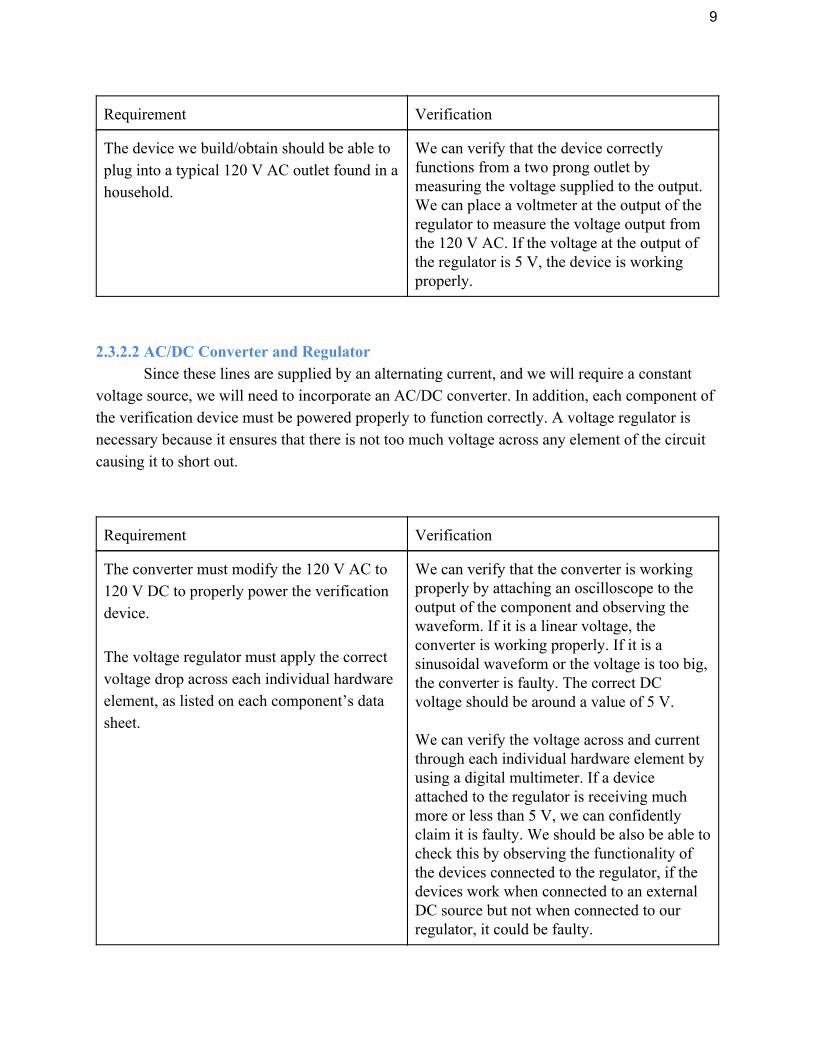
2.3.2.2 AC/DC Converter and Regulator
Since these lines are supplied by an alternating current, and we will require a constant voltage source, we will need to incorporate an AC/DC converter. In addition, each component of the verification device must be powered properly to function correctly. A voltage regulator is necessary because it ensures that there is not too much voltage across any element of the circuit causing it to short out.
Requirement Verification
The converter must modify the 120 V AC to 120 V DC to properly power the verification device. The voltage regulator must apply the correct voltage drop across each individual hardware element, as listed on each component’s data sheet.
We can verify that the converter is working properly by attaching an oscilloscope to the output of the component and observing the waveform. If it is a linear voltage, the converter is working properly. If it is a sinusoidal waveform or the voltage is too big, the converter is faulty. The correct DC voltage should be around a value of 5 V. We can verify the voltage across and current through each individual hardware element by using a digital multimeter. If a device attached to the regulator is receiving much more or less than 5 V, we can confidently claim it is faulty. We should be also be able to check this by observing the functionality of the devices connected to the regulator, if the devices work when connected to an external DC source but not when connected to our regulator, it could be faulty.
10
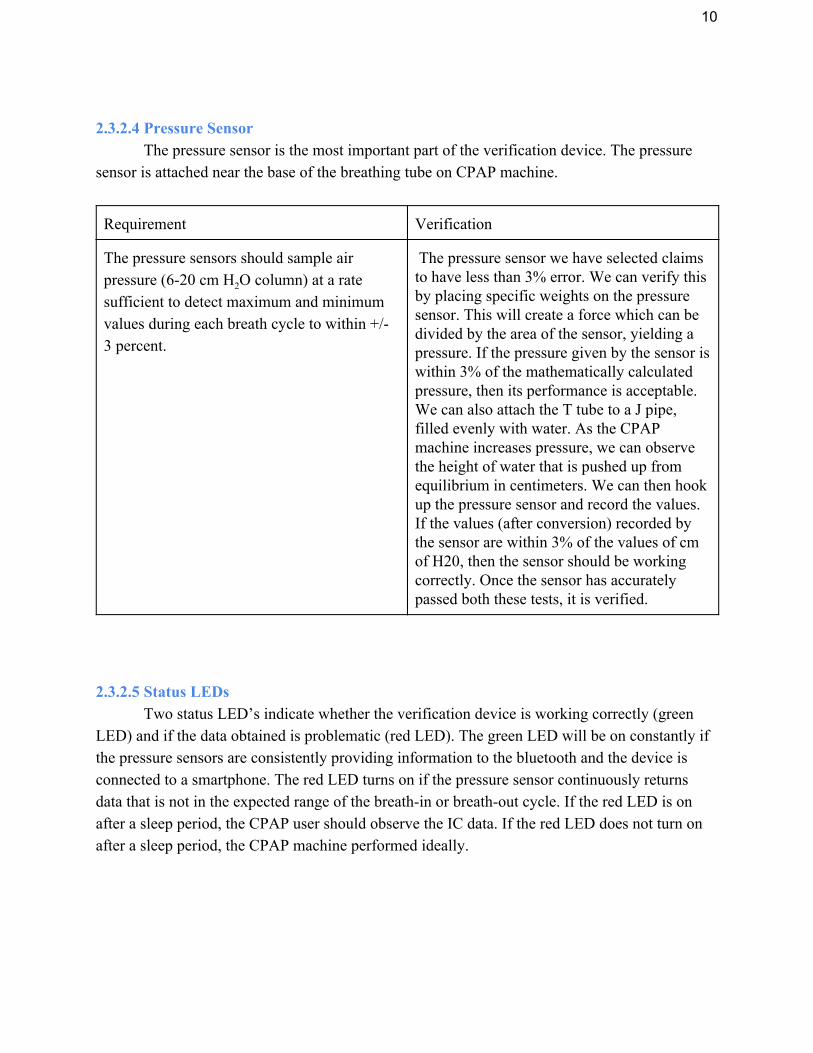
2.3.2.4 Pressure Sensor
The pressure sensor is the most important part of the verification device. The pressure sensor is attached near the base of the breathing tube on CPAP machine.
Requirement Verification
The pressure sensors should sample air pressure (6-20 cm H2O column) at a rate sufficient to detect maximum and minimum values during each breath cycle to within +/- 3 percent.
The pressure sensor we have selected claims to have less than 3% error. We can verify this by placing specific weights on the pressure sensor. This will create a force which can be divided by the area of the sensor, yielding a pressure. If the pressure given by the sensor is within 3% of the mathematically calculated pressure, then its performance is acceptable. We can also attach the T tube to a J pipe, filled evenly with water. As the CPAP machine increases pressure, we can observe the height of water that is pushed up from equilibrium in centimeters. We can then hook up the pressure sensor and record the values. If the values (after conversion) recorded by the sensor are within 3% of the values of cm of H20, then the sensor should be working correctly. Once the sensor has accurately passed both these tests, it is verified.
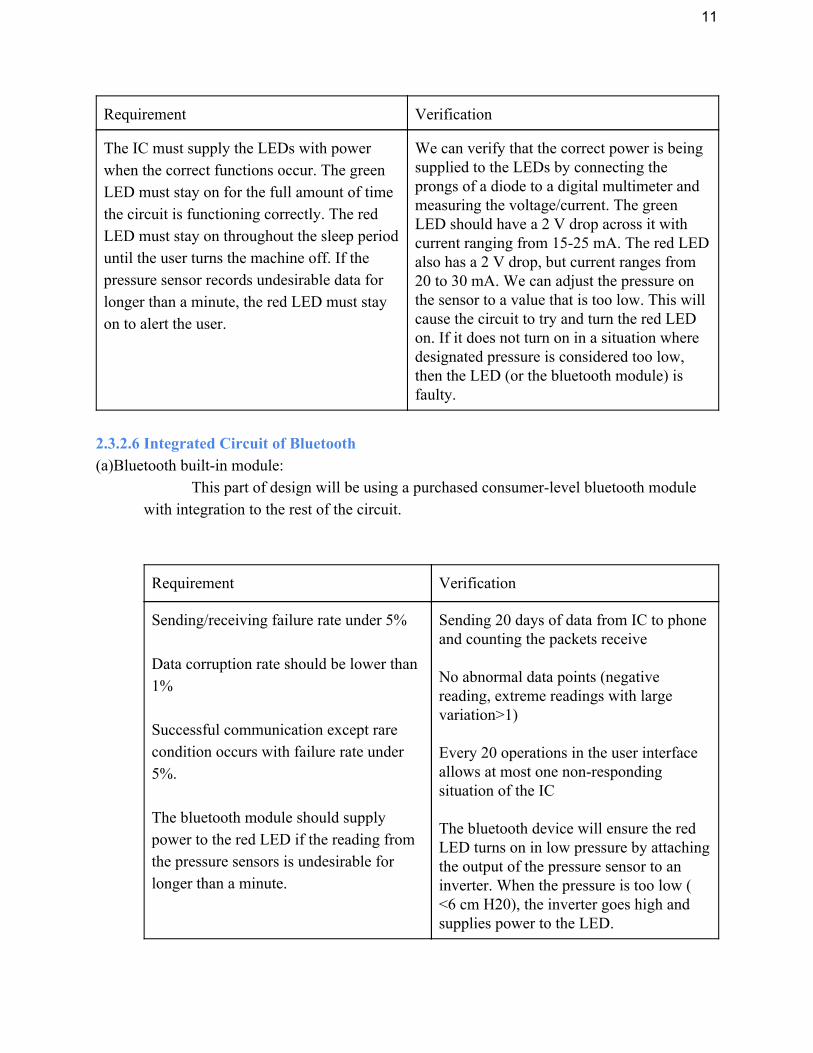
2.3.2.5 Status LEDs
Two status LED’s indicate whether the verification device is working correctly (green LED) and if the data obtained is problematic (red LED). The green LED will be on constantly if the pressure sensors are consistently providing information to the bluetooth and the device is connected to a smartphone. The red LED turns on if the pressure sensor continuously returns data that is not in the expected range of the breath-in or breath-out cycle. If the red LED is on after a sleep period, the CPAP user should observe the IC data. If the red LED does not turn on after a sleep period, the CPAP machine performed ideally.
11
Requirement Verification
The IC must supply the LEDs with power when the correct functions occur. The green LED must stay on for the full amount of time the circuit is functioning correctly. The red LED must stay on throughout the sleep period until the user turns the machine off. If the pressure sensor records undesirable data for longer than a minute, the red LED must stay on to alert the user.
We can verify that the correct power is being supplied to the LEDs by connecting the prongs of a diode to a digital multimeter and measuring the voltage/current. The green LED should have a 2 V drop across it with current ranging from 15-25 mA. The red LED also has a 2 V drop, but current ranges from 20 to 30 mA. We can adjust the pressure on the sensor to a value that is too low. This will cause the circuit to try and turn the red LED on. If it does not turn on in a situation where designated pressure is considered too low, then the LED (or the bluetooth module) is faulty.
2.3.2.6 Integrated Circuit of Bluetooth (a)Bluetooth built-in module:
This part of design will be using a purchased consumer-level bluetooth module with integration to the rest of the circuit.
Requirement Verification
Sending/receiving failure rate under 5% Data corruption rate should be lower than 1% Successful communication except rare condition occurs with failure rate under 5%. The bluetooth module should supply power to the red LED if the reading from the pressure sensors is undesirable for longer than a minute.
Sending 20 days of data from IC to phone and counting the packets receive No abnormal data points (negative reading, extreme readings with large variation>1) Every 20 operations in the user interface allows at most one non-responding situation of the IC The bluetooth device will ensure the red LED turns on in low pressure by attaching the output of the pressure sensor to an inverter. When the pressure is too low ( <6 cm H20), the inverter goes high and supplies power to the LED.

12
2.3.2.7 Software
(b)Application block:
The application will be designed and implemented by us. The platform used is Android.
Requirement Verification
Controller: Expecting pairing time under 1 minute. (1)Storage reading, verifying, writing, (2)setting configuring, and (3) data retrieving should has a failure rate under 1% response time under 2 second
Storage: storage should not be lost under normal usage User Interface Level: Operation Response under 1 second
LED blinks when devices are successfully paired LED blinks when operation is performed User should be able to find readings from 2 weeks ago unless deleted The user interface application will respond within 1 sec (freezes up to 1 sec)
13
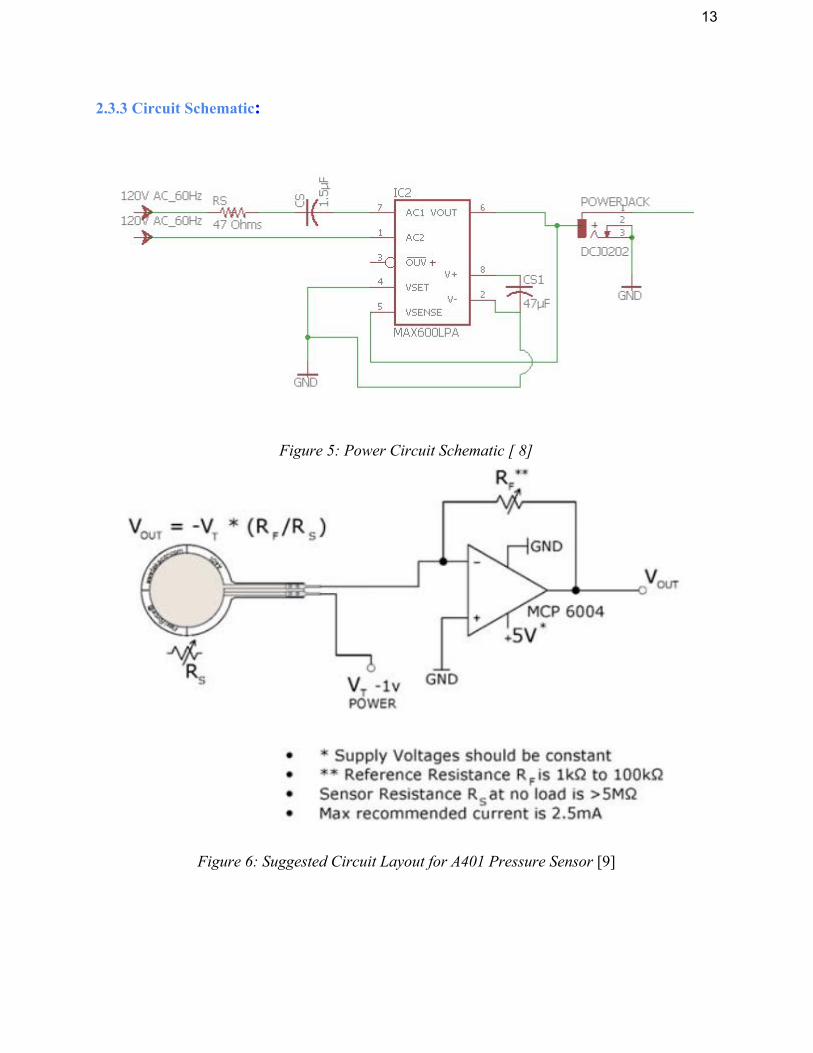
2.3.3 Circuit Schematic:
Figure 5: Power Circuit Schematic [ 8]
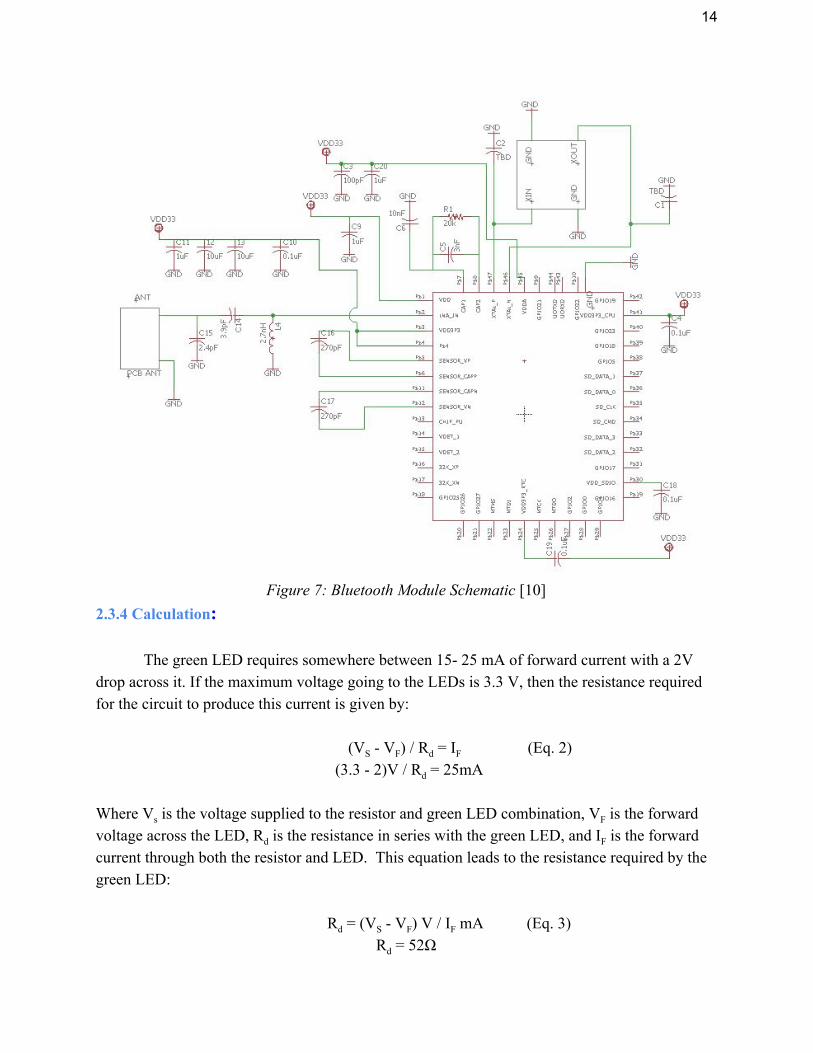
Figure 6: Suggested Circuit Layout for A401 Pressure Sensor [9]
14
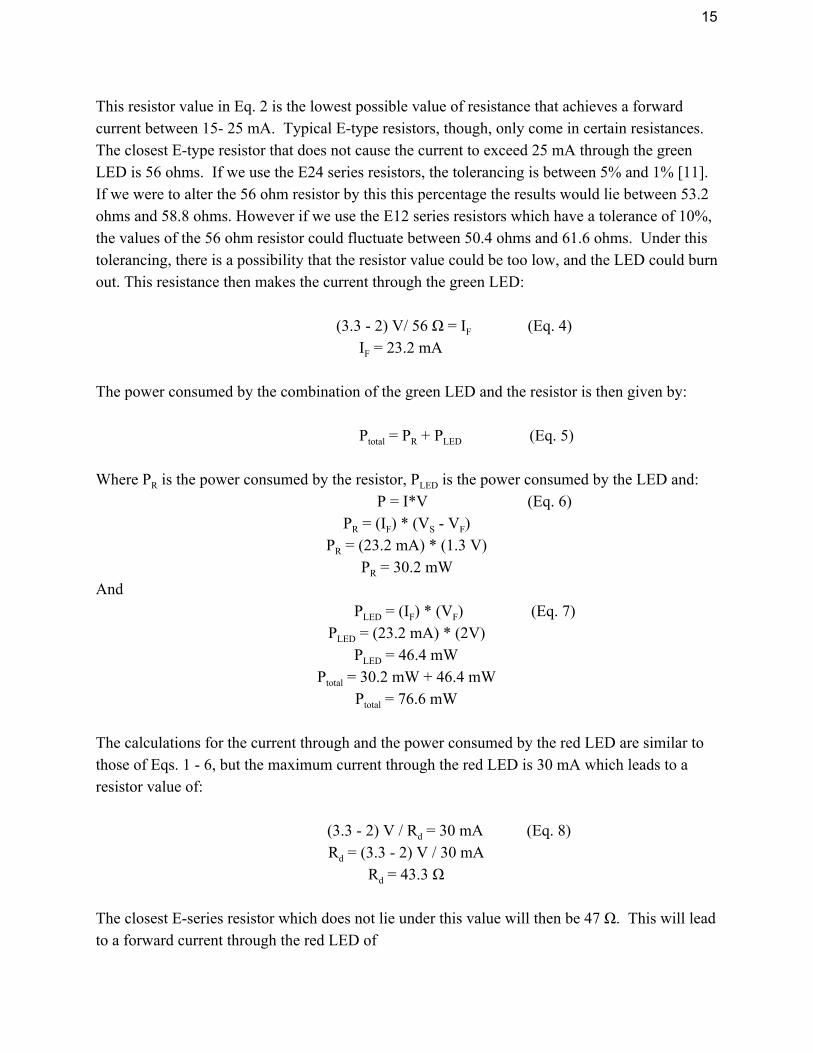
Figure 7: Bluetooth Module Schematic [10]
2.3.4 Calculation:
The green LED requires somewhere between 15- 25 mA of forward current with a 2V drop across it. If the maximum voltage going to the LEDs is 3.3 V, then the resistance required for the circuit to produce this current is given by:
(VS - VF) / Rd = IF (Eq. 2) (3.3 - 2)V / Rd = 25mA
Where Vs is the voltage supplied to the resistor and green LED combination, VF is the forward voltage across the LED, Rd is the resistance in series with the green LED, and IF is the forward current through both the resistor and LED. This equation leads to the resistance required by the green LED:
Rd = (VS - VF) V / IF mA (Eq. 3)
Rd = 52Ω
15
This resistor value in Eq. 2 is the lowest possible value of resistance that achieves a forward current between 15- 25 mA. Typical E-type resistors, though, only come in certain resistances. The closest E-type resistor that does not cause the current to exceed 25 mA through the green LED is 56 ohms. If we use the E24 series resistors, the tolerancing is between 5% and 1% [11]. If we were to alter the 56 ohm resistor by this this percentage the results would lie between 53.2 ohms and 58.8 ohms. However if we use the E12 series resistors which have a tolerance of 10%, the values of the 56 ohm resistor could fluctuate between 50.4 ohms and 61.6 ohms. Under this tolerancing, there is a possibility that the resistor value could be too low, and the LED could burn out. This resistance then makes the current through the green LED:
(3.3 - 2) V/ 56 Ω = IF (Eq. 4)
IF = 23.2 mA The power consumed by the combination of the green LED and the resistor is then given by:
Ptotal = PR + PLED (Eq. 5)
Where PR is the power consumed by the resistor, PLED is the power consumed by the LED and:
P = I*V (Eq. 6) PR = (IF) * (VS - VF)
PR = (23.2 mA) * (1.3 V) PR = 30.2 mW
And PLED = (IF) * (VF) (Eq. 7)
PLED = (23.2 mA) * (2V) PLED = 46.4 mW
Ptotal = 30.2 mW + 46.4 mW Ptotal = 76.6 mW
The calculations for the current through and the power consumed by the red LED are similar to those of Eqs. 1 - 6, but the maximum current through the red LED is 30 mA which leads to a resistor value of:
(3.3 - 2) V / Rd = 30 mA (Eq. 8)
Rd = (3.3 - 2) V / 30 mA Rd = 43.3 Ω
The closest E-series resistor which does not lie under this value will then be 47 Ω. This will lead to a forward current through the red LED of

16
(3.3 - 2) V/ 47 Ω = IF (Eq. 9)
IF = 27.7 mA
Which will lead to:
PR = (IF) * (VS - VF) (Eq. 10) PR = (23.2 mA) * (1.3 V)
PR = 30.2 mW And
PLED = (IF) * (VF) (Eq. 11) PLED = (27.7mA) * (2V)
PLED = 55.4 mW
The data transfer frequency is set to one transfer every hour. The total packet of each hour will contain the readings of the hour. The size of each packet is:
Size packet = Size header +Size payload (Eq. 12) Size packet = (100bit/hours)
+ (60min * 20 cycle/min * 2 count/ cycle *32bit) Size packet = 9.4 MB / hours
The transfer rate is set to 1 communication per hours, so a 8-hour sleep period will contained total data size of :
Size night = # of Cycles * Size packet (Eq. 13) Size night = 8 * 9.4 MB
Size night = 75.2 MB
2.4 Tolerance Analysis
The most important aspect of tolerance in our project is displayed through the pressure sensor. The output value of the pressure sensor must be within 3% of the actual pressure in the breathing tube. The pressure sensor must be calibrated extremely carefully using physical tests (placing weights on it and receiving the correct voltage output) and comparing the voltage output to the J-pipe experiment. For example, if the CPAP machine raises water level in the J-pipe by 8
17
cm, the pressure sensor voltage output should be correspond to a value between 0.11037 and 0.1172 lb-force/(inch^2).
The other part of the analysis is regarding the bluetooth communication. The bluetooth firmware and software set a tolerance of 0~25 hPa to be possible breathing pressure, and reading outside of this range will be treated as data error instead of as CPAP malfunction. As data packet may get corrupted or dropped during the communication, some reading can be missing or obviously out-of-range (e.g. reading of 1000 hPa compared to 5~15 hPa normal range). This incorrect data point will be ruled out for statistics and will notify user that the CPAP device is functioning correctly. This tolerance prevents false alert and reduce false positive rate. Another issue can be address is that the readings reflects a normal situation when the red LED is on. The software tolerance acts as a double safety guard for further investigation. 3 Costs and Schedule 3.1 Cost Analysis
Our fixed development cost is estimated to be $25 per hour and 10 hours of work per week for three people. Our design will take most of the semester (14 weeks).
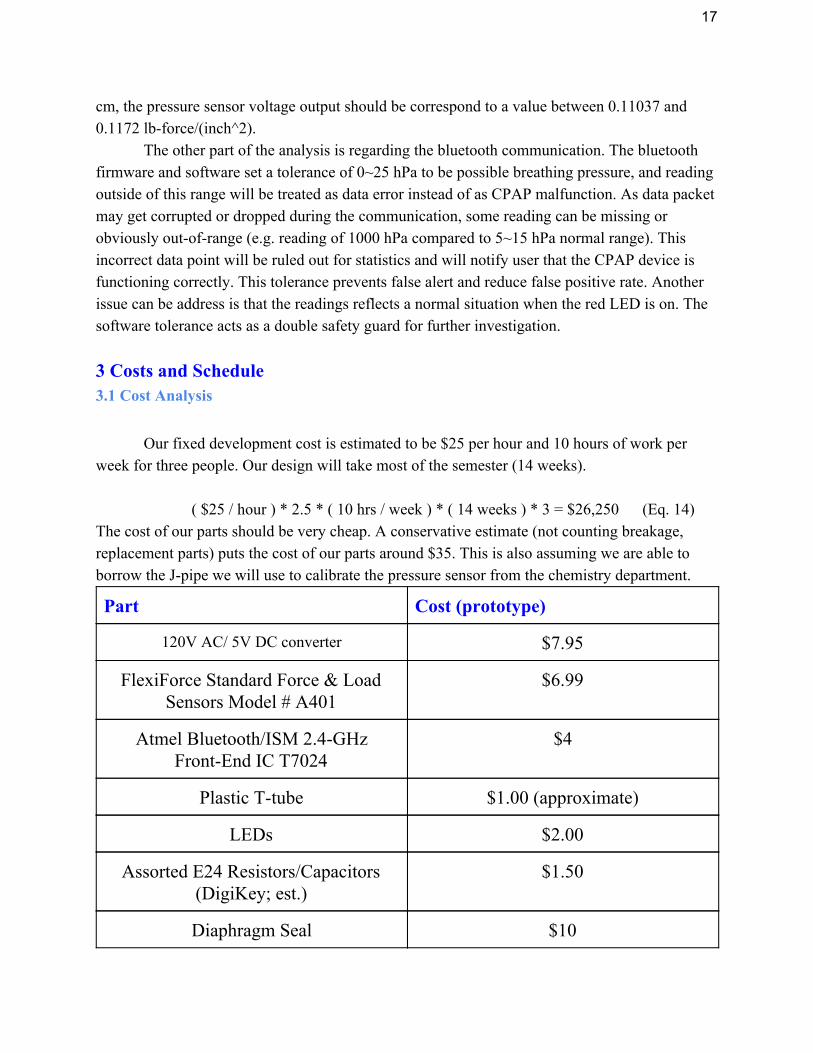
( $25 / hour ) * 2.5 * ( 10 hrs / week ) * ( 14 weeks ) * 3 = $26,250 (Eq. 14) The cost of our parts should be very cheap. A conservative estimate (not counting breakage, replacement parts) puts the cost of our parts around $35. This is also assuming we are able to borrow the J-pipe we will use to calibrate the pressure sensor from the chemistry department.
Part Cost (prototype)
120V AC/ 5V DC converter $7.95
FlexiForce Standard Force & Load Sensors Model # A401
$6.99
Atmel Bluetooth/ISM 2.4-GHz Front-End IC T7024
$4
Plastic T-tube $1.00 (approximate)
LEDs $2.00
Assorted E24 Resistors/Capacitors (DigiKey; est.)
$1.50
Diaphragm Seal $10

18
This places the total development cost of our verification device at $26,285. The expenses will obviously increase if the prototype is popular and we try to market the device. 3.2 Schedule
Week Joe Z. Joe L. Zichong
3/5/17 Practice and review soldering with Joe L.
Order specific parts (make sure they are correct)
Explore software possibilities of bluetooth device
3/12/17 Work on obtaining water J-pipe that will be used to calibrate the transducer
Help fix any problems that arise in testing
Finish writing code that device will run on
3/19/17 Rigorously experiment with calibration of pressure transducer (no faulty readings!)
Rigorously experiment with functionality of bluetooth device
Request PCB, explore optimization opportunities in software/bluetooth device
3/26/17 Begin physical construction of verification device
Make sure sensor satisfies Nyquist rate and detects pressures in the range of 4 to 20 cm H20
Once bluetooth device is functional with correct software, begin working with Joe Z. to attach parts
4/2/17 Ensure verification device and pressure sensor is fully functional
Address power analysis, look for device optimization opportunities
Address and correct unexpected design aspects and flaws
4/9/17 Practice and organize mock demo
Finish building device, make sure it is 100% functional
Give constructive criticism on mock demo, create suggestions for flaws
4/16/17 Begin working on individual part of presentation Begin working on
Begin working on individual part of presentation Begin working on
Begin working on software component part of final demonstration

19
hardware description of final report
introduction, conclusion, safety concerns of final report
Begin working on software description of final report
4/23/17 Finish working on hardware portion of final report
Finish working on non-technical portions of final report, help
Finish working on software portion of final report
4/30/17 Put finishing touches on lab reports, tie separate components together
Make sure all is correct with lab notebook, turn it in
Checkout lab parts, proofread final report
4 Ethics and Safety 4.1 Documentation
There are several safety concerns with the hardware components of the design. Risk analysis is based on the probability of a failure occurring, as well as the magnitude of consequence once a failure does occur. Given these two important parameters, we have deduced that the most important hardware risks our project creates are
(1) Impeding with the functionality of a fully working CPAP machine (2) Moisture from the breathing cycle of the user could cause circuit irregularity/breakdown
We can account for and prevent risk (1) by attaching the pressure sensors carefully and correctly. The wires running to and from the pressure sensors should absolutely not change the designated pressure for each breathing cycle chosen by a robust CPAP machine. Running small wires through the attachable T component of the pressurized tube must have a minimal impact on the change in pressure compared to a tube without wires (or a T attachment) running through it. We can ensure a tight connection by using rubber stoppers and a diaphragm seal around the sensor leg of the T pipe. Since exhaling into a tube will naturally add more humidity into the tube, the circuit elements will have to be kept dry to prevent any shorts from occurring. Parts of the circuit could also be covered in non-permeable material to prevent humid airflow from damaging it. In addition, the tube attachment of the T device will have to be consistent with the rest of the tube to keep the pressure consistent with a normal breathing cycle for the CPAP user. Risk (2) can be accounted for by covering any open wires or circuit parts with water resistant
20
coating (such as rubber). However, we must also ensure that this protective coating does not interfere with the tight seal required and described previously. Our verification device must maintain an accuracy of 3% when measuring pressure.
The application software should not have access to lower level resources of the IC (like power, transmitting control). If the software can cause failure of the IC, this can lead to damage of the verification device and potentially the CPAP. Also, if the software has design flaws that cannot reflect the underperformance of the CPAP machine in some circumstances, the user of the verification can be misguided unknowingly which can cause uncomfortably and undesired sleep experience of the patient and other potential consequences. The main software risk we are concerned with is corrupted data. This occurs because of an unstable connection between the host and the IC during data transmission and data reception. The solution will be to configure IC to buffer readings for a longer period of time for later verification of the data (e.g. resent last few readings with the current reading to the host). This will ensure the host identifies discrepancies. The connection issue of bluetooth module will requires more thorough analysis and controlled environment to identify any possible issue. Simple packets (strings of 0’s or 1’s) or an one-day sample of data can be used in the testing/debugging environment. Then we can start from this working state to implement features.
It is imperative that the verification device does not interfere with the normalized
pressure in the breathing tube. If our design somehow lowers the designated pressure for the tube, it will most likely make the user’s sleep apnea worse instead of better. We must stay focused on our goals for the project. We have to be concerned with the safety and reliability of the verification device, not with finishing the project quickly or turning a profit. The safety of the user is to the utmost importance to us. We intend to follow the IEEE Code of Ethics [12] when building the device. We are mainly concerned with Sections 1 and 3 of the code. We must be honest about the functionality of our verification device. If we are unable to create a tight enough seal around the pressure sensor or the circuit we build is unable to provide the correct data, we must accept the consequence. We understand that designing a device to verify a medical machine bears the possibility of interfering with the machine and the patient’s health. Keeping a CPAP user healthy is of the utmost importance to us. In regard to Section 3, we must be honest in reporting the data our design yields. If our circuit does not function correctly, we must be honest with our findings, even if it means receiving a poor grade in the course.
21
References [1] G. H. Gibbons, “How is Sleep Apnea Treated?,” in National Heart Lung and Blood Institute , Department of Health and Human Services, 2012. [Online]. Available: https://www.nhlbi.nih.gov/health/health-topics/topics/sleepapnea/treatment. Accessed: Feb. 4, 2017 [2] “7 hidden dangers of obstructive sleep apnea,” in WebMD, WebMD, 2016. [Online]. Availabe: http://www.webmd.com/sleep-disorders/guide/understanding-obstructive-sleep-apnea-syndrome#2. Accessed: Feb. 4, 2017. [3] K. Phillips, “CPAP therapy: How it works, getting set up, & results,” in Alaska Sleep Clinic , 2014. [Online]. Available: http://www.alaskasleep.com/blog/what-is-continuous-positive-airway-pressure-cpap-therapy. Accessed: Feb. 5, 2017. [4] “CPAP,” in National Heart, Lung, and Blood Institute , 2016. [Online]. Available: https://www.nhlbi.nih.gov/health/health-topics/topics/cpap. Accessed: Feb. 5, 2017. [5] B. Peters, “Signs Your CPAP Machine is Not Working Antmore to Treat Sleep Anymore,” in Verywell , 2016. [Online]. Available: https://www.verywell.com/signs-your-cpap-is-not-working-3015051 . Accessed: Feb. 7, 2017. [6] B. Warner, Image retrived from “Measure The Quality Of Your Sleep With The Sleep Cycle App”, 2014. [Online]. Available: http://www.bitrebels.com/apps/measure-quality-sleep-cycle-app/. Accessed: Feb. 7, 2017. [7] “Vital Signs (Body Temperature, Pulse Rate, Respiration Rate, Blood Pressure,” in Johns Hopkins Health Library, 2017. [Online]. Available: http://www.hopkinsmedicine.org/healthlibrary/conditions/cardiovascular_diseases/vital_signs_body_temperature_pulse_rate_respiration_rate_blood_pressure_85,P00866/. Accessed: Feb. 24, 2017

22
[8] Maxim Integrated Products, “MAX600LPA2 datasheet, in AllDataSheet.com . [Online]. Available:http://pdf1.alldatasheet.com/datasheet-pdf/view/115714/MAXIM/MAX600LPA2.html. Accessed Feb. 25, 2017. [9] Tekscan, “FlexiForce Standard Model A401,”. [ Online]. Available: file:///C:/Users/PC/Downloads/FLX-%20A401-%20B%20(1).pdf. Accessed: Feb. 24, 2017. [10] Espressif Systems, “ESP-WROOM-32 Datasheet,” 2016. [Online]. Available: file:///C:/Users/PC/Downloads/esp_wroom_32_datasheet_en%20(1).pdf [11]“Standard Resistor Values,” in Resistor Guide , 2017. [Online]. Available: http://www.resistorguide.com/resistor-values/ [12] IEEE Code of Ethics [Online] Available: http://www.ieee.org/about/corporate/governance/p7-8.html Accessed: Feb. 8, 2017.