cozzoli, f., smolders, s., eelkema, m., ysebaert, t ... · this paper presents a case study showing...
TRANSCRIPT

This is a postprint of: Cozzoli, F., Smolders, S., Eelkema, M., Ysebaert, T., Escavarage, V., Temmerman, S., Meire, P., Herman, P. & Bouma, T. (2016). A modeling approach to assess coastal management effects on benthic habitat quality: a case study on coastal defense and navigability. Estuarine, Coastal and Shelf Science, 184, 67–82 Published version: dx.doi.org/10.1016/j.ecss.2016.10.043 Link NIOZ Repository: www.vliz.be/nl/imis?module=ref&refid=281487
[Article begins on next page]
The NIOZ Repository gives free access to the digital collection of the work of the Royal
Netherlands Institute for Sea Research. This archive is managed according to the principles
of the Open Access Movement, and the Open Archive Initiative. Each publication should be
cited to its original source - please use the reference as presented.
When using parts of, or whole publications in your own work, permission from the author(s)
or copyright holder(s) is always needed.
A modeling approach to assess coastal management effects on benthic habitat quality: a case study
on coastal defense and navigability
Francesco Cozzoli1,*, Sven Smolders2,3, Menno Eelkema4,, Tom Ysebaert1,5, Vincent Escaravage1, Stijn
Temmerman2, Patrick Meire2, Peter M.J. Herman1, Tjeerd J. Bouma1
1 Netherlands Institute of Sea Research (NIOZ), P.B. 140, 4401 AC Yerseke, The Netherlands
2 Ecosystem Management research group, University of Antwerp, Universiteitsplein 1, 2610 Wilrijk,
Belgium
3 Flanders Hydraulics Research, Berchemlei 115, 2140 Antwerp, Belgium
4 Delft University of Technology (TU Delft), Stevinweg 1, 2628 CN Delft, The Netherlands
5 Wageningen University, Institute for Marine Resources and Ecosystem Studies (IMARES), P.B. 77,
4401 NT Yerseke, The Netherlands
*Corresponding author: E-mail: [email protected]; [add telephone at proof]; present
address: DiSTeBA, Centro Ecotekne, S.P. Lecce-Monteroni, 73100 Lecce, Italy
Abstract
The natural coastal hydrodynamics and morphology worldwide is altered by human interventions such as
embankments, shipping and dredging, which may have consequences for ecosystem functionality. To
ensure long-term ecological sustainability, requires capability to predict long-term large-scale ecological
effects of altered hydromorphology. As empirical data sets at relevant scales are missing, there is need
for integrating ecological modeling with physical modeling. This paper presents a case study showing
the long-term, large-scale macrozoobenthic community response to two contrasting human alterations of
the hydromorphological habitat: deepening of estuarine channels to enhance navigability (Westerschelde)
vs. realization of a storm surge barrier to enhance coastal safety (Oosterschelde). A multidisciplinary
integration of empirical data and modeling of estuarine morphology, hydrodynamics and benthic ecology
was used to reconstruct the hydrological evolution and resulting long-term (50 years) large-scale
ecological trends for both estuaries over the last. Our model indicated that hydrodynamic alterations
following the deepening of the Westerschelde had negative implications for benthic life, while the
realization of the Oosterschelde storm surge barriers had mixed and habitat-dependent responses, that
also include unexpected improvement of environmental quality. Our analysis illustrates long-term trends
in the natural community caused by opposing management strategies. The divergent human pressures on
the Oosterschelde and Westerschelde are examples of what could happen in a near future for many global
coastal ecosystems. The comparative analysis of the two basins is a valuable source of information to
understand (and communicate) the future ecological consequences of human coastal development.
Keywords: Estuary, Macrozoobenthos, Hydrodynamic Modeling, Species Distribution Modeling, Coastal
Management
1 Introduction
Estuaries and coastal embayments are a preferential habitat for humans (Small & Nicholls, 2003),

thereby causing major alterations to the sea-scape. Firstly, the increase in coastal populations, in
combination with sea level rise and increasing intensity of extreme storms, is bringing a large part of the
world’s human population under the threat of coastal storm surges (McMichael et al., 2006). This has led
to the still ongoing realization of a high number of dams, embankments and storm surge barriers in the
richest countries (Fig. 1). With the growing prosperity of developing countries (where most of the
endangered population lives) these measures will likely be more commonly adopted worldwide
(Temmerman et al., 2013, Perkins et al. 2015).
Secondly, waterways have for centuries played an important role in trade, causing civilizations to
develop in delta areas with good direct access to both the sea and the land behind. Nowadays, the
handling capacity of estuarine ports is a crucial factor for the economic development (Halpern
et al., 2008). The continuously growing global trade network and the ongoing increase of the commercial
ships are pushing toward a more intensive dredging of the waterways to the harbors (Fig. 1). The global
dredging market increased by nearly threefold over the past decade from $ 5.3 bn in 2000 to $ 14.7 bn in
2011, according to the International Association of Dredging Companies.
Due to anthropogenic needs, wet infrastructures are so ubiquitously diffused that they have been
proposed as a main driver of change in coastal environments (Bulleri & Chapman, 2010). Dams,
embankments and storm surge barriers provide coastal protection by damping the tidal energy. In
contrast, the deepening of estuarine beds often facilitate the inland penetration of seawater, leading to a
landwards increase of the tidal energy (Stive & Wang, 2003). In both cases, the ecological implications
can be large, and should be taken into account for development plans (Nienhuis &
Smaal, 1994; Swanson et al., 2012, Nordstrom 2014, Perkins et al. 2015). It is well known that
hydrodynamic forces and their morphodynamic consequences structure estuarine life (Snelgrove &
Butman, 1994; Ysebaert et al., 2003, Cefali et al. 2016). Alterations of the eco-hydro-morphological
environment can have negative, or even catastrophic, social consequences when they affect essential
ecological services (Adger et al., 2005; Danielsen et al., 2005; Diaz et al., 2006, Perkins et al. 2015).
Distribution patterns and shifts can be assessed using Species Distribution Models (SDMs), which are
statistical tools that combine observations of species occurrence or abundance with environmental
variables (Elith and Leathwick, 2009). The application of SDMs in assessing the distribution of marine
species has increased considerably in the last years as a tool for ecosystem management and marine
spatial planning (reviewed in Robinson et al., 2011; Reiss et al., 2015)
Despite this, there are several challenges associated with the study and prediction of complex alterations
of the eco-hydro-morphological environment. A first challenge is related to the large internal
heterogeneity of coastal environments. Estuaries and embayments are indeed characterized by strong
gradients in depth, salinity, current velocity, sediment composition and other factors (McLusky and
Elliott, 2004, Morais et al. 2016, Trancart et al. 2016). A management strategy at the scale of the system
may lead to strong spatial divergence in response, where different subhabitats are affected in very
different ways (Cozzoli et al. 2013). Secondly, it is not an easy task to forecast long-term

morphodynamics (Lesser et al. 2014), neither to translate morphodynamic conditions into habitat
suitability (Cozzoli et al. 2014). Non-linear dynamics, unaccounted variables and unexpected features
that can arise as the system develops, and the assumption behind physical and ecological expectations
can be mismatched. Thirdly, extensive data series of field collected observations, inclusive of both
hydromorphological (e.g. elevation, current velocity, granulometry, salinity) and biological (e.g.
abundance and composition of ecological communities) measurements, are virtually never available with
an extent that is relevant compared to the morphodynamic scales (decades, De Vriend et al., 2011). This
reduce the possibility to fit and field-validate predictive models.
Despite the large uncertainty in predicting the environmental consequences, the realization of new
coastal infrastructure is an unrestrainable need of human society (Temmerman et al. 2013, Nordstrom,
2014, Perkins et al. 2015), and the infrastructures design must attempt to account for ecological aspects.
Presently, incomplete knowledge of ecological impacts undermines predictive management that would
otherwise allow for appropriate spatial planning in coastal infrastructure design (Perkins et al. 2015). In
this perspective, the study of existing anthropogenically modified ecosystems is a precious source of
information to support adaptive management and future decisions (Folke et al., 2004; Matthews
et al., 2011).
In this paper we hence focus on the ecological effects of contrasting hydrodynamic modifications of two
adjacent estuarine habitats subject to large-scale infrastructural works. For this purpose, the neighboring
Westerschelde and Oosterschelde estuaries (Dutch Delta, SW Netherlands, Figure 2) are an ideal model
system. The two basins share a common location, origin and regional pool of macrozoobenthic species
(Cozzoli et al., 2013). To a large extent, they had similar hydrodynamic characteristics until
approximately 50 years ago, but in the meantime they have undergone very different anthropogenic
modifications. Coastal safety is a prominent issue in both sites, but, due to different navigability
requirements, two radically different approaches were followed to achieve this goal. The Oosterschelde
was partially embanked by a storm surge barrier. The Westerschelde, due of its importance as shipping
route to the port of Antwerp, kept an open connection with the sea. In this basin, coastal safety is ensured
by heightening and strengthening the dikes along the estuary. In recent decades the Westerschelde was
extensively dredged to allow the transit of larger vessels (Figure 2).
We investigated the long-term effect of the habitat alterations for an important part of the estuarine
natural community: the macrozoobenthos. Macrozoobenthic organisms are a central component within
the estuarine food webs (Herman et al., 1999) and they can affect biogeochemical cycles on a global
scale (Heip et al., 1995). Distribution models of macrozoobenthos communities are useful tools to detect
anthropogenic impacts at the ecosystem level (Robinson et al. 2011, Reiss et al. 2015).
While most macrozoobenthic communities studies focus on local/short term disturbances (e.g. bottom
disruption, increase turbidity, resuspension of pollutants, see Short & Wyllie-Echeverria 1996), we
compared the benthic habitat suitability before (1960) and after (2010) the major infrastructural works.
Despite these two basins being intensively monitored during recent decades, the amount of field –

collected biological observations is insufficient to directly reconstruct the benthic community evolution.
Hence we integrated hydrodynamic and ecological modeling to investigate the effects of
morphological/hydrodynamic alterations on a whole-basin scale, over a time span that is relevant
compared to intrinsic morphodynamic time scales.
We are fully aware that by combining hydrodynamic model with community models, we increase the
level of uncertainty relative to what could be obtained from long-term monitoring series (Reiss et al.
2015). However, given the major hydrodynamic and morphological alterations in both these estuaries,
such modeling approach should be able to reveal the dominant trends.


2 Material & Methods
2.1 Study area
The present-day geomorphology of the SW Netherlands is the result of the interplay between natural
processes and large-scale human interference that dates back at least two millennia. From the Middle
Ages onwards, land reclamation led to a gradual separation between the Oosterschelde and the
Westerschelde. The Oosterschelde was definitively cut off from the Schelde river in 1897. Following the
disastrous North Sea flood of 1953, a massive system of coastal defense was implemented (Delta Works,
1959-1987). The Oosterschelde was isolated from the other connecting basins by the construction of two
back-barrier dams in 1965 and 1969. This reduced freshwater input from the river Rhine from 70 m3 sec-
1 to a neglectable level (Nienhuis & Smaal, 1994). In the subsequent years, the basin was partially closed
off from the sea by a storm surge barrier, the Oosterscheldekering, finalized in 1986 (Figure 2). It is
placed between the islands Schouwen-Duiveland and Noord-Beveland, is the largest (9 km of total
length) of the 13 ambitious Delta Works series of dams and storm surge barriers. In normal conditions,
the Oosterscheldekering is kept open and therefore allows tidal exchange and preserve marine life and
shellfisheries, but it can be closed to prevent storm surges to flood the hinterland. Despite its relatively
open nature, the barrier has reduced the tidal prism (i.e., the water volumes exchanged by the tide) of the
Oosterschelde by approximately 30%. Current velocities have declined by 20-40% (Louters et al., 1998).
Sand exchange with the North Sea through the barrier is not possible due to the development of
secondary currents. The new situation is thus characterized by channels that are too large for the tidal
prism, which show a tendency to fill in. As this filling cannot be fed with sand from outside the tidal
basin, sand is eroded from the tidal flats inside the basin and deposited in the channels. The new
condition has amplified a pre-existent erosive trend in the tidal flats (Eelkema et al., 2012), to a degree
where total disappearance of tidal flats in the system is predicted within less than one century
(Jongeling, 2007).
The Westerschelde kept an open connection to the sea and to the Schelde river, and still has a full salinity
gradient. Dredging in the Westerschelde started at the beginning of the past century, but has strongly
intensified after the 1960s as a consequence of the growth of ship transit and draft. From 6.5 to 7 Mm3 of
sediment are currently annually dredged to maintain the shipping lane (Figure 2). The Netherlands and
Belgium agreed in 2005 to further dredge the Westerschelde to allow container ships with a draft of up to
13.1 m to reach the port of Antwerp. Sediment extraction is very limited and by far most dredged
sediments are disposed again within the estuary. Enlargement of the channels and amplified tidal range
generated an increase in tidal currents of ca. 30% (since 1955) and altered the mixing patterns between
fresh and salt water (Smolders et al., 2013, 2012).
2.2 Forecasting long-term macrozoobenthic responses to hydromorphological habitat alterations
The Westerschelde – Oosterschelde system, given its large ecological, economical and social importance,
has been intensively monitored for decades. Empirical reconstructions of bathymetry and hydrodynamic

forcing for a situation before major anthropogenic changes are available for both systems. Similar
datasets exist for present-day situations. Well-calibrated hydrodynamic models have been made for both
systems and are the basis for our predictions of benthic habitat suitability. Extensive monitoring
programmes of macrobenthic fauna have been executed over the past 50 years, with most effort
concentrated in the last 20 years.
Despite the large effort, field observations are intrinsically not sufficient to exhaustively and
quantitatively reconstruct the changes undergone the Westerschelde - Oosterschelde benthic ecosystem
during recent decades. We bridge this gap by multidisciplinary integration of empirical data and
modeling of estuarine morphology, hydrodynamics and benthic ecology. Furthermore, we combine
macrozoobenthic observations with the results of hydrodynamic models to construct distribution models
that can predict changes in community performances as response to environmental changes
(Franklin, 2010; Pearson & Dawson, 2003; Sinclair et al., 2010).
2.2.1 Hydromorphological variables
In order to reconstruct the impact of the last 50 years of basin hydrodynamic management on the
macrozoobenthos, we considered the induced changes in (yearly averaged) maximal tidal current
velocity (maximal values reached during a full tidal cycle, m s-1), inundation time (% of time for which
the site is submerged during a full tidal cycle), average salinity (Practical Salinty Scale, PSS) and salinity
range (Δday PSS). These variables are known to be among the most important hydrodynamic variables in
determining the benthos distribution in estuaries (Ysebaert et al., 2003, 2002, Cefali et al., 2016, Philippe
et al. 2016, Trancart et al. 2016), but they are rarely measured with full spatial coverage, such that they
are known for all sample locations. Hydrodynamic models can fill these gaps as they can describe water
motion and salt transport, given a bathymetry and appropriate boundary conditions. In this study, we
used recently validated hydrodynamic models to simulate the Oosterschelde (i.e., Delft-3D) and
Westerschelde (i.e., 2Dh TELEMAC) present and past hydrodynamic scenarios (Figure 3). It is noted
that from a hydrodynamic modeling perspective, it is not ideal to use 2 different models for both
estuaries. However, our question is ecological, using the physical model to describe an independent
driver. Given the large differences in hydrodynamic and morphological development of both estuaries,
we regard it sufficient to have for each estuary a calibrated and validated physical model description,
even though they are obtained by competing software. Furthermore, the two variables accounted from
both hydrological models (inundation time and tidal current velocity) are typically those ones for which
the model reliability is highest and the calibration with field-collected values the most accurate (Lesser
et al., 2004, Moulinec et al., 2011, Smolders et al., 2013).
For the Oosterschelde, two scenarios, one for 1968 and one for 2010, are used in this study. These
scenarios were modeled with a specific application of Delft3D (Lesser et al., 2004) called the KustZuid-
model. The resolution of the grid varies from more than 2000 m at the seaward boundary to around 100
m at the Eastern Scheldt Inlet. This model application and its calibration are thoroughly described in
Eelkema et al. (2012). The Westerschelde scenarios for 1955 and 2010 were modeled with 2Dh

TELEMAC (Moulinec et al., 2011). This model has a resolution up to 40 m in the intertidal zone. It
accounts for salt transport, making it particularly appropriate for distribution modeling of estuarine
species (Smolders et al., 2013). In all modeled scenarios, wave forcing was omitted because we primarily
focused on areas that are tide-dominated.
The scenarios for the Westerschelde in 1955 and the Oosterschelde in 1968 represent the hydrodynamic
characteristics of the basins before the recent major anthropogenic alterations by dredging, embanking
and damming. Salinity models for the Oosterschelde basin are not available. However, the lack of a
proper salinity gradient and the limited variation between years in the Oosterschelde (Haas, 2008) make
this variable not particularly valuable for our purpose. Thus, we have not included the role of the
(limited) freshwater input from the Volkerak in the Oosterschelde 1968 scenarios. As a further
precaution, we excluded the Northern Branch area (directly connected to the Volkerak, thus the most
influenced from salinity variations) from the analysis. Both Oosterschelde scenarios were modeled with a
constant salinity (30) and no salinity range. For simplicity, in the rest of the paper we will refer to the
Westerschelde 1955 and the Oosterschelde 1968 scenarios as 1960 scenarios.
While we compared the 1960 and 2010 scenarios only, several year-scenarios have been used to calculate
the hydrodynamic conditions of the Oosterschelde sampling stations. Sufficient bathymetry data for the
Oosterschelde basin were available for the years 1968, 1983, 1988, 1993, 2001, 2007 and 2010 and were
used to characterize sampling observations collected from one year earlier to one year later the modeled
year. The Storm Surge Barrier, Philipsdam, and Oesterdam (Figure 2) were excluded from the 1968 and
1983 simulations, and included in the simulations for the years after 1986. For the Westerschelde, given
that long data series are not available like for the Oosterschelde (Appendix Table A 1), only the 2010
scenario was used to extract environmental conditions for the samples collected in the period 2007-2011.
2.2.2 Ecological variables
Benthic community response to altered hydrodynamics was expressed in term of changes in potential
macrozoobenthic biomass (g Ash Free Dry Weight (AFDW) m-2), abundance (N. of individuals m-2), per
capita body size (biomass divided by the abundance of individuals, mg AFDW) and Shannon’s diversity
(H). The data used in the present study have been extracted from the Benthic Information System (BIS
version 2.01.0) hosted by the NIOZ research center in Yerseke (NL). The BIS database contains about
500000 distribution records about more than 2500 species of all major benthic classes that were collected
over 6484 sampling episodes since 1960 mostly in the Delta region (SW Netherlands).
Data collection was mainly carried out in spring and autumn. In the Westerschelde samples were
randomly collected within four depth strata mainly from 2007 (Appendix Table A 1). A longer sampling
series is available for the Oosterschelde, where the large majority of data were collected by repeated
sampling of the same sites across years in similar depth strata as used for the Westerschelde sampling
(Table A 1). In both basins, 25% of the records come from intertidal sites, 50% of the records were
collected above a depth of 5 m NAP (Normaal Amsterdams Peil, the Dutch height datum, 0 m NAP =

mean sea level in Amsterdam) and 95% above 20 m NAP. The intertidal locations were mostly sampled
by using handcorers pushed 20 to 30 cm in the sediment with a total sampling area between 0.005 and
0.045 m-2 (on average 0.019 m-2). The subtidal locations were on some occasions sampled by using Van
Veen grabs with a sampling area of 0.1 or 0.2 m2 and a penetration depth around 15 cm depending upon
the nature of the sediment. In most other cases the subtidal samples consist of subsamples with an
average sampling area of 0.023 m-2 that were taken by using handcorers pushed 20 to 30 cm in the
sediment contained in the bucket of a boxcorer after landing on the ship deck. Approx. 95% of the
samples have similar characteristics regarding the sediment penetration and the sampling area. Slightly
lower density (because of deep living organisms not caught with the Van Veen grab) in the Van Veen
samples compared with the handcorer samples have not been taken into account within the present
analysis. In order to reduce bias related to approximation in the bathymetric maps used for the
hydrodynamic models, we discarded from analysis 974 observations for which there was a difference of
more than 25 cm between the measured-at-sampling and the modeled bathymetry. These observations,
while cannot be directly used to fit and validate the SDMs, are still useful to partially reconstruct the
benthic community trends during recent decades. Therefore they were not excluded from Figure A2. A
final subset of 5510 (2272 Westerschelde; 3238 Oosterschelde) samples collected from 1962 to 2011 was
selected for further analysis.
2.2.3 Predicting benthic communities: quantile regression models
Spatial distributions of organisms are often the product of different constraints acting at different scales
(Thrush et al., 2005, Morais et al., 2016). Even when one or more (known) environmental factors are not
limiting, other (unknown) factors might be and organisms could be absent or limited to a low abundance.
As a result, observed distributions tend to be scattered below an upper boundary rather than around a
central, average value. Central estimators are not able to account for the variance-mean relationship. In a
regime of limitation by subsidiary factors (high prevalence of zero observations along the entire
gradient), they are not representative of the higher densities and they may fail to distinguish real non-
zero changes (Cade & Noon, 2003; Terrell et al., 1996).
The quantile regression model (Koenker & Basset, 1978; Koenker & Machado, 1999; Koenker &
Hallock, 2001; Koenker 2005) can solve this problem. This method aims at fitting any desired quantile of
a response variable distribution to an independent variable by solving a minimization problem of the
absolute errors. Regression quantile estimates can be used to construct predictions without assuming any
parametric error distribution and without specifying how variance heterogeneity is linked to changes in
means. The possibility to fit the regression on each possible distribution quantile, allows to represent the
heterogeneity in the response variable that commonly occurs in ecological processes when only a subset
of the relevant variables that may be limiting have actually been measured and incorporated into the
models (Cade & Noon, 2003; Koenker, 2005; Cozzoli et al., 2013). In the case of the biomass or
abundance distribution, a model of the higher quantiles of the distribution represents the expected
response when (unmeasured) disturbance is at a local minimum (Anderson, 2008; Cade & Noon, 2003);

the succession of the underlying quantiles represents the response at increasing level of (unmeasured)
disturbance.
Forecasting the habitat potential for the organism, rather than its realized performance, models of upper
quantiles give an estimation of habitat suitability (Cade & Noon, 2003; Downes, 2010). In nature
conservation and management, habitat suitability is often preferred as a descriptor over realized
performances, because it fluctuates less in time (Degraer et al., 2008). The 95th quantile is a good
compromise for an upper quantile that can be estimated fairly well with reasonable precision with fairly
large samples sizes (Anderson et al 2008) and have already been prove to be able to accurately forecast
the habitat suitability for macrozoobenthic species (Anderson, 2008; Cozzoli et al., 2013, 2014). For this
reason, in this paper we focus mostly on the benthic community responses predicted from the upper
(95th) quantile of the distribution. To have a more complete overview of the changes occurred in the two
basins, we also investigated the response of sub-optimal distributional quantiles (e.g. 25th, 50th and 75th).
In this study, the used (known) explanatory variables are the maximal flow velocity (maximum of a full
tidal cycle, m sec-1, wave forcing was omitted because we primarily focused on areas that are tide-
dominated), inundation time (% of time submerged during a full tidal cycle), daily averaged salinity
(Practical Salinity Scale, PSS) and salinity range (Δday PSS). We choose these variables because of 1)
they are known to be among the most important hydrodynamic variables in determining coastal and
estuarine benthos distribution (Snelgrove & Butman, 1994; Snelgrove et al., 1994; Ysebaert et al., 2002);
2) large scale scenarios are available from hydrodynamics models, thus they can be used to extrapolate
species distribution models prediction on a whole basin scale; 3) hydrodynamic models can provide
scenarios for different periods of the ecosystem evolution, allowing historical time comparisons (like in
the present work) and forecasts about future ecosystem development (e.g. Smolders et al. (2013)), and 4)
in our particular study case, variations in hydrodynamics due to human landscape alterations are known
to be the main source of habitat changes in recent decades (De Vriend et al., 2011; Louters
et al., 1998; Smolders et al., 2013). While other variables have proven to contribute to the prediction of
benthic community distribution (e.g., turbidity (Akoumianaki & Nicolaidou, 2007), primary production
(Smith et al., 2006), organic matter (Verneaux et al., 2004), mean sediment grain size and mud content
(de la Huz et al., 2002; Degraer et al., 2008; Snelgrove & Butman, 1994; Snelgrove et al., 1994; van der
Wal et al., 2011, Philippe et al. 2016), the upper boundary modeling approach we used permits an
extrapolation of the habitat response to the targeted hydrodynamic variables.
For any community response variable (macrozoobenthic biomass, abundance, per capita body size and
Shannon diversity), quantile regression models were fitted (and validated, see Appendix) on the overall
dataset (i.e. Westerschelde + Oosterschelde data), until its third-degree interaction terms. Given that our
aim was to describe the community parameters and their variation on spatial and temporal scales, rather
than to investigate the significance of single explanatory variables, we did not use any model
simplification procedure (e.g. stepwise regression). To assess the validity of our forecasts, we rely on the
good performance of the models in predicting the higher observed values of the overall dataset (pseudo-

validation procedure and results in Appendix). The so obtained distribution models were applied to the
abiotic scenarios and used to produce whole basin habitat suitability maps for the years 1960 and 2010.
Differences between the predicted scenarios (Appendix, Figures A 8 & A 9) were expressed in terms of
absolute change in potential benthic communities performances. All analyses were performed with R (R
Development Core Team, 2011).
3 Results
The fitted 95th quantile benthos distribution models (Tables A 2 - A 5) were successfully validated
(Figure A1). The habitat suitability for the analyzed benthic community descriptors show large variations
at the variation of the covariance structure between environmental factors (Figure A 3 - A 6).
Macrozoobenthos overall biomass (Figure A3) individual size (Figure A 5) and species diversity (Figure
A 6) are potentially higher in the intermediate intertidal at marine salinity. Freshwater inputs and
increased salinity range reduce the habitat potential for these three community descriptors. The
individual density (Figure A2) can potentially peak in the upper brackish intertidal, at low current
velocity and high salinity variation. This pattern is related to the few, small-sized, opportunistic species
that occasionally occur at very high densities in organic-rich sediments.
In the 1960 scenario, the current velocities of the Westerschelde and Oosterschelde were in the same
range (Figure 3 A). Following the widening and deepening of the channels in the Westerschelde, the
hydrodynamic model predict non-surprisingly, that the tidal current velocities increased in channels and
on shores, (Figure 3 A) but not on the top of mudflats, that have become more elevated, reducing their
inundation time (Figure 3 B). This change in the Westerschelde hydrodynamics also modifies the mixing
patterns of the freshwater and saltwater masses, enabling saline water to intrude further upstream (Figure
3 C) and increasing the daily salinity variation at the marine and riverine extremes of the estuary (Figure
3 D). The benthos distribution model predicts that such increased current velocity and salinity range
(Figure 3) caused the Westerschelde subtidal benthic communities to reduce their potential biomass,
density, individual body size and species diversity along almost the whole basin (Figure 4). The
increased elevation caused reduced inundation time, which became according to our benthos distribution
model is a limiting factor for the macrobenthos in the intertidal (Figures A3 - A6). As a result, the
macrobenthos at the elevated tidal flats and the sub-tidal areas with stronger hydrodynamics evolved
towards smaller individual size (Figure 4 C), but potentially higher abundances (Figure 4 B), as it is
typical for opportunistic and stress-tolerant macrozoobenthic species.
Following the construction of the storm-surge barriers in the Oosterchelde, the hydrodynamic model,
non-surprisingly, predicts a strong decrease in current velocities, especially in the channels (Figure 3 A).
The benthos distribution model predicts that such dampening of tidal current velocities had a strong
positive effect on the subtidal habitat suitability in terms of biomass (Figure 4 A). Our forecasts also
show that the increase in biomass was related to potentially larger individual body sizes (Figure 4 C),
rather than increased abundance (Figure 4 B). At present, the inundation time of the Oosterschelde
intertidal flats is slightly higher than in the 1960’s (Figure 3 B), inducing a limited decrease in intertidal

macrozoobenthos density. This trend is most pronounced at the edges of the tidal flats (Figure 3 B and 4
B). Lower distribution quantiles show responses similar to the 95th one, confirming the overall decrease
in habitat value of the Westerschelde and the increase of the Oosterschelde (Appendix A9-A12).
4 Discussion
This study shows that following fundamentally different management options may entail long-term
morphological and hydrodynamic alterations of the ecosystem, with consequences for benthic
community. The enhanced hydrodynamics following deepening of the Westerschelde (Figure 3) had
negative implications for benthos (i.e., reduced subtidal habitat suitability, turnover toward opportunistic
species in the intertidal habitat, Figure 4). In contrast, the attenuation of hydrodynamics by creating a
storm surge barrier in the Oosterschelde (Figure 3), caused mixed and habitat-dependent responses that
also include improvement of environmental quality (i.e. a strong increase in subtidal habitats quality
Figure 4). Despite the level of uncertainty inherently due to combining hydrodynamic model with
community models, this multidisciplinary integrative approach allowed us to provide insight in the long-
term trends in the natural community caused by these opposing management strategies.
The approach we followed (extrapolation over past scenarios of ecological relationships mostly modeled
on present conditions) intrinsically assumes that the relationships between the hydromorphological
variables and benthos must be constant pre- and post-impact and the same for Oosterschelde and
Westerschelde. There are insufficient observations to fully model the relationships in the pre-impact
habitat conditions, or to fully validate the model predictions with respect to pre-impact benthic
observations only (especially for the subtidal environment, Table A1). The validity of this assumption
and the reliability of our forecast are supported by: i) while with a different spatial distribution, the two
basins and the different time-scenarios shares a common pool of species (Ysebaert et al. 2003, Cozzoli et
al. 2013) so we can expect the physiological and ecological responses of the benthic community to the
habitat conditions are similar across scenarios; ii) while the two basins faced relevant changes following
opposite evolution trajectories, they still present a broad range of environmental conditions. Some
portion of the present-day scenarios resemble the pre-impacted conditions (e.g. part of the present marine
Westerschelde is similar to the pre-impact Oosterschelde and vice-versa) and can be used to model the
benthic community spatial distribution as it was in the past; iii) modeling the upper quantile of the
benthic community response should allow focusing on the response to the targeted environmental
variables, rather than on the effect of subsidiary limiting factors (see Anderson 2008) that may have
varied during recent decades and are not the object of this analysis. Moreover, the alteration of the
hydrographic features we investigated are known to be among the most relevant environmental change
occurred in both basins; iv) the extrapolation of ecological relationships modeled on present conditions is
widely used and accepted when forecasting future ecological scenarios, for which observations to
validate the model outputs are not available (see Reiss et al. 2015). Future environmental scenarios were
also recently used to predict distribution shifts of marine benthic species (Cheung et al., 2012, Jones et
al., 2013, Weinert et al. 2016). Usually, this kind of models are limited in their application to shallow

benthic habitats due to the less-predictable effects of changes in local hydrodynamics and bottom
topography (Reiss et al. 2015). This is not so in our case, where much (modeled) information about the
scenarios hydrography and bathymetry are available.
The internal reliability of our forecast is confirmed by the good performance scored by the models in the
pseudo-validation test (Figure A 1). The sensitivity analysis of the model (Figure A 3 - A 6) indicates
that uncertainties that may follow from combining hydrodynamic model with community models do not
result in unrealistic results, as many of the modeled patterns are in line with what may be expected from
a priori knowledge on benthic community distributions. The analysis of lower distributional quantiles
(Figures A9-A12) confirm that changes in habitat suitability (expressed from the 95th quantile model)
had an effect also on communities on sub-optimal conditions and led to a generalized change in benthic
community performances. Shallow, marine embayments such as the Oosterschelde are usually
characterized from high intertidal biomass and richness (McLusky and Elliott, 2004). As such, we predict
a higher potential for macrozoobenthic biomass and per capita body size in the intermediate intertidal at
high salinity (Figure A 3). In our study area, this is a typical habitat for larger filtrators such as
Cerastoderma edule and Scrobicularia plana (Coosen et al., 1994; Kater et al., 2006). Very high
abundances of individuals can potentially occur in the brackish part of the estuary (as predicted in
Figure A 4), usually determined from small opportunistic organisms such as Heteromastus filiformis
(Degraer et al., 2006). Salinity variations are known to be a major source stress for estuarine benthic
community (Day et al., 1989). Modeled response surfaces shows that it has a detrimental effects on all
community parameters. The lower biomass and richness values predicted for the Westerschelde
(Figure 4) are likely to be related to freshwater inputs and salinity variations. Our analysis highlights the
fact that the increase of tidal current velocity and the amplification of the salinity range were an
additional source of stress for the benthic community. Observed trends in benthic community descriptors
confirm model outputs for the Oosterschelde (Figure A 2). Insufficient early observations are available
for the Westerschelde to be directly compared with model predictions (Table 1). However, records from
Wolff (1973), in agreement with our forecasts, suggest that benthic organisms were more widely
distributed in the subtidal than in later years.
Because of the importance of the individual body size for many individual and community traits, (Brown
et al., 2004; Marquet, 2002), the predicted changes in potential per capita size of benthic organisms
(Figure 4 C) can have profound effects across multiple scales of biological organization. The decrease in
potential species diversity and body size, as predicted for the Westerschelde, can be detrimental for
ecosystem functioning. The lack of large macrozoobenthic organisms could result in a reduction of the
bioturbation potential (Solan et al., 2004), with negative effects on nutrient cycling and sediment oxygen
concentration (Heip et al., 1995), resulting in reductive stress (Pearson & Rosenberg, 1978). On the other
hand, a higher potential for bigger individuals, like predicted for the subtidal habitats in the
Oosterschelde, is indicative of higher complexity in species trophic (Woodward et al., 2005) and non-
trophic (e.g. ecosystem engineering, habitat forming (Kefi et al., 2012)) interactions. Communities

composed of bigger individuals are generally more functional, productive and stable, and they can
support more biomass at higher trophic levels (Brown et al., 2004). In the case of subtidal
macrozoobenthos in the Oosterschelde, the latter point could imply positive effects on macrofauna
through the benthic-pelagic food chain (Rinne & Miller, 2006).
Our analysis suggests that static management goals should be carefully considered in environmental
planning, as ecosystems develop, causing new and unexpected features to emerge. The notable
improvement in quality of the subtidal benthic habitat in the Oosterschelde (Figure 4) is an unexpected
consequence of the construction of the storm surge barrier. The dampening of current stress allowed a
large portion of the subtidal Oosterschelde to be colonized by large macrozoobenthic organisms, which
were confined to the inner and sheltered part of the estuary before the embankments (Cozzoli
et al., 2014a). This change in habitats has created opportunities for tourism (diving) activities, in
particular in combination with the increased transparency of the water. The total disappearance of tidal
flats in the system (as it is predicted to happen within less than one century as consequence of the
reduced tidal amplitude, Jongeling, 2007; Eelkema et al. 2012) will further emphasize this pattern. The
lesson learned is that, while natural values of the original system (e.g., intertidal productivity, food
provision for birds) are intrinsically incompatible with the management option that was chosen, other
natural values such as subtidal benthic habitat quality do have the potential to be compatible with this
option. On the other hand, the Westerschelde mudflats are growing steeper and higher (Figure 3) due to
the increased tidal amplitude (Roberts and Whitehouse 2000). This trend, which has already led to an
impoverishment of the intertidal benthic community in terms of size and diversity (Figure 4), will
continue until mudflats evolve in saltmarshes, losing their importance as feeding ground for birds (Cox et
al. 2003). Unlike the Oosterschelde, in the Westerschelde the intertidal loss will be coupled to a further
decline in the subtidal benthic habitats suitability, (Figure 4), leading to a general decrease in the basin
ecological importance.
The management regimes of the systems discussed in this paper show long-term trends on the scale of
the locally impacted water body. Nevertheless, our findings may to some extent be generalized to
analogous management cases around the globe, as they describe the response to those hydrodynamic
factors (tidal current velocity, inundation time, salinity) that i) are directly influenced from the realization
of wet infrastructures and ii) are known to be among the most important hydrodynamic variables in
determining the benthos distribution in estuaries (Ysebaert et al., 2003, 2002). Furthermore, our analysis
is based on general community descriptors, relatively more independent from local biogeographical
features than specific responses (Thrush et al., 2005).
Conclusion
The management of coastal and estuarine areas is complex and critical, as these areas host both in terms
of ecology (McLusky and Elliott 2004) and economy (Costanza et al., 1997) one of the most valuable
ecosystems around the world, which at the same time belong to one of the most impacted environments
(Barbier et al., 2011). The realization of wet infrastructure with multiple goals ranging from coastal

defence to transportation will continue, being essential to ensure future human welfare (Small &
Nicholls, 2003, McMichael et al., 2006, Temmerman et al. 2013; Nordstrom, 2014). However, it is
increasingly evident that the realization of societal objectives must include ecological goals (Leschine
et al., 2003). Whereas much work focuses on enhancing the ecological value of the infrastructure itself
(e.g. Chapman et al. 2009, Bulleri et al. 2010, Browne et al. 2011, Matthews et al., 2011), we should not
miss out on long-term seascape-scale effects. That is, long-term estuary-scale ecological forecast should
be explicitly included into wet infrastructure development, despite the partial lack of empirical
knowledge on long-term ecosystem responses under altered hydromorphology. Within this context,
model extrapolations of the biological and physical environment as those we presented in this study, are
a fundamental step to explicitly integrate nature into infrastructure development (’Building with nature’,
see van Slobbe et al. 2013) and to forecast the future availability of ecosystem services (Chan
et al., 2006). The divergent human pressures on the Oosterschelde and Westerschelde (Figure 2) are
examples of what could happen in the near future for many of the global coastal ecosystems, given the
globally growing anthropogenic engineering of coastal ecosystems (Figure 1). The comparative analysis
of the two basins is a valuable source of information to understand (and communicate) the future
ecological consequences of human coastal development.
Acknowledgments
This work was mainly funded by the Ecoshape/Building with Nature project. The NIOZ Monitor
Taskforce was for a large part responsible for the fieldwork and the taxonomic analysis of the
macrofauna samples. Rijkswaterstaat (executive body of the Dutch Ministry of Infrastructure and the
Environment) was responsible for the funding of these activities in the framework of different national
monitoring projects such as MWTL. The hydrodynamic modeling for the Westerschelde was funded by
the Antwerp Port Authority. The authors would also like to thank Brian S. Cade for the very insightful
comments on this work.
References
Adger, W.N., Hughes, T.P., Folke, C., Carpenter, S.R. & Rockstrom, J. (2005). Social-ecological
resilience to coastal disasters. SCIENCE, 309, 1036–1039.
Akoumianaki, I. & Nicolaidou, A. (2007). Spatial variability and dynamics of macrobenthos in a
Mediterranean delta front area: the role of physical processes. JOURNAL OF SEA RESEARCH, 57, 47–
64.
Anderson, M.J. (2008). Animal-sediment relationships re-visited: Characterising species’ distributions
along an environmental gradient using canonical analysis and quantile regression splines. JOURNAL OF
EXPERIMENTAL MARINE BIOLOGY AND ECOLOGY, 366, 16–27.
Barbier, E.B., Hacker, S.D., Kennedy, C., Koch, E.W., Stier, A.C. & Silliman, B.R. (2011). The value
of estuarine and coastal ecosystem services. ECOLOGICAL MONOGRAPHS, 81, 169–193.
Blackburn, T.M., Lawton, J.H. & Perry, N.J. (1992). A method of estimating the slope of upper-bounds
of plots of body size and abundance in natural animal assemblages. OIKOS, 65, 107–112.
Borja, A., Barbone, E., Basset, A., Borgersen, G., Brkljacic, M., Elliott, M., Mikel Garmendia, J.,
Marques, J.C., Mazik, K., Muxika, I., Magalhaes Neto, J., Norling, K., German Rodriguez, J., Rosati, I.,
Rygg, B., Teixeira, H. & Trayanova, A. (2011). Response of single benthic metrics and multi-metric
methods to anthropogenic pressure gradients, in five distinct European coastal and transitional
ecosystems. MARINE POLLUTION BULLETIN, 62, 499–513.
Brown, J.H., Gillooly, J.F., Allen, A.P., Savage, V.M. & West, G.B. (2004). Toward a metabolic theory
of ecology. ECOLOGY, 85, 1771–1789.
Browne MA, Chapman MG (2011) Ecologically informed engineering reduces loss of intertidal
biodiversity on artificial shorelines. Envir Sci Tech 45:8204–8207.
Bulleri, F., and Chapman M. G. 2010. The introduction of coastal infrastructure as a driver of change in
marine environments. JOURNAL OF APPLIED ECOLOGY 47:26–35.
Cade, B. & Noon, B. (2003). A gentle introduction to quantile regression for ecologists. FRONTIERS
IN ECOLOGY AND THE ENVIRONMENT, 1, 412–420.
Cade, B., Noon, B. & Flather, C. (2005). Quantile regression reveals hidden bias and uncertainty in
habitat models. ECOLOGY, 86, 786–800.
Cefalì M., Cebrian E., Chappuis E., Pinedo S., Terradas M., Mariani S., & Ballesteros E. (2016). Life on
the boundary: Environmental factors as drivers of habitat distribution in the littoral zone. ESTUARINE,
COASTAL AND SHELF SCIENCE 172: 81-92.
Chan, K.M.A., Shaw, M.R., Cameron, R.D., Underwood, E.C. & Daily, G.C. (2006). Conservation
planning for ecosystem services. PLOS BIOLOGY, 4, 2138–2152.
Chapman MG, Blockley D (2009) Engineering novel habitats on urban infrastructure to increase
intertidal biodiversity. OECOLOGIA 161:625-635
Cheung, W., Meeuwig, J., Feng, M., Harvey, E., Lam, V., Langlois, T., Slawinski, D., Sun, C & Pauly, D.(2012). Climate-change induced tropicalisation of marine communities in Western Australia. MARINE AND FRESHWATER RESEARCH 63: 415-427
Coosen, J., Twisk, F., van der Tol, M., Lambeck, R., van Stralen, M. & Meire, P. (1994). Variability in
stock assessment of cockles (Cerastoderma edule, L.) in the Oosterschelde (in 1980-1990), in relation to
environmental factors. HYDROBIOLOGIA, 283, 381–395.

Costanza, R., d’Arge, R., de Groot, R., Farber, S., Grasso, M., Hannon, B., Limburg, K., Naeem, S.,
O’Neill, R.V., Paruelo, J., Raskin, R.G., Sutton, P. & van den Belt, M. (1997). The value of the world’s
ecosystem services and natural capital. NATURE, 387, 253–260.
Cox R., Wadsworth R.A., Thomson A.G. (2003). Long-term changes in salt marsh extent affected by
channel deepening in a modified estuary. CONTINENTAL SHELF RESEARCH, 23, 1833–1846
Cozzoli, F., Bouma, T.J., Ysebaert, T. & Herman, P.M.J. (2013). Application of non-linear quantile
regression to macrozoobenthic species distribution modelling: comparing two contrasting basins.
MARINE ECOLOGY PROGRESS SERIES, 475, 119+.
Cozzoli, F., Eelkema, M., Bouma, T.J., Ysebaert, T., Escaravage, V. & Herman, P.M.J. (2014). A mixed
modeling approach to predict the effect of environmental modification on species distributions. PLOS
ONE, 9.
Danielsen, F., Sorensen, M.K., Olwig, M.F., Selvam, V., Parish, F., Burgess, N.D., Hiraishi, T.,
Karunagaran, V.M., Rasmussen, M.S., Hansen, L.B., Quarto, A. & Suryadiputra, N. (2005). The Asian
tsunami: A protective role for coastal vegetation. SCIENCE, 310, 643.
Day, J.W., Hall, C.A.S., Kemp, W.M. & Yanez-Arancibia, A. (1989). ESTUARINE ECOLOGY. Wiley,
New York.
de la Huz, R., Lastra, M. & Lopez, J. (2002). The influence of sediment grain size on burrowing,
growth and metabolism of Donax trunculus L. (Bivalvia: Donacidae). JOURNAL OF SEA RESEARCH,
47.
De Vriend, H.J., Wang, Z.B., Ysebaert, T., Herman, P.M.J. & Ding, P. (2011). Eco-Morphological
Problems in the Yangtze Estuary and the Western Scheldt. WETLANDS, 31, 1033–1042.
Degraer, S., Verfaillie, E., Willems, W., Adriaens, E., Vincx, M. & Van Lancker, V. (2008). Habitat
suitability modelling as a mapping tool for macrobenthic communities: An example from the Belgian
part of the North Sea. CONTINENTAL SHELF RESEARCH, 28, 369–379.
Degraer, S., Wittoeck, J., J., A., Cooreman, K., Deprez, T., Hillewaert, H., K., H., Mees, J., Van den
Berghe, E. & Vincx, M. (2006). THE MACROBENTHOS ATLAS OF THE BELGIAN PART OF THE
NORTH SEA. Belgian Science Policy.
Diaz, S., Fargione, J., Chapin III, F.S. & Tilman, D. (2006). Biodiversity loss threatens human well-
being. PLOS BIOLOGY, 4, 1300–1305.
Downes, B.J. (2010). Back to the future: little-used tools and principles of scientific inference can help
disentangle effects of multiple stressors on freshwater ecosystems. FRESHWATER BIOLOGY, 55, 60–
79.
Eelkema, M., Wang, Z.B. & Stive, M.J.F. (2012). Impact of back-barrier dams on the development of
the ebb-tidal delta of theEastern Scheldt. JOURNAL OF COASTAL RESEARCH, 28, 1591–1605.
Elith, J., Leathwick, J.R., 2009. Species distribution models: ecological explanation and prediction across
space and time. ANNUAL REVIEW OF ECOLOGY, EVOLUTION AND SYSTEMATIC, 40, 677-697.
Folke, C., Carpenter, S., Walker, B., Scheffer, M., Elmqvist, T., Gunderson, L. & Holling, C.S. (2004).
Regime shifts, resilience, and biodiversity in ecosystem management. ANNUAL REVIEW OF
ECOLOGY EVOLUTION AND SYSTEMATICS, 35, 557–581.
Franklin, J. (2010). Moving beyond static species distribution models in support of conservation
biogeography. DIVERSITY AND DISTRIBUTIONS, 16, 321–330.
Haas, H. (2008). EFFECTEN VAN EEN ZOUT VOLKERAK-ZOOMMER OP DE OOSTER-EN DE
WESTERSCHELDE. Tech. rep., Rijkwaterstaat.
Halpern, B.S., Walbridge, S., Selkoe, K.A., Kappel, C.V., Micheli, F., D’Agrosa, C., Bruno, J.F., Casey,
K.S., Ebert, C., Fox, H.E., Fujita, R., Heinemann, D., Lenihan, H.S., Madin, E.M.P., Perry, M.T., Selig,
E.R., Spalding, M., Steneck, R. & Watson, R. (2008). A global map of human impact on marine
ecosystems. SCIENCE, 319, 948–952.
Heip, C.H.R., Goosen, N.K., Herman, P.M.J., Kromkamp, J., Middelburg, J.J. & Soetaert, K. (1995).
Production and consumption of biological particles in temperate tidal estuaries. OCEANOGRAPHY
AND MARINE BIOLOGY ANNUAL REVIEW, 33, 1–149.
Herman, P.M.J., Middelburg, J.J., van de Koppel, J. & Heip, C.H.R. (1999). Ecology of estuarine
macrobenthos. ADVANCES IN ECOLOGICAL RESEARCH, 29, 195–240.
Jones, M., Dye, S., Pinnegar, J., Warren, R., & Cheung, W. 2013. Applying distribution model
projections for an uncertain future: the case of the Pacific oyster in UK waters. Aquatic Conservation:
MARINE AND FRESHWATER ECOSYSTEMS, 23: 710-722.
Jongeling, T.H.G. (2007). ZANDHONGER OOSTERSCHELDE: MAATRELEGEN TER
VERGROTING VAN DOORSTROOMCAPACITEIT EN ZANDDOORVOER
STORMVLOEDKERING OOSTERSCHELDE. Tech. rep., Deltares.
Kater, B.J., Geurts van Kessel, A.J.M. & Baars, J.J.M.D. (2006). Distribution of cockles Cerastoderma
edule in the Eastern Scheldt: habitat mapping with abiotic variability. MARINE ECOLOGY PROGRESS

SERIES, 318, 221–227.
Kefi, S., Berlow, E.L., Wieters, E.A., Navarrete, S.A., Petchey, O.L., Wood, S.A., Boit, A., Joppa, L.N.,
Lafferty, K.D., Williams, R.J., Martinez, N.D., Menge, B.A., Blanchette, C.A., Iles, A.C. & Brose, U.
(2012). More than a meal ... integrating non-feeding interactions into food webs. ECOLOGY LETTERS,
15, 291–300.
Koenker, R. & Basset, G. (1978). Regression quantiles. ECONOMETRICA, 46, 33–50.
Koenker, R. & Machado, J.A.F. (1999). Goodness of fit and related inference processes for quantile
regression. JOURNAL OF THE AMERICAN STATISTICAL ASSOCIATION, 94, 1296–1310.
Koenker, R. & Hallock, K.F. (2001). Quantile regression. JOURNAL OF ECONOMIC
PERSPECTIVES, 15, 143–156. Annual Meeting of the Allied-Social-Science-Association, NEW
ORLEANS, LOUISIANA, JAN, 2001.
Koenker, R. (2005). Quantile regression. Cambridge University Press.
Leschine, T.M., Ferriss, B.E., Bell, K.P., Bartz, K.K., MacWilliams, S., Pico, M. & Bennett, A.K.
(2003). Challenges and strategies for better use of scientific information in the management of coastal
estuaries. ESTUARIES, 26, 1189–1204.
Lesser, G.R., Roelvink, J.A., van Kester, J.A.T.M. & Stelling, G.S. (2004). Development and validation
of a three-dimensional morphological model. COASTAL ENGINEERING, 51, 883–915.
Louters, T., van den Berg, J.H. & Mulder, J.P.M. (1998). Geomorphological changes of the
Oosterschelde tidal system during and after the implementation of the delta project. JOURNAL OF
COASTAL RESEARCH, 14, 1134–1151.
Marquet, P.A. (2002). Of predators, prey and power laws. SCIENCE, 295, 2229–2230.
Matthews, J.H., Wickel, B.A.J. & Freeman, S. (2011). Converging currents in climate-relevant
conservation: Water, Infrastructure, and Institutions. PLOS BIOLOGY, 9.
McLusky Donald S.; Elliott, M. (2004). THE ESTUARINE ECOSYSTEM: ECOLOGY, THREATS
AND MANAGEMENT. Oxford University Press; Oxford.
McMichael, A.J., Woodruff, R.E. & Hales, S. (2006). Climate change and human health: present and
future risks. LANCET, 367, 859–869.
Morais G., Camargo M. & Lana P. (2016). Intertidal assemblage variation across a subtropical estuarine
gradient: How good conceptual and empirical models are? ESTUARINE, COASTAL AND SHELF
SCIENCE 170: 91:101.
Moulinec, C., Denis, C., Pham, C.T., Rouge, D., Hervouet, J.M., Razafindrakoto, E., Barber, R.W.,
Emerson, D.R. & Gu, X.J. (2011). TELEMAC: An efficient hydrodynamics suite for massively parallel
architectures. COMPUTERS & FLUIDS, 51, 30–34.
Nienhuis, P.H. & Smaal, A.C. (1994). The Oosterschelde estuary, a case-study of a changing ecosystem -
An introduction. HYDROBIOLOGIA, 283, 1–14.
Nordstrom K. (2014). Living with shore protection structures: A review. ESTUARINE, COASTAL AND
SHELF SCIENCE 2014: 11-23
Pearson, R.G. & Dawson, T.P. (2003). Predicting the impacts of climate change on the distribution of
species: are bioclimate envelope models useful? GLOBAL ECOLOGY AND BIOGEOGRAPHY, 12,
361–371.
Pearson, T.H. & Rosenberg, R. (1978). Macrobenthic succession in relation to organic enrichment and
pollution of the marine environment. OCEANOGRAPHY AND MARINE BIOLOGY ANNUAL
REVIEW, 5, 229–311.
Perkins M., Ng T., Dudgeon D., Bonebrake T. & Leung K. (2015). Conserving intertidal habitats: What
is the potential of ecological engineering to mitigate impacts of coastal structures? ESTUARINE,
COASTAL & SHELF SCIENCE 167: 504-515.
Philippe A., Pinaud D., Cayatte M., Goulevant C., Pineau P., Karpytchev M, Bocher P. (2016) Influence
of environmental gradients on the distribution of benthic resources available for shorebirds on intertidal
mudflats of Yves Bay, France. ESTUARINE, COASTAL AND SHELF SCIENCE 174: 71-81.
R Development Core Team (2011). R: A Language and Environment for Statistical Computing. R
Foundation for Statistical Computing, Vienna, Austria. ISBN 3-900051-07-0.
Rinne, J.N. & Miller, D. (2006). Hydrology, geomorphology and management: Implications for
sustainability of native southwestern fishes. REVIEWS IN FISHERIES SCIENCE, 14, 91–110.
Conference on Aquatic Resources in Arid Lands, Las Cruces, NM, APR 30-MAY 02, 2003.
Roberts W., Whitehouse R.J.S. (2000). Predicting the profile of intertidal mudflats formed by cross-
shore tidal currents. COASTAL AND ESTUARINE FINE SEDIMENT PROCESSES 3, 263-285
Reiss, H., Birchenough, S., Borja, A., Buhl-Mortensen, L., Craeymeersch, J., Dannheim, J., Darr, A.,
Galparsoro, I., Gogina, M., Neumann, H., Populus, J., Rengstorf, A.M., Valle, M., van Hoey, G., Zettler,
M.L., Degraer, S., 2015. Benthos distribution modelling and its relevance for marine ecosystem
management. ICES JOURNAL OF MARINE SCIENCE 6, 1-19.
Robinson, L.M., Elith, J., Hobday, A.J., Pearson, R.G., Kendall, B.E., Possingham, H.P., Richardson,
A.J., 2011. Pushing the limits in marine species distribution modelling: lessons from the land present
challenges and opportunities. GLOBAL ECOLOGY AND BIOGEOGRAPHY 20, 789-802.
Short, F.T. & Wyllie-Echeverria, S. (1996). Natural and human-induced disturbance of seagrasses.
ENVIRONMENTAL CONSERVATION, 23, 17–27.
Sinclair, S.J., White, M.D. & Newell, G.R. (2010). How Useful Are Species Distribution Models for
Managing Biodiversity under Future Climates? ECOLOGY AND SOCIETY, 15.
Small, C. & Nicholls, R.J. (2003). A global analysis of human settlement in coastal zones. JOURNAL
OF COASTAL RESEARCH, 19, 584–599.
Smith, C.R., Mincks, S. & DeMaster, D.J. (2006). A synthesis of benthopelagic coupling on the
antarctic shelf: food banks, ecosystem inertia and global climate change. DEEP SEA RESEARCH PART
II, 53.
Smolders, S., Cozzoli, F., Ides, S., Plancke, Y. & Meire, P. (2013). A 2Dh hydrodynamic model of the
Scheldt estuary in 1955 to assess the ecological past of the estuary. In: 20th TELEMAC-MASCARET
USERS CONFERENCE.
Smolders, S., Cozzoli, F., Plancke, Y., Ysebaert, T., Ides, T., Bouma, T., Meire, P., Herman, P.M.J. &
Temmerman, S. (2014). Modelling benthic habitat suitability to evaluate ecological benefits of a new
sediment disposal strategy in shallow tidal waters. In preparation.
Smolders, S., Ides, S., Plancke, Y., Meire, P. & Temmerman, S. (2012). Calibrating discharges in a 2d
hydrodynamic model of the scheldt estuary : which parameters can be used and what is their sensitivity?
In: PROCEEDINGS OF THE 10th INTERNATIONAL CONFERENCE ON HYDROINFORMATIC.
Snelgrove, P. & Butman, C. (1994). Animal-Sediment relationships revisited - Cause vs Effect.
OCEANOGRAPHY AND MARINE BIOLOGY, 32, 111–177.
Snelgrove, P., Grassle, J. & Petrecca, R. (1994). Macrofaunal response to artifical enrichments and
depressions in a deep sea habitat. JOURNAL OF MARINE RESEARCH, 52, 345–369.
Solan, M., Cardinale, B.J., Downing, A.L., Engelhardt, K.A.M., Ruesink, J.L. & Srivastava, D.S.
(2004). Extinction and ecosystem function in the marine benthos. SCIENCE, 306, 1177–1180.
Stive, M. & Wang, Z. (2003). MORPHODYNAMIC MODELLING OF TIDAL BASINS AND
COASTAL INLETS, Oxford, UK: Elsevier, pp. 367–392. ADVANCES IN COASTAL MODELLING.
Swanson, R., O’Connell, C. & Wilson, R. (2012). Storm surge barriers: Ecological and special
concerns. In: STORM SURGE BARRIERS TO PROTECT NEW YORK CITY (eds. Hill, D., , Bowman,
M. & Khinda, J.). American Society of Civil Engineers, pp. 122–133.
Temmerman, S., Meire, P., Bouma, T.J., Herman, P.M.J., Ysebaert, T. & De Vriend, H.J. (2013).
Ecosystem-based coastal defence in the face of global change. NATURE, 504, 79–83.
Terrell, J.W., Cade, B.S., Carpenter, J. & Thompson, J.M. (1996). Modeling stream fish habitat
limitations from wedge-shaped patterns of variation in standing stock. TRANSACTIONS OF THE
AMERICAN FISHERIES SOCIETY, 125, 104–117.
Thomson, J.D., Weiblen, G., Thomson, B.A., Alfaro, S. & Legendre, P. (1996). Untangling multiple
factors in spatial distributions: Lilies, gophers, and rocks. ECOLOGY, 77, 1698–1715.
Thrush, S.F., Hewitt, J.E., Herman, P.M.J. & Ysebaert, T. (2005). Multi-scale analysis of species-
environment relationships. MARINE ECOLOGY PROGRESS SERIES, 302, 13–26.
Trancart T., Feunteun E., Lefrançois C., Acou A., Boinet C. & Carpentier A. (2016). Difference in
responses of two coastal species to fluctuating salinities and temperatures: Potential modification of
specific distribution areas in the context of global change. ESTUARINE, COASTAL AND SHELF
SCIENCE 173: 9-15.
van der Wal, D., Forster, R.M., Rossi, F., Hummel, H., Ysebaert, T., Roose, F. & Herman, P.M.J.
(2011). Ecological evaluation of an experimental beneficial use scheme for dredged sediment disposal in
shallow tidal waters. MARINE POLLUTION BULLETIN, 62, 99–108.
van Slobbe, E., de Vriend, H.J., Aarninkhof, S., Lulofs, K., de Vries, M. & Dircke, P. (2013). Building
with Nature: in search of resilient storm surge protection strategies. NATURAL HAZARDS, 66, 1461–
1480.
Verneaux, V., Verneaux, J., Schmitt, A. & Lambert, J. (2004). Relationships of macrobenthos with
dissolved oxygen and organic matter at the sedimentwater interface in ten French lakes. ARCHIV FUR
HYDROBILOGIE, 160.
Weinert M., Mathis M., Kroncke I., Neumann H., Pohlmann T. & Reiss H. (2016). Modelling climate
change effects on benthos: Distributional shifts in the North Sea from 2001 to 2099. ESTUARINE,
COASTAL AND SHELF SCIENCE 175: 157-68.
Wolff, W.J. (1973). THE ESTUARY AS A HABITAT. An analysis of data on the soft-bottom
macrofauna of the estuarine area of the rivers Rhine, Meuse, and Scheldt. Ph.D. thesis, Zoöl. Verh.,
Leiden 126: 1-242.

Woodward, G., Ebenman, B., Emmerson, M., Montoya, J.M., Olesen, J.M., Valido, A. & Warren, P.H.
(2005). Body size in ecological networks. TRENDS IN ECOLOGY & EVOLUTION, 20, 402–409.
Ysebaert, T., Herman, P.M.J., Meire, P., Craeymeersch, J., Verbeek, H. & Heip, C.H.R. (2003). Large-
scale spatial patterns in estuaries: estuarine macrobenthic communities in the Schelde estuary, NW
Europe. ESTUARINE COASTAL AND SHELF SCIENCE, 57, 335–355.
Ysebaert, T., Meire, P., Herman, P.M.J. & Verbeek, H. (2002). Macrobenthic species response surfaces
along estuarine gradients: prediction by logistic regression. MARINE ECOLOGY PROGRESS SERIES,
225, 75–95.

Figures

Figure 1: Coastal Anthropocene. A large part of the human populations is nowadays endangered by storm
surge risks (coastlines enlighten in red). In the northern hemisphere (particularly in Europe) this led
to the construction of coastal defense infrastructures like open surge barriers. In the map we show
the largest existent (red circles), under construction (yellow circles) or proposed (green circle) storm
surge barriers. Other smaller storm surge barriers exist, mostly on tributaries rivers (e.g. along the
Elbe, the Hull leading into the Humber). Contextually, the increasing exchange of goods through sea
routes is pushing to a more extensive dredging of the waterways to harbors (main dredging
operations in estuaries, embayments or straits are reported on the map with orange asterisks).
Sources for flood risk: World Bank; ship transit: NCEAS , population density: FAO; key dredging
projects 2012 in estuaries, lagoons, embayments or straits: International Dredger Association and
China Dredger Association (representative of ca. 70% of the global dredging market).
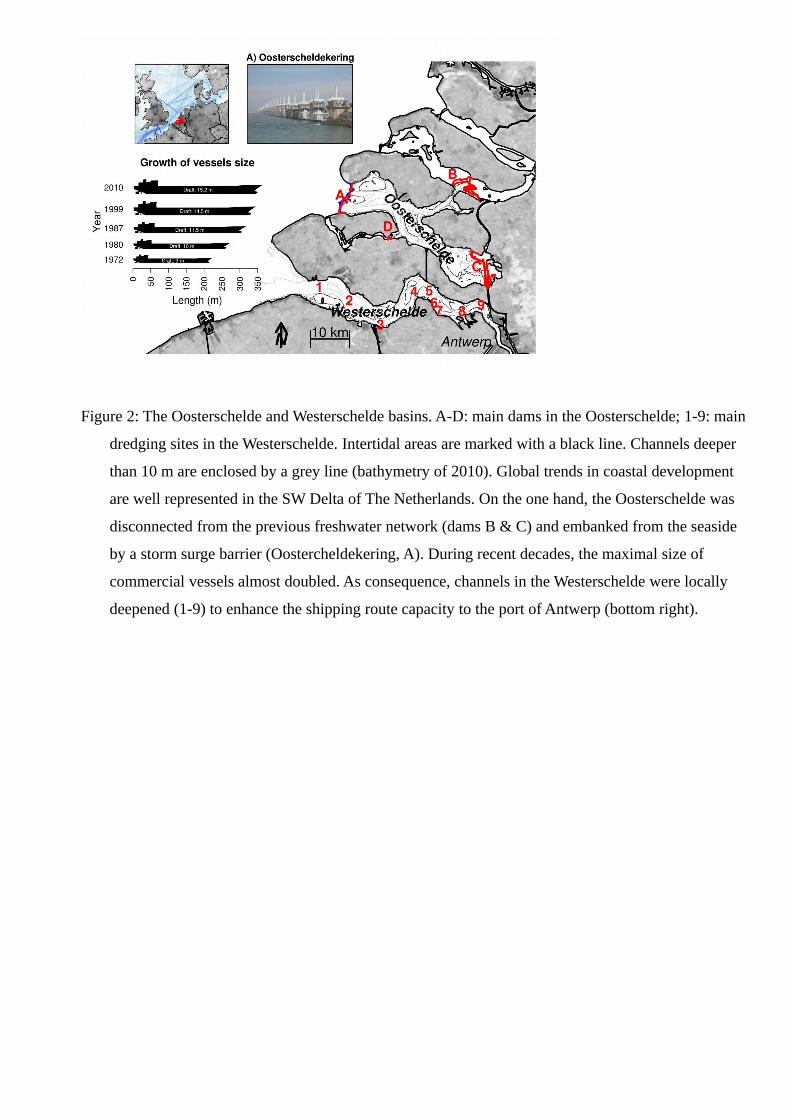
Figure 2: The Oosterschelde and Westerschelde basins. A-D: main dams in the Oosterschelde; 1-9: main
dredging sites in the Westerschelde. Intertidal areas are marked with a black line. Channels deeper
than 10 m are enclosed by a grey line (bathymetry of 2010). Global trends in coastal development
are well represented in the SW Delta of The Netherlands. On the one hand, the Oosterschelde was
disconnected from the previous freshwater network (dams B & C) and embanked from the seaside
by a storm surge barrier (Oostercheldekering, A). During recent decades, the maximal size of
commercial vessels almost doubled. As consequence, channels in the Westerschelde were locally
deepened (1-9) to enhance the shipping route capacity to the port of Antwerp (bottom right).
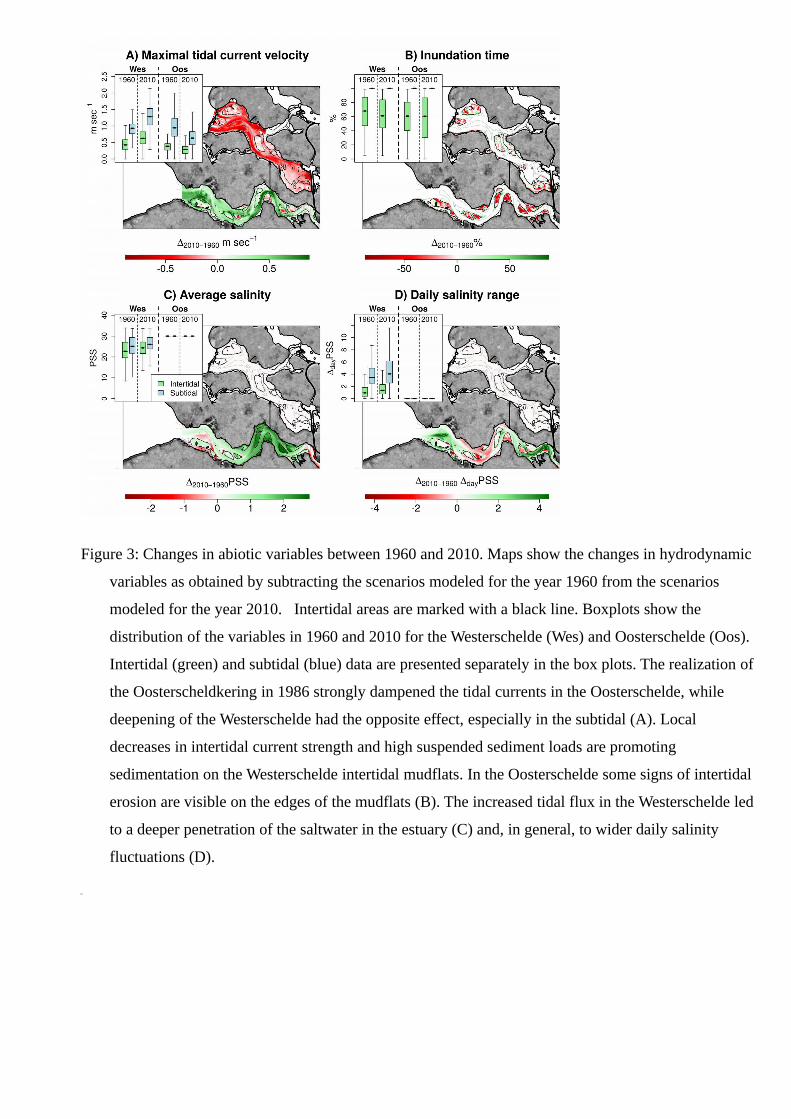
Figure 3: Changes in abiotic variables between 1960 and 2010. Maps show the changes in hydrodynamic
variables as obtained by subtracting the scenarios modeled for the year 1960 from the scenarios
modeled for the year 2010. Intertidal areas are marked with a black line. Boxplots show the
distribution of the variables in 1960 and 2010 for the Westerschelde (Wes) and Oosterschelde (Oos).
Intertidal (green) and subtidal (blue) data are presented separately in the box plots. The realization of
the Oosterscheldkering in 1986 strongly dampened the tidal currents in the Oosterschelde, while
deepening of the Westerschelde had the opposite effect, especially in the subtidal (A). Local
decreases in intertidal current strength and high suspended sediment loads are promoting
sedimentation on the Westerschelde intertidal mudflats. In the Oosterschelde some signs of intertidal
erosion are visible on the edges of the mudflats (B). The increased tidal flux in the Westerschelde led
to a deeper penetration of the saltwater in the estuary (C) and, in general, to wider daily salinity
fluctuations (D).

Figure 4: Changes in habitat suitability between 1960 and 2010. Maps show the absolute changes in
potential benthic communities responses as obtained by subtracting the scenarios modeled for the
year 1960 from the scenarios modeled for the year 2010. Intertidal areas are marked with a black
line. Boxplots show the distribution of the predicted variables in 1960 and 2010 for the
Westerschelde (Wes) and Oosterschelde (Oos). Prediction for the intertidal (green) and subtidal
(blue) habitats are presented separately in the box plots. Compared to 1960, benthic habitat
suitability has strongly improved in the subtidal part of the Oosterschelde, especially in terms of
potential biomass (A), per capita body size (C) and species diversity (D). Changes are less relevant
in the intertidal part of the basin, mostly involving a slightly decrease in individual density (B). For
the Westerschelde, we modeled a generalized decrease in habitat suitability. Increases in intertidal
potential density associated with decreases in potential per capita body size (B & C) are indicative of
the proliferation of small sized opportunistic deposit feeders. Increased hydrodynamic and salinity
stress had a detrimental effect on species richness, especially in the most marine part of the estuary
(D).

Appendix
Models validation
To validate our forecast for each of the modeled quantiles, the whole dataset was sampled with
replacement. Due to sampling with replacement, some observations are repeated and others remain
unpicked. The model was fitted on the sampled observation (training dataset) and used to predict the
unpicked ones (validation dataset). The random sampling-fitting-predicting procedure was iterated 10000
times to obtain a large dataset of predicted (potential, 95th quantile) and correspondent observed
(realized) values. To make potential and realized values comparable each other, we discretized them in
20 homogeneous classes based on the predicted values. For each of the classes, the 95th sample quantile
of the observed data was calculated. To finally asses the validity of the model, observed and predicted
quantiles were plotted against each other (for each class, empirical 95th quantile of observed data vs.
median point of the predicted values) and checked for linear correlation. All models show a great
accuracy in reproducing the upper boundary of the observed data (Figure 1). Biomass and Average body
mass models are slightly over-predicting at mid to low AFDW compared to observed values. This should
not arouse particular concern because of i) the overestimated values have a very limited influence on the
overall statistics (conditions with low potential biomass and average body mass are rare), and ii) given
that we used the same model to predict both basins and time scenarios, the over-prediction of low-
intermediate Biomass and Average body mass should be considered as systematic error that is partially
compensated when the two scenarios are compared as in Figure 4.
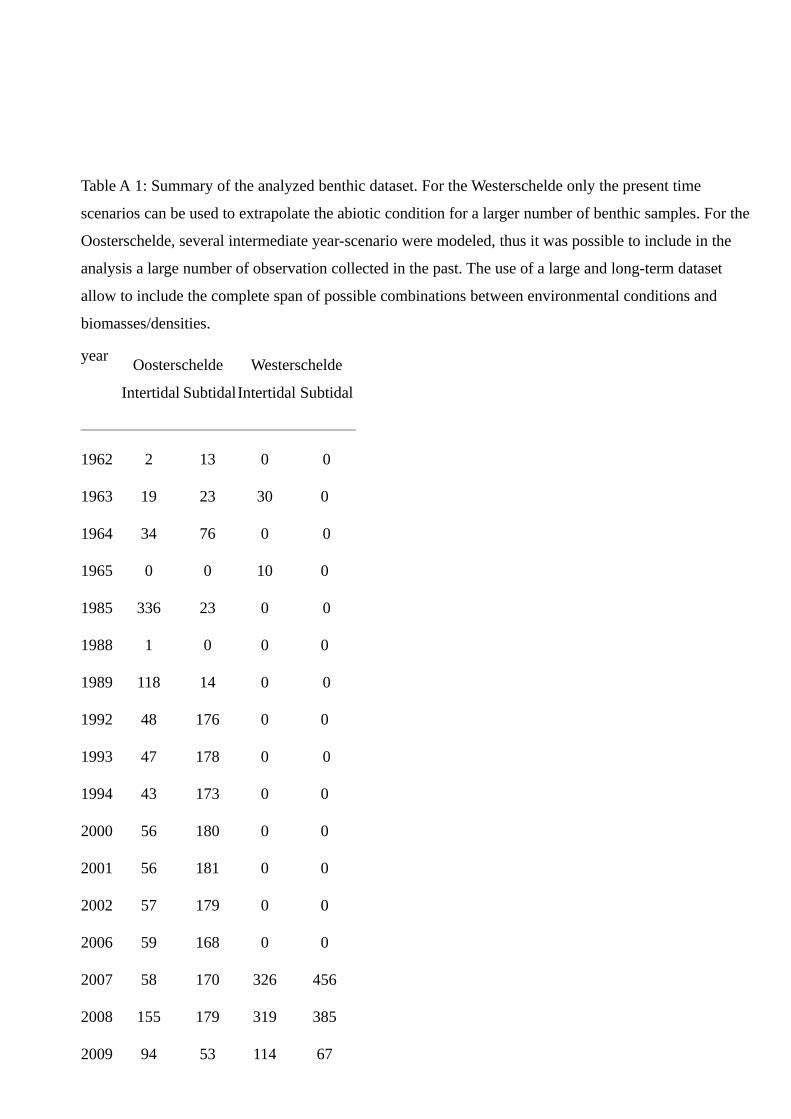
Table A 1: Summary of the analyzed benthic dataset. For the Westerschelde only the present time
scenarios can be used to extrapolate the abiotic condition for a larger number of benthic samples. For the
Oosterschelde, several intermediate year-scenario were modeled, thus it was possible to include in the
analysis a large number of observation collected in the past. The use of a large and long-term dataset
allow to include the complete span of possible combinations between environmental conditions and
biomasses/densities.
yearOosterschelde Westerschelde
Intertidal SubtidalIntertidal Subtidal
1962 2 13 0 0
1963 19 23 30 0
1964 34 76 0 0
1965 0 0 10 0
1985 336 23 0 0
1988 1 0 0 0
1989 118 14 0 0
1992 48 176 0 0
1993 47 178 0 0
1994 43 173 0 0
2000 56 180 0 0
2001 56 181 0 0
2002 57 179 0 0
2006 59 168 0 0
2007 58 170 326 456
2008 155 179 319 385
2009 94 53 114 67
2010 95 47 99 77
2011 83 44 121 268
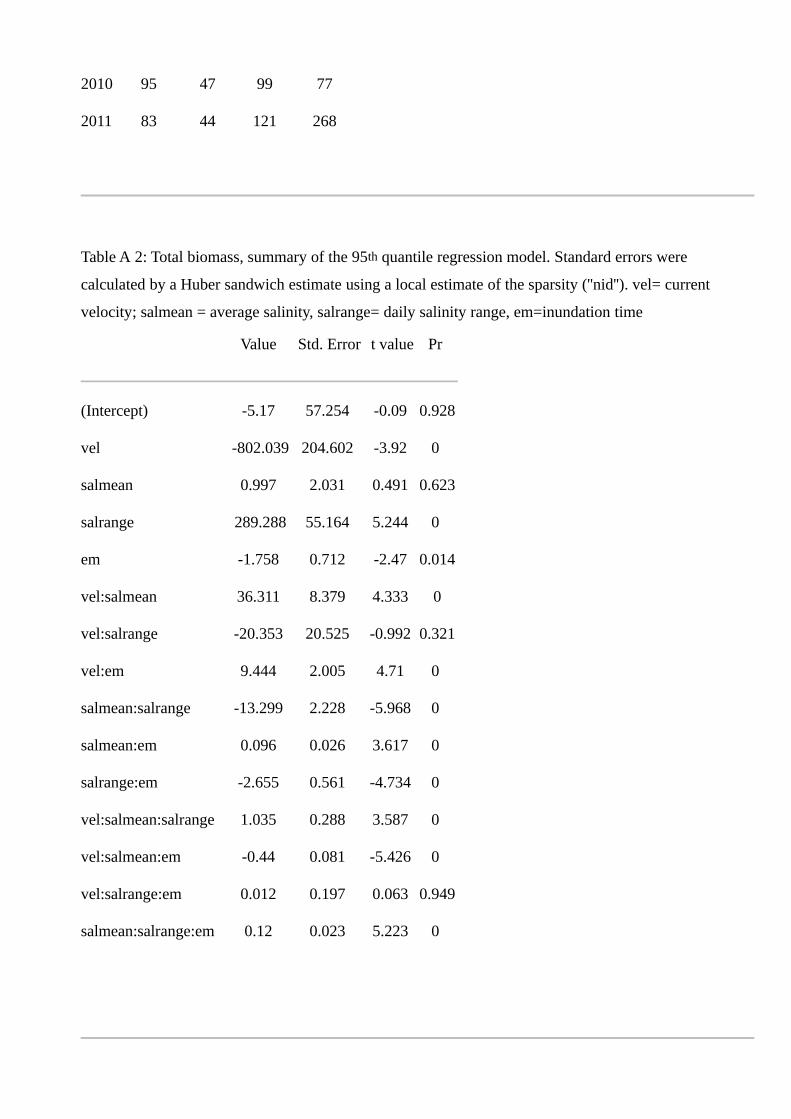
Table A 2: Total biomass, summary of the 95th quantile regression model. Standard errors were
calculated by a Huber sandwich estimate using a local estimate of the sparsity (''nid''). vel= current
velocity; salmean = average salinity, salrange= daily salinity range, em=inundation time
Value Std. Error t value Pr
(Intercept) -5.17 57.254 -0.09 0.928
vel -802.039 204.602 -3.92 0
salmean 0.997 2.031 0.491 0.623
salrange 289.288 55.164 5.244 0
em -1.758 0.712 -2.47 0.014
vel:salmean 36.311 8.379 4.333 0
vel:salrange -20.353 20.525 -0.992 0.321
vel:em 9.444 2.005 4.71 0
salmean:salrange -13.299 2.228 -5.968 0
salmean:em 0.096 0.026 3.617 0
salrange:em -2.655 0.561 -4.734 0
vel:salmean:salrange 1.035 0.288 3.587 0
vel:salmean:em -0.44 0.081 -5.426 0
vel:salrange:em 0.012 0.197 0.063 0.949
salmean:salrange:em 0.12 0.023 5.223 0
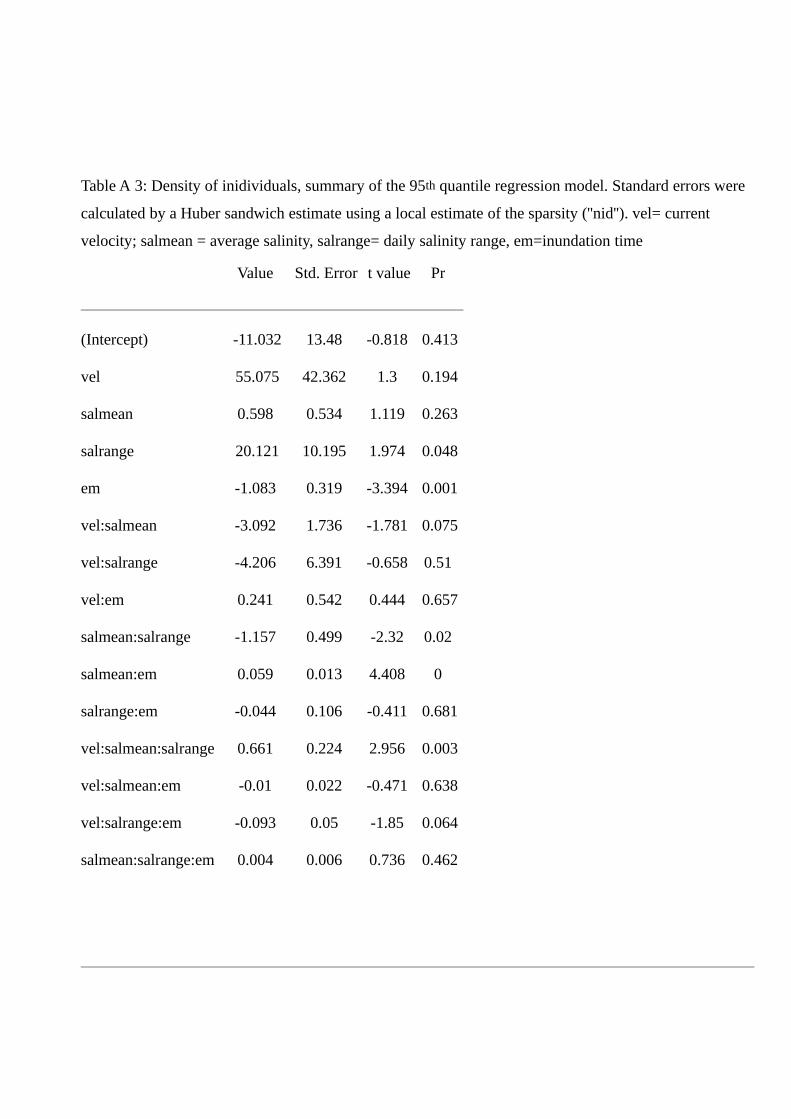
Table A 3: Density of inidividuals, summary of the 95th quantile regression model. Standard errors were
calculated by a Huber sandwich estimate using a local estimate of the sparsity (''nid''). vel= current
velocity; salmean = average salinity, salrange= daily salinity range, em=inundation time
Value Std. Error t value Pr
(Intercept) -11.032 13.48 -0.818 0.413
vel 55.075 42.362 1.3 0.194
salmean 0.598 0.534 1.119 0.263
salrange 20.121 10.195 1.974 0.048
em -1.083 0.319 -3.394 0.001
vel:salmean -3.092 1.736 -1.781 0.075
vel:salrange -4.206 6.391 -0.658 0.51
vel:em 0.241 0.542 0.444 0.657
salmean:salrange -1.157 0.499 -2.32 0.02
salmean:em 0.059 0.013 4.408 0
salrange:em -0.044 0.106 -0.411 0.681
vel:salmean:salrange 0.661 0.224 2.956 0.003
vel:salmean:em -0.01 0.022 -0.471 0.638
vel:salrange:em -0.093 0.05 -1.85 0.064
salmean:salrange:em 0.004 0.006 0.736 0.462
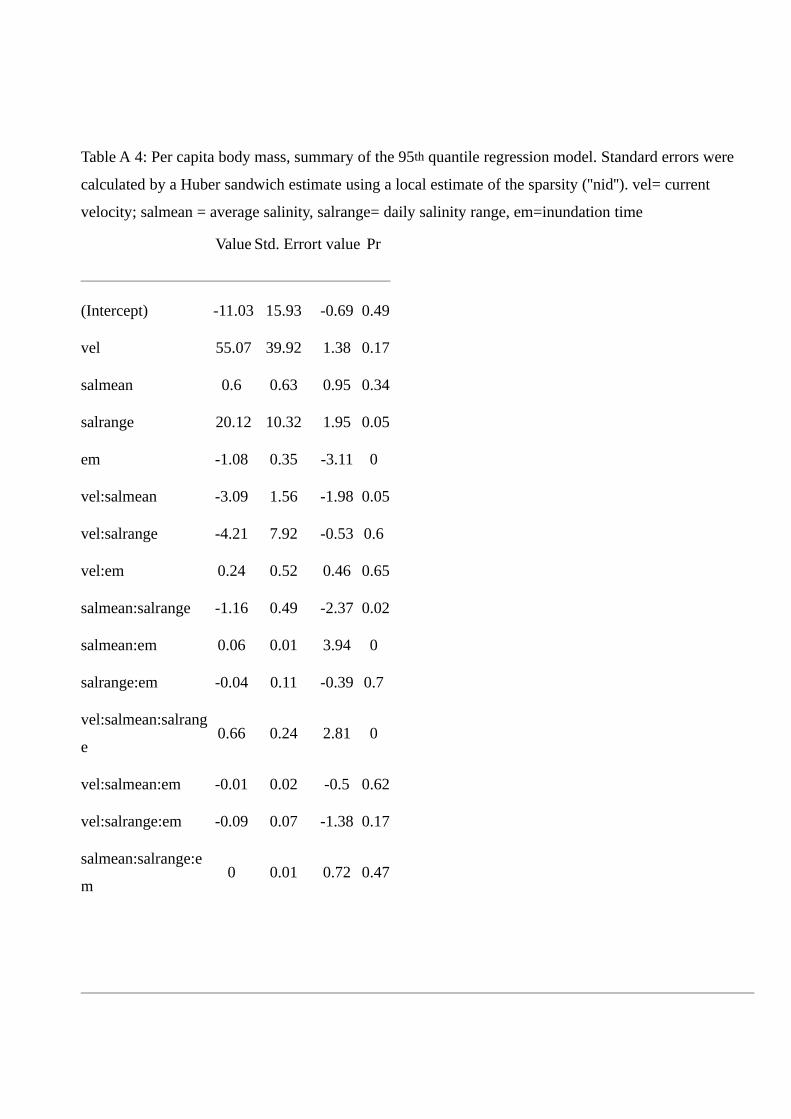
Table A 4: Per capita body mass, summary of the 95th quantile regression model. Standard errors were
calculated by a Huber sandwich estimate using a local estimate of the sparsity (''nid''). vel= current
velocity; salmean = average salinity, salrange= daily salinity range, em=inundation time
Value Std. Errort value Pr
(Intercept) -11.03 15.93 -0.69 0.49
vel 55.07 39.92 1.38 0.17
salmean 0.6 0.63 0.95 0.34
salrange 20.12 10.32 1.95 0.05
em -1.08 0.35 -3.11 0
vel:salmean -3.09 1.56 -1.98 0.05
vel:salrange -4.21 7.92 -0.53 0.6
vel:em 0.24 0.52 0.46 0.65
salmean:salrange -1.16 0.49 -2.37 0.02
salmean:em 0.06 0.01 3.94 0
salrange:em -0.04 0.11 -0.39 0.7
vel:salmean:salrang
e0.66 0.24 2.81 0
vel:salmean:em -0.01 0.02 -0.5 0.62
vel:salrange:em -0.09 0.07 -1.38 0.17
salmean:salrange:e
m0 0.01 0.72 0.47

Table A 5: Shannon diversity, summary of the 95th quantile regression model. Standard errors were
calculated by a Huber sandwich estimate using a local estimate of the sparsity (''nid''). vel= current
velocity; salmean = average salinity, salrange= daily salinity range, em=inundation time
Value Std. Error t value Pr
(Intercept) -0.518 1.186 -0.437 0.662
vel 4.365 2.52 1.732 0.083
salmean 0.074 0.041 1.822 0.068
salrange 0.072 0.298 0.242 0.809
em 0.024 0.015 1.624 0.104
vel:salmean -0.157 0.087 -1.793 0.073
vel:salrange -0.134 0.395 -0.339 0.735
vel:em -0.058 0.026 -2.272 0.023
salmean:salrange 0.003 0.011 0.302 0.763
salmean:em -0.001 0.001 -1.1 0.271
salrange:em -0.001 0.004 -0.274 0.784
vel:salmean:salrange -0.006 0.008 -0.751 0.452
vel:salmean:em 0.002 0.001 2.239 0.025
vel:salrange:em 0.003 0.003 0.91 0.363
salmean:salrange:em 0 0 -0.281 0.779

Figure A 1: Validation, Observed vs Predicted values. Red lines and R2 coeffiecnts were obtained by
linear regression. Dashed lines indicates the 1:1 ratio

Figure A 2: Oosterschelde, benthic observations. The black vertical dashed line marked the finalization
year of the Oosterscheldekering (1986). Before than 1975, only individual density and taxonomical
records were taken. Average body size and total biomass values were obtained by multiplying the
numerical density of each species for the average body size registered in later years (dashed boxes).
Differently from Table A1, this figure included also 974 observations that have not been included in the
SDM models due to lack of match between measured and modeled bathyimetric data. While these
observation can generate bias in the SDM, they are still useful to partially reconstruct a general trend in
benthic community evolution. Colored lines (obtained by loess regression) emphasize the central
temporal trend of the intertidal (green) and subtidal (blue) benthic community observations. Coherently
with our forecast, observed data show a decrease in intertidal habitat suitability and an increase in
subtidal habitat suitability after the realization of the Oosterscheldekering. Insufficient observations are
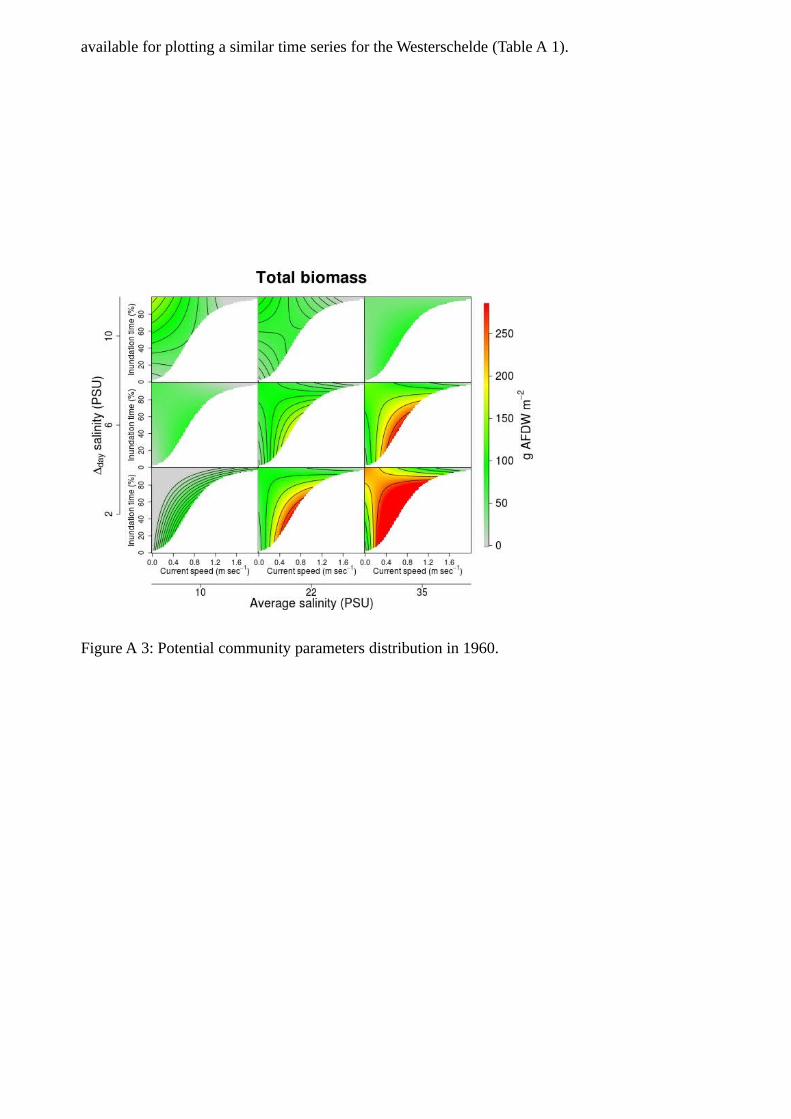
available for plotting a similar time series for the Westerschelde (Table A 1).
Figure A 3: Potential community parameters distribution in 1960.

Figure A 4: Biomass model, sensitivity analysis
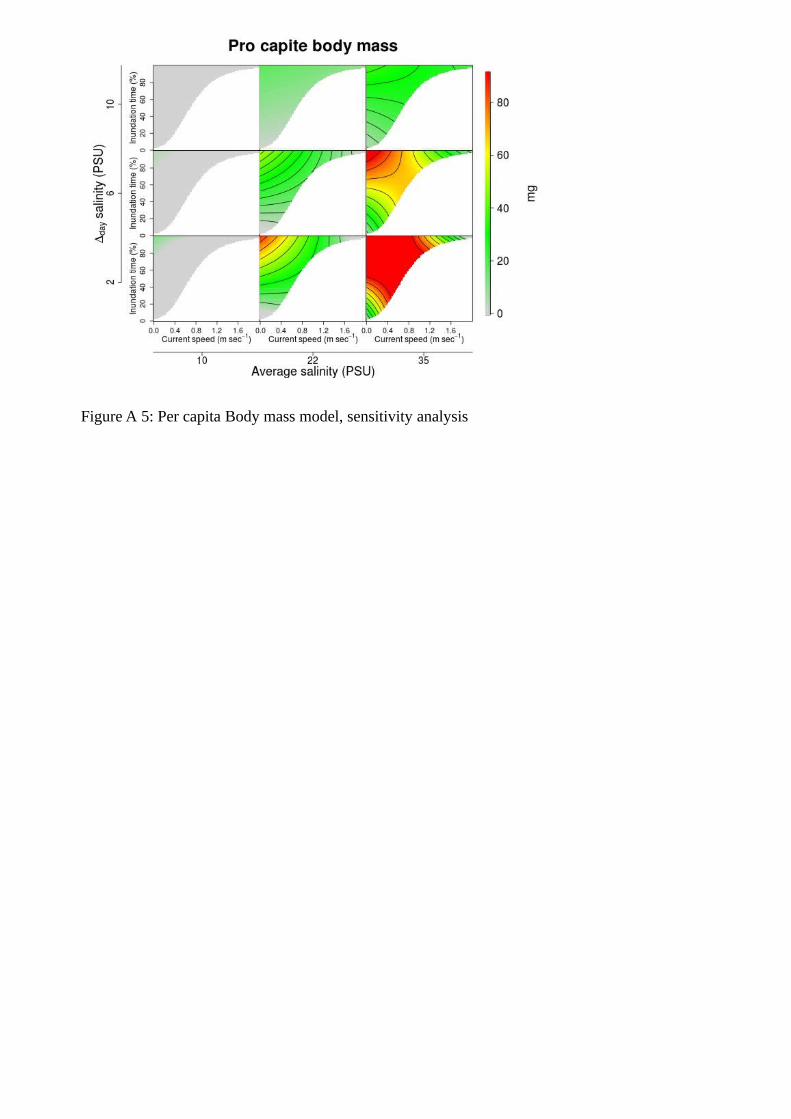
Figure A 5: Per capita Body mass model, sensitivity analysis

Figure A 6: Shannon diversity model, sensitivity analysis

Figure A 8: Potential community parameters distribution in 1960.

Figure A 8: Potential community parameters distribution in 2010.

Figure A9: Comparison of forescast from the upper boundary model (95th quantile) and model focused on
underlying portions (75th, 50th, 25th quantiles) of the Biomass distribution, for the Westerschelde (Wes)
and Oosterschelde basin, for pre- (black) and post- (red) impact scenarios.
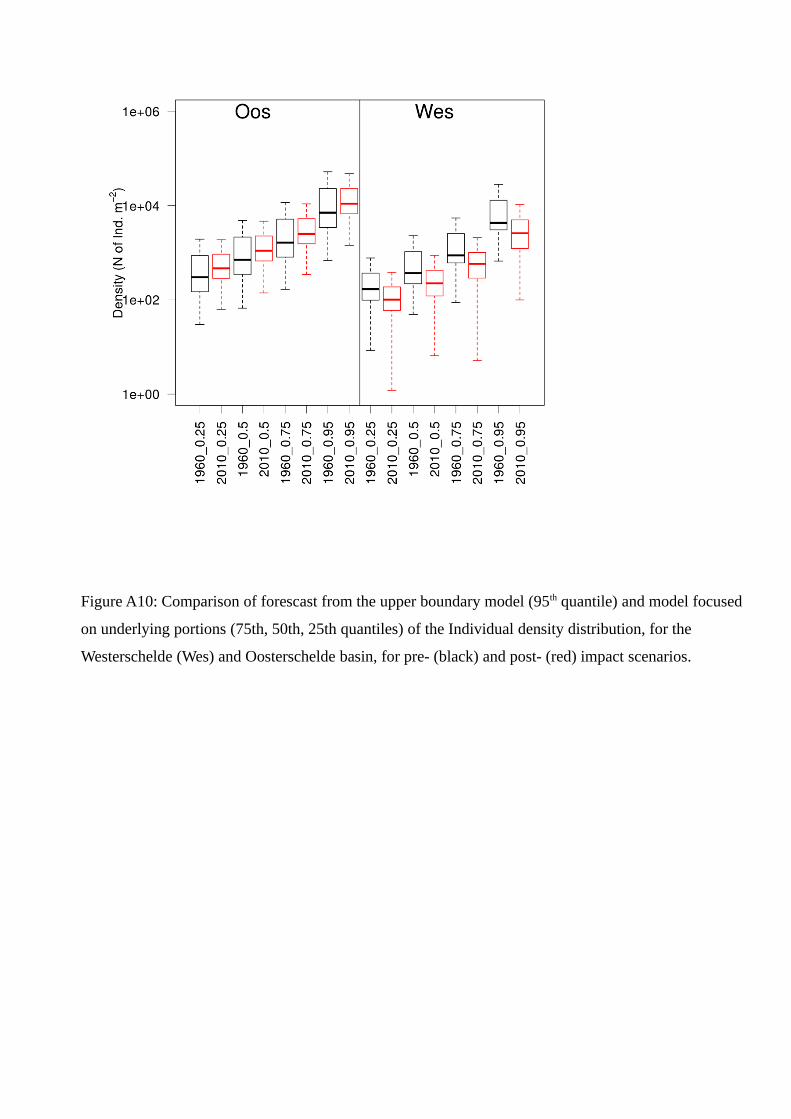
Figure A10: Comparison of forescast from the upper boundary model (95th quantile) and model focused
on underlying portions (75th, 50th, 25th quantiles) of the Individual density distribution, for the
Westerschelde (Wes) and Oosterschelde basin, for pre- (black) and post- (red) impact scenarios.

Figure A11: Comparison of forescast from the upper boundary model (95th quantile) and model focused
on underlying portions (75th, 50th, 25th quantiles) of the Average body mass, for the Westerschelde
(Wes) and Oosterschelde basin, for pre- (black) and post- (red) impact scenarios.

Figure A12: Comparison of forescast from the upper boundary model (95th quantile) and model focused
on underlying portions (75th, 50th, 25th quantiles) of the Shannon diversity, for the Westerschelde (Wes)
and Oosterschelde basin, for pre- (black) and post- (red) impact scenarios.