covid-19 survey
TRANSCRIPT

COVID-19 SurveyBRIEFING NOTEW A V E 1 : A P R I L 2 0 2 0
THE ECONOMIC EFFECTS

2
Contents:Introduction
Fieldwork
The sample
Access the data
Survey content
The Economic Effects

3
The Understanding Society COVID-19 study is a monthly survey on the experiences and reactions of the UK population to the COVID-19 pandemic. The survey is an integral part of Understanding Society: the UK Household Longitudinal Study, which is a representative survey of UK households and began in 2009. Researchers can link the data from the COVID-19 survey to answers respondents have given in previous (and future) waves of the annual Understanding Society survey.
The survey is funded by the Economic and Social Research Council and the Health Foundation.
FieldworkThe COVID-19 survey is an online questionnaire.
The first wave of the COVID-19 survey was fielded was between 24 and 30 April 2020.
A telephone interview will be offered to respondents who wish to take part but live in a household where no-one is a regular internet user. Fieldwork for the telephone interviews began in late-May and continues to early-June 2020.
Fieldwork for the online survey is carried out by Ipsos MORI and for the telephone survey by Kantar.

4
The sampleAll Understanding Society adult sample members aged 16+ and who had taken part in one of the two last waves of the main study were invited to participate.
17,450 participants completed the survey in the first Wave.
For researchers wishing to analyse the data, weights are provided that adjust for the clustered sample design of the main study and unequal response bias.
For more information on the design, fieldwork and using the COVID-19 survey data please see the User Guide.
The dataThe COVID-19 survey data is available to researchers via the UK Data Service, Study Number 8644.
CitationTF Crossley, P Fisher, H Low, M Benzeval, J Burton, A Jäckle, and B Read (2020), Understanding Society COVID-19 Survey, April Briefing Note: The Economic Effects, Working Paper No 10/2020, ISER, University of Essex.
5
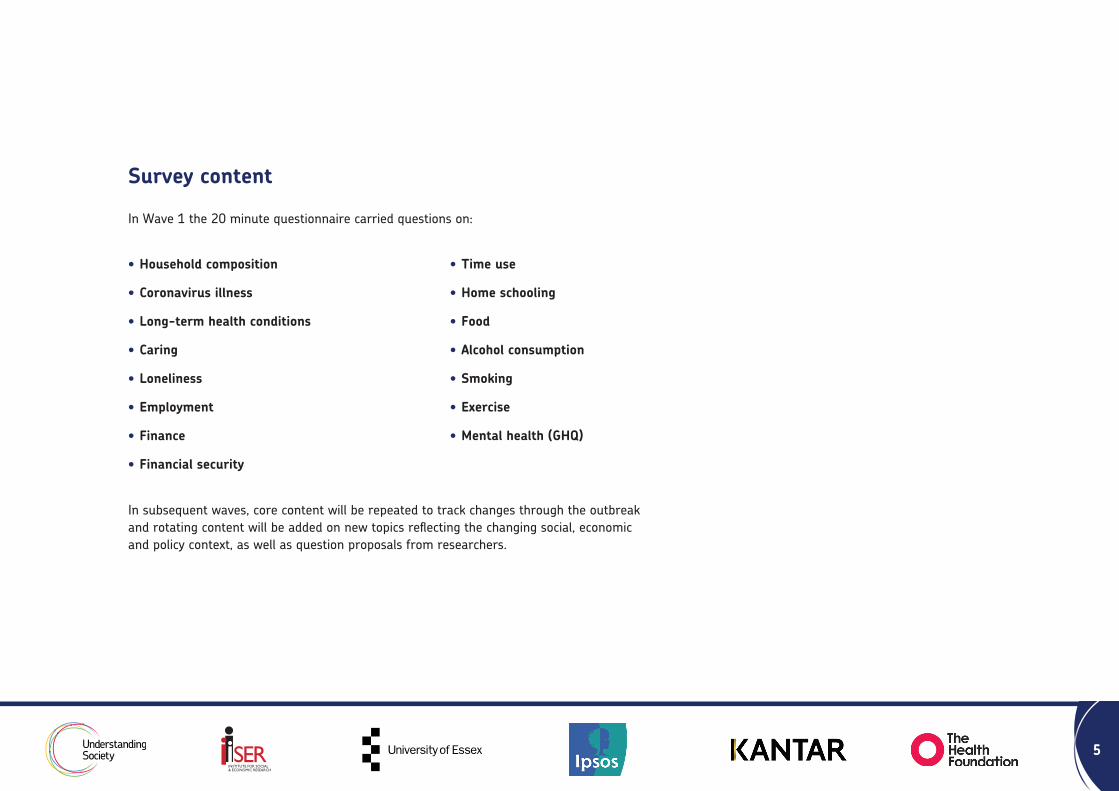
Survey content
In Wave 1 the 20 minute questionnaire carried questions on:
• Household composition
• Coronavirus illness
• Long-term health conditions
• Caring
• Loneliness
• Employment
• Finance
• Financial security
• Time use
• Home schooling
• Food
• Alcohol consumption
• Smoking
• Exercise
• Mental health (GHQ)
In subsequent waves, core content will be repeated to track changes through the outbreak and rotating content will be added on new topics reflecting the changing social, economic and policy context, as well as question proposals from researchers.

6
The Economic EffectsThomas Crossley European University Institute Understanding Society Associate Director Scientific Content
Paul Fisher University of Essex Understanding Society Topic Champion Income
Hamish Low University of Oxford Understanding Society Topic Champion Economic Risks
7
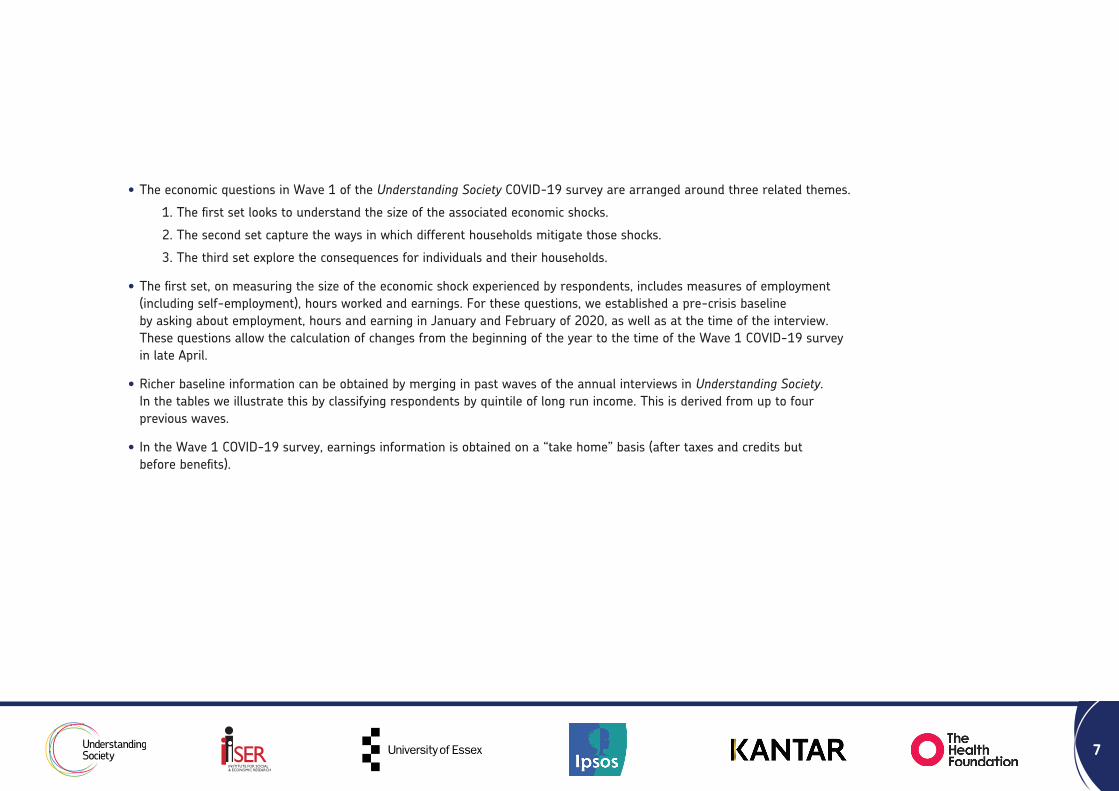
• The economic questions in Wave 1 of the Understanding Society COVID-19 survey are arranged around three related themes.
1. The first set looks to understand the size of the associated economic shocks.
2. The second set capture the ways in which different households mitigate those shocks.
3. The third set explore the consequences for individuals and their households.
• The first set, on measuring the size of the economic shock experienced by respondents, includes measures of employment (including self-employment), hours worked and earnings. For these questions, we established a pre-crisis baseline by asking about employment, hours and earning in January and February of 2020, as well as at the time of the interview. These questions allow the calculation of changes from the beginning of the year to the time of the Wave 1 COVID-19 survey in late April.
• Richer baseline information can be obtained by merging in past waves of the annual interviews in Understanding Society. In the tables we illustrate this by classifying respondents by quintile of long run income. This is derived from up to four previous waves.
• In the Wave 1 COVID-19 survey, earnings information is obtained on a “take home” basis (after taxes and credits but before benefits).

8
• In addition to individual earnings, for individuals living with other people, Wave 1 also asked about household earnings. The Understanding Society COVID-19 survey is an individual survey. It is possible for researchers and analysts link people residing at the same address at the time of the Wave 1 Covid-19 interview, as well as to link to household information in past annual waves of Understanding Society. However, in the tables we simply treat household characteristics, including household earnings, as an attribute of individuals.
• The second set of economic questions in Wave 1 of the Understanding Society COVID-19 survey seek to capture how individuals and their households attempted to mitigate the economic shock associated with the pandemic. For example, we asked about applications for universal credit, use of food banks, the extent of money and in-kind transfers of goods and services from family or friends, and the use of debt and savings.
• The final set of economic questions in Wave 1 of the Understanding Society COVID-19 survey seek to capture the consequences of the economic shock for individuals and their households. The consequences are measured in terms of the incidence of arrears of debt and subjective evaluations of the financial situation.

9
Employment changes
The survey collected information about circumstances at the time of survey (April) as well as a pre-Covid baseline (January/February 2020). We compare employment rates (including self-employment), the fraction working positive hours, mean hours, and mean weekly earnings across these two periods.
prob
abili
ty e
mpl
oyed
male:GCSE or lower
female:GCSE or lower
male:a-level
female:a-level
male:degree
female:degree
.4
.5
.6
.7
.8
.9
Employed February
Positive hours February
Employed April
Positive hours April
• Employment has held up well but there was a significant fall in the fraction working positive hours
• The fall in the fraction working positive hours was particularly large for men and women educated to less than degree level

10
Employment changes: labour market outcomes
The fall in hours worked was particularly large for:
• those whose employer set their hours without any minimum (“zero hours contracts”)
• the self-employed
• The substantial fall in the fraction of the population working positive hours occurs at all ages
Notes: Employment, hours and earnings include both employees and self-employees. Columns 1-4 are population percentages and refer to all individuals; columns 5-8 are weekly means and refer to those employed in February. Sample sizes (All) are: 10,803 (col 1-4), 8745 (col 5-6), and 8015 (col 7-8).
Employed Employed Positive Positive hours hours Hours Hours Earnings Earnings (Feb) (April) (Feb) (April) (Feb) (April) (Feb) (April)
All 80.4 78.4 79.5 55.8 34.7 23.0 429.0 380.6
Gender:men 84.5 82.3 83.8 59.5 38.6 25.5 505.1 439.1women 76.9 75.1 75.9 52.7 31.0 20.6 357.4 326.2
Education: GCSE or lower 72.6 70.0 71.7 43.6 34.1 19.6 332.1 284.5a-level 79.5 76.9 78.8 49.7 34.1 20.3 363.9 316.0degree 85.8 84.4 84.9 66.7 35.3 26.0 509.6 461.4
Worker type: fixed hours 100.0 97.1 99.4 72.4 35.0 24.7 433.7 407.0flexible hours 100.0 96.2 97.1 74.2 35.9 27.6 522.1 490.2employer sets (sure min.) 100.0 94.7 98.4 58.9 34.2 20.3 346.4 308.1employer sets (no sure min.) 100.0 85.7 96.5 41.2 32.5 14.9 350.0 277.5self-employed 100.0 94.9 98.8 59.2 33.3 15.8 417.7 256.1
Works at home (Feb):sometimes or always 100.0 97.6 99.1 78.6 35.5 26.6 548.4 485.1never 100.0 95.6 98.9 64.2 34.3 21.4 376.6 334.7
Age:20-29 79.8 75.1 78.4 48.2 33.5 20.3 326.0 290.230-39 86.8 85.1 85.7 60.9 35.4 23.6 448.2 394.140-49 86.2 85.8 85.7 65.2 35.9 25.7 484.2 439.250-59 81.8 80.4 81.3 58.7 35.0 23.5 451.8 401.660-65 58.8 56.4 57.9 36.8 31.4 18.4 376.2 313.0
Country:England 80.7 78.5 79.9 55.9 34.8 23.1 434.0 382.8Scotland 79.4 79.9 78.2 57.9 33.3 22.8 417.1 378.9Wales 77.0 75.4 76.5 52.7 34.1 21.9 378.5 369.5Northern Ireland 78.2 75.2 77.7 51.8 35.7 22.5 386.4 331.4
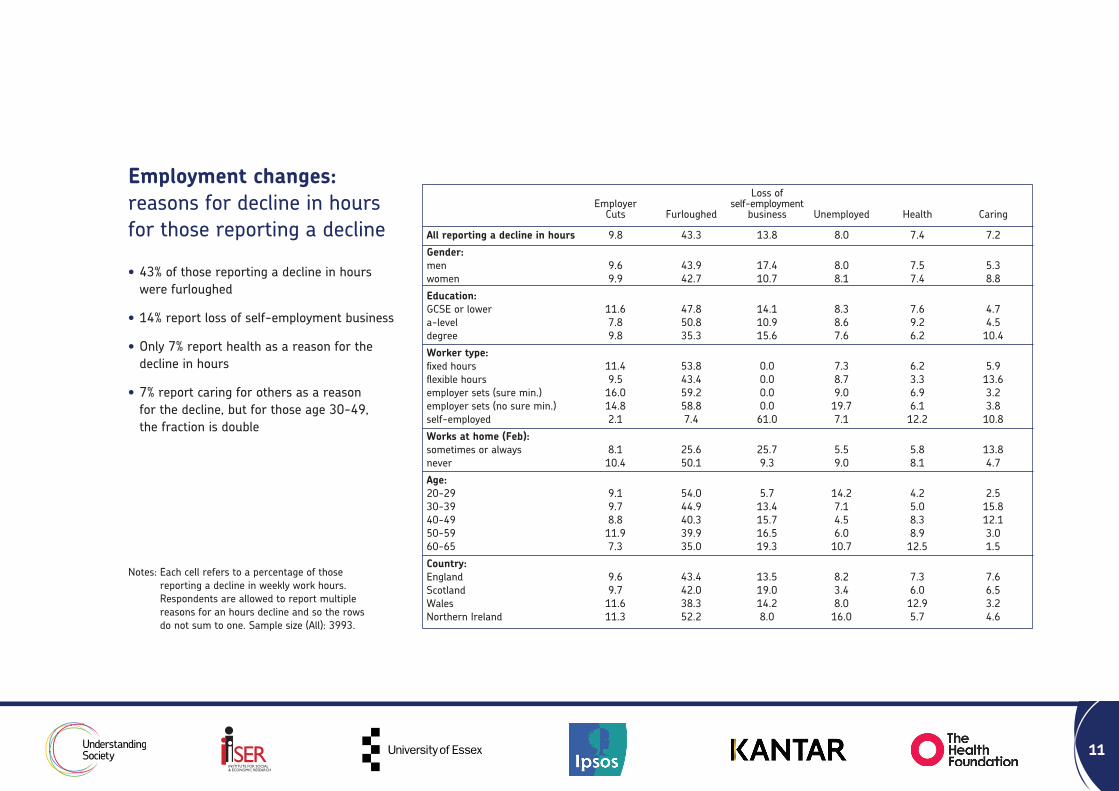
11
Notes: Each cell refers to a percentage of those reporting a decline in weekly work hours. Respondents are allowed to report multiple reasons for an hours decline and so the rows do not sum to one. Sample size (All): 3993.
Loss of Employer self-employment Cuts Furloughed business Unemployed Health Caring
All reporting a decline in hours 9.8 43.3 13.8 8.0 7.4 7.2
Gender: men 9.6 43.9 17.4 8.0 7.5 5.3 women 9.9 42.7 10.7 8.1 7.4 8.8
Education: GCSE or lower 11.6 47.8 14.1 8.3 7.6 4.7a-level 7.8 50.8 10.9 8.6 9.2 4.5degree 9.8 35.3 15.6 7.6 6.2 10.4
Worker type: fixed hours 11.4 53.8 0.0 7.3 6.2 5.9flexible hours 9.5 43.4 0.0 8.7 3.3 13.6employer sets (sure min.) 16.0 59.2 0.0 9.0 6.9 3.2employer sets (no sure min.) 14.8 58.8 0.0 19.7 6.1 3.8self-employed 2.1 7.4 61.0 7.1 12.2 10.8
Works at home (Feb):sometimes or always 8.1 25.6 25.7 5.5 5.8 13.8never 10.4 50.1 9.3 9.0 8.1 4.7
Age:20-29 9.1 54.0 5.7 14.2 4.2 2.530-39 9.7 44.9 13.4 7.1 5.0 15.840-49 8.8 40.3 15.7 4.5 8.3 12.150-59 11.9 39.9 16.5 6.0 8.9 3.060-65 7.3 35.0 19.3 10.7 12.5 1.5
Country:England 9.6 43.4 13.5 8.2 7.3 7.6Scotland 9.7 42.0 19.0 3.4 6.0 6.5Wales 11.6 38.3 14.2 8.0 12.9 3.2 Northern Ireland 11.3 52.2 8.0 16.0 5.7 4.6
Employment changes: reasons for decline in hours for those reporting a decline
• 43% of those reporting a decline in hours were furloughed
• 14% report loss of self-employment business
• Only 7% report health as a reason for the decline in hours
• 7% report caring for others as a reason for the decline, but for those age 30-49, the fraction is double

12
Changes in household earnings
The measure is net, equivalized weekly household earnings of individual respondents. This includes earnings from employment and self-employment, after tax, but not benefits nor capital income.
hous
ehol
d w
eekl
y ea
rnin
gs
1 2 3 4 5
200
400
600
800
1000
February April
• Average household earnings fell by 8%
• Household earnings fell across the earnings distribution, but particularly for the bottom 20%

13
Household earnings pre- and post-Covid
• 23% of individuals reported loss of more than 20% of household earnings
• Losses were particularly severe for single parents
Notes: Household earnings are means, weekly, net and equivalised. Columns 1-2 refer to all individuals and columns 3-6 to individuals in households with positive earnings in February. Sample sizes (All): 9208 (col 1-2), 8511 (col 3-6).
Full sample Positive February Earnings Lost 5% Lost 20% February April February April or more (%) or more (%)
All 538 495 585 529 38 23
Quantities of long-run income: 1 297 254 349 291 44 31 2 394 353 436 380 42 25 3 495 456 529 482 35 21 4 630 582 669 606 36 20 5 832 786 867 813 33 21
Household type: Single adult, no children 491 446 616 513 39 32 Single adult, children 326 253 427 308 47 35 Multiple adult, no children 582 536 629 573 37 23 Multiple adult, children 511 475 537 494 3 7 21
Country: England 541 499 591 535 38 24 Scotland 542 485 573 508 34 21 Wales 510 469 548 499 36 22 Northern Ireland 458 424 489 450 38 24

14
Mitigating household earning losses
Actions taken to mitigate earnings losses by individuals who have reported a decline in household earnings. Individuals can report taking multiple measures.
• Two-thirds of respondents reported reducing spending
• More than a quarter have drawn on their savings
• Significant numbers also borrow, ask for a mortgage holiday, received money from friends or family, and applied for universal credit
• Financial assistance from friends and family is much more common for individuals with the lowest quintile of household income, and for single parents
Notes: Each cell refers to a percentage of individuals experiencing a household earnings loss between April and February. Sample size (All): 3345.
Family Reduced Used New Mortgage Universal transfer Used spending savings Borrowed work hol. credit etc. foodbank
All 68.0 25.9 7.0 2.7 9.7 7.3 9.9 1.0
Income quintile:I 74.3 30.1 8.9 1.8 7.5 11.6 16.4 2.12 70.6 25.4 11.0 2.1 9.5 IO. I 12.2 1.83 68.0 24.7 4.9 3.3 9.7 6.6 7.7 0.84 64.8 23.9 5.1 2.1 10.6 4.1 7.2 0.05 62.5 25.6 5.1 4.1 11.0 4.2 6.0 0.2
Household type: Single adult, no children 50.0 20.3 5.5 0.7 3.6 10.0 12.1 4.1Single adult, children 65.4 18.4 12.7 2.0 3.3 5.3 25.6 0.0Multiple adult, no children 66.6 28.5 5.4 3.0 5.4 7.1 6.9 0.5Multiple adult, children 73.2 24.5 8.8 2.7 16.2 7.2 11.7 1.1
Country: England 67.8 25.4 6.9 2.7 10.0 7.4 9.9 0.8Scotland 70.1 28.7 10.8 2.6 6.8 3.2 10.5 1.8Wales 67.3 30.6 3.1 0.8 8.7 8.0 8.8 3.1Northern Ireland 70.7 26.3 7.9 6.2 7.5 16.0 10.7 0.0
15
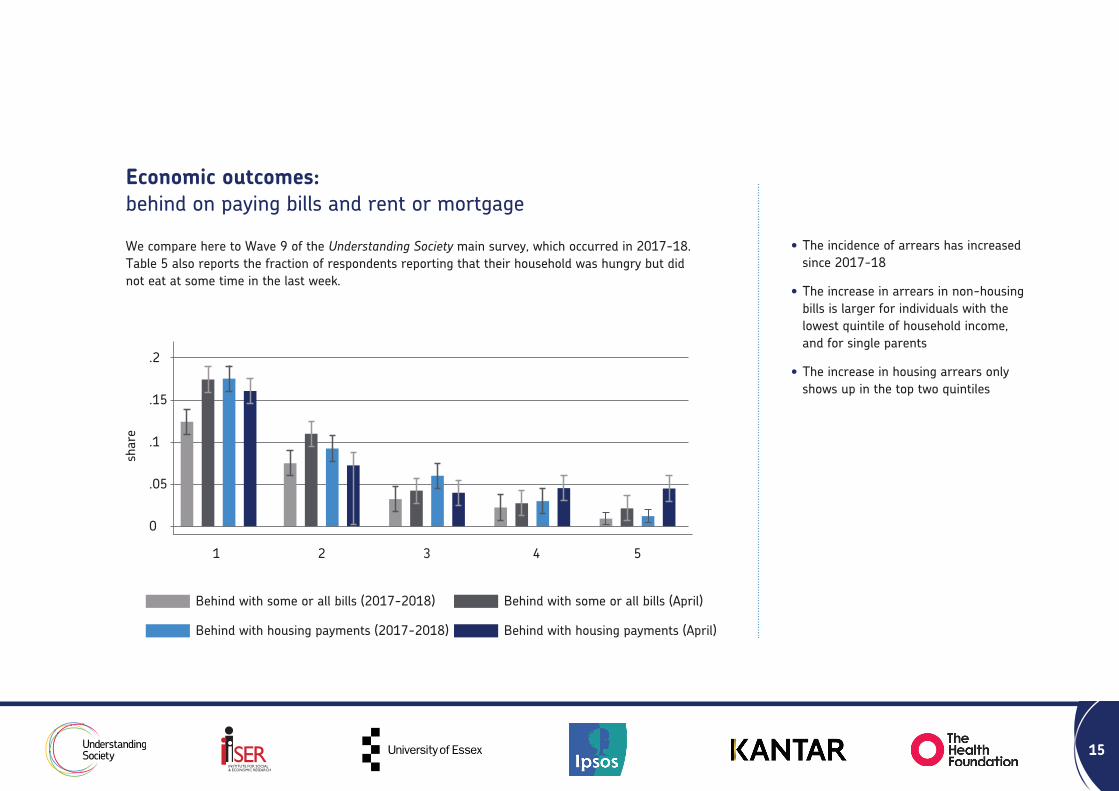
Economic outcomes: behind on paying bills and rent or mortgage
We compare here to Wave 9 of the Understanding Society main survey, which occurred in 2017-18. Table 5 also reports the fraction of respondents reporting that their household was hungry but did not eat at some time in the last week.
shar
e
1 2 3 4 5
0
.05
.1
.15
.2
Behind with some or all bills (2017-2018)
Behind with housing payments (2017-2018)
Behind with some or all bills (April)
Behind with housing payments (April)
• The incidence of arrears has increased since 2017-18
• The increase in arrears in non-housing bills is larger for individuals with the lowest quintile of household income, and for single parents
• The increase in housing arrears only shows up in the top two quintiles

16
Bills and housing arrears and hunger
Notes: Each cell refers to a percentage of the population. Hunger refers to individuals who report a time last week when they or others in their household were hungry but did not eat. Sample sizes (All): 10,505 ( col 1-2), 8076 (col 3-4); 10,547 (col 5).
Behind with bills Behind with housing 2017-2018 April 2020 2017-2018 April 2020 Hunger
All 5.2 7.4 7.5 7.4 4.6
Income quintile: 1 12.6 17.8 17.9 15.9 7.72 7.8 11.0 9.7 7.6 7.43 3.1 4.0 5.5 4.3 3.44 2.2 2.7 3.1 4.6 3.15 0.6 2.0 1.0 4.6 1.5
Household type: Single adult, no children 7.3 11.0 11.8 9.4 4.8Single adult, children 14.0 19.6 17.7 12.6 5.9Multiple adult, no children 3.5 4.7 6.3 6.8 4.5Multiple adult, children 6.0 8.8 6.9 7.0 4.5
Country: England 5.2 7.4 7.5 7.5 4.7Scotland 4.0 5.5 7.2 6.8 3.8Wales 8.1 10.5 7.7 6.3 3.5Northern Ireland 4.1 9.2 9.3 5.9 4.2

17
Financial expectations, past and present
We compare here to Wave 9 of the Understanding Society main survey, which occurred in 2017-18.
There is no evidence in these subjective reports that individuals are finding their financial situation more difficult than in 2017-2018.
Notes: Each cell refers to a percentage of the population. The categories are derived from a question asking individuals how they are managing financially. Columns 1-2 refer to individuals ‘finding it difficult or ‘very difficult’; columns 3-4 to those ‘just about getting by’; and columns 5-6 to those ‘living comfortably or ‘doing alright’. Sample size (All) : 10,732. These figures are for restricted age sample (respondents aged 20 to 65).
2017-18 April 2020 2017-18 April 2020 2017-18 April 2020
All 8.4 7.8 23.2 20.3 68.4 71.9
Income quintile: 1 19.6 15.7 35.6 32.7 44.8 51.62 10.0 10.9 31.3 27.1 58.6 62.03 6.5 5.5 21.9 18.9 71.6 75.64 4.4 4.6 17.9 14.8 77.7 80.65 2.0 2.9 10.1 8.6 87.9 88.4
Household type: Single adult, no children 13.0 11.6 28.7 24.2 58.3 64.1Single adult, children 20.5 17.9 39.6 29.5 39.9 52.6Multiple adult, no children 6.4 6.5 19.7 16.7 73.9 76.8Multiple adult, children 8.9 7.8 25.1 23.3 66.0 68.9
Country: England 8.3 7.7 23.5 20.5 68.3 71.9Scotland 7.8 8.6 20.3 20.4 71.8 71.0Wales 11.6 9.5 25.5 17.6 62.9 72.9Northern Ireland 9.0 8.5 20.5 18.9 70.5 72.6
Finding it difficult Just about getting by Living comfortably

18
Financial expectations, the future
• Twice as many people expect their financial situation to get worse as those who expect it to get better
• This rises to three times in the bottom income quintile
• This rises to more than three times for single parents
Notes: Each cell refers to a percentage of the population. Sample size (All) : 10,783. These figures are for restricted age sample (respondents aged 20 to 65).
Next month Next month Next month worse off about the same better off
All 19.7 71.0 9.3 Income quintile: 1 24.0 67.9 8.12 23.4 67.9 8.8 3 18.3 73.3 8.4 4 16.4 72.1 11.5 5 16.8 73.5 9.8
Household type: Single adult, no children 16.7 75.0 8.4Single adult, children 25.8 67.3 6.9Multiple adult, no children 18.2 72.4 9.4Multiple adult, children 21.9 68.5 9.6
Country: England 19.8 70.6 9.5 Scotland 18.0 73.6 8.4 Wales 19.8 72.5 7.7 Northern Ireland 21.2 71.2 7.5

19
ContributorsMichaela Benzeval, University of Essex Director, Understanding Society
Cara Booker, University of Essex Research Fellow, Understanding Society
Magda Borkowska, University of Essex Senior Research Officer, Understanding Society
Jonathan Burton, University of Essex Associate Director Surveys, Understanding Society
Thomas Crossley, European University Institute Associate Director Scientific Content, Understanding Society
Paul Fisher, University of Essex Topic Champion Income, Understanding Society
Laura Fumagalli, University of Essex Senior Research Officer, Understanding Society
Annette Jäckle, University of Essex Associate Director Innovations, Understanding Society
Meena Kumari, University of Essex Topic Champion Health, Biomarkers and Genetics, Understanding Society
Hamish Low, University of Oxford Topic Champion Economic Risks, Understanding Society
Birgitta Rabe, University of Essex Topic Champion Education, Understanding Society
Brendan Read, University of Essex Senior Research Officer, Understanding Society

For more information and to contact the StudyEmail: [email protected]
Twitter: @usociety
Find out more about the Study online at www.understandingsociety.ac.uk/themes/covid-19
Acknowledgements: The Understanding Society COVID-19 study is funded by the Economic and Social Research Council and the Health Foundation. Fieldwork for the survey is carried out by Ipsos MORI and Kantar. Understanding Society is an initiative funded by the Economic and Social Research Council and various Government Departments, with scientific leadership by the Institute for Social and Economic Research, University of Essex. The research data are distributed by the UK Data Service.
Published by the Institute for Social and Economic Research (ISER), University of Essex, 2020.