covid -19 report covid -19 situation covid …...2020/04/17 · march 9th april 14th shops selling...
TRANSCRIPT

COVID-19 SITUATIONOUTBREAK SITUATIONSANITARY MEASURESSUPPORT SCHEMESECONOMIC OUTLOOK
COVID-19 REPORTREAL ESTATE PERSPECTIVESECONOMIC OUTLOOKOUTBREAK SITUATIONSANITARY MEASURESSUPPORT SCHEMES
COVID-19 REPORT
OUTBREAK SITUATIONSANITARY MEASURES& SUPPORT SCHEMESECONOMIC OUTLOOKREAL ESTATE PERSPECTIVES
GLOBAL RESEARCH17TH APRIL 2020

02
01
03
AGENDACONTENTSOutbreak Situation
Sanitary Measures& Support Schemes
Economic Outlook
Real Estate Perspectives
21
34
4
9
12
25

CLICK TO EDIT MASTER TEXTI N A N U T S H E L L
EXECUTIVE SUMMARY
KEY MESSAGES
Plans to gradually reopen activity
Controlled increase in
vacancy
Limited pressure on
yields
Fall in investment
volume
Growth outlook darkens further
KEY MESSAGES
PLANS TO GRADUALLY RESTART ACTIVITYSome countries should relax their measures soon but it will be a
gradual process. We assume that the measures will last for about eight weeks in most countries, at least in their most stringent form,
with a slow subsequent recovery.
LIMITED PRESSURE ON YIELDSWe expect very little upward pressure on prime yields in most markets, but there may be more general upward tensions on
secondary segments. In general, the risk premium between core and non-core assets could come under pressure.
GROWTH OUTLOOK DARKENS FURTHERA change for the worse in some of our assumptions on the
Covid-19 shock has prompted us to revise our already low GDP growth forecasts. Even with the 2020 global growth revised to -2.5% from 0.5%, the risks remain skewed to the downside.
FALL IN INVESTMENT VOLUMEThe investment market works slowly despite severe external
difficulties. Financial conditions seem to be tightening so far and cash is increasingly king. Total investment volume is expected to
significantly fall in 2020 across Europe.
3
CONTROLLED INCREASE IN VACANCYThe increase in office vacancy is not expected to be substantial in most markets. Most central business districts should maintain
high rental values. The average rents could moderately decrease in some districts where the structural vacancy remains high.

OUTBREAK SITUATION

V I R U S W I D E L Y S P R E A D O U T S I D E C H I N A
CONFIRMED CASE OF COVID-19
5
0
10 000
20 000
30 000
40 000
50 000
60 000
70 000
80 000
90 000
100 000
March April
China Europe United States Rest of the World
0
100 000
200 000
300 000
400 000
500 000
600 000
700 000
800 000
900 000
1 000 000
05 10 15 20 25 30 05 10 15
March April
Rest ofEuropeUnitedKingdomNetherlands
Belgium
Germany
France
Spain
Italy
CUMULATIVE CONFIRMED CASES IN EUROPE
CONFIRMED DAILY CASES IN THE WORLD
Source: World Health Organisation.
• The Covid -19 emergency at the beginning of 2020 took the world by surprise (delivering an economic shock), just as the global economy had begun to stabilise from trade wars in the preceding years. Its implication for the global economy remains uncertain, but it is clear that the effect is likely to come in at least two phases:
• disruption to the supply chain in China, where most factories were shut during the peak of the crisis
• development into a pandemic spreading across Europe
• We are now in the second phase, with major economic implications for Europe and the US.
• Currently, around 30,000 new cases are being reported each day in Europe.
• Italy and Spain are still the epicentre, with around 342,000 confirmed cases in cumulative terms (40% of the total in Europe).
• The number of cases in the UK is also growing fast and warrant close monitoring.
• Cases European countries are now decreasing, but the situation should continue to be monitored.

G R O W T H O F O U T B R E A K S
INFECTION TRAJECTORIES
6
100
1000
10000
100000
1000000
1 6 11 16 21 26 31 36 41 46 51
Italy
Spain
France
Germany
Belgium
Netherlands
United Kingdom
United States
10% daily growth
20% daily growth30% daily growth
Number of days since 100th confirmed case
Source: World Health Organisation.
* The dash line shows when the quarantine measures have been put in place by the government
• All the main economies in Europe currently have a growth rate for new cases of less than 20% per day.
• In the United States, about 95% of the population is now under some form of stay-at-home order. We assume this will persist for around eight weeks, as in most other countries, before the measures are gradually relaxed.
• However, a lot of cases are still undetected and figures could be higher.
• At the moment, Italy is near 10% daily growth, meaning that the government’s containment measures are starting to have an effect. The latest figures showed are encouraging, but the exit strategy looks challenging.
• In France and Germany the growth is still similar but the curve is starting to ease off as quarantine measures are proving effective.
• In the UK, quarantine measures have been imposed by the government since the 23rd of March and starts to show positive results.

I S E U R O P E R E A C H I N G A P L A T E A U ?
NUMBER OF DAILY CONFIRMED CASES
7
0
5 000
10 000
15 000
20 000
25 000
30 000
35 000
0
1 000
2 000
3 000
4 000
5 000
6 000
7 000
8 000
9 000
01 03 05 07 09 11 13 15 17 19 21 23 25 27 29 31 02 04 06 08 10 12 14 16
Mars April
United Kingdom
Spain
Italy
France
Germany
Belgium
Netherlands
United States (rhs)
• Most of the European countries now have a decreasing number of daily cases.
• The lockdown measures (either total or partial) are now showing positive results for each countries. It seems now essential to keep these measures to protect the population from the virus.
• Austria is now even thinking about re-opening small shops (on the 14th of April) and higher risk businesses (by the 1st of May). Social distances measures may still last for a couple of weeks.
• Italy and Spain are now looking very good and are in a positive trend. France and Germany seems to be very close from the plateau too.
• Now, the UK and the US are the most increasing countries. The UK seems to be 10 days behind France or Germany, so we expect cases to grow until the end of the week ending Friday 17th of April, and deaths until the week after.
• Finally, the shape of the US is still a big concern as lockdowns measures and social distances start to be put in place by states.
• In France, the end of the lockdown was announced for the 11th of May. However, social distancing policies will still be in place as bars, restaurants will stay closed and mass gathering restricted.
Daily cases
7 days moving-average
Total lockdown measures
Source: World Health Organisation.

F A T A L I T Y R A T E D E P E N D S O N Q U A L I T Y O F H E A L T H C A R E A N D P O P U L A T I O N A G E
THE FATALITY RATE OF COVID-19
8
EVOLUTION OF DEATHS (SINCE FIRST DEATH)FATALITY RATE IN THE WORLD
25 871
21 647
18 579
17 146
12 868
4 4403 352
3 5693 134
1 203 973 444 393 286 1300%
2%
4%
6%
8%
10%
12%
14%
16%
18%
0
5 000
10 000
15 000
20 000
25 000
30 000
Number of Deaths Fatality Rate
0
5 000
10 000
15 000
20 000
25 000
30 000
1 11 21 31 41 51 61
Italy SpainFrance GermanyUnited Kingdom NetherlandsBelgium PolandUnited States
Number of days
Number of deaths
Fatality rate
Source: World Health Organisation.
• The fatality rate differs greatly from country to country. In China, the fatality rate stands at 4.0% since the beginning of the outbreak. For countries with more strongly resourced healthcare systems (Germany, Switzerland, etc.), the fatality rate could even be lower.
• The fatality rate is the highest in France as the virus is widely spreading in retirement home.
• However, Italy still has the highest number of dead. Indeed, 23% of the population is older than 65 years old, and nearly 60% of the population is aged 40 or over. The median age is also the highest in Europe.
• Living arrangements are also an important factor as several generations may live in the same place. This means that older people are not properly isolated and have a greater chance of catching the virus.
• The fatality rate is also increasing as the number of tests is decreasing. Now, only patients with severe symptoms are tested for the virus.

SANITARY MEASURES& SUPPORT
SCHEMES

10
LYON
LISBON
PRAGUE
STOCKHOLM
TOULOUSEBUCHAREST
BUDAPEST
VIENNA
BERLIN
COLOGNE
FRANKFURT
MUNICH
BRUSSELS
AMSTERDAM
MILAN
ROME
PARIS
MADRID
DUBLIN
LONDON DÜSSELDORF
HAMBURG
BARCELONA
WARSAW
March 17thMay 11th
March 24th
March 9thApril 14th
Shops selling books,
stationery and clothes for
children March 14thApril 13th
construction and industry
March 11thApril 15th Schools
March 23rd
March 18th
March 18thApril 13th
Total lockdown
Partial lockdown
No lockdown
Starting dateEasing lockdown
March 16th
March 12th
March 18thApril 20th
March 25th
March 18th
March 24thApril 19th
March 28th
Source: Government announcements.
April 20thshops < 800 m2
April 14thshops < 800 m2
E U R O P E A N C O U N T R I E S S L O W L Y E A S E L O C K D O W N M E A S U R E S
POPULATION LOCKDOWN ACROSS EUROPE

STATE & FEDERAL BANKS MOBILISATION
11
I N C R E A S I N G M E A S U R E S T O M I T I G A T E T H E I M P A C T O F C O V I D - 1 9
Financial help
Loan or State guarantee on loan to businesses in need
Central Bank
U N I T E D K I N G D O M
£330bnState guarantee
£50bnIncl. tax cut & business subsidy
S P A I N
€100bnState guarantee
€100bnSet of measures incl. short-time working, support to most vulnerable households
U N I T E D S T A T E S
$100bnShort-term working & sick leave financing
$300bnTax delay
$2,200bn plan$900bn to bail out distressed businesses$600bn in direct payments to families
$100bnOther social assistance voted by Congress
Federal Reserve$2,500bnInjection of liquidities
C A N A D A
CA$92bnSupport to workers and businesses in need, flexibility for taxpayers
F R A N C E
€50bnIncl. tax delay or cancellation, short-time working, support to very small businesses and self-employed
€300bnState guarantee. Intervention in major groups capital is not excluded.
I T A L Y
€25bnIncl. support to borrowers via suspension of payment for mortgage and banking loans
E U R O P E A N C E N T R A L B A N K
€750bnPublic and private debt buyback€500bn planto support to member states
€100bn1st liquidity injection
G E R M A N Y
€550bn“unlimited” loans to companies
J A P A N
¥1,600bnInterest-free loans to SME
¥108,000bnIncl. tax delay, support to SME and households in need
The Bank of Japan furthermore boosted its asset repurchasing policy
For more information on economicand financial measures click here
Source: Government announcements.

ECONOMICOUTLOOK

B U S I N E S S C O N F I D E N C E I N F R E E F A L L S I N C E M A R C H
PURCHASING MANAGERS INDEX SURVEYS
10
20
30
40
50
60
70
07 08 09 10 11 12 13 14 15 16 17 18 19 20
Industry
07 08 09 10 11 12 13 14 15 16 17 18 19 20
Services
Germany France Italy Spain United Kingdom
Index
13
• The latest economic data gathered since lockdowns were introduced are starting to show the extent of the hit. The flash purchasing managers’ indices for March showbig declines, particularly in services and in export orders. In Germany, the IFO business climate had the biggest monthly decline on record and the same holds true forits French equivalent produced by INSEE. The lifting of the lockdowns will, mechanistically, trigger a rebound in activity but additional stimulus will probably be neededto maintain the momentum.
Sources: Markit, BNP Paribas Economic Research.

-3%-2%-1%0%1%2%3%4%5%6%7%
71 73 75 77 79 81 83 85 87 89 91 93 95 97 99 01 03 05 07 09 11 13 15 17 19 21
World GDP
W H A T O U T L O O K F O R T H E M A I N E C O N O M I E S ?
ECONOMIC OUTLOOK
14
• The shock from Covid-19 represents an unprecedented hit to both supply and demand. The confinement measures adopted in many countries disrupt global value chains and reduce the supply of labour. Households also retrench their travel and recreational spending.
• We have revised down our global growth forecasts further to reflect likely longer imposition of ‘social distancing’ measures and slower recovery in economic activity thereafter than we had initially assumed. We also see greater chances of long-lasting effects as the economy’s supply capacity is permanently impaired.
• We now expect global GDP to contract by 2.5% this year before rebounding in 2021, with sharp contractions in activity across the board in both developed and emerging markets.
• Risks to our central case remain titled to the downside, including the possibility that economies will remain shut down for even longer than we assume or that a temporary relaxation might be followed by redeployment of social distancing measures to counter further waves of the virus.
• The fiscal measures announced so far will have to be scaled up further, which might raise concern over debt sustainability in some countries.
-10%
-5%
0%
5%
10%
15%
20%
94 95 96 97 98 99 00 01 02 03 04 05 06 07 08 09 10 11 12 13 14 15 16 17 18 19 20 21
GDP for the main economies
China
Euro Area
United Kingdom
United States
Sources: BNP Paribas, Oxford Economics, OECD.
Oil crisis(1973)
Oil crisis(1979)
Great recession(2008)
Covid-19(2019)
Dot-com bubble(2000-2001)

1,8
2,2
1,8 1,7
1,2 1,2
0
0,5
1
1,5
2
2,5
19 20 21 19 20 21 19 20 21
United States UK Euro
Inflation
W H A T O U T L O O K F O R T H E M A I N E C O N O M I E S ?
ECONOMIC OUTLOOK
15
-1
0
1
2
3
4
5
6
7
8
00 01 02 03 04 05 06 07 08 09 10 11 12 13 14 15 16 17 18 19 20 21
Government bond yields
ItalySpainFranceGermanyUnited Kingdom
1,8
1,00,8
0,1 0,0 0,00
0,5
1
1,5
2
19 20 21 19 20 21 19 20 21
United States UK Euro
Policy rates
• Under our baseline scenario, the recovery in demand will be limited by the disruption of supply chain in all the main countries. In the short term, the drag on demand will likely more than offset the impact from supply disruptions. Together, with lower energy prices, lower demand should drag down inflation considerably, with outright price falls possible in some countries.
• The volatility is still high in financial markets,remaining as choppy as that experienced during the 1987 crash.
• The response of the main central banks to this economic crisis has been strong. China’s monetary policy has largely focused on injecting liquidity into the system. The ECB has also increased its liquidity in the market, up to €750bn (but potentially unlimited). The Fed has cut its rates and announced at least $750bn in balance sheet expansion.
• In our view, the response of central banks is positive for the market and now the onus lies on governments to do their part.
• The high level of uncertainty in financial markets, and in the global economy, have encouraged investors flight toward safe assets. Government bonds are reaching new historic lows. That will be temporary as fiscal policies with their expansion of debt, suggests yields may increase to pay for the crisis.
Sources: BNP Paribas Economic Research, Oxford Economics, OECD.
A R E C E S S I O N C O M I N G A H E A D F O L L O W E D B Y A R E B O U N D
ECONOMIC SCENARIO
16
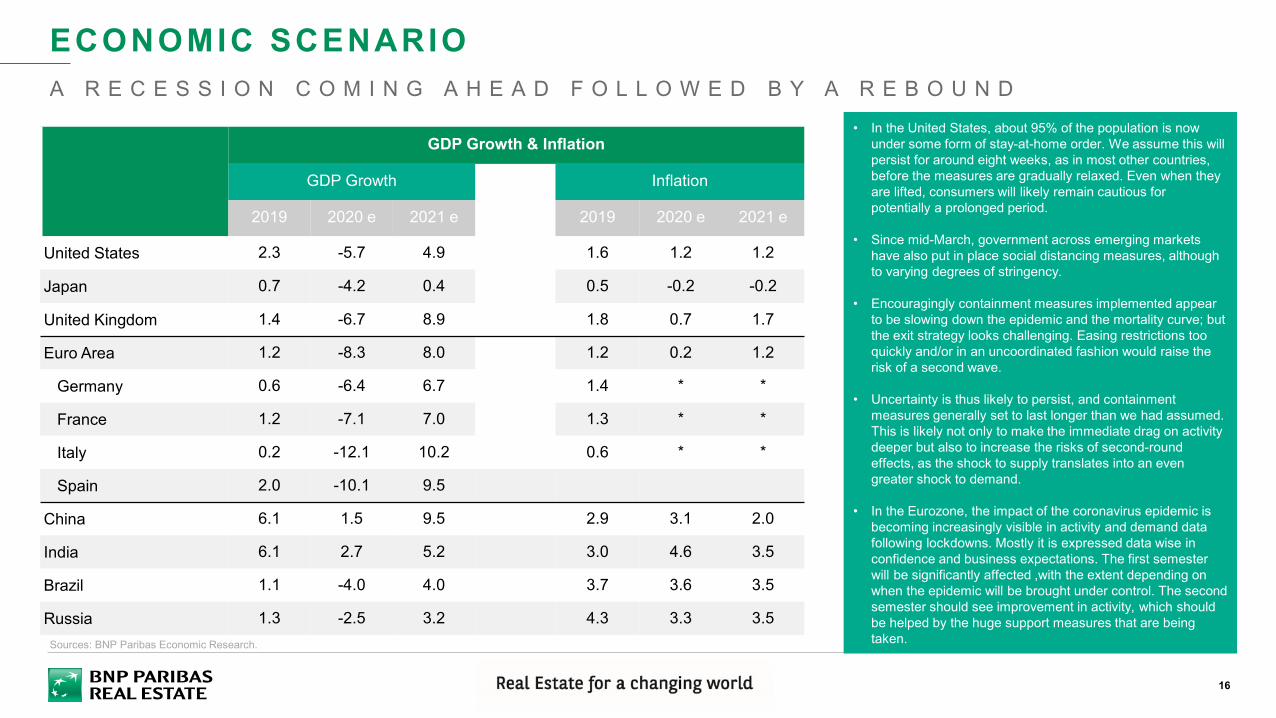
• In the United States, about 95% of the population is now under some form of stay-at-home order. We assume this will persist for around eight weeks, as in most other countries, before the measures are gradually relaxed. Even when they are lifted, consumers will likely remain cautious for potentially a prolonged period.
• Since mid-March, government across emerging markets have also put in place social distancing measures, although to varying degrees of stringency.
• Encouragingly containment measures implemented appear to be slowing down the epidemic and the mortality curve; but the exit strategy looks challenging. Easing restrictions too quickly and/or in an uncoordinated fashion would raise the risk of a second wave.
• Uncertainty is thus likely to persist, and containment measures generally set to last longer than we had assumed. This is likely not only to make the immediate drag on activity deeper but also to increase the risks of second-round effects, as the shock to supply translates into an even greater shock to demand.
• In the Eurozone, the impact of the coronavirus epidemic is becoming increasingly visible in activity and demand data following lockdowns. Mostly it is expressed data wise in confidence and business expectations. The first semester will be significantly affected ,with the extent depending on when the epidemic will be brought under control. The second semester should see improvement in activity, which should be helped by the huge support measures that are being taken. Sources: BNP Paribas Economic Research.
GDP Growth & Inflation
GDP Growth Inflation
2019 2020 e 2021 e 2019 2020 e 2021 e
United States 2.3 -5.7 4.9 1.6 1.2 1.2
Japan 0.7 -4.2 0.4 0.5 -0.2 -0.2
United Kingdom 1.4 -6.7 8.9 1.8 0.7 1.7
Euro Area 1.2 -8.3 8.0 1.2 0.2 1.2
Germany 0.6 -6.4 6.7 1.4 * *
France 1.2 -7.1 7.0 1.3 * *
Italy 0.2 -12.1 10.2 0.6 * *
Spain 2.0 -10.1 9.5
China 6.1 1.5 9.5 2.9 3.1 2.0
India 6.1 2.7 5.2 3.0 4.6 3.5
Brazil 1.1 -4.0 4.0 3.7 3.6 3.5
Russia 1.3 -2.5 3.2 4.3 3.3 3.5

ECONOMICOUTLOOK
FOCUS ONTHE UNITED STATES

UNITED STATES: NEW EPICENTRE OF THE PANDEMIC?
18
5% 10% 15% 20%25%
30%
0
500 000
1 000 000
1 500 000
2 000 000
2 500 000
13 15 17 19 21 23 25 27 29 31 02 04 06 08 10 12 14 16
03 04
United States World
0%
5%
10%
15%
20%
25%
0
500
1 000
1 500
2 000
2 500
13 14 15 16 17 18 19 20 21 22 23 24 25 26 27 28 29 30 31 01 02 03 04 05 06 07 08 09 10 11 12 13 14 15 16
03 04
Proportion of deaths within the World (rhs)
Daily number of deaths (lhs)
Cumulative Confirmed Cases Deaths in the United States
• Covid-19 has been spreading in the United States since the 23rd of January. The exponential increasestarted to become really worrying from around the 15th of March.
• The United States is now the new epicentre of the global pandemic.
• With around 30,000 new confirmed cases per day, the US represents almost half of new casesworldwide.
• In cumulative terms, 30% of global cases are now in the US and this figure is expected to rise in thecoming weeks.
• The number of deaths is also growing very quickly. With 25,871 deaths in the country to date at thetime of writing, the US accounts for 20% of the global total.
• However, the fatality rate is still one of the lowest in the world, at 4%.Sources: World Health Organisation.
Daily deaths
3 days moving-average

RECENT BUSINESS SURVEYS HAVE HELD UP
19
• The impact of the Covid-19 virus on the economyis still difficult to measure. However, certainweekly and monthly indicators allow us to monitorsome changes.
• PMI indices started to decline in March. Yet asthe spread of the virus has only really been aconcern since the 15th of March, it is still toosoon to see the real impact on the variousbusiness sectors.
• The manufacturing sector is already below the 50threshold, indicating a contraction of the sector.The sub-indices show some contractions in termsof production, employment, new orders andprices.
• During the last economic crises, prices and neworders were the most impacted, but alsorecovered quickly. Employment recovered with asmall lag.
• The non-manufacturing sector was still inexpansion (greater than 50) in March. However,non-manufacturing prices and business activitywere showing the first signs of a slowdown.
• A contraction in activity would be an earlyindication that the United States is expected toslow. Its implications for the global economy arestill unclear.
102030405060708090
100
00 01 02 03 04 05 06 07 08 09 10 11 12 13 14 15 16 17 18 19 20
Overall Index
Production Index
Employment Index
New Orders Index
Prices Index
PMI IndicesManufacturing Sector
PMI IndicesNon Manufacturing Sector
Sources: Institute for Supply Management, BNP Paribas Real Estate.
Index
30
40
50
60
70
80
90
00 01 02 03 04 05 06 07 08 09 10 11 12 13 14 15 16 17 18 19 20
Overall index
New Orders Index
Employment Index
Business Activity Index
Prices Index
Index

A SHARP INCREASE IN JOBLESS CLAIMS
20
• Employment growth has been positive since the2008 economic crisis for all sectors. Although on apositive trend, the manufacturing sector has neverrecovered from the slowdown and its level is stillway below 2008.
• During the 2008 crisis, around 9 million people losttheir jobs. 50% of the job cuts were in services.However, the rebound was fast in this sector.
• The construction and manufacturing sectorssuffered the most with employment falling byrespectively -30% and -20% between 2006 and2008.
• Jobless claims have been rocketing for the pastfour weeks as more than 22 million people filedclaims over the period. This is a record high andshows what is currently happening in the country.
• As social distancing measures and partiallockdowns get underway in a number of states,workers in tourism, food services or retail arebeing hit hard. As in Europe, some states haveordered non-essential businesses to close. Morestates are expected to introduce these types ofmeasures.
• One reason for the high jobless claims is that theUS has not implemented policies to help firmskeep their staff on the payroll. This means thatwhen the economy starts to recover, theunemployment rate should also decrease sharply.
150
1 500
15 000
00 01 02 03 04 05 06 07 08 09 10 11 12 13 14 15 16 17 18 19 20
Jobless claims
Sources: U.S Bureau of Labor Statistics, U.S Department of Labor, BNP Paribas Real Estate.
Thousands
132.789130.149
138.403
129.698
152.487
151.786
125
130
135
140
145
150
155
00 01 02 03 04 05 06 07 08 09 10 11 12 13 14 15 16 17 18 19 20
Millions of employees Employment

CONSUMPTION AND MAJOR PURCHASES ARE DECLINING
21
• The economic impact of Covid-19 remainsuncertain, but it is clear that the effects are likelyto be significant for both the supply and demandcomponents of the economy.
• At the moment, households are stockpiling andretails sales are holding up. But with the closureof non-essential businesses, retail sales areexpected to drop in the coming weeks.
• Car sales and registrations are also usefuleconomic indicators as they provide an earlyindication of big ticket consumer purchases. Theautomotive sector is also a key component of theUS economy, employing millions and accountingfor a large part of consumer spending.
• Moreover, the US also imports cars (mostly fromChina or Germany), and the decreases in salesshould have a strong impact on theseeconomies.
• Mortgage applications can also provide anindication on major purchases. The figuredecreased after the subprime crisis in 2007 andwe have also seen demand fall in recent weeks.
• This suggests that households are now moreconcerned about the future and are notconsidering any major purchases. This will havean impact on the global economy, as the US is amajor trading partner for most countries.
57911131517192123
200
250
300
350
400
450
500
00 01 02 03 04 05 06 07 08 09 10 11 12 13 14 15 16 17 18 19 20
Retail Sales Vehicle Sales & Registrations
0
100
200
300
400
500
600
00 01 02 03 04 05 06 07 08 09 10 11 12 13 14 15 16 17 18 19 20
$ bn $ million
Index
Sources: U.S Census Bureau, U.S. Bureau of Economic Analysis, Mortgage Bankers Association, BNP Paribas Real Estate.
Retail and Vehicle Sales
Mortgage Applications

FALL IN TOURISM REVENUES AND EXPENDITURE
22
• The restrictive measures put in place (borderclosures, lockdowns) will severely reducetourism-generated revenues for a lengthy period.
• The US will see both domestic and internationaltourism fall. Total US travel revenue stabilised in2019 as international visitors spent $254bn.
• Other countries will also see their revenuesgreatly impacted as the crisis lasts in the US.American tourists spent around $195bn abroad in2019.
• Again, as the restrictions are lifted, tourism maynot soar. The psychological effects and protectivemeasures should dominate in the early stages ofa recovery and we should see an increase indomestic holidays.
• International tourism will resume but later in theyear, and only gradually. For low-incomehouseholds, lockdowns should drain savings forthe purchase of necessities and we can expectbig-ticket spending (such as holidays) to beshelved. Moreover, economic losses resultingfrom the fall in overnight stays cannot be fullyrecovered, as most of holidays or business tripshave been cancelled.5
7
9
11
13
15
17
19
21
23
00 01 02 03 04 05 06 07 08 09 10 11 12 13 14 15 16 17 18 19 20
International Visitor Spending in the U.S U.S Spending Abroad$ bn
Total spending on travel from and to the United States (on a monthly basis)
Sources: National Travel & Tourism Office, BNP Paribas Real Estate.
FINANCIAL MARKETS ARE STILL VOLATILE
23
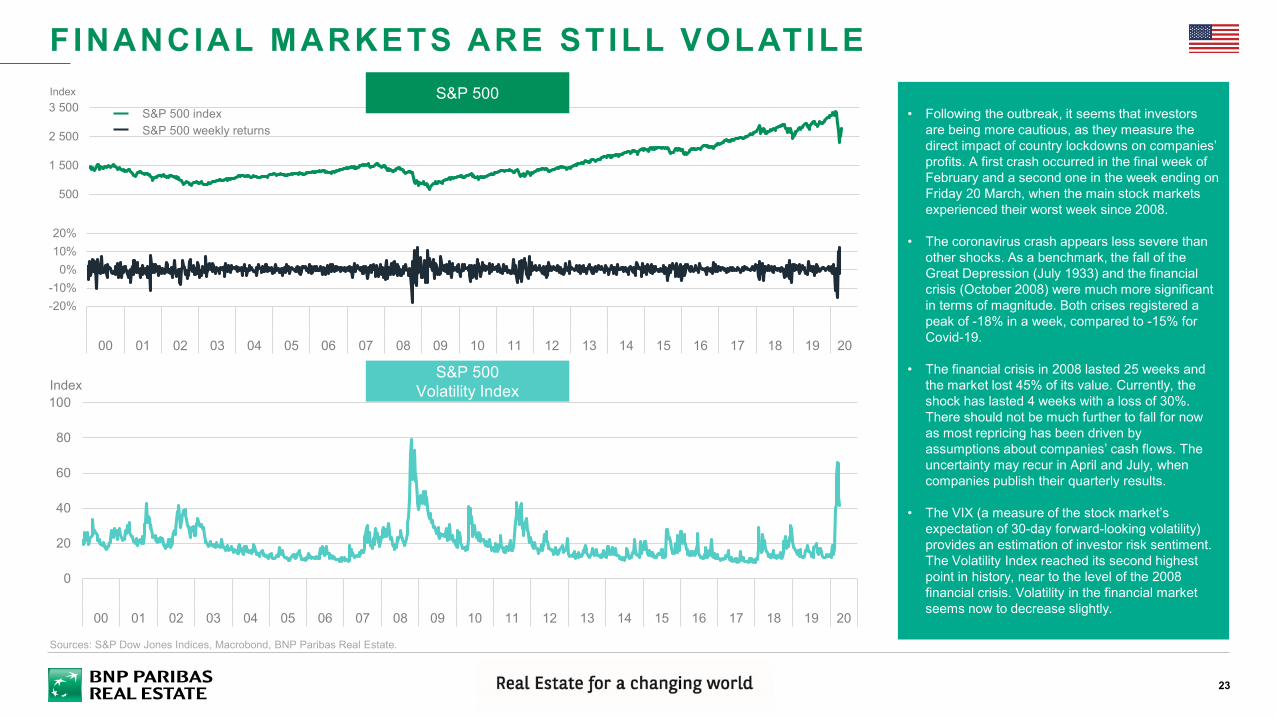
• Following the outbreak, it seems that investors are being more cautious, as they measure the direct impact of country lockdowns on companies’ profits. A first crash occurred in the final week of February and a second one in the week ending on Friday 20 March, when the main stock markets experienced their worst week since 2008.
• The coronavirus crash appears less severe than other shocks. As a benchmark, the fall of the Great Depression (July 1933) and the financial crisis (October 2008) were much more significant in terms of magnitude. Both crises registered a peak of -18% in a week, compared to -15% for Covid-19.
• The financial crisis in 2008 lasted 25 weeks and the market lost 45% of its value. Currently, the shock has lasted 4 weeks with a loss of 30%. There should not be much further to fall for now as most repricing has been driven by assumptions about companies’ cash flows. The uncertainty may recur in April and July, when companies publish their quarterly results.
• The VIX (a measure of the stock market’s expectation of 30-day forward-looking volatility) provides an estimation of investor risk sentiment. The Volatility Index reached its second highest point in history, near to the level of the 2008 financial crisis. Volatility in the financial market seems now to decrease slightly.
-20%-10%
0%10%20%
00 01 02 03 04 05 06 07 08 09 10 11 12 13 14 15 16 17 18 19 20
S&P 500Volatility Index
Sources: S&P Dow Jones Indices, Macrobond, BNP Paribas Real Estate.
0
20
40
60
80
100
00 01 02 03 04 05 06 07 08 09 10 11 12 13 14 15 16 17 18 19 20
Index
500
1 500
2 500
3 500S&P 500 Index
S&P 500 indexS&P 500 weekly returns

A FLIGHT TO SAFETY BY INVESTORS?
24
• During major events, investors tend to increasetheir allocations to government bonds.
• In recent history, this happened during the dot-com bubble, the 9/11 attacks and the subprimecrisis. Since then, with global uncertainty and thepurchasing program launched by the Fed in 2009,bond yields have been pushed down.
• As with previous events, the Coronavirusoutbreak (and more specifically populationlockdowns and the sudden halt of economicactivity) is no exception to the rule. With the fall ofthe stock market, investors are focusing on low-risk assets.
• In order to contain the economic impact of theoutbreak, the central government announced astimulus package of $2 trillion. These extrememeasures should, in the long run, increase thedebt and the deficit of the country. The risks couldthen be much higher for investors and yields maysee upward pressure.
• The yield curve is still positive, and the differencebetween short-term and long-term bonds is evenincreasing. This is still a normal situation asinvestors are better compensated for a greaterrisk.-2
-1
0
1
2
3
4
5
00 01 02 03 04 05 06 07 08 09 10 11 12 13 14 15 16 17 18 19 20
Government Bond Yields at Different Maturity
U.S Yield curvebps
Sources: Macrobond, BNP Paribas Real Estate.
0%
1%
2%
3%
4%
5%
6%
7%
8%
00 01 02 03 04 05 06 07 08 09 10 11 12 13 14 15 16 17 18 19 20
30 Year10 Year7 Year6 Year5 Year4 Year3 Year2 Year1 Year
Spread between three-month and 10-year US Treasuries

REAL ESTATE PERSPECTIVES

REAL ESTATEPERSPECTIVES
COMMERCIAL REAL ESTATEINVESTMENT MARKETS

• After record year 2019, investment was still buoyant in early 2020. Q1 2020 set a new all-time high for commercial real estate investment in Europe for a first quarter. €67bn was invested, which represents a 40% increase vs Q1 2019, 25% higher than the 5-year-average.
• With the Covid-19 pandemic hitting Europe from mid-March, most European investment markets have experienced a slowdown in their activity.
COMMERCIAL REAL ESTATE INVESTMENT
27
EUROPE – Q1 2020
€67bn+40% vs 2019
G E R M A N Y
U N I T E D K I N G D O M
F R A N C E
N E T H E R L A N D S
I T A L Y
S P A I N
P O L A N D
I R E L A N D
B E L G I U M
C Z E C H R E P U B L I C
L U X E M B O U R G
R O M A N I A
Q1 2020 vs Q1 2019
Source: BNP Paribas Real Estate.
≥ €10bn
€5-10bn
€2-5bn
18.6GERMANY
7.5FRANCE
16.0UNITED KINGDOM
3.7SWEDEN
3.0NETHERLANDS
1.7ITALY
2.7SPAIN
1.8NORWAY
1.7POLAND
0.5IRELAND
1.5FINLAND
0.4AUSTRIA
0.6DENMARK
0.3SWITZERLAND
2.1BELGIUM
0.3LUX.
0.3CZECH REP.
2.6PORTUGAL
0.2SOUTH EAST EUROPE
0.1HUNGARY
0.1BALTICS
0.1ROMANIA
0.1SLOVAKIA
€1-2bn
€0.5-1bn
< €0.5bn
+68%
+46%
+21%
*excludes residential investment
+19%
+69%
+138%
+106%
+419%
-9%
-60%
-4%
=
1 2 3 4 5 6 7 8 9 10 11 12 13Weeks
Cumulative CRE investment in Europe in 2020
A G O O D S T A R T B E F O R E L O C K D O W N

CAPITAL MARKET OUTLOOK
28
Investment to slow dramatically in 2020 • The Covid-19 outbreak begun to take a gradual toll on European investment volume
from mid - March 2020, as most countries begun to shut down parts of their economy. Atthe early stage of the outbreak, measures such as travel restrictions and cancellation oflarge events were swiftly taken by companies resulting in a dramatic reduction in face-to-face meetings, site visits, etc. The subsequent implementation of populationlockdowns in many European countries made trading even more difficult, in the lastfew weeks of the first quarter.
• Recently released data shows that most European markets saw a decent level ofinvestment activity in Q1 2020, with investment volumes in some countries evenexceeding that achieved during the same period in 2019. That said we think Q2 and Q3will certainly see significant falls in transaction volumes as the aftereffect of lockdownbegins to bite. While Q4 might see investors return to the market, it will not be sufficient toreverse the decline. Therefore we see overall investment volume in 2020 falling,significantly, by about 45% across Europe. This is similar to the fall seen in the first yearpost GFC; although the market went on to fall further in the following year, we think thistime round will see a swift bounce back in 2021, as the pandemic recedes towards the endof the year.
The investment market is still working despite severe external difficulties, but finance is hard to get and cash is increasingly king
• Both buyers and sellers have adopted a wait and see attitude, until the market has morevisibility on when the current situation is likely to end. We are seeing sellers holding on totheir assets, but buyers are also cancelling or postponing some deals. Nonetheless,some negotiations and deals are advancing, especially for good quality assets in coresegments of the markets where buyers may not other wise have the opportunity to acquire.
• But increasingly these are deals which involves good level of equity, and less debt, on thepart of the buyer as banks tighten credit conditions. Banks are growing cautious in financingdeals and are doing so with increased cost and LTVs. As such, cash investors are likely topredominate as opportunities appear.
C R E I N V E S T M E N T M A R K E T
0
50
100
150
200
250
300
07 08 09 10 11 12 13 14 15 16 17 18 19 20
€ bn EUROPEAN INVESTMENT VOLUME

C R O S S - B O R D E R I N V E S T M E N T M A R K E T
CAPITAL MARKET OUTLOOK
29
Cross-border investors likely to reduce activity more than domestic players
• Foreign investment is being affected bythe spread of the outbreak through Europe.Most foreign investors are delaying theirongoing deals until Europe is open again.
• In 2019, foreign investors representedhalf the commercial real estateinvestment in Europe. Foreign investmentin Europe gathered pace in 2019 (+10%)compared to 2018. Foreign inflowsaccounted for half of investment over theyear, i.e. €141bn out of a total €281bn.
• As observed in 2009, the withdrawal offoreign investors from European marketscould benefit domestic investment. Thistrend could be amplified as local investorsare physically closer to the markets.Therefore we might see an increase in theshare of domestic investment in 2020.When market recovery starts, the share offoreign investors should gradually increasebut it could take time to reach pre-crisislevels.
• For domestic investors, this situation couldbe seen as an opportunity to make deals ina less competitive environment.
In Asia, despite the recent improvementsin controlling the covid-19 outbreak, thesituation remains very restrictive. Amajority of Asian investors have adopteda ‘wait-and-see’ approach and arefocusing on the impact on the rental,occupancy and financing aspects of theirinvestments. There is an increasinginterest from Asian investors indistressed assets, especially in the UK,and in real estate listed equities of someEuropean real estate companies forvalue investments.
South Korea has shut schools andissued social-distancing guidelines forthe public, but has not enforcedlockdowns or broad business closures.
Singapore is facing a third wave ofinfections and the Government has takennew restrictive measures includingindividual movements restrictions.
Hong Kong has extended the closure ofvenues and restrictions on publicgatherings for another two weeks.
In the Middle East, most Gulf countrieshave been locked down with curfews formore than four weeks now. The mostrestrictive measures are taken in Kuwaitand Saudi Arabia, followed by Bahrain,the United Arab Emirates and Qatar.The number of infections is on the risebut not to the alarming levels seen inEurope and the United States.
Nonetheless, the impact is being feltacross all economic sectors and thefiscal position of Gulf countries is likely toworsen over the next 12 to 18 months.Demand for new property acquisitions ison the back burner as liquidity shrinks.Most family offices have adopted a ‘wait--and-see’ attitude. However, a fewprivate investors remain on the lookoutfor new investments.
COMMERCIAL REAL ESTATE INVESTMENT IN EUROPETOTAL AND FOREIGN INVESTMENT - VOLUME AND SHARE
52% 57% 41% 39% 48% 50% 47% 48%
305
147
0
50
100
150
200
250
300
350
07 08 09 10 11 12 13 14 15 16 17 18 19 20
Total Foreign€bn

R I S K P R E M I U M T O R E M A I N E L E V A T E D
EUROPEAN PROPERTY YIELDS
30
Limited upward pressure on prime yields, but there may be general upward tensions on secondary segments
• Prime yields have now reached their lowest level on record acrossEurope and before the crisis we were still expecting a furtherdecrease in Prime yields in the core markets.
• After the outbreak, the deteriorating outlook for the occupationalmarkets and restrictive financing conditions means that investorsare likely to demand higher yields. As such we see broad basedincreases in prime property yields across the sectors and in Europe.
• We expected the increase in yields ranging between 10bps inlogistics and 40bps in retail. For offices we are likely to see yieldsincrease by 20bps.
• In our latest forecast, the risk premium between property and riskfree rate was expected to shrink. Now, we are expecting thepremium to increase as uncertainties are high, pushing bondyields lower and property yields higher.
Strong occupier fundamentals to support capital markets
• By comparing the situation before the 2008 crisis and before theCovid-19 outbreak, we can draw two conclusions.
• The first is that the risk premium is still high compared to 2007(22 bps vs 440 bps today).
• The second is the good fundamentals of the market. In 2008,the crisis occurred in an oversupplied market, where the riskpremium was non existent and the vacancy rate was quite high(around 7%). Today, the vacancy rate is lower (5.8% acrossEurope), and we are only expecting a few completions to swell themarket.
3,9%
5,0%
3,8%
3,0%3,5%4,0%4,5%5,0%5,5%6,0%6,5%7,0%7,5%8,0%
07 08 09 10 11 12 13 14 15 16 17 18 19 20
OfficeLogisticsRetail
EUROPEAN PROPERTY YIELDS BY SECTOR (UNWEIGHTED AVERAGE)
050
100150200250300350400450500
07 08 09 10 11 12 13 14 15 16 17 18 19 20
PROPERTY YIELD SPREAD OVER GERMAN BUNDS (RISK PREMIUM AVERAGE)
bps

T W O O P P O S I T E E F F E C T S A T P L A Y
CAPITAL MARKET INSIGHT
31
17 21
133123
133 136
0
20
40
60
80
100
120
140
160
0
50
100
150
200
250
300
350
00 01 02 03 04 05 06 07 08 09 10 11 12 13 14 15 16 17 18 19
REAL ESTATE FUNDRAISINGReal Estate fundraising
Dry Powder
A huge amount of liquidity coming into the market
• Around €1.3bn of bonds are going to mature in the next threeyears for the three main countries in Europe (France, UK andGermany).
• Given current uncertainties and the flight-to-safety in themarket, the majority of bonds are now in negative territory.We can then assume that a part of the liquidity available may beredirected toward real estate.
• Moreover, total real estate fundraising exceeded €136bn in2019 which was an all-time high. The level of deals did notexceed the 2018 record but activity was still highly positive. As aresult, dry powder decreased in 2019.
• Dry powder is the amount of money raised that has not beeninvested by real estate funds. We can expect that a certainamount will be invested in 2020.
The denominator effect may disrupt the investment market
• As stock prices are falling the value of investors’ portfolios isdecreasing. As a result, the percentage actually invested inreal estate (11.2% in Europe) is rising.
• As a result, a number of institutional investors or funds willhave to re-evaluate their real estate strategies in the comingmonths as they will become over-allocated to the other assetclasses (stocks, bonds, etc.). Currently, the wait-and-seeattitude seems to be prevailing over panic selling.
11,2 11,9
0
5
10
15
20
France Germany UK Italy Netherlands Sweden Finland Europe
ASSET ALLOCATION TO DIRECT REAL ESTATECurrent Allocation
Target Allocation
%
€ bn€ bn
Sources: Preqin, BNP Paribas Real Estate.

R E I T S T O T A L R E T U R N S A S A N I N D I C A T O R
CAPITAL MARKET INSIGHT
32
0
500
1 000
1 500
2 000
2 500
3 000
3 500
4 000Retail Office Healthcare
Industrial Residential All sectors
Healthcare
Industrial
Office
Residential
All sectors
Retail
-60% -50% -40% -30% -20% -10% 0% 10% 20% 30%
EUROPEAN REITS TOTAL RETURNS INDEX
EUROPEAN REITSYEAR-TO-DATE TOTAL RETURNS
REITS have not been immune to the widespread market sell-off
• Covid-19 has already shattered real estateinvestment trusts in Europe, as some of themhave had to shut down hotels, shopping centres,retail units and other properties to stop the spread ofthe virus. As a result, European indices have beenfalling since the beginning of 2020, mostly from thethird week of February.
• The retail sector has been struggling since 2015and is the sector hardest hit by the spread of thevirus. A significant share of retailers have alreadyasked for rental holidays. Some have simply refusedto pay altogether. This is having a negative impacton rent collection and on performance.
• Industrial and logistics REITs still displaypositive annual total returns. The current situationis also demonstrating the importance of the supplychain and a need for space is expected to increaselocal production and the level of inventories forstrategic goods. The sector is the main beneficiaryof the accelerated shift towards ecommerce andlast-mile logistics.
• The renegotiation of leases and the long-termstrategies of companies to repair their balancesheets (freezing new hires at best, or cutting theirworkforces) are the main risks at the moment forOffice REITs.
• The healthcare sector is the best performer. Thisreflects the sector’s crucial role in fighting thepandemic, and occupancy levels in care homes areholding up.
Sources: FTSE EPRA NAREIT Europe, BNP Paribas Real Estate.

REAL ESTATEPERSPECTIVES
OFFICEMARKETS

W E S E E S I G N I F I C A N T F A L L I N D E M A N D F O R 2 0 2 0
OFFICE OCCUPIER MARKETS
34
Speeding-up of take-up decrease
• We are likely to witness a significant decrease in take-up for 2020,particularly during Q2 and Q3. Most deals that were due to besigned in Q1 managed to be concluded as they were too far in theprocess to be stopped; however deals due to conclude in Q2 and Q3are either suspended or cancelled. This is true across most Europeanmarkets and will have a significant impact on the overall take-upin the European markets in 2020, where it could fall by as muchas 41%.
• The fall in take-up is likely to be more severe than the peak totrough during the 2007 – 2009 crisis, because corporate balancesheets will be the epicentre of the current economic downturn.This will weigh on employment growth and occupier activity. We seeunemployment rate rising sharply in most European markets. Howeversome markets may be less impacted than others depending on theeconomic measures put in place to support job retentions. Forexample in Germany the “kurzarbeit” scheme has been a long termand a generous programme that could more limit the rise inunemployment, than the less generous schemes in the southernEuropean markets.
• As such the timing and how long the occupier downturn prevails willalso differ among markets. In Italy, one of the earliest hard hit countryin Europe, the effect might be seen earlier than in the rest of thecontinent. In Central London, the first provisional figures for Q1 2020show a -22% dip in office demand y.o.y. while the main German citiesmight see a decrease in take-up ranging from -5 to -15% in 2020.
• The recovery is expected to begin at the end of 2020. The impacton the office market will depend on how fast market activity canrecommence once the virus has come under control.
OFFICE TAKE-UP (25 cities in Europe)
Million sqm
10,1
14,0
9,1
10,1
14,3
7
8
9
10
11
12
13
14
15
04 05 06 07 08 09 10 11 12 13 14 15 16 17 18 19 20
10-year average (2009 – 2019)

F U N D A M E N T A L S R E M A I N S T A B L E G O I N G I N T O T H E P A N D E M I C
OFFICE OCCUPIER MARKETS
35
Controlled increase of the vacancy in most markets
• The vacancy rate has been falling continuously since the last financial crises in 2009 and hadprobably reached its floor at the end of 2019. In almost all markets, the vacancy rate at theend of 2019 was well below its 5-year average. As a result, most of the European marketssaw a rise in the volume of space under construction. Before the covid-19 crisis, we expected aslight increase in vacancy as a result of this new supply and the release of second-handbuildings as the demand for new offices was stronger than ever. We now expect this increase invacancy to be more than what had been anticipated.
• By the end of 2020 we are likely to see overall vacancy rate rise by 110bps, from 5.0% atthe end of 2019 to 7.0% by the end of 2020. This is likely to continue through to 2021, aslarge corporates continue to repair their balance sheets and therefore either stop hiring, at best,or cut workforce.
• However, some markets, where vacancy rates have been at historic lows, will be betterplace to absorb the increases in vacancy. Such markets include the German cities (Berlin,Munich and Hamburg), Vienna and Paris inner-city. In these markets the vacancy rate willremain below 5% by the end of 2020. Moreover we do not expect any significant increase inmost CBDs of key European cities, where supply remains extremely limited.
• Additionally, due to the current situation, a series of speculative schemes might bepostponed, even cancelled, until the market gets back to normal. Consequently the rise invacancy should remain limited for years to come although the situation will vary a lot throughoutEurope.
OFFICE VACANCY(25 cities in Europe)
5,9%
7,0%
4%
5%
6%
7%
8%
9%
10%
11%
12%
08 09 10 11 12 13 14 15 16 17 18 19 20
0%2%4%6%8%
10%12%14%16%
Vacancy rate - Q4 2019 Increase in vacancay rate - Q4 2020

E X P E C T E D I M P A C T O N R E N T S
OFFICE OCCUPIER MARKETS
36
Solid fundamentals in support of values
• It is note worthy that the European marketsentered the crisis with very strong occupierfundamentals, low development and lowvacancy rate in numerous markets. This meansthat the implication of vacancy increases onrental growth will be limited on the whole, butvaried across markets.
• The vacancy rate in the European CBDs wasextremely low at the end of 2019 due to a veryhigh demand from occupiers for prime assetslocated in the best business districts.Availability in the largest European CBDswas extremely low compared to the pace oftake-up. As a result, prime rental values havebeen experiencing a continuous and importantgrowth over the last years everywhere in Europe.Overall prime rent across Europe has risenby +34% since reaching the trough in 2009.We anticipate that the limited increase invacancy will result in a more than 2.0% decreasein prime rents across Europe in 2020.
Very few changes in rents expected especially in CBDs
• Even though the CBDs should maintain highrental values, the slowdown in take-upexpected in the wake of the epidemic is likely
to drive the average rents downward in thedistricts where the structural vacancyremains high.
• For instance in the periphery of some marketssuch as Milan and Madrid, or in submarketswhere supply under construction is currently at ahigh level, for instance La Défense, rents couldbe adjusted. On the other hand, marketsexperiencing a structural lack of supply are morelikely to resist and to avoid seeing a decrease inrents. For example in Berlin where we hadpreviously anticipated a strong rental growth in2020, this is now likely to remain pretty flat.Other markets like Paris and Munich shouldexperience very few adjustments in headlinevalues for months to come.
Likely upward pressures on incentives
• Another effect could be seen on the net effectiverents. Landlords might offer (and occupiers willdemand) increased rent-free periods to getdeals through. This is likely to become anincreasing theme across Europe, throughout H22020 when companies recover. Hence the gapbetween net effective and headline rents is likelyto increase.
EUROPEAN PRIME OFFICE RENTAL INDEX (unweighted, 36 Cities)
98
128
125
90
95
100
105
110
115
120
125
130
135
07 08 09 10 11 12 13 14 15 16 17 18 19 20
Index, 2012 = 100
+ 34%
- 2%

0
50
100
150
200
250
Berlin Frankfurt Hamburg Munich Paris London Warsaw Milan Madrid Brussels Amsterdam
Risk premium between Average and Prime initial yields(2015-2019)
Maximum
2019
Minimum
A H I G H R I S K P R E M I U M T O A B S O R B S H O C K
OFFICE INVESTMENT MARKETS
37
Few changes in prime yields but there may be general upward tensions on secondary segments
• Investors should be focused more than ever on Prime locationsand the pressure on Prime yields may still be strong after the crisis.
• For average yields, although we were expecting a compressionbefore the Covid-19 outbreak, our forecast may change and weshould see a wait-and-see attitude from investors untilrestrictions are lifted.
• In our latest forecast, the risk premium between core and non coreassets was expected to shrink. Now, we are anticipating thepremium to increase as uncertainties are high and relocationstrategies are likely.
5%6%7%8%9%10%11%
0%1%2%3%4%5%6%7%
07 08 09 10 11 12 13 14 15 16 17 18 19
Risk premium and Vacancy rate in Europe Risk Premium (lhs)Prime Yields (lhs)Vacancy Rate (rhs)
bps
Source: BNP Paribas Real Estate.

REAL ESTATEPERSPECTIVES
RETAILMARKETS

E X P E C T E D I M P A C T O N P H Y S I C A L S T O R E S
RETAIL OCCUPIER MARKETS
39
Unprecedented challenges for all retailers
• Most retailers are operating stores generating no revenues and hence creating cash-flowsissues: retailers with the strongest balance sheets and least debt stand out as the bestarmed ones to handle the situation.
• Non-food retailers are facing drops in demand and even no demand for many becauseof the lockdown, whereas grocery retailers are managing significant supply challenges. Inaddition, retailer share prices have dropped significantly with falls of 30% on average forthe large ready-to-wear retailers (Inditex, H&M, Nike, Adidas, Ralph Lauren, Abercrombie)since end January 2020.
• In contrast, food stores and supermarkets are generally still open, and experiencingsustained but lower activity. In such a context, food retailers (like Carrefour, Tesco,Casino) have experienced only a slight decrease in share price (approx. -5%*),outperforming the whole stock market (-23% for Euro Stoxx 50*). Moreover, shops likesupermarkets can also benefit from their non-food good offer while specialized stores areclosed.
*From the close of 31.01.2020 to the close of 15.04.2020
Rental levels in prime locations likely to see least change
• Prime rents are the ones likely to see the least important changes in the immediate future formost European main cities. Downward adjustments could be recorded in somesecondary locations. All in all, gaps will certainly be reinforced between prime andsecondary locations in terms of rents and vacancy, as this pattern has already beenobserved in the past five years. Furthermore, rental levels will depend on the level ofbankruptcies: the more bankruptcies that occur, the fewer replacement tenants areavailable, creating yet more pressure on rental levels and vacancies.
Recovery in retail may be gradual and subject to careful planning
• With the current decline in turnovers and footfalls in Europe, the retail industry isworking on possible scenarios for resuming activity. However, recovery may be gradual,depending on domestic household confidence about their health safety following thepandemic and their own income situation. Further growth factors include the reopening ofinternational tourism, although that is subject to a large delay effect (through travel planning)and caveated by possible weakened purchasing power.
• In China, recovery appears to be gradual and slow, restrained by health protectionmeasures. In the first week with all stores open in China (ie the last week of March), H&Mscored a 23% drop in sales compared to the prior year. Retailers are expecting more a U-shaped recovery than a V-shaped recovery. Furthermore, due to economic uncertainty anda decrease in purchasing power for those who lost their jobs, the recovery in consumptionwill go first to essential and functional goods. Once again, fashion may not be a priority.
• With high streets shut down and a large proportion of the population working from home as aresult of COVID-19, there may be a greater appreciation for local communities and thevital role that retail plays in everyday life when normality eventually resumes.

A N E C E S S A R Y P A R T N E R S H I P B E T W E E N R E T A I L E R S A N D L A N D L O R D S
RETAIL OCCUPIER MARKETS
Difficulties are greatest for the most fragile sectors
• Many retail businesses that have entered administration in recent weeks were already struggling prior tothe pandemic. Further retail casualties may follow, with fashion, department stores and F&B* especially atrisk. In what was already a fragile retail market, we expect to see a number of administrations andbankruptcies over the coming months, while some occupiers are likely to be forced to close units as amean to streamline their store network. They will re-open with fewer stores once restrictions are lifted,having closed those where there is a break or lease expiry within 12 months. This will leave landlords withrental voids and rates / service charge shortfalls.
Occupiers are seeking for support measures from landlords
• Main support measures can range from:o Monthly rather than quarterly rental payments: Wereldhave France, Carmila (France, Spain, Italy) and
Eurocommercial Italy have currently adopted this solution.o Rent deferral, until the June quarter is due, or repayable over 18-24 months once stores reopen.o Rent deferral until the end of the lease – i.e. lease is extended by the deferred amount.o Rent holiday, but with a lease term extension from tenants in return.o Rent holiday and then a possible lower rent going forward, in some cases turnover related. We see this
becoming more prevalent for fashion occupiers, particularly in shopping centres.
• Other easing measures can be observed: Value Retail, which manages nine luxury outlets centres acrossEurope, has waived all charges in the second quarter in an effort to help its retail brand partners throughthe coronavirus crisis.
40

A N E C E S S A R Y P A R T N E R S H I P B E T W E E N R E T A I L E R S A N D L A N D L O R D S
RETAIL OCCUPIER MARKETS
Information, dialogue and cooperation between landlords and tenants
• At the end of March, UK shopping centre giant Intu said it had received just 29per cent of rents due this month while Hammerson received 37 per cent of theUK rent billed for the second quarter.
• A case-by-case approach may be adopted by many landlords (Hammerson,URW) taking into account the business model and risk profile of the occupier,alongside the aid made available by the relevant governments.
• The need for communication and close collaboration between landlordsand tenants appears more than ever essential.
A Code of Conduct for the retail industry is a first in German history
• After Australia has regulated relations between retail landlord and occupiersunder the Covid-19 situation by a code of ethics, Germany is the secondcountry to follow and adopt a similar protocol. Under the guidance of theGerman Council of Shopping Places (GCSP), renowned representatives ofthe retail industry formulated a Code of Conduct as a common guideline fordefining the rules of conduct between landlords and tenants in thecommercial property industry for the period of the Covid-19 crisis. This aims toestablish fair and cooperative dealings, on an equal footing, to ensurebalanced burden sharing. The Code of Conduct covers the entirety of theGerman retail, service, gastronomy and retail real estate industries andproposes a framework for negotiations during the crisis, especially for small andmedium-sized tenants.
41

E X P E C T E D A C C E L E R A T I O N O F T H E G A P O F V A L U E S B E T W E E N T O P P R I M E A N D S E C O N D A R Y A S S E T S .
RETAIL INVESTMENT MARKETS
42
Shopping centres and retail parks
• Measures from landlords for suspension orcancellation of rent payments plus governmentassistance will be vital for the vast majority of retailers.Some of main European retail landlords have alreadyannounced rent free periods during the lockdown.Others are dealing with this on a case-by-case basis.
• In terms of how investors are reacting, most buyers ‘waitand see’ with deals processes slowing down, put on holdor at worse, cancelled.
• In the shopping centres sub-segment, opportunistictransactions might be registered after the crisisrecedes. Depending on how long and deep the crisis is,a higher risk premium could be offered on the market.
• Repricing for shopping centres and retailwarehouses should accelerate, especially for non-coreassets, providing opportunities for investors. This trendwill depend on the leverage financing facility which iskey for all value-added and opportunistic investors.Investors shall be more attracted by assets with financingfacilities in place.
• All in all, liquidity and likely repricing will stronglydepend on the asset quality (location, turnover, vacancyand footfall).
Prime high-streets will endure
• Prime locations are expected to suffer less fromthe Covid-19 impact than the secondary locations.Liquidity for prime assets should remain stableand only a slight adjustment in prices is expected inmain high-street locations.
• For secondary locations, a more notable decreasein values is expected to reflect demand levels. Someinvestors may take the opportunity to (re)enter retailmarkets if decompression of prime yields occurs insome locations.
• Prime locations having already faced other seriousevents in the past (sovereign debt crises, terroristattacks, strikes) are likely to demonstrate theirstrong resilience in theses circumstances again.
On the listed sector, all retail REITs have been hit over the last few weeks, losing generally between 40 % and 60% of their value.
Dividend payments might be scaled down by some REITS.
-36%-39%
-46%-46%
-53%-58%
-60%-61%-61%
-71%
-80% -60% -40% -20% 0%
MercialysCarmilaAltareaKlépierreDeutsche EuroShopUnibail (URW)WereldhaveEurocommercial P.IntuHammerson
Main European Retail REITS share-price has dropped since the end of January (%)
Data of April 15Represents change in share-prices from the close of 31.01.2020
to the close of 15.04.2020

E X P E C T E D I M P A C T O N O N L I N E S A L E S
E-COMMERCE
43
Low consumption confidence and supply chains issues
• E-commerce channel has also been hit, although to a lesser extent than physical stores of course, as consumers have shown increasingcaution with their disposable income and low consumption confidence.
• Pure players and food e-retailers are focusing on delivering essential products. Overall, delivery delays are now much longer than usual dueto a surge in demand and supply chain disruptions.
• Delivery’s issues, like closure of collection points, and safety of employees and customers, forced some e-retailers to suspend their activity.
• In physical stores, half of European e-retailers are currently dealing with or are soon expecting oversupply issues due to the Covid-19 crisis,according to Ecommerce Europe1. Fashion industry, luxury goods, cosmetics and travel related products are particularly impacted.
Mixed impact depending on category of goods
• Whereas online sales are still allowed in all European countries, only three countries (Spain, Belgium, Austria) indicated that the crisishad a positive effect on online sales according to a survey conducted in 13 countries by the European online sales confederation,Ecommerce Europe2.
• Increasing online sales have been of more benefit to mass-market than premium and luxury brands which are typically associated withphysical stores (providing personalized shopping experience to customers).
• Certain categories such as electrical, gym and garden equipment have increased online sales as households find new ways of spendingtime home, but online sales of fashion and big-ticket items like furniture are benefitting less as consumers cut back on non-essential spendingoverall at a time of economic uncertainty.
1. Survey conducted by Ecommerce Europe between 31 March and 2 April.2. Survey conducted by Ecommerce Europe between 24 March and 27 March.

E X P E C T E D I M P A C T O N O N L I N E S A L E S
E-COMMERCE
44
Gain appears relatively limited for online retailers
• Online services (travelling, leisure) are severely impacted. However, streaming services (like Netflix, AmazonPrime Video, Disney Plus) currently benefit from the social distancing that's being encouraged or imposed bygovernments around the world. Streaming-app downloads are surging in most European countries.
• Population consumption patterns could change (but no one knows in what extent at this stage) in terms ofphysical/online purchasing once lockdown measures will be over. For example, the possibility remains that a part ofthe population, especially the elderly, will have discovered the internet by ordering food delivery services or cultural e-services (delivery of books), that may benefit some retailers. Online is also a support mechanism channel as longas fear of social contact persists.
• The e-commerce channel lacks the structural capacity to take advantage of the situation and it is unlikely to seerevision upwards to the E-Commerce Foundation’s forecast annual growth of 14.0% in Europe. On the other hand,some people speculate the channel will gain strength under the transition / recovery period to come.
A multichannel model more appropriate than ever
• It is therefore a mixed picture for online retail, and if anything, COVID-19 reinforces the importance of having amultichannel model where online and bricks-and-mortar seamlessly interact and where the whole is greaterthan the sum of its parts.
• Furthermore, the Covid-19 crisis has not changed the loss-making character of the online business underliningthat the multichannel model is the only one economically worse at long-term.
• Showing this close connection between physical and online retail, Unibail-Rodamco-Westfield Germany has beenentered into strategic cooperation with Zalando in the Connected Retail programme. This partnership enables toreach new customers through Zalando and improve inventory turnover among participating brands. The cooperationhas been launched early in order to cope with the considerable challenges faced by the retail sector due to theCOVID-19 crisis. As a result, stationary retailers in the shopping centres operated by URW in Germany are nowprovided with an additional sales channel for their products.

Food stores / essential goods(1)
Non-food stores / non-essential goods Shopping centres(2) Restaurants and bars Re-openings
France Possibly from 11.05 for some activitiesTo be clarified later by Government
UK
Germany From 20.04: stores smaller than 800 square metersFrom 04.05: hair salons
ItalySince 14.04:Small stores for children / babies clothingLibraries and Stationary shops
Spain
Portugal
Ireland
Belgium From 20.04: DIY and gardening stores
Netherlands
O N L Y F O O D S T O R E S A R E A L L O W E D T O O P E N I N M O S T E U R O P E A N C O U N T R I E S B U T T H E F I R S T R E - O P E N I N G S A R E A N N O U N C E D
RETAIL OPENINGS / CLOSURES ACROSS EUROPE
45
(since 15.03) (since 15.03) (since 15.03)
(since 24.03) (since 24.03) (since 20.03)
(since 16.03) (since 16.03) (since 16.03)
(since 11.03) (since 11.03) (since 11.03)
(since 15.03) (since 15.03) (since 15.03)
(since 14.03)(since 17.03)(since 17.03)
(since 15.03)
(since 18.03) (since 18.03)
(since 24.03)
As of April 16th
Retail activities not allowed to openRetail activities allowed to open with restrictionsRetail activities allowed to open(1) Including tobacco shops, newspaper agents, pharmacies, and pet shops.(2) Even if shopping centres are closed, food and essential stores inside themcan open most of the time.

Food stores / essential goods(1)
Non-food stores / non-essential goods Shopping centres(2) Restaurants and bars Re-openings
Poland
Czech Rep.Since 9.04: DIY stores, bicycle shops, household goods storesFrom 27.04: shops under 200 square meters
Sweden
Norway
Denmark
Finland
Latvia
Lithuania
Estonia
I N T H E N O R D I C S , M O S T R E T A I L S T O R E S A R E S T I L L A L L O W E D T O O P E N
RETAIL OPENINGS / CLOSURES ACROSS EUROPE
46
(since 14.03)
(since 14.03) (since 14.03)
(bars partiallyclosed)
(since 18.03) (since 18.03)
(since 16.03)(since 16.03)
As of April 16th
Retail activities not allowed to openRetail activities allowed to open with restrictionsRetail activities allowed to open(1) Including tobacco shops, newspaper agents, pharmacies, and pet shops.(2) Even if shopping centres are closed, food and essential stores inside themcan open most of the time.
(since 27.03)
(bars closed, restaurants take-away only)

REAL ESTATEPERSPECTIVES
LOGISTICSMARKETS

T H E C O V I D C R I S I S I S R E S H A P I N G T H E L O G I S T I C S M A R K E T
LOGISTICS WAREHOUSING MARKET IN EUROPE
48
Logistics organisation could see transformation in the longer term
• As an alternative to holding more inventory in response tosupply chain disruptions, companies could establish acompressed logistics network that minimize distribution costsand move goods faster. Thus the need to optimize the supplychain will remain a strong driver for future take-up of logisticsspace, particularly at the local and regional levels.
• In recent years a large part of demand for space in the sectorhas been driven by warehouses for the storage anddistribution of finished goods manufactured much furtheraway. The current situation could lead companies to on-shore part of their manufacturing processes. As such we seeincreased long term demand for industrial space as a basefor manufacturing, altering the nature of some of the spacerequired.
The outbreak may promote the penetration of e-commerce
• A key segment of the logistics market that is benefiting fromincreased demand is the e-commerce sector, on the back ofrestrictions on movement now in place in most countries.Moreover, we think that in the medium to long term changesin consumer behaviour could normalise on-line shopping. Itwill help increase the penetration of e-commerce in marketswhere this has been limited so far, further boosting demandfor logistics space.
The logistics property market is disrupted by the Covid crisis
• Take-up is going to plummet in the next few monthssince most of lease signatures are delayed, eventhough not necessarily cancelled.
• Vacant space is expected to increase generating adownward pressure on rents.
• Yet, logistics has become clearly crucial and visibleto everyone as key to provide basic needs bymaintaining essential supplies, food, medicalequipment and pharmaceuticals.
• Most markets are now at a standstill due tocontainment, but investors and occupiers are activelypreparing the exit from the crisis.
Distribution Centres
Fulfilment Centres
Cross-Docking
Cold Storage
Last Mile

M O S T M A R K E T S A R E A T A S T A N D S T I L L
LOGISTICS EUROPEAN OCCUPIER MARKET
49
Occupiers are putting commitments on hold in the immediate term
• Inspections on site are not possible inmost countries due to containment andthe lack of staff in administrationalpositions is slowing down every processassociated with property development andacquisition.
• Stocks are significant in shops, inwarehouses and in ports; ships are evenkept at sea. This crisis has created anunprecedented phenomenon where someusers have had to rent some space withvery short-term leases to collect goodsaccumulated in ports. Yet, this remainsmarginal in the overall logistics activity.
Most markets are at a standstill
• Until Covid lockdowns occurred, theEuropean market reached outstandingvolumes of transactions boosted by astrong demand for owner-occupierdevelopments.
• Currently, negotiations are disrupted thuscreating delays in developments.
• This is further exacerbated by thedifficulties getting new construction toproceed in most countries due to the lackof available workers and thecomplications of obtaining raw materials.
• One clear outcome for 2020 is that theoutstanding letting records of the past 3years are behind us for a while.
181
94 86 84 84 82 82 74 65 58 57 55 52 48 44 43
255075
100125150175200
€/m²/yearQ4 2013 Q4 2019 Range 2007-2019
LOGISTICS HEADLINE PRIME RENTS
Supply will increase despite slowdown in the construction of new
warehouses
• A slowdown in new developments isoccurring from the disruptions created bycontainment in most European countries.
• Financing new projects is expected to bemore difficult since banks are tighteningtheir lending criteria. This will stronglyimpact new speculative developments ina context of increased risk aversion.
• Supply will increase as second handspace is released.
• The crisis is affecting all businesses andsome will be downsizing or shut down:their warehouses will be released andput back on the market.
Rents are expected to drop with anticipation of increased vacant
space
• Currently the impact on rents from Coviddisruption is negligible, but with releaseof space into the market, we expect anoverall downward pressure on rents toappear.

2,60%3,50%
2,80% 3,10% 3,25% 3,25% 3,00%4,00%
3,30%4,50%
3,70% 4,00% 4,00% 4,30% 4,80% 4,90% 5,00% 5,00% 5,25% 5,75%
-1%0%1%2%3%4%5%6%7%
Germany UK France Netherlands Sweden Spain Finland CzechRepublic
Italy Poland
Office Logistics 10 yr Gvt bonds
A B R I G H T S P O T
LOGISTICS EUROPEAN INVESTMENT MARKET
50
Logistics property remains attractive for investors• From an investment point of view the logistics and Industrial sector
remains a bright spot as demand for space remains solid from sectorsthat are beneficiaries of the COVID crisis. Even so, we can anticipatelower investment volumes in the industrial sector due to theobstructions to deal negotiations.
• Because of more secure income generation, logistics investment isexpected to remain quite resilient: the fall in volumes will probably beless than seen for other asset types.
Hubs with global exposure are more vulnerable • In the short term, reduced global trade flows arising from the pandemic,
will impact demand for logistics property at the ports (both sea and air)through reduced utilization. Investment interest is unlikely to abate as inthe medium to long term we see little waning in occupier demand forlogistics space in these locations .
• E-commerce could emerge from the situation stronger with increasedpenetration in more countries globally. This could provide further boostto demand for space at ports, especially airports, as they allow fasterdelivery from long distance.
Prime yields are likely to stay stable• Going forward we will see increased divergence in the performance of
different logistics segments.
• Depending on the risk profile of the investor, the yield gap will widen.
• Prime yields are likely to be stable across Europe. Average yieldsthough, are expected to increase given a context of tightened financingconditions and growing risk aversion.
• Repricing will depend more on how marginal the fundamentals are:location, state of the building and prevailing rental conditions.
NET PRIME YIELDS (1st January 2020)
