covid-19 clinical hospital surveillance report
TRANSCRIPT
28 SEPTEMBER 2021
COVID-19 CLINICAL HOSPITAL SURVEILLANCE REPORT
Sciensano
Epidemiology and public health – Epidemiology of infectious diseases
September 2021 • Brussels • Belgium
–
M. VANDROMME, R. DE PAUW, B. SERRIEN, J. CHUNG, N. VAN GOETHEM, K. BLOT
TABLE OF CONTENTS TABLE OF CONTENTS .................................................................................................................................................3 KEY FINDINGS ...............................................................................................................................................................4 TRENDS OV ER TIM E.....................................................................................................................................................6
1. INTRODUCTION .....................................................................................................................................................7 2. HOSPITALIZED PATIENTS.................................................................................................................................11
2.1. HOSPITA L AT A GLANCE .............................................................................................................................11 2.2. HOSPITA LIZED PA TIENT DEMOGRA PHICS..............................................................................................12 2.3. PA TIENT PROFILE ........................................................................................................................................19
3. PATIENTS IN INTENSIV E CARE (ICU) ..............................................................................................................29 3.1. ICU A T A GLANCE .........................................................................................................................................29 3.2. ICU PA TIENT DEMOGRA PHICS ..................................................................................................................30 3.3. PROFILE OF ICU PA TIENTS ........................................................................................................................35
ACKNOWLEDGEM ENTS ............................................................................................................................................41
KEY FINDINGS
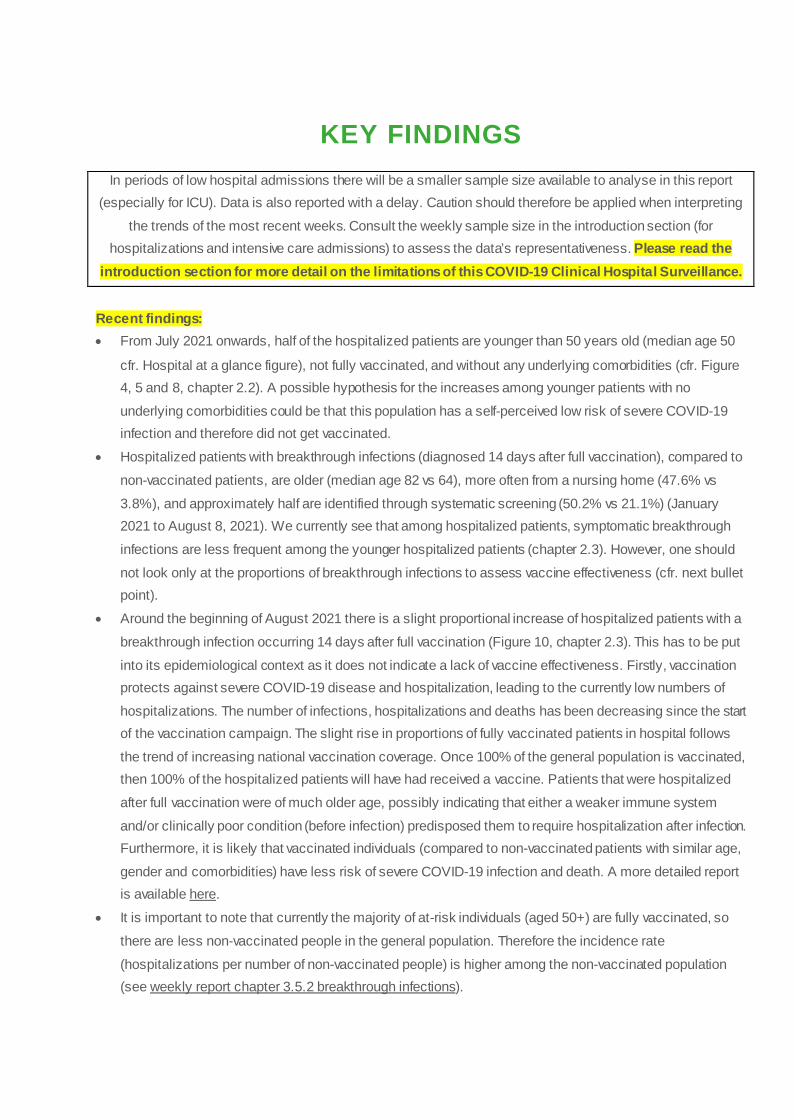
In periods of low hospital admissions there will be a smaller sample size available to analyse in this report (especially for ICU). Data is also reported with a delay. Caution should therefore be applied when interpreting
the trends of the most recent weeks. Consult the weekly sample size in the introduction section (for hospitalizations and intensive care admissions) to assess the data’s representativeness. Please read the
introduction section for more detail on the limitations of this COVID-19 Clinical Hospital Surveillance. Recent findings: • From July 2021 onwards, half of the hospitalized patients are younger than 50 years old (median age 50
cfr. Hospital at a glance figure), not fully vaccinated, and without any underlying comorbidities (cfr. Figure 4, 5 and 8, chapter 2.2). A possible hypothesis for the increases among younger patients with no underlying comorbidities could be that this population has a self-perceived low risk of severe COVID-19 infection and therefore did not get vaccinated.
• Hospitalized patients with breakthrough infections (diagnosed 14 days after full vaccination), compared to non-vaccinated patients, are older (median age 82 vs 64), more often from a nursing home (47.6% vs 3.8%), and approximately half are identified through systematic screening (50.2% vs 21.1%) (January 2021 to August 8, 2021). We currently see that among hospitalized patients, symptomatic breakthrough infections are less frequent among the younger hospitalized patients (chapter 2.3). However, one should not look only at the proportions of breakthrough infections to assess vaccine effectiveness (cfr. next bullet point).
• Around the beginning of August 2021 there is a slight proportional increase of hospitalized patients with a breakthrough infection occurring 14 days after full vaccination (Figure 10, chapter 2.3). This has to be put into its epidemiological context as it does not indicate a lack of vaccine effectiveness. Firstly, vaccination protects against severe COVID-19 disease and hospitalization, leading to the currently low numbers of hospitalizations. The number of infections, hospitalizations and deaths has been decreasing since the start of the vaccination campaign. The slight rise in proportions of fully vaccinated patients in hospital follows the trend of increasing national vaccination coverage. Once 100% of the general population is vaccinated, then 100% of the hospitalized patients will have had received a vaccine. Patients that were hospitalized after full vaccination were of much older age, possibly indicating that either a weaker immune system and/or clinically poor condition (before infection) predisposed them to require hospitalization after infection. Furthermore, it is likely that vaccinated individuals (compared to non-vaccinated patients with similar age, gender and comorbidities) have less risk of severe COVID-19 infection and death. A more detailed report is available here.
• It is important to note that currently the majority of at-risk individuals (aged 50+) are fully vaccinated, so there are less non-vaccinated people in the general population. Therefore the incidence rate (hospitalizations per number of non-vaccinated people) is higher among the non-vaccinated population (see weekly report chapter 3.5.2 breakthrough infections).

• The slightly higher proportion of hospitalized patients with a breakthrough infection may be associated with the discrete proportional increase of 80+ year olds and nursing home residents (cfr. Figure 4 and 9). Nursing home outbreaks among this vulnerable population could lead to witnessed changes in the hospital epidemiology. These trends should be followed up.
• The proportion of hospitalized patients with healthcare-associated COVID-19 infection (probable and definite, i.e. diagnosed >7 days after hospital admission) has been steadily decreasing since January 2021 (9.6% during the second wave and 4.4% during the third wave). This coincides with the start of the vaccination campaign targeting hospital-affiliated healthcare workers (January 2021) and other hospital staff (February 2021) (Figure 11, chapter 2.3). High virus circulation in the general population increases the risk that the virus could be introduced into the hospital environment via hospital staff but also through infected patients or visiting friends and family. Nonetheless, this lower proportion of healthcare-associated infections persisted during the third wave of hospitalizations, when COVID-19 incidence rates were higher. Although multifactorial, an important factor will be the disruption of the transmission chains between hospital personnel and patients through widespread vaccination of hospital staff (cfr. Prevalence of anti-SARS-CoV-2 antibodies (IgG) among healthcare workers in Belgian hospitals)
Previously documented findings: • The median age of hospitalized patients has declined from January 2021 onwards, likely a result of the
vaccination campaign which initially targeted the elderly population. There was a slight decline in median age among ICU patients, however not as marked as among the total hospital cohort.
• The prevalence and changing epidemiology of comorbidities and mortality rate is in most cases a
reflection of the changing age of hospitalized patients (e.g. as the average age declines, so will the proportion of comorbidities and case-fatality rate among hospitalized patients).
• During the peak of the third wave, approximately 1 out of 4 hospitalized patients were admitted into ICU. • From the second wave onwards, dexamethasone has become standard of care for hospitalized patients
with COVID-19 infection and hypoxemia. Dexamethasone has been shown to improve outcomes in clinical trials with less patients requiring ICU admission as a result of critical illness. As a result, ICU patients admitted from the second wave and onwards are those that have clinically deteriorated under first-line treatment and thereby there are proportionally more with severe disease (higher serum CRP and case-fatality rate, cfr. ICU at a glance figure).
• ICU patients admitted in the first wave were more frequently invasively ventilated, which could be linked
with their longer ICU length of stay. Changes during the second and third wave could be a result of changing practices and development of protocols as clinicians acquired more experience and scientific evidence on how to treat critically ill COVID-19 infections.

TRENDS OVER TIME
1. INTRODUCTION The surveillance of COVID-19 hospitalized patients is based on 2 components:
• The Surge Capacity Surveillance: This surveillance collects daily aggregated information on COVID-19: such as number of hospital admissions, hospital discharges, hospital-wide and intensive care unit (ICU) bed occupancy, and mortality. Reporting to this surveillance is compulsory. Its aim is to describe the occupancy levels of hospitals and intensive care by patients with COVID-19.
• The Clinical Hospital Surveillance: This surveillance collects clinical data on patient level upon hospital admission, hospital discharge and ICU discharge. These data are collected in three separate forms. The ICU discharge form was only implemented from the 14th of September 2020. The aim of this surveillance is to study the demographics and outcomes of hospitalized patients with COVID-19 infection.
This automated periodical report describes the findings of the Clinical Hospital Surveillance from the beginning of the epidemic in February 2020 up to the present. Included patients are diagnosed by PCR, chest CT scan or rapid antigen test. When presenting the patient demographic and outcomes, they are stratified into two groups: all hospitalized patients and a subgroup of patients admitted to ICU.
It is not exhaustive, but does capture approximately 2/3rds of all hospitalized Belgian COVID-19 patients. The surveillance system collects detailed information through an admission, discharge and ICU form, which takes time to fill in (1 week). Delays in data registration lead to incomplete data for the most recent weeks. Clinical information is obtained through forms separately filled in at admission and at discharge. This means that demographic information (age, gender, comorbidities) is registered earlier than clinical outcomes (ICU transfer, invasive ventilation, death) because the patient has yet to complete their hospitalization. Demographic information on hospitalized patients is registered after approximately 1-2 weeks. Clinical outcomes, such as ICU admission or death, are only registered at hospital discharge, approximately 2-4 weeks after hospital admission.
Whether the patient was admitted into ICU is registered in the discharge form. Because of this, demographic information on ICU patients is only available at the moment of hospital discharge. Furthermore, as ICU patients remain hospitalized for 2-3 weeks, their profile may only be available approximately 4 weeks after their initial hospital admission. To avoid misinterpretation of trends over time we do not report ICU data for the most recent 3 weeks. Caution should be exercised when interpreting the most recent reported weeks as they are liable to change as more data is registered over time.
Because this clinical data is received with a delay, the results for the most recent weeks are liable to change as more data is collected. Furthermore, specific data (such as ICU transfer, complications, outcomes and death) are only available when the patient is discharged from the hospital. This can bias the results of the most recent weeks since either patients that die earlier or are discharged alive earlier are represented.

The time periods have been divided into a first wave (February to June 21st 2020), interwave (June 22nd 2020 – 31st of August 2020), second wave (August 31st 2020 to February 14th 2021) and third wave (February 15th 2021 onwards). The cut-off of June 21st 2020 was chosen because during that week Belgium had the lowest incidence of new COVID-19 infections. The second wave is defined as the period from the 31st of August 2020 onwards, when there was in increase in both number of weekly cases and hospital admissions. The third wave has been defined as the time period from the 15th of February onwards when hospital and ICU cases began to rise again.

Figure 1: Sample sizes in the database based on admission date (i.e. number of daily admissions).1
1 The Surge Capacity Surveillance started collecting the new number of ICU admissions only from 25-03-2021 onw ards.

Table 1: Sample sizes in the database based on admission date (i.e. number of daily admissions).
Week All hospitalizations ICU
2021-03-01 859 130
2021-03-08 958 142
2021-03-15 1,095 143
2021-03-22 1,359 212
2021-03-29 1,544 254
2021-04-05 1,392 203
2021-04-12 1,254 184
2021-04-19 1,110 187
2021-04-26 999 136
2021-05-03 776 104
2021-05-10 668 86
2021-05-17 560 70
2021-05-24 384 52
2021-05-31 337 35
2021-06-07 201 23
2021-06-14 102 12
2021-06-21 95 9
2021-06-28 64 2
2021-07-05 74 7
2021-07-12 109 14
2021-07-19 117 13
2021-07-26 159 15
2021-08-02 195 13
2021-08-09 201 19
2021-08-16 249 23
2021-08-23 229 16
2021-08-30 178
2021-09-06 114
2021-09-13 102

2. HOSPITALIZED PATIENTS 2.1. HOSPITAL AT A GLANCE Figure 2: Hospital at a glance. This ‘At a glance’ figure provides an overview of the crude case fatality rate and its relation to specific markers over time:
• Hospital occupancy in Belgium • Median age of patients at hospital admission • Serum C-reactive protein (CRP) at admission as a marker of inflammation • Proportion of admitted patients with at least 2 comorbidities at admission
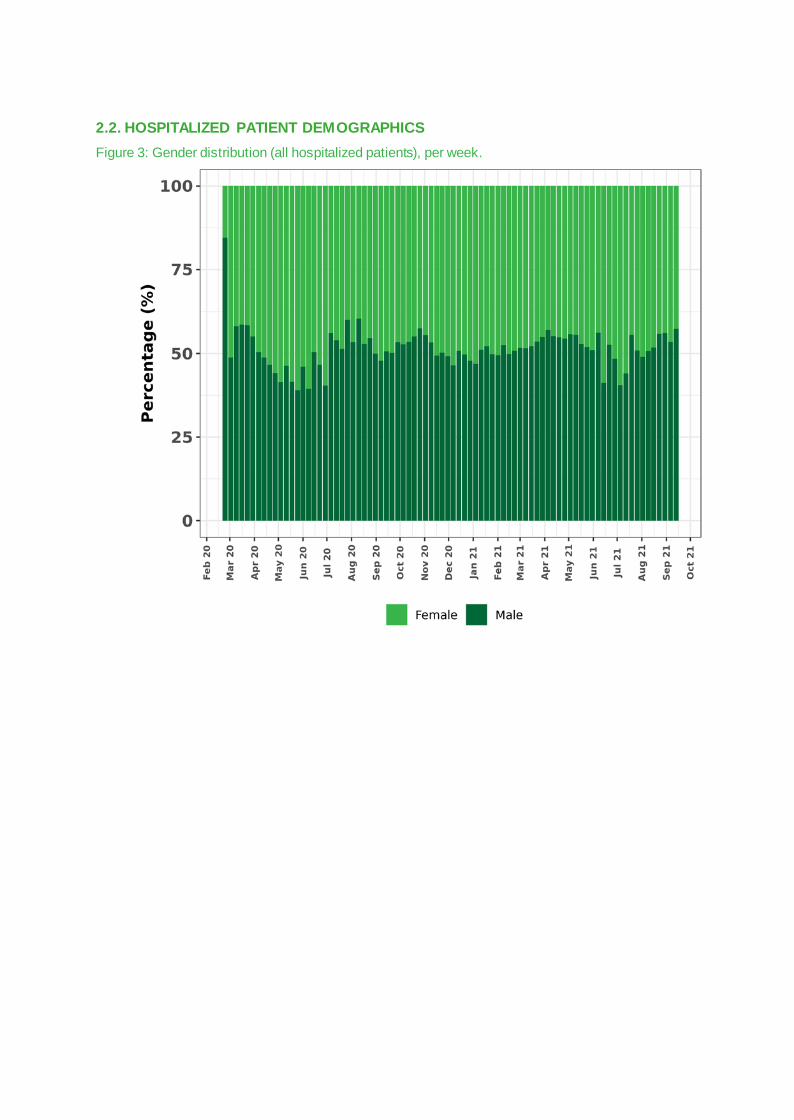
2.2. HOSPITALIZED PATIENT DEMOGRAPHICS Figure 3: Gender distribution (all hospitalized patients), per week.
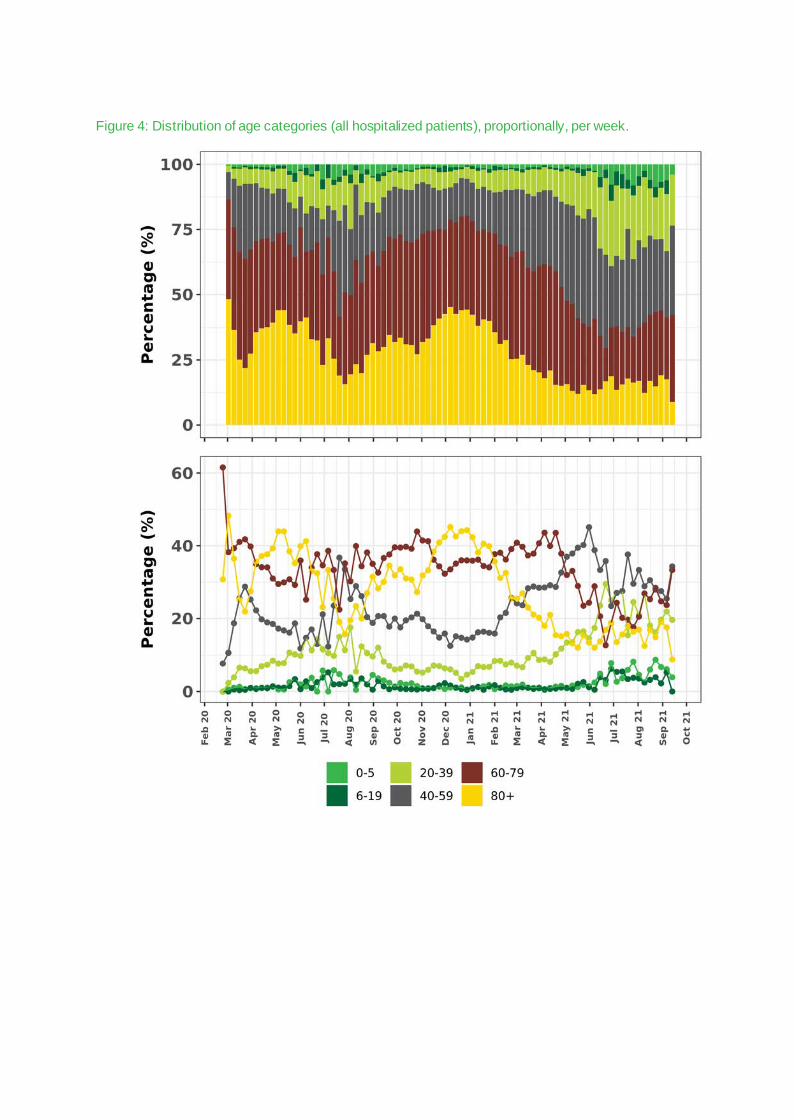
Figure 4: Distribution of age categories (all hospitalized patients), proportionally, per week.

Figure 5: Distribution of age categories (all hospitalized patients), in numbers of patients, per week. These patient numbers are calculated based on the proportional age distribution (above), projected on the number of patients reported in the surge capacity surveillance.

Figure 6: Comorbidities distribution (all hospitalized patients), per month. 2
2 The trend line is based on a smoothing function, and thus does not represent the observed data. Comorbidity trends per month can be view ed individually in the interactive EpiStat COVID-19 dashboard (https://epistat.wiv-isp.be/covid/covid-19.html)
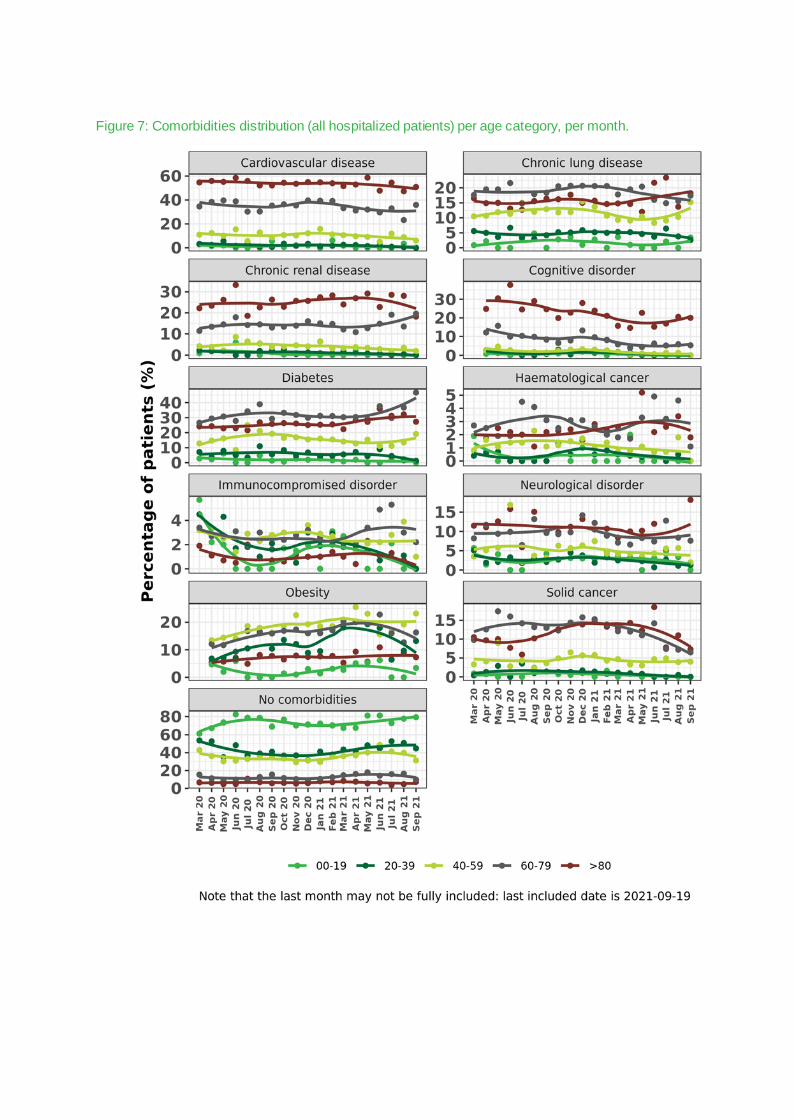
Figure 7: Comorbidities distribution (all hospitalized patients) per age category, per month.

Figure 8: The proportion of number of comorbidities per hospitalised patient, from the Clinical Hospital Surveillance (CHS) and the projection of these proportions on the total number of hospitalised patients reported in the Surge Capacity Surveillance (SCS). 3
3 The follow ing comorbidities are considered in this plot: cardiovascular disease, high blood pressure, diabetes, chronic renal disease, chronic liver disease, neurological disorder, cognitive disorder, immunocompromised disorder, chronic lung disease, solid cancer, haematological cancer, transplant, obesity.

Figure 9: Distribution of nursing home vs non-nursing home residents (all hospitalized patients), per week.
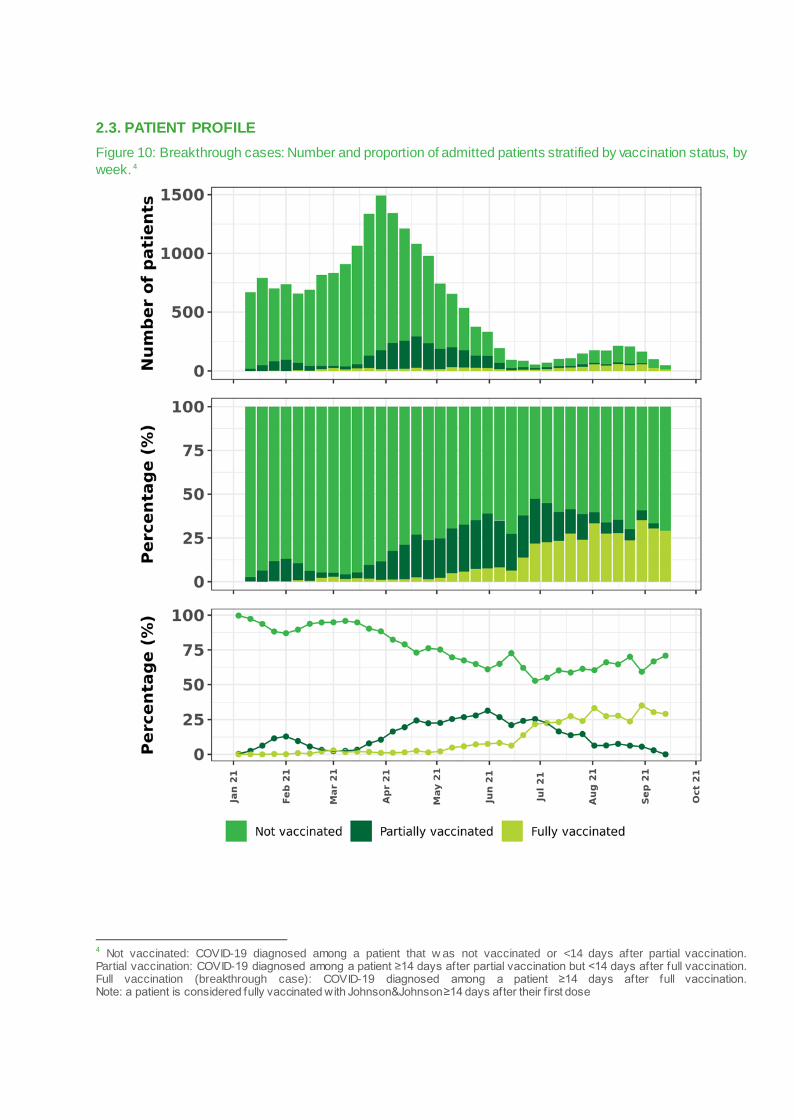
2.3. PATIENT PROFILE Figure 10: Breakthrough cases: Number and proportion of admitted patients stratified by vaccination status, by week. 4
4 Not vaccinated: COVID-19 diagnosed among a patient that w as not vaccinated or <14 days after partial vaccination. Partial vaccination: COVID-19 diagnosed among a patient ≥14 days after partial vaccination but <14 days after full vaccination. Full vaccination (breakthrough case): COVID-19 diagnosed among a patient ≥14 days after full vaccination. Note: a patient is considered fully vaccinated with Johnson&Johnson ≥14 days after their f irst dose
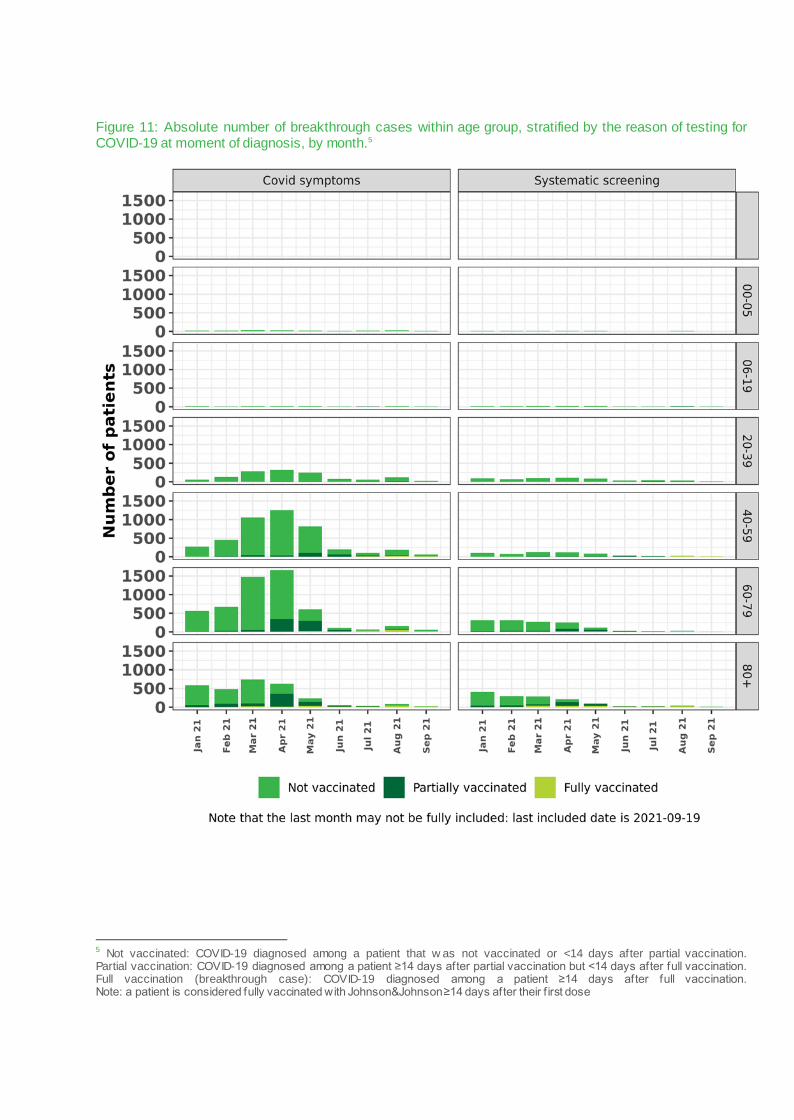
Figure 11: Absolute number of breakthrough cases within age group, stratified by the reason of testing for COVID-19 at moment of diagnosis, by month.5
5 Not vaccinated: COVID-19 diagnosed among a patient that w as not vaccinated or <14 days after partial vaccination. Partial vaccination: COVID-19 diagnosed among a patient ≥14 days after partial vaccination but <14 days after full vaccination. Full vaccination (breakthrough case): COVID-19 diagnosed among a patient ≥14 days after full vaccination. Note: a patient is considered fully vaccinated with Johnson&Johnson ≥14 days after their f irst dose

Figure 12: Percentage of breakthrough cases within age group, stratified by the reason of testing for COVID-19 at moment of diagnosis, by month.6
6 Not vaccinated: COVID-19 diagnosed among a patient that w as not vaccinated or <14 days after partial vaccination. Partial vaccination: COVID-19 diagnosed among a patient ≥14 days after partial vaccination but <14 days after full vaccination. Full vaccination (breakthrough case): COVID-19 diagnosed among a patient ≥14 days after full vaccination. Note: a patient is considered fully vaccinated with Johnson&Johnson ≥14 days after their f irst dose

Figure 13: Distribution of healthcare associated COVID-19 infection (all hospitalized patients), per week.
Time-to-infection after hospitalization was defined as days between hospital admission and date of symptom onset. In a small minority of cases the date of symptom onset was missing, in which case the date of diagnosis was used instead.
• CA-COVID: Community-associated COVID: up to 2 days after admission. • NH-COVID: Nursing home-associated COVID: nursing home resident with symptom onset up to 2 days
after admission. • HA-COVID: Definite healthcare-associated COVID infection: >14 days after admission. • prHA-COVID: Probable HA-COVID: on days 8-14 after admission. • IA-COVID: Indeterminate-association COVID: on days 3-7 after admission. These definitions are based on the European Centers for Disease Control and Prevention classification criteria (https://www.ecdc.europa.eu/en/covid-19/surveillance/surveillance-definitions). At the moment of writing these are pragmatic definitions that account for a median incubation period of 6 days (interquartile range 4 – 9 days). However, the validity of this classification system has not yet been extensively researched. Because the surveillance does not ask whether there was a strong suspicion in case of COVID infections that develop at days 3-7 after hospital admission, these cannot be classified as community or healthcare-associated.

Figure 14: Proportion of asymptomatic cases at admission, per week.7
7 These results are dependent on how the hospital registration is performed. Some hospitals may choose not to report the asymptomatic cases or cases identif ied through systematic screening that did not develop clinical signs of COVID-19 infection.
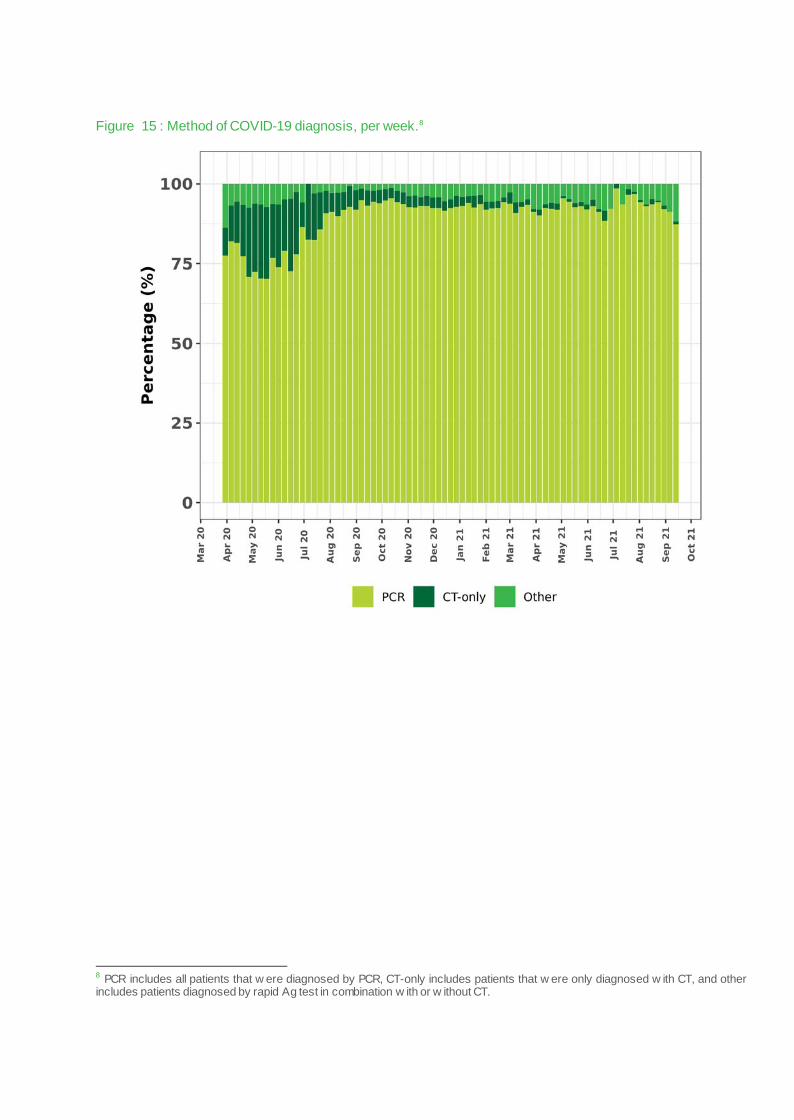
Figure 15 : Method of COVID-19 diagnosis, per week.8
8 PCR includes all patients that w ere diagnosed by PCR, CT-only includes patients that w ere only diagnosed w ith CT, and other includes patients diagnosed by rapid Ag test in combination w ith or w ithout CT.
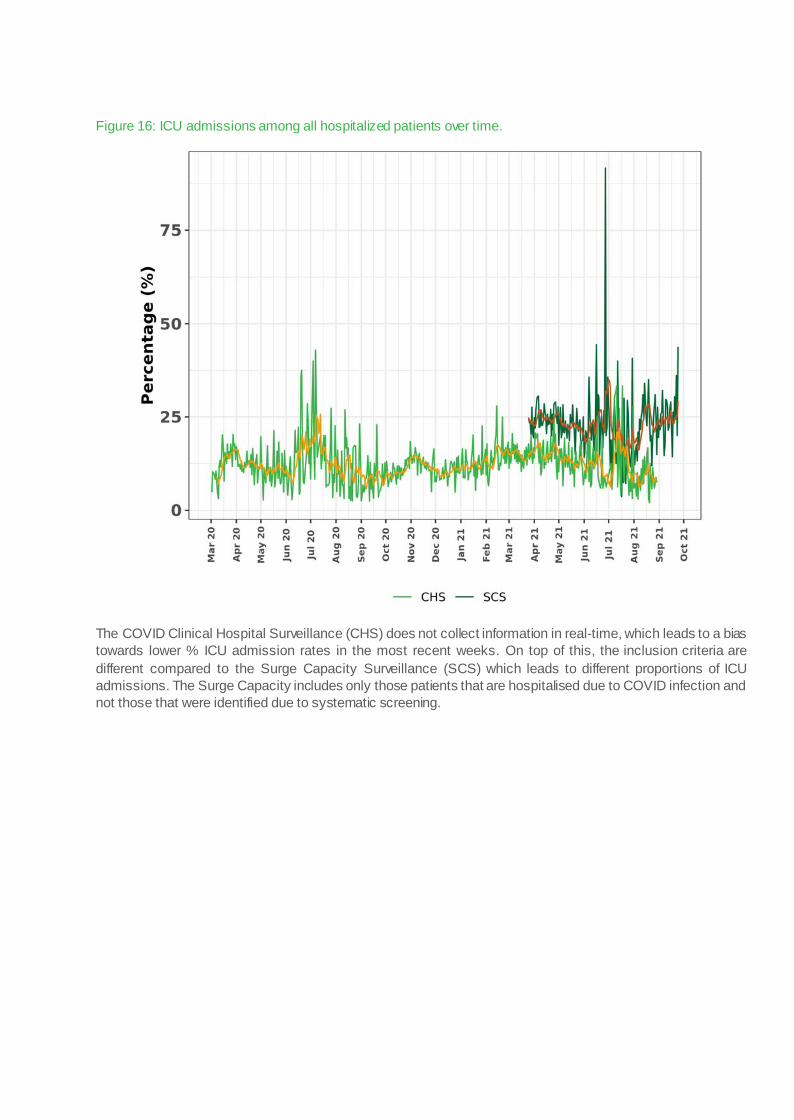
Figure 16: ICU admissions among all hospitalized patients over time.
The COVID Clinical Hospital Surveillance (CHS) does not collect information in real-time, which leads to a bias towards lower % ICU admission rates in the most recent weeks. On top of this, the inclusion criteria are different compared to the Surge Capacity Surveillance (SCS) which leads to different proportions of ICU admissions. The Surge Capacity includes only those patients that are hospitalised due to COVID infection and not those that were identified due to systematic screening.

Figure 17: ICU admissions among all hospitalized patients per age category over time.
The most recent weeks are biased towards lower % ICU admissions because ICU patients require time to be discharged and registered in the surveillance.

Figure 18: Time between hospital admission and transfer to ICU, per week.

Figure 19: Length of hospital stay, per month.
The most recent weeks are biased towards shorter length of stay because patients that are discharged or die earlier are registered sooner in the surveillance.

3. PATIENTS IN INTENSIVE CARE (ICU) 3.1. ICU AT A GLANCE Figure 20: ICU at a glance. This ‘At a glance’ figure provides an overview of the crude case fatality rate among ICU-admitted patients and its relation to specific markers over time:
• Number of ICU patients in Belgium • Median age of patients at hospital admission • Serum C-reactive protein (CRP) at hospital admission • Proportion of admitted patients with at least 2 comorbidities at admission

3.2. ICU PATIENT DEMOGRAPHICS Figure 21: Gender distribution (ICU patients), per week.

Figure 22: Distribution of age categories (ICU patients), per week.
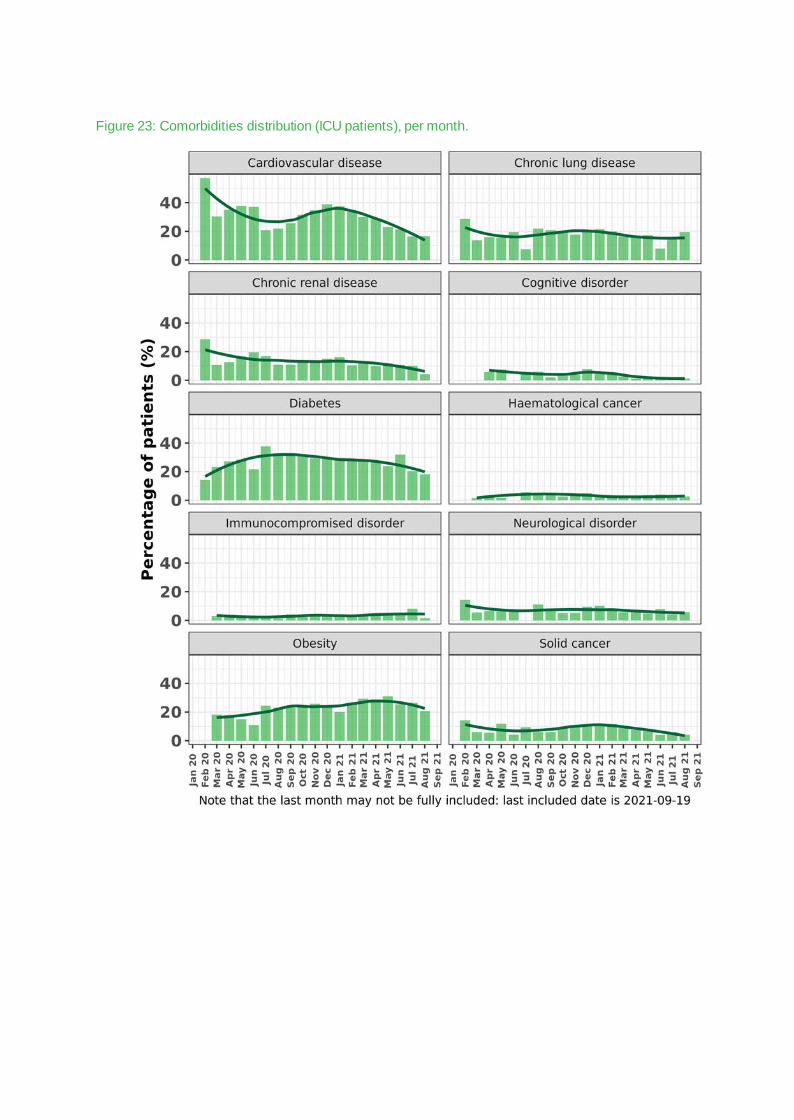
Figure 23: Comorbidities distribution (ICU patients), per month.

Figure 24: Comorbidities distribution (ICU patients), per age group, per month.
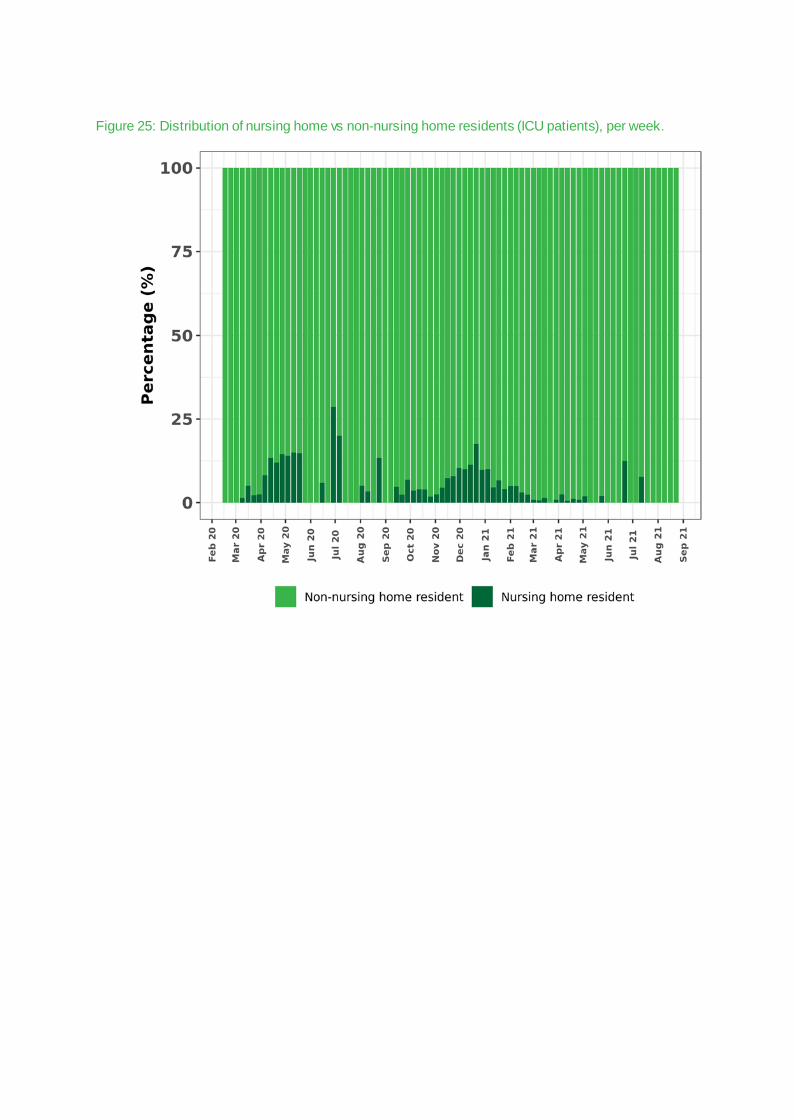
Figure 25: Distribution of nursing home vs non-nursing home residents (ICU patients), per week.

3.3. PROFILE OF ICU PATIENTS Figure 27 : Method of COVID-19 diagnosis, per week.9
9 PCR includes all patients that w ere diagnosed by PCR, CT-only includes patients that w ere only diagnosed w ith CT, and other includes patients diagnosed by rapid Ag test in combination w ith or w ithout CT.

Figure 28: Distribution of healthcare associated COVID-19 infection among ICU patients, per month.
Time-to-infection after hospitalization was defined as days between hospital admission and date of symptom onset. In a small minority of cases the date of symptom onset was missing, in which case the date of diagnosis was used instead.
• CA-COVID: Community-associated COVID: up to 2 days after admission. • NH-COVID: Nursing home-associated COVID: nursing home resident with symptom onset up to 2 days
after admission. • HA-COVID: Definite healthcare-associated COVID infection: >14 days after admission. • prHA-COVID: Probable HA-COVID: on days 8-14 after admission. • IA-COVID: Indeterminate-association COVID: on days 3-7 after admission. These definitions are based on the European Centers for Disease Control and Prevention classification criteria (https://www.ecdc.europa.eu/en/covid-19/surveillance/surveillance-definitions). At the moment of writing these are pragmatic definitions that account for a median incubation period of 6 days (interquartile range 4 – 9 days). However, the validity of this classification system has not yet been extensively researched. Because the surveillance does not ask whether there was a strong suspicion in case of COVID infections that develop at days 3-7 after hospital admission, these cannot be classified as community or healthcare-associated.

Figure 29: Invasive ventilation among all ICU patients over time, per week
The most recent weeks are biased towards lower % invasive ventilation because these patients remain hospitalized longer compared to non-invasively ventilated patients, which means it takes longer for them to be registered in the surveillance.

Figure 30: Invasive ventilation among all ICU patients by age category over time.
The most recent weeks are biased towards lower % invasive ventilation because these patients remain hospitalized longer compared to non-invasively ventilated patients, which means it takes longer for them to be registered in the surveillance.
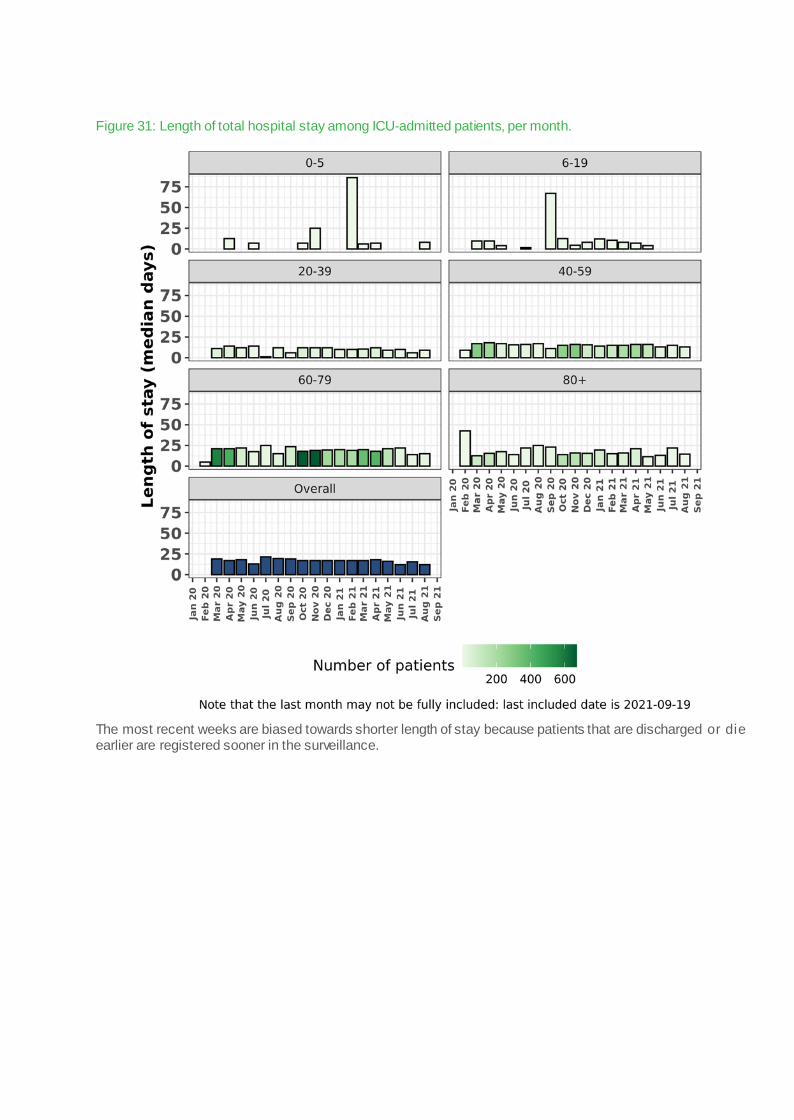
Figure 31: Length of total hospital stay among ICU-admitted patients, per month.
The most recent weeks are biased towards shorter length of stay because patients that are discharged or die earlier are registered sooner in the surveillance.

Figure 32: Length of ICU stay among ICU-admitted patients, per month.
The most recent weeks are biased towards shorter length of stay because patients that are discharged or die earlier are registered sooner in the surveillance.

ACKNOWLEDGEMENTS We sincerely thank all the health professionals for the registration of patient data, and we hope that
this report will provide them with useful information for their work.

Sciensano • Rue Juliette Wytsmanstraat 14 • 1050 Brussels • Belgium • T + 32 2 642 51 11 • T press + 32 2 642 54 20 • [email protected] • www.sciensano.be —
Prof. C. Léonard, Director • Rue Juliette Wytsmanstraat 14 • 1050 Brussels • Belgium •
More information : —
https://covid-19.sciensano.be/