covid-19: a reason to double down on investments in pre
TRANSCRIPT

COVID-19: A Reason to Double Down on Investments
in Pre-primary Education
Atsuko Muroga, Htet Thiha Zaw, Suguru Mizunoya, Hsiao-Chen Lin, Matt Brossard and
Nicolas Reuge
Office of Research - Innocenti Working Paper WP-2020-11 | September 2020

2
COVID-19: A Reason to Double Down on Investments in Pre-primary Education
Innocenti Working Paper 2020-06
UNICEF OFFICE OF RESEARCH – INNOCENTI
The Office of Research – Innocenti is UNICEF’s dedicated research centre. It undertakes research on emerging or current issues to inform the strategic directions, policies and programmes of UNICEF and its partners, shape global debates on child rights and development, and inform the global research and policy agenda for all children, particularly the most vulnerable.
Publications produced by the Office are contributions to a global debate on children and may not necessarily reflect UNICEF policies or approaches. The views expressed are those of the authors.
The Office of Research – Innocenti receives financial support from the Government of Italy, while funding for specific projects is also provided by other governments, international institutions and private sources, including UNICEF National Committees.
For further information and to download or order this and other publications, please visit the website at www.unicef-irc.org.

3
COVID-19: A Reason to Double Down on Investments in Pre-primary Education
Innocenti Working Paper 2020-06
INNOCENTI WORKING PAPERS
UNICEF Office of Research Working Papers are intended to disseminate initial research contributions within the programme of work, addressing social, economic and institutional aspects of the realization of the human rights of children.
The findings, interpretations and conclusions expressed in this paper are those of the author and do not necessarily reflect the policies or views of UNICEF.
This paper has been peer reviewed both externally and within UNICEF.
The text has not been edited to official publications standards and UNICEF accepts no responsibility for errors.
Extracts from this publication may be freely reproduced with due acknowledgement. Requests to utilize larger portions or the full publication should be addressed to the Communications Unit at: [email protected].
For readers wishing to cite this document, we suggest the following form:
Muroga, A., Zaw, H.T., Mizunoya, S., Lin, H., Brossard, M. and Reuge, N. (2020), COVID-19: A Reason to Double Down on Investments in Pre-primary Education. Innocenti Working Paper 2020-06. Florence: UNICEF Office of Research – Innocenti.
© 2020 United Nations Children’s Fund (UNICEF)
Correspondence should be addressed to:
UNICEF Office of Research – Innocenti
Via degli Alfani 58
50121 Florence, Italy
Tel.: (+39) 055 20330
Fax: (+39) 055 2033 220
www.unicef-irc.org
@UNICEFInnocenti
facebook.com/UnicefInnocenti

4
COVID-19: A Reason to Double Down on Investments in Pre-primary Education
Innocenti Working Paper 2020-06
COVID-19: A REASON TO DOUBLE DOWN ON INVESTMENTS IN PRE-PRIMARY EDUCATION
Atsuko Muroga, Teachers College, Columbia University
Htet Thiha Zaw, University of Michigan – Ann Arbor, Department of Political Science
Suguru Mizunoya, UNICEF Data, Analytics, Planning and Monitoring Division, Data and Analytics
Hsiao-Chen Lin, UNICEF Programme Division, Education
Matt Brossard, UNICEF Office of Research – Innocenti, Education
Nicolas Reuge, UNICEF Programme Division, Education

5
COVID-19: A Reason to Double Down on Investments in Pre-primary Education
Innocenti Working Paper 2020-06
SUMMARY
This paper summarizes the recent UNICEF analysis on investing in early childhood education in developing countries.1 It provides a benefit-cost analysis of investments in pre-primary education2 in 109 developing low- and middle-income countries and territories, using data from 2008 to 2019.
Key findings and related recommendations
� Even before COVID-19, at least 175 million children – nearly half of the world’s pre-primary-age children and eight out of 10 children in low-income countries – were missing out on early childhood education (ECE).
� Every dollar (US$) spent on pre-primary education results in US$9 of benefits to society. Overall, a 10 percentage-point increase in the pre-primary enrolment3 rate is associated with an increase of 0.14 years of schooling and a 0.55 per cent reduction in primary school repetition. For a given cohort of children, such an increase yields US$1,134 of net societal benefits per individual over their lifetime.4
� The median marginal cost to increase pre-primary education enrolment by 10 percentage points in low- and middle-income countries is approximately US$41.7 million annually per country. While actual costs vary substantially within and across country-income groups, these costs represent a small fraction – on average, less than 1 per cent – of public education spending.
� The COVID-19 pandemic and related school closures exacerbate the risk of children missing out on both learning and future earnings.5 Investing in ECE and strengthening pre-primary education systems is needed to achieve progress on the Sustainable Development Goals, decrease inequalities and drive economic growth. It is now more critical than ever that ECE be prioritized by increasing domestic budgets and international aid and improving the efficiency with which ECE programmes are delivered.
1 The report ‘Investing in Early Childhood Education in Developing Countries: An Economic Analysis’ benefited from technical reviews by Professor Henry M. Levin (Professor, Columbia University), Professor Robert Shand (Assistant Professor, American University), Dr Anyi Wang (Researcher, Earth Institute), Dr João Pedro Wagner De Azevedo (Lead Economist, The World Bank), and Amanda E. Devercelli (Senior Education Specialist, The World Bank).
2 Preschool or pre-primary education is defined as education provided to young children before the primary school entry age, or what is classified as ‘Level 0’ or ‘pre-primary’ by the International Standard Classification of Education (ISCED) of the United Nations Educational, Scientific and Cultural Organization (UNESCO).
3 In this paper, ‘access to ECE’ and ‘enrolment in ECE’ are used interchangeably.
4 Net societal benefits include both lifetime earnings gains and savings from reduced grade repetition.
5 The World Bank estimates that globally, a school shutdown of five months could result in a US$10 trillion reduction in lifetime earnings for affected students (Azevedo et al., 2020).
6
COVID-19: A Reason to Double Down on Investments in Pre-primary Education
Innocenti Working Paper 2020-06
CONTEXT
Although progress has been made in increasing access to pre-primary education, at least 175 million children – nearly half of the world’s pre-primary-age children – were out of school as of 2018 (UNICEF, 2019a). In low-income countries, eight out of 10 children are missing out on ECE opportunities. The most vulnerable children – those who would most benefit from ECE – are the least likely to be enrolled. Across 64 countries, children from the poorest quintile are about eight times less likely than their peers in the wealthiest quintile to attend ECE programmes (UNICEF, 2019a).
Early learning is key from an equity perspective. Using multiple indicator cluster surveys (MICS), the World Bank (2018) showed that income-related gaps in cognitive skills can start as early as the preschool years and tend to grow over time, leaving the most vulnerable children further behind.
Critical barriers to SDG 4.2 (universal access to quality early childhood care and pre-primary education) are the lack of budget and political will to prioritize ECE. Low-income countries spend less than 2 per cent of their education budgets on pre-primary education, and higher-income countries manage only slightly better. This situation is compounded by the fact that little international aid is directed to supporting ECE. Between 2012 and 2016, an average of US$76 million per year – well under 1 per cent – of total international aid to education supported pre-primary education. Over the same period, an average of US$3.6 billion per year of international aid was dedicated to post-secondary education, which benefits the most advantaged children. In 2016, only 0.7 per cent of official development assistance (ODA) for education was spent on ECE (UNICEF, 2019a and UNICEF, 2019b).
By depriving tens of millions of children of access to pre-primary education, the COVID-19 pandemic and related school closures are making a bad situation worse. The World Bank recently estimated that without compensatory actions, students across all levels could lose between 0.3 and 0.9 years of schooling due to the pandemic, resulting in between US$6,472 and US$25,680 of lost earnings over their lifetimes, and amounting to a cumulative global loss of US$10 trillion (Azevedo et al., 2020).
Recent findings on the benefits of pre-primary education underscore the importance of increased investment. Evidence shows that pre-primary education is one of the key determinants of performance in primary and secondary school (Berlinski et al., 2008; Sylva et al., 2011). High-quality preschool interventions in the US also show large benefits relative to cost (Heckman et al., 2010; Reynolds et al., 2011). However, few studies have examined the benefits and costs of investing in ECE for developing countries.
This paper summarizes a new UNICEF report which addresses this gap by estimating the cost necessary to achieve a 10 percentage-point increase in pre-primary enrolment rates. It also estimates the benefits generated by this increase.6
6 All results are expressed in present value units with a discount rate of 3 per cent, and all prices are in constant 2011 US$ with a PPP adjustment. Benefits are estimated conservatively and include expected increases in lifetime earnings as well as savings for the education system. Available literature documents various long-term positive effects on individuals who participate in high-quality preschool education programmes. These include, for example, reduced dependency on welfare systems, reduced use of the criminal justice system, and better health. However, it was not possible to include these benefits in the UNICEF study due to data limitations. Detailed descriptions of the data and methodology are available in the Annexes.

7
COVID-19: A Reason to Double Down on Investments in Pre-primary Education
Innocenti Working Paper 2020-06
FINDINGS
The marginal cost of increasing access to pre-primary education
What is the additional (marginal) cost to governments in developing countries of increasing enrolment rates in pre-primary education by 10 percentage points?
To make each county’s costs comparable, Table 1 presents the annualized marginal costs of doing so. The marginal annual costs vary substantially within and across country-income groups (see Annex 2). Countries with large populations (e.g., India) and countries with relatively high unit costs (e.g., Mexico) both show large marginal costs to raise pre-primary enrolment rates. The median (mean) marginal cost in low- and middle-income countries is US$41.7 (US$249.3) million per country. For low-income and lower-middle-income countries, the median (mean) additional costs are estimated to be US$20.8 (US$37.1) million and US$45.4 (US$278.9) million, respectively. To put that in perspective, these figures represent a small fraction – on average, around 2 per cent – of public education spending.
Table 1. Annualized marginal costs of raising pre-primary enrolment rates by 10 percentage points: Summary statistics for the 109 countries studied
Marginal cost per country
US$ millions% of government education
expenditure
Country-income groups Median Mean Median Mean
Low-income 20.8 37.1 2.0% 2.1%
Lower-middle-income 45.4 278.9 2.1% 2.5%
Upper-middle-income 81.6 361.5 1.8% 2.3%
All developing 41.7 249.3 2.0% 2.3%
Source: Authors’ calculations.
Notes: Costs are in present value, using a 3 per cent discount rate, and expressed in constant 2011 dollars with a PPP adjustment. The total government education expenditure data are from the latest available year and also in constant 2011 PPP dollars.

8
COVID-19: A Reason to Double Down on Investments in Pre-primary Education
Innocenti Working Paper 2020-06
The marginal societal benefits of increasing access to pre-primary education and benefit-cost ratios
What are the societal benefits7 of increasing pre-primary education enrolment rates by 10 percentage points, in terms of gains in total lifetime earnings from more schooling for a given cohort of children, and estimated savings to the education system from reduced repetition in primary education?
Figure 1 summarizes the study’s approach to estimating the benefits that accrue to society from a 10 percentage point increase in pre-primary enrolment rates; a 0.14-year increase in education attained and a 0.55 percentage point reduction in primary school grade repetition.8 These two estimates are converted into lifetime earnings gains and savings to the education system, and found to equal US$1,134 of net societal benefits per individual over their lifetimes.9
Figure 1. Summary of study methodology
0.55 percentage pointreduction in primary
school grade repetition
Savings to the education system (US$)
Savings to the education system
from avoided primary grade repetition
# of avoided repetitions in the country, based on 0.55 percentage point reduction
0.14 yearincrease in schoolingattained among youth
(ages 15–19)
Lifetime earnings gain (US$)
Projected1 lifetime earnings gain in the country, per youth, from 0.14 more years of schooling, based on a country-specific rate of return2 for
one year of schooling
# of youth (ages 15–19)
in the country
1. Assumptions: (i) working ages are 15–60, (ii) starting wage is 70% of mean wage in the country, and (iii) highest wage is 1.5 x starting wage and earned at age 40.2. Rates are found in Psacharopoulos & Patrinos (2018)
Raisingpre-primary
enrollment rates
+10%
7 Societal benefits refer to all benefits generated by the policy of interest and include ‘private’ benefits or benefits to individuals, as well as ‘external’ benefits or benefits to the general public.
8 These two estimates were obtained using regression analyses. The regressions also show that improved access needs to be accompanied by improved quality of pre-primary education to generate positive impacts on intended outcomes. Annex 1 of this paper summarizes the methodology.
9 The estimation of benefits employed a conservative approach as it did not include other benefits associated with pre-primary education such as reduced child neglect and abuse, reduced accidents and injuries among children, reductions in early pregnancies, reduced welfare dependency, and reduced crime and contact with criminal justice system (Karoly, 2012; Karoly et al., 2005).
9
COVID-19: A Reason to Double Down on Investments in Pre-primary Education
Innocenti Working Paper 2020-06
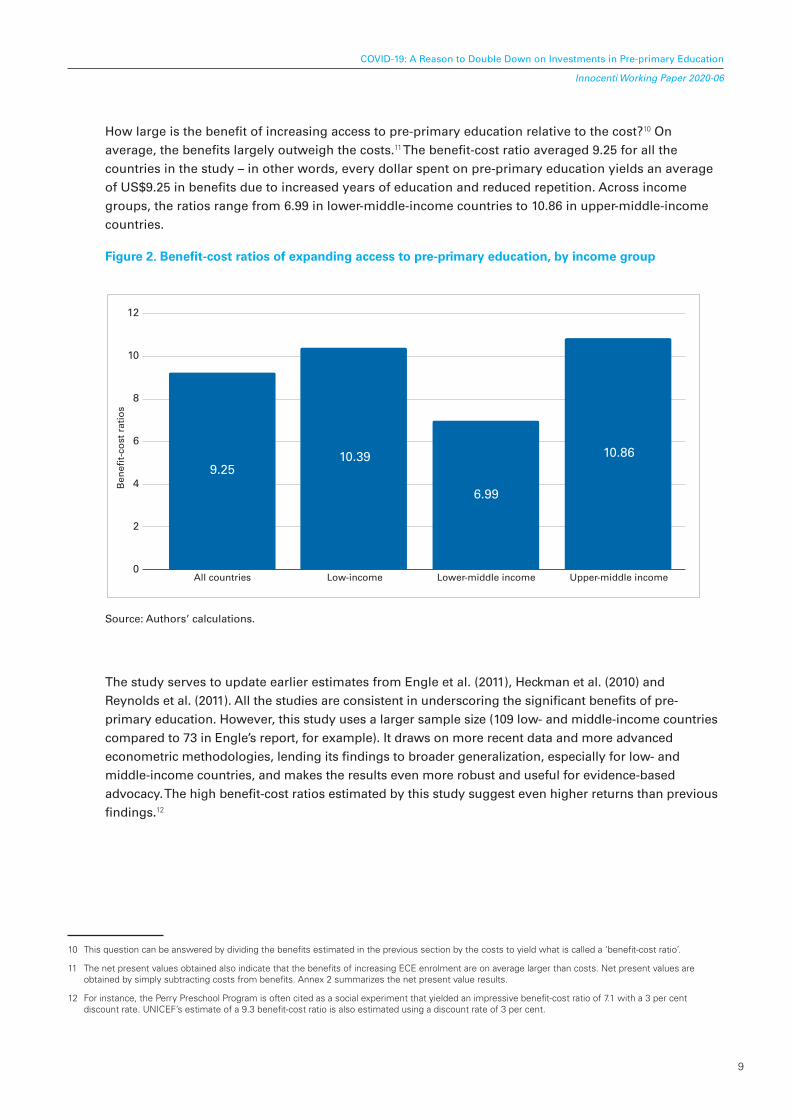
How large is the benefit of increasing access to pre-primary education relative to the cost?10 On average, the benefits largely outweigh the costs.11 The benefit-cost ratio averaged 9.25 for all the countries in the study – in other words, every dollar spent on pre-primary education yields an average of US$9.25 in benefits due to increased years of education and reduced repetition. Across income groups, the ratios range from 6.99 in lower-middle-income countries to 10.86 in upper-middle-income countries.
Figure 2. Benefit-cost ratios of expanding access to pre-primary education, by income group
Ben
e�t-
cost
rat
ios
12
10
8
6
4
2
0All countries Low-income Lower-middle income Upper-middle income
9.2510.39
6.99
10.86
Source: Authors’ calculations.
The study serves to update earlier estimates from Engle et al. (2011), Heckman et al. (2010) and Reynolds et al. (2011). All the studies are consistent in underscoring the significant benefits of pre-primary education. However, this study uses a larger sample size (109 low- and middle-income countries compared to 73 in Engle’s report, for example). It draws on more recent data and more advanced econometric methodologies, lending its findings to broader generalization, especially for low- and middle-income countries, and makes the results even more robust and useful for evidence-based advocacy. The high benefit-cost ratios estimated by this study suggest even higher returns than previous findings.12
10 This question can be answered by dividing the benefits estimated in the previous section by the costs to yield what is called a ‘benefit-cost ratio’.
11 The net present values obtained also indicate that the benefits of increasing ECE enrolment are on average larger than costs. Net present values are obtained by simply subtracting costs from benefits. Annex 2 summarizes the net present value results.
12 For instance, the Perry Preschool Program is often cited as a social experiment that yielded an impressive benefit-cost ratio of 7.1 with a 3 per cent discount rate. UNICEF’s estimate of a 9.3 benefit-cost ratio is also estimated using a discount rate of 3 per cent.
10
COVID-19: A Reason to Double Down on Investments in Pre-primary Education
Innocenti Working Paper 2020-06
The time for action is now
The findings show that expanding access to pre-primary education is a highly cost-effective investment decision for developing countries. These results are consistent across all income groups. Yet more than half of low- and lower-middle-income countries are not making sufficient progress to reach the SDG target of universal access to pre-primary education by 2030. The positive impacts of investing in pre-primary education today extend well into the future in the form of academic and educational success for individuals, the effectiveness and efficiency of school systems and countries’ economic growth. This calls for urgent action to improve access to pre-primary education.
Expanding ECE access for vulnerable children – Even before COVID-19, at least 175 million young children were not enrolled in any type of pre-primary education programme. School closures and limited access to remote early learning opportunities further exacerbate the issue and increase disparities for the most vulnerable children. This calls for high-level political commitment to making pre-primary education a priority and establishing policies for universal pre-primary education that prioritize the poorest and hardest to reach. Potential action includes:
� Raising the profile of ECE in education sector plans and policies and in emergency response plans, and urgently accelerating efforts to address gaps in access.
� Providing free pre-primary education for at least one year with an explicit focus on the poorest and most vulnerable children.
Prioritizing ECE in public budgets – Given that investing in pre-primary education generates system efficiencies for subsequent levels of education, including for mitigating significant losses in learning due to the COVID-19 pandemic, it is more important than ever to protect and increase public budgets for pre-primary education, including:
� Allocating at least 10 per cent of education budgets to pre-primary education, as UNICEF’s Executive Director recently urged governments and partners to do.
� Allocating at least 25 per cent of pre-primary education budgets to recurrent expenditures (regular non-salary expenditures such as teacher training, curriculum development, teaching and learning materials and quality assurance mechanisms) to improve the quality of early learning.
Increasing donor aid – A mere 0.7 per cent of total international spending on education goes to pre-primary education. International partners are key to supporting ECE and contributing to cost-effective investments in pre-primary education. This is particularly true in the context of COVID-19, which puts education budgets at risk. Donors are encouraged to:
� Lead by example and allocate at least 10 per cent of their education investments to pre-primary education, including in emergency contexts.
� Prioritize investment in South Asia and sub-Saharan Africa, given the very low pre-primary enrolment rates in these two regions (UNICEF, 2019a).

COVID-19: A Reason to Double Down on Investments in Pre-primary Education
Innocenti Working Paper 2020-06
Monitoring and increasing quality and efficiency – While increasing overall investment in pre-primary education is important, ensuring quality and system efficiency is equally critical. Efficiency has consistently been a structural challenge for the education sector in developing countries: According to estimates by Mizunoya and Zaw (2017), waste due to dropouts and repetition in primary education amounted to US$32.6 billion between 2002 and 2011, or five times the total international aid for primary education during that period. Related actions include:
� monitoring governments’ and donors’ spending and results, as well as improving planning and accountability mechanisms, and
� increasing the breadth and depth of research on ECE, including on policies, their implementation and the resulting effects on education system efficiencies.
COVID-19: A Reason to Double Down on Investments in Pre-primary Education
Innocenti Working Paper 2020-06
REFERENCES
Azevedo, João P. et al., Simulating the Potential Impacts of the COVID-19 School Closures on Schooling and Learning Outcomes: A set of global estimates, World Bank Group, Washington DC, 2020.
Berlinski, Samuel, Sebastian Galiani and Marco Manacorda, ‘Giving Children a Better Start: Preschool attendance and school-age profiles’, Journal of Public Economics, 2008, vol. 92, nos. 5–6, pp. 1416–1440.
Engle, Patrice L. et al., ‘Strategies for Reducing Inequalities and Improving Developmental Outcomes for Young Children in Low-Income and Middle-Income Countries’, The Lancet vol. 378, no. 9799, 2011, pp. 1339–1353.
Heckman, James J. et al., A New Cost-Benefit and Rate of Return Analysis for the Perry Preschool Program: A summary (No. 16180), National Bureau of Economic Research, Cambridge University Press, New York, 2010.
Karoly, Lynn A., ‘Toward Standardization of Benefit-Cost Analysis of Early Childhood Interventions’, Journal of Benefit-Cost Analysis, vol. 3, no. 1, 2012, pp. 1–45.
Karoly, Lynn A., M. Rebecca Kilburn and Jill S. Cannon, Early Childhood Interventions: Proven results, future promise, Rand Corporation, Santa Monica CA, 2005.
Mizunoya, Suguro and Htet Thiha Zaw, ‘Measuring the Holes of the Ship: Global cost estimations of internal inefficiency in primary education’, International Journal of Educational Development, vol. 54, May 2017, pp. 8–17.
Pscharopoulos, George and Harry A. Patrinos, ‘Returns to Investment in Education: A Decennial Review of the Global Literature’, Education Economics, vol. 26, no.5, June 2018, pp. 1–4.
Reynolds, Arthur J. et al., ‘Age 26 Cost–Benefit Analysis of the Child‐Parent Center Early Education Program’, Child Development, vol. 82, no. 1, 2011, pp. 379–404.
Sylva, Kathy et al., ‘Pre-school Quality and Educational Outcomes at Age 11: Low quality has little benefit’, Journal of Early Childhood Research, vol. 9, no. 2, 2011, pp. 109–124.
UNESCO Institute for Statistics, ‘More Than One-half of Children and Adolescents are not Learning Worldwide’, UIS Fact Sheet No. 46, September 2017.
United Nations Children’s Fund, A World Ready to Learn: Prioritizing quality early childhood education, UNICEF, New York, 2019a.
United Nations Children’s Fund, Education Strategy Data and Analytics Compendium, UNICEF, New York, 2019b.
World Bank, World Development Report 2018: Learning to Realize Education’s Promise, World Bank Group, Washington DC, 2018.
COVID-19: A Reason to Double Down on Investments in Pre-primary Education
Innocenti Working Paper 2020-06
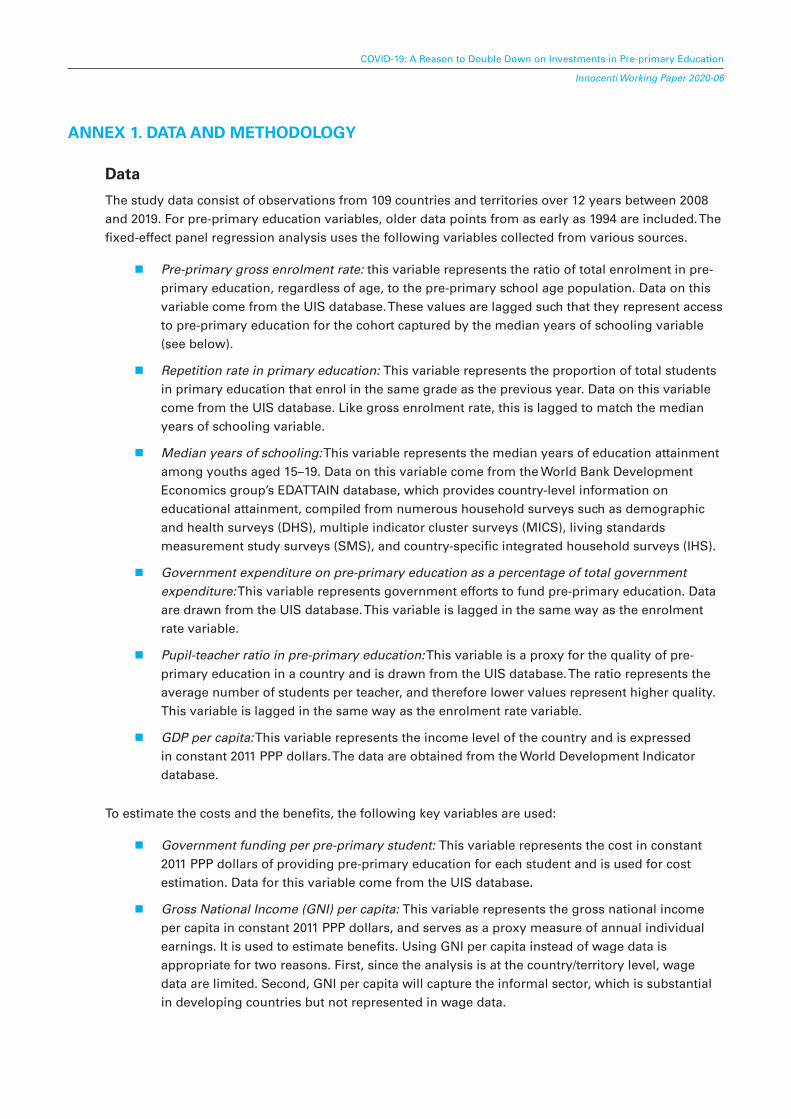
ANNEX 1. DATA AND METHODOLOGY
Data
The study data consist of observations from 109 countries and territories over 12 years between 2008 and 2019. For pre-primary education variables, older data points from as early as 1994 are included. The fixed-effect panel regression analysis uses the following variables collected from various sources.
� Pre-primary gross enrolment rate: this variable represents the ratio of total enrolment in pre-primary education, regardless of age, to the pre-primary school age population. Data on this variable come from the UIS database. These values are lagged such that they represent access to pre-primary education for the cohort captured by the median years of schooling variable (see below).
� Repetition rate in primary education: This variable represents the proportion of total students in primary education that enrol in the same grade as the previous year. Data on this variable come from the UIS database. Like gross enrolment rate, this is lagged to match the median years of schooling variable.
� Median years of schooling: This variable represents the median years of education attainment among youths aged 15–19. Data on this variable come from the World Bank Development Economics group’s EDATTAIN database, which provides country-level information on educational attainment, compiled from numerous household surveys such as demographic and health surveys (DHS), multiple indicator cluster surveys (MICS), living standards measurement study surveys (SMS), and country-specific integrated household surveys (IHS).
� Government expenditure on pre-primary education as a percentage of total government expenditure: This variable represents government efforts to fund pre-primary education. Data are drawn from the UIS database. This variable is lagged in the same way as the enrolment rate variable.
� Pupil-teacher ratio in pre-primary education: This variable is a proxy for the quality of pre-primary education in a country and is drawn from the UIS database. The ratio represents the average number of students per teacher, and therefore lower values represent higher quality. This variable is lagged in the same way as the enrolment rate variable.
� GDP per capita: This variable represents the income level of the country and is expressed in constant 2011 PPP dollars. The data are obtained from the World Development Indicator database.
To estimate the costs and the benefits, the following key variables are used:
� Government funding per pre-primary student: This variable represents the cost in constant 2011 PPP dollars of providing pre-primary education for each student and is used for cost estimation. Data for this variable come from the UIS database.
� Gross National Income (GNI) per capita: This variable represents the gross national income per capita in constant 2011 PPP dollars, and serves as a proxy measure of annual individual earnings. It is used to estimate benefits. Using GNI per capita instead of wage data is appropriate for two reasons. First, since the analysis is at the country/territory level, wage data are limited. Second, GNI per capita will capture the informal sector, which is substantial in developing countries but not represented in wage data.

COVID-19: A Reason to Double Down on Investments in Pre-primary Education
Innocenti Working Paper 2020-06
Methodology
In an ideal situation, we can directly estimate the costs and benefits of receiving pre-primary education using the following approach:
� identify whether the individual received pre-primary education or not;
� estimate the cost of providing such education;
� evaluate the ‘effects’ of receiving pre-primary education on various developmental and educational outcomes in a way that carefully mitigates the impact of other factors that influence both the likelihood of attending and the outcomes of pre-primary education; and
� convert the ‘effects’ into monetary terms to estimate the benefits (see Reynolds et al., 2011, for example).
While this approach is feasible where micro-level data are available, no existing surveys consistently collect information on pre-primary education attendance and other outcomes over time and across multiple countries.
To overcome this challenge, the analysis follows Engle et al. (2011) by setting countries as the unit of analysis and focusing on country-level access to pre-primary education. With this approach, we can analyse, across multiple countries, whether and to what extent an increase in access to pre-primary education is associated with changes in future grade repetition and number of years of schooling.
The resulting analysis comprises the following five steps:
1. To enable the benefit-cost analysis, particularly the estimation of benefits, the first step involves estimating the association of pre-primary enrolment rates with two outcomes: number of years of schooling and primary grade repetition rates. The estimation employs panel regression analysis to do so, using the following model:
schoolyrit = �Ei + �Epreprimaryit-l+XγE+λEiZi+uEit
repetitionit–m = �Ri + �Rpreprimaryit-l+XγR+λRiZi+uRit
where
schoolyrit is the median number of years of schooling
repetitionit–m is the lagged primary grade repetition rate
�i terms are intercepts
preprimaryit-l is the lagged pre-primary enrolment ratio
X is a matrix of three control variables (i.e., lagged government expenditure on pre-primary education, the lagged pupil-teacher ratio for pre-primary education, and GDP per capita in constant 2011 PPP dollars)
γ terms are vectors of coefficients for the covariate matrix

COVID-19: A Reason to Double Down on Investments in Pre-primary Education
Innocenti Working Paper 2020-06
Zi is country fixed effects
λi are coefficients of Zi
uit is the error term
�E and �R are the estimates of interest, representing the average increase in years of schooling and in primary grade repetition rate, respectively, as a result of improved access to pre-primary education.
2. The second step involves calculating the cost for each country (∆Costi). We focus on the marginal cost required to raise the pre-primary enrolment ratio by 10 percentage points.
∆Costi = Ci × ∆Enrolleei
where ∆Enrolleei = cohortpopi × 0.1
where Ci is the cost per additional (or marginal) pre-primary enrollee in country i, and ∆Enrolleei is the number of additional pre-primary enrollees, equivalent to 10 per cent of the cohort of interest.
Note that Ci is expressed in present value units with a discount rate of 3 per cent.
3. The third step involves estimating the benefit for each country. There are two sources of benefits: (1) increased years of schooling, represented by years, and (2) reduced primary grade repetition rates, represented by percentage points. The monetary value of increased years of schooling is expressed as the expected increase in lifetime earnings. The lifetime earnings gain in country i (ΔEarningsi) is obtained by using the following formula.
ΔEarningsi = × rri × earningsunii × cohortpopi
where
is the coefficient estimate of pre-primary enrolment rate from the first regression
rri is the rate of return for one additional year of schooling in country (drawn from Pscharopoulos & Patrinos, 2018)
earningsunii are projected lifetime earnings per person between ages 15–60 in country i based on GNI per capita as a proxy for earnings.
Note that earningsunii is expressed in present value units with a discount rate of 5 per cent.
The reduced primary grade repetition rate is monetized through savings to the education system. To calculate this, the analysis assumes that a repeater incurs the same cost as a non-repeating primary student, and multiplies this unit saving by the avoided number of primary grade repeaters, as follows.
ΔSavingi = savingunii × × primaryenroli
where
ΔSavingi is the savings to the education system generated from the reduction in primary education repetition

COVID-19: A Reason to Double Down on Investments in Pre-primary Education
Innocenti Working Paper 2020-06
savingunii is the saving per avoided primary grade repeater
is the coefficient estimate from the regression
primaryenroli is primary school enrolment.
Finally, the sum of earnings gains (ΔEarningsi) and savings to the education system (ΔSavingi) comprises the total benefit for country i:
ΔBenefiti = ΔEarningsi + ΔSavingi
4. The fourth step involves obtaining key benefit-cost results, including the net present value and the benefit-cost ratio. Net present value is calculated as the total benefits minus the cost. The benefit-cost ratio is estimated by dividing the total benefits by the cost.

COVID-19: A Reason to Double Down on Investments in Pre-primary Education
Innocenti Working Paper 2020-06
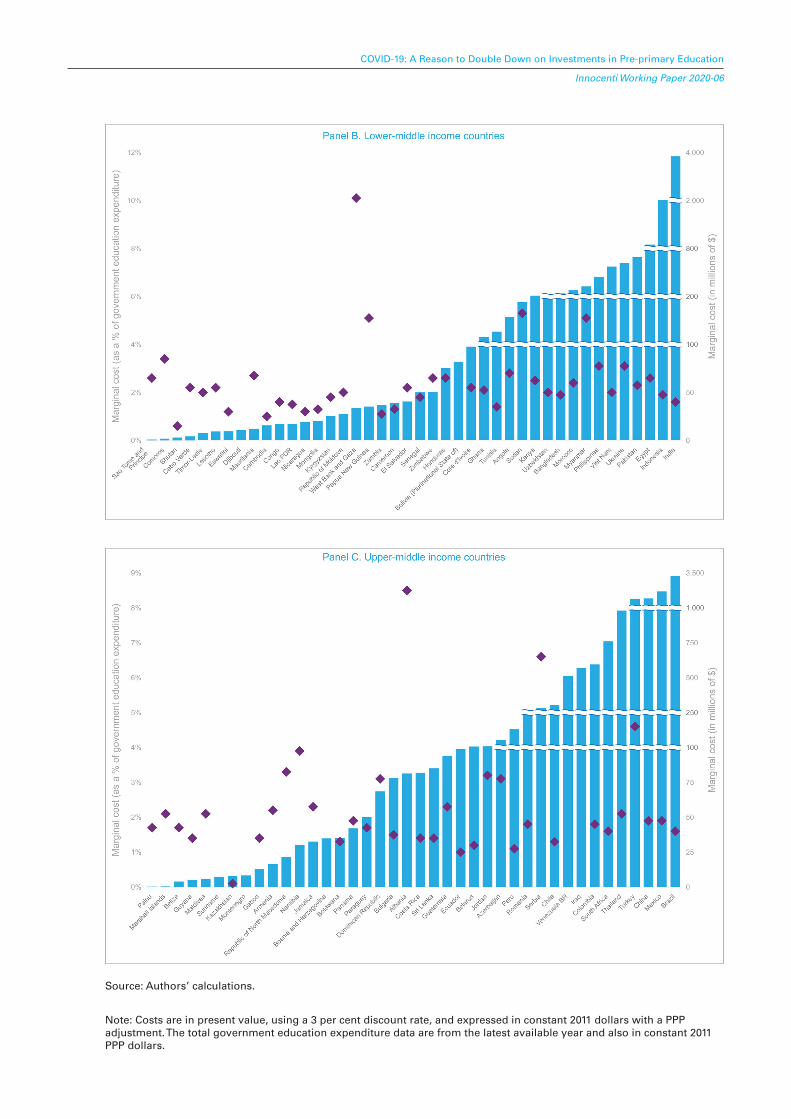
ANNEX 2: MARGINAL PUBLIC COSTS TO IMPROVE PRE-PRIMARY EDUCATION ACCESS, BY COUNTRY, INCOME GROUP AND NET PRESENT VALUE
Additional costs of raising pre-primary enrolment rates
The charts below show the marginal (additional) costs of raising pre-primary enrolment rates by 10 percentage points for the 109 countries. The blue bars represent the absolute size of the marginal cost while the purple diamonds represent the share of the marginal cost as a percentage of government education expenditures in each country.
Figure 3. Marginal public costs to improve pre-primary education access, by country and income group
COVID-19: A Reason to Double Down on Investments in Pre-primary Education
Innocenti Working Paper 2020-06
Source: Authors’ calculations.
Note: Costs are in present value, using a 3 per cent discount rate, and expressed in constant 2011 dollars with a PPP adjustment. The total government education expenditure data are from the latest available year and also in constant 2011 PPP dollars.

COVID-19: A Reason to Double Down on Investments in Pre-primary Education
Innocenti Working Paper 2020-06
Net present value
The country-level net present values for an average child are calculated by simply subtracting the total costs from total benefits, and then dividing the result by the number of children in the cohort. Figure 4 shows positive average net present values across the 109 countries and for each income group, suggesting that the benefits of expanding pre-primary access significantly outweigh the cost. Across income groups, the net present value per child ranges from US$2,153 in upper-middle-income countries to US$294 in low-income countries.
Figure 4. Net benefits (per person) of increasing access to pre-primary education by 10 percentage points, by country-income group
Net
Pre
sen
t Val
ue
All countries Low-income Lower-middle income Upper-middle income
1,134
294
705
2,153
2,500
2,000
1,500
1,000
500
0
Source: Authors’ calculations.
Note: Benefits are in present value, using a 3 per cent discount rate, and expressed in constant 2011 PPP dollars.

COVID-19: A Reason to Double Down on Investments in Pre-primary Education
Innocenti Working Paper 2020-06
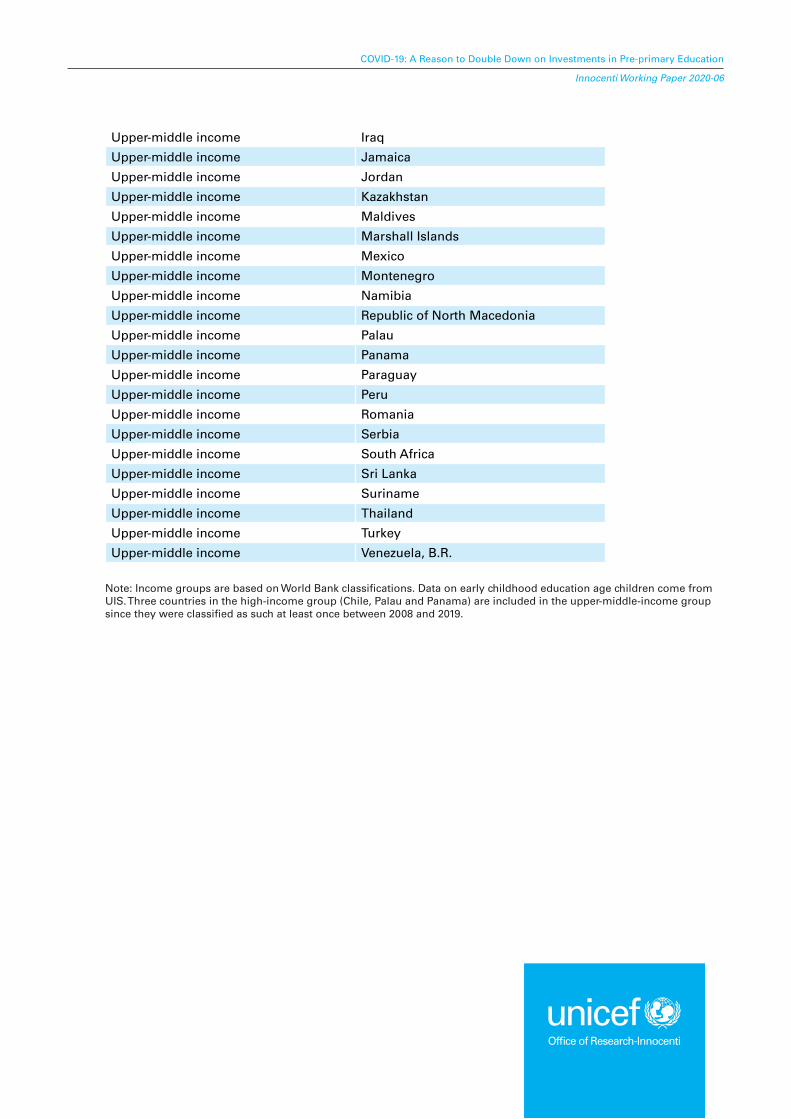
ANNEX 3: LIST OF COUNTRIES ANALYSED
Income Group Country/Territory
Low income Benin
Low income Burkina Faso
Low income Burundi
Low income Central African Republic
Low income Chad
Low income Congo, Dem. Rep.
Low income Ethiopia
Low income Gambia
Low income Guinea
Low income Guinea-Bissau
Low income Haiti
Low income Liberia
Low income Madagascar
Low income Malawi
Low income Mali
Low income Mozambique
Low income Nepal
Low income Niger
Low income Rwanda
Low income Sierra Leone
Low income Syrian Arab Republic
Low income Tajikistan
Low income United Republic of Tanzania
Low income Togo
Low income Uganda
Low income Yemen
Lower-middle income Angola
Lower-middle income Bangladesh
Lower-middle income Bhutan
Lower-middle income Bolivia (Plurinational State of)
Lower-middle income Cabo Verde
Lower-middle income Cambodia
Lower-middle income Cameroon
Lower-middle income Comoros
Lower-middle income Congo
Lower-middle income Cote d’Ivoire
Lower-middle income Djibouti
Lower-middle income Egypt
Lower-middle income El Salvador
Lower-middle income Eswatini
Lower-middle income Ghana
Lower-middle income Honduras

COVID-19: A Reason to Double Down on Investments in Pre-primary Education
Innocenti Working Paper 2020-06
Lower-middle income India
Lower-middle income Indonesia
Lower-middle income Kenya
Lower-middle income Kyrgyzstan
Lower-middle income Lao PDR
Lower-middle income Lesotho
Lower-middle income Mauritania
Lower-middle income Republic of Moldova
Lower-middle income Mongolia
Lower-middle income Morocco
Lower-middle income Myanmar
Lower-middle income Nicaragua
Lower-middle income Pakistan
Lower-middle income Papua New Guinea
Lower-middle income Philippines
Lower-middle income Sao Tome and Principe
Lower-middle income Senegal
Lower-middle income Sudan
Lower-middle income Timor-Leste
Lower-middle income Tunisia
Lower-middle income Ukraine
Lower-middle income Uzbekistan
Lower-middle income Viet Nam
Lower-middle income West Bank and Gaza
Lower-middle income Zambia
Lower-middle income Zimbabwe
Upper-middle income Albania
Upper-middle income Armenia
Upper-middle income Azerbaijan
Upper-middle income Belarus
Upper-middle income Belize
Upper-middle income Bosnia and Herzegovina
Upper-middle income Botswana
Upper-middle income Brazil
Upper-middle income Bulgaria
Upper-middle income Chile
Upper-middle income China
Upper-middle income Colombia
Upper-middle income Costa Rica
Upper-middle income Dominican Republic
Upper-middle income Ecuador
Upper-middle income Gabon
Upper-middle income Guatemala
Upper-middle income Guyana
COVID-19: A Reason to Double Down on Investments in Pre-primary Education
Innocenti Working Paper 2020-06
Upper-middle income Iraq
Upper-middle income Jamaica
Upper-middle income Jordan
Upper-middle income Kazakhstan
Upper-middle income Maldives
Upper-middle income Marshall Islands
Upper-middle income Mexico
Upper-middle income Montenegro
Upper-middle income Namibia
Upper-middle income Republic of North Macedonia
Upper-middle income Palau
Upper-middle income Panama
Upper-middle income Paraguay
Upper-middle income Peru
Upper-middle income Romania
Upper-middle income Serbia
Upper-middle income South Africa
Upper-middle income Sri Lanka
Upper-middle income Suriname
Upper-middle income Thailand
Upper-middle income Turkey
Upper-middle income Venezuela, B.R.
Note: Income groups are based on World Bank classifications. Data on early childhood education age children come from UIS. Three countries in the high-income group (Chile, Palau and Panama) are included in the upper-middle-income group since they were classified as such at least once between 2008 and 2019.