cover page - national treasury
TRANSCRIPT

1 | P a g e
Cover Page

2 | P a g e
FOREWORD
The 2019 Socio-Economic Review and Outlook seeks to synthesise the provincial
economic development factors to gauge development progress overtime. The
province has been addressing the social challenges such as unemployment, income
inequality and poverty guided by the implementation of the Limpopo Development
Plan. Progress was achieved, albeit, more still needs to be done to ensure general
equality promulgated by the Sustainable Development Goals that envisages a state of
society where living conditions and resource use continue to meet human needs
without undermining the integrity and stability of the natural system.
The international economy is currently characterized by sporadic trade tensions and
unstable geo political environment that is sending waves of uncertainty to all the
countries. Inevitably, uncertainty disturbs economic stability particularly in developed
economies with high dominance on less diversified export. Given these vulnerabilities,
African economies in particular need to constructively form a resilient inter regional
pan African economy that will address development challenges facing the continent
The provincial economy showed good resilience in the last few years by showing
positive growth and it expected to continue this growth performance. The difficult
economic conditions place a bigger emphasis on the implementation of sound fiscal
policy by Limpopo Treasury. As the province gears itself for the new Medium Term
Strategic Framework cycle, it will be imperative to acknowledge progress attained so
far and the backlogs that are still remaining and set out clear government actions to
take in enhancing the lives of the people of Limpopo.
____________________ Pratt GC CA (SA) Head of Department Limpopo Provincial Treasury

3 | P a g e
TABLE OF CONTENTS
FOREWORD ......................................................................................................... 2
ABBREVIATIONS...................................................................................................... 9
CHAPTER 1: ECONOMIC OVERVIEW ............................................................... 11
1.1 Introduction ................................................................................................. 11
1.2 World Economic Overview .......................................................................... 11
1.2.1 World Economic growth rate ................................................................. 11
1.2.2 World Investment Overview .................................................................. 13
1.2.3 World Fiscal Overview .......................................................................... 14
1.3 South African Economic Overview .............................................................. 15
1.3.1 South African growth rate ..................................................................... 15
1.3.2 Gross Fixed Capital Formation (GFCF) ................................................ 16
1.3.3 Business Confidence ............................................................................ 17
1.3.4 Consumer Price Index (CPI) ................................................................. 18
1.3.5 Exchange rates ..................................................................................... 19
1.4 Limpopo Economic Overview ...................................................................... 20
1.4.1 Limpopo economic structure ................................................................. 20
1.4.2 Limpopo Economic Growth ................................................................... 21
1.4.3 Conclusion ............................................................................................ 22
CHAPTER 2: DEMOGRAPHIC PROFILE ........................................................... 23
2.1. Introduction ................................................................................................. 23
2.2. South African population ............................................................................. 23
2.2.1. South African Population by province ................................................... 24
2.3. Limpopo population ..................................................................................... 24
2.4. Limpopo district population growth .............................................................. 26
2.5. District population growth rate ..................................................................... 26
2.6. Conclusion .................................................................................................. 27
CHAPTER 3: LABOUR MARKET ....................................................................... 29
3.1. Introduction ................................................................................................. 29
3.2. Unemployment ............................................................................................ 29
3.3. Sectoral contribution to employment ........................................................... 30
3.4. Unemployment rate in the districts .............................................................. 31

4 | P a g e
3.5. Profit, wages and productivity ..................................................................... 32
3.6. Conclusion .................................................................................................. 33
CHAPTER 4: DEVELOPMENT INDICATORS..................................................... 34
4.1. Introduction ................................................................................................. 34
4.2. Income inequality ........................................................................................ 34
4.3. Human Development Index (HDI) ............................................................... 36
4.4. Poverty ........................................................................................................ 37
4.4.1. The Lower Poverty Line in Limpopo ..................................................... 37
4.4.2. Poverty in the districts........................................................................... 38
4.4.3. Climate change and poverty ................................................................. 39
4.5. Crime Outlook ............................................................................................. 39
4.5.1. Crime by Category ................................................................................ 40
4.6. Conclusion .................................................................................................. 40
CHAPTER 5: HEALTH ........................................................................................ 41
5.1. Introduction ................................................................................................. 41
5.2. Public healthcare expenditure per person ................................................... 41
5.3. Level of satisfaction of public and private healthcare .................................. 42
5.4. Medical Aid Coverage ................................................................................. 43
5.5. Medical aid coverage in Limpopo ................................................................ 44
5.6. Disability ...................................................................................................... 45
5.6.1. SA percentage of people with disability ................................................ 45
5.7. Limpopo social grant recipients ................................................................... 46
5.8. Limpopo fertility rates .................................................................................. 46
5.9. South African life expectancy for Male and Female .................................... 47
5.10. Crude birth and death rate .......................................................................... 48
5.11. Limpopo life expectancy for males and female ........................................... 48
5.12. SA HIV Positive estimates .......................................................................... 49
5.13. Limpopo HIV positive estimates .................................................................. 50
5.14. Conclusion .................................................................................................. 50
CHAPTER 6: EDUCATION .................................................................................. 52
6.1. Introduction ................................................................................................. 52
6.2. GDP per capita and Literacy rate ................................................................ 52
6.3. Levels of education ..................................................................................... 53

5 | P a g e
6.3.1. No schooling ......................................................................................... 53
6.3.2. Post Matric Qualification ....................................................................... 54
6.3.3. Learner/ Teacher Ratio ......................................................................... 55
6.4. Conclusion .................................................................................................. 56
CHAPTER 7: BASIC SERVICES ......................................................................... 57
7.1. Introduction ................................................................................................. 57
7.2. Housing ....................................................................................................... 57
7.3. Sanitation .................................................................................................... 58
7.4. Water Services ............................................................................................ 59
7.5. Access to electricity ..................................................................................... 61
7.6. Provincial Roads Infrastructure ................................................................... 62
7.7. Conclusion .................................................................................................. 64
CHAPTER 8: TOURISM ...................................................................................... 65
8.1. Introduction ................................................................................................. 65
8.2. The comparative advantage of Limpopo Province as tourism destination .. 65
8.3. Tourism Performance in Limpopo ............................................................... 66
8.4. Tourism Clusters as building blocks for tourism growth in Limpopo. ........... 69
8.5. Conclusion .................................................................................................. 69

6 | P a g e
TABLE OF FIGURES
Figure 1: World Investment, Percent of GDP ........................................................... 13
Figure 2: World fiscal position .................................................................................. 14
Figure 3: GDP Constant 2010 prices, seasonally adjusted % change Q-on-Q,
annualised ................................................................................................................ 15
Figure 4: GFCF constant 2010 prices, seasonally adjusted % change Q-on-Q,
annualized and by organization ................................................................................ 17
Figure 5: RMB / BER Business Confidence index and SACCI Business Confidence
index ......................................................................................................................... 18
Figure 6: CPI for total country: All items ................................................................... 19
Figure 7: Exchange rate of the rand- Rand per US dollar and Rand per Euro ......... 19
Figure 8: Size of economies measured as GDP Constant 2010 prices (R 1000) ..... 20
Figure 9: Gross Value Added by Region (GVA-R) Region's share of national total (%)
................................................................................................................................. 21
Figure 10: GDP Constant 2010 prices percentage change ...................................... 21
Figure 11: South African population growth and projections .................................... 23
Figure 12: Provincial population and percentage contribution .................................. 24
Figure 13: Limpopo population and population growth rate...................................... 25
Figure 14: Limpopo population estimates by age and sex, 2018 ............................. 25
Figure 15: Limpopo district population growth .......................................................... 26
Figure 16: Limpopo District population growth rate .................................................. 27
Figure 17: Number of unemployed people and unemployment rate in Limpopo ...... 29
Figure 18: Total employment contribution in 2017 ................................................... 31
Figure 19: Employment in the informal sector in Limpopo ........................................ 31
Figure 20: Number of unemployed per district ......................................................... 32
Figure 21:The Gini coefficient in the Limpopo .......................................................... 35
Figure 22: HDI in Limpopo ....................................................................................... 36
Figure 23: The % and number of people in poverty in Limpopo ............................... 38
Figure 24: A public healthcare spending per person ................................................ 42
Figure 25: Limpopo and SA level of satisfaction public and private healthcare ........ 43
Figure 26: SA medical aid coverage ........................................................................ 44
Figure 27: Medical aid coverage in Limpopo (‘000) .................................................. 44
Figure 28: SA percentage of people with disability ................................................... 45

7 | P a g e
Figure 29:Total number of social grant by grant type in Limpopo (2018) ................. 46
Figure 30: Limpopo fertility rates .............................................................................. 47
Figure 31: South African life expectancy for Male and Female ................................ 47
Figure 32: Crude Birth and Death Rate .................................................................... 48
Figure 33: Limpopo life expectancy for males and female ....................................... 49
Figure 34: South African HIV Population growth ...................................................... 49
Figure 35: Limpopo HIV positive estimates .............................................................. 50
Figure 36: GDP per capita and Literacy rate ............................................................ 53
Figure 37: Share of people with no schooling and by district ................................... 53
Figure 38: Matric only senior phase by district ......................................................... 54
Figure 39: Post matric qualifications and by district ................................................. 55
Figure 40: Learner teacher ratio for Limpopo for private and public schools and
growth rate of educators and learners in public schools........................................... 56
Figure 41: Households by water infrastructure Limpopo .......................................... 60
Figure 42: Percentage of households with access to electricity by municipal
category, .................................................................................................................. 61
Figure 43: Provincial road classification 2019 and network by districts 2019 ........... 63
Figure 44: Resource allocation on provincial road infrastructure 2019 ..................... 63
Figure 45: International tourism performance and spent in Limpopo 2013-2017 ..... 68
Figure 46: Domestic trips to Limpopo 2013-2017 ..................................................... 68

8 | P a g e
TABLE OF TABLES
Table 1: World Gross domestic product (GDP), constant prices Percent change .... 12
Table 2: GDP constant 2010 prices, seasonally adjusted % change Q-on-Q,
annualised ................................................................................................................ 16
Table 3: Inequality in on district level........................................................................ 35
Table 4: The poverty levels in the districts ............................................................... 38
Table 5: The number of cases per category ............................................................. 40
Table 6: Share of households occupying formal dwellings and formal dwellings
backlog ..................................................................................................................... 58
Table 7: Household access to sanitation in South Africa, 2011 and 2016 ................ 59
Table 8: Share of households with hygiene toilets and sanitation backlogs ............. 59
Table 9: Share of households with piped water and water backlogs ........................ 60
Table 10: Share of households with electricity and electricity backlog ..................... 62

9 | P a g e
ABBREVIATIONS
AIDS - Acquired Immune Deficiency Syndrome
ART - Antiretroviral Therapy
ARV - Antiretroviral
EAP - Economic Active Population
ECD - Early Childhood Development
GDP - Gross domestic product
GFCF - Gross Fixed Capital Formation
GHS - General Household Survey
GOS - Gross Operating Surplus
GVA - Gross Value Added
HDI - Human Development Index
HIV - Human Immunodeficiency Virus
IMF - International Monetary Fund
LDP - Limpopo Development Plan
LED - Local Economic Development
LICs - Low Income Countries
LTA - Limpopo Tourism Agency
NDP - National Development Plan
NHI - National Health Insurance
OECD - Organization for Economic Cooperation and Development
QLFS - Quarterly Labour Force Survey
Q-on-Q - Quarter on Quarter
RDTs - Rapid Diagnostic Tests
SA - South African
SADC - Southern Africa Development Community
SASSA - South African Social Security Agency
SDGs - Sustainable Development Goals
SERO - Socio Economic Review and Overview
SEZs - Special Economic Zone
StatsSA - Statistics South Africa
TVET - Technical and Vocational Education and Training

10 | P a g e
UK - United Kingdom
UN - United Nations
UNESCO - United Nations Educational Scientific and Cultural organization
US - United States
USA - United States of America
WHO - World Health Organization’s
WIDE - World Inequality Database on Education
WTO - World Trade Organization

11 | P a g e
CHAPTER 1: ECONOMIC OVERVIEW
1.1 Introduction
World economy has undergone economic and financial market turbulences which
some countries inevitably are still battling to recover from or still dealing with the
consequences. Emerging and developing economies to a large extend are highly
affected by trade tensions, geo-political uncertainties and most topically environmental
consideration. The Sustainable Development Goals (SDG’s) envisages inclusive
growth that is environmentally friendly and doesn’t put the lives of people in danger,
South Africa needs to be agile and develop adaptive policies and find opportunities in
the current developments.
The country’s economy suffered episodes of weak investor confidence, sporadic fuel
prices, and unfavourable international trade amendments over the past 5 years.
However, it has just emerged from a technical recession through recovery in the
Agriculture, Manufacturing and the Financial sector. It is important that as the economy
is steered towards accelerated economic growth, it is also appreciating international
protocols such as the Sustainable Development Goals (SDGs). Limpopo is
characterized as an extractive economy with the mining sector contributing the most
compared to other sectors, it is important that this sector strives towards sustainable
business models that are beneficial for the environment and the people in the province.
1.2 World Economic Overview
1.2.1 World Economic growth rate
Global economic growth rate averaged 3.6 percent since 2014 maintaining positive
yet moderate trends amidst trade and geopolitical tensions. These tensions, combined
with concerns about softening global growth prospects, have weighed on investor
sentiment. World economic growth in 2018 is projected to be 3.7 percent. Global
growth is projected by the IMF to decline to 3.6 percent in 2019 before picking up
slightly to 3.7 percent in 2020.The World Bank is even more bearish than the IMF, only

12 | P a g e
expecting 2.9 percent world economic growth during 2019. This growth pattern reflects
a persistent decline in the growth rate of advanced economies together with a
temporary decline in the growth rate for emerging market and developing economies
in 2019. The current trade tensions between America and China had a bigger negative
impact on China than America.
Table 1: World Gross domestic product (GDP), constant prices Percent change
Source: IMF World Economic Outlook Database, October 2018
Advanced Economies
Growth in the Euro area is set to weaken from 2.39 percent in 2017 to 2.03 percent in
2018. Growth rates have been marked down for many economies, notably Germany
(due to soft private consumption, weak industrial production following the introduction
of revised auto emission standards, and subdued foreign demand); Italy (due to weak
domestic demand and higher borrowing costs as sovereign yields remain elevated);
and France (due to the negative impact of street protests and industrial action).
Developing Economies
Developing economies remain the main drivers of global growth expected to grow by
4.68 percent in 2018. In 2017, Asia accounted for nearly half of global growth, as the
region continue to expand at a relatively rapid pace. The Chinese economy alone
contributed about one-third of global growth during the year. Growth in emerging and
developing Asia is expected to moderate in the medium term. Despite fiscal stimulus
that offsets some of the impact of higher US tariffs, China’s economy will slow down
Country Group Name 2014 2015 2016 2017 2018 2019 2020 2021
World 3.58 3.45 3.27 3.74 3.73 3.65 3.66 3.64
Advanced economies 2.07 2.31 1.71 2.34 2.36 2.13 1.72 1.68
Euro area 1.42 2.05 1.89 2.39 2.03 1.88 1.65 1.55
Emerging market and developing economies 4.72 4.30 4.39 4.72 4.68 4.68 4.93 4.88
Emerging and developing Asia 6.81 6.80 6.46 6.54 6.52 6.31 6.42 6.31
Emerging and developing Europe 3.91 4.73 3.27 5.98 3.77 1.98 2.83 2.55
Sub-Saharan Africa 5.14 3.27 1.40 2.75 3.07 3.76 3.91 3.95
South Africa 1.85 1.28 0.57 1.32 0.76 1.40 1.74 1.80

13 | P a g e
due to the combined influence of needed financial regulatory tightening and trade
tensions with the United States. India’s economy is poised to pick up in 2019,
benefiting from lower oil prices and a slower pace of monetary tightening than
previously expected, as inflation pressures ease.
Sub-Saharan Economies
In Sub-Saharan Africa, growth is expected to pick up in the medium term from 3.07
percent to 3.95 in 2021. Softening oil prices have caused downward revisions for some
oil producing African economies such as Angola and Nigeria as oil is the most traded
commodity and major revenue generator. African growth potential is subdued by lack
of interregional trade, geopolitical tensions and less developed financial markets.
1.2.2 World Investment Overview
The composition of global demand has shifted more towards investment since 2017.
Gross fixed capital formation accounted for roughly 60 percent of the acceleration in
global economic activity in 2017. This improvement, however, is relative to a very low
base, following two years of exceptionally weak investment growth. From the below
figure, all three regions witness a fall in investment activity between 2015 and 2016.
Business investment contracted in a number of large economies in 2016, including
Argentina, Australia, Brazil, Canada, the Russian Federation, South Africa, the United
Kingdom of Great Britain and Northern Ireland and the United States of America.
Figure 1: World Investment, Percent of GDP
Source: IMF World Economic Outlook Database, October 2018

14 | P a g e
Advanced economies experienced significant rebound in total investment from 2016
and it’s expected to maintain the momentum in the medium term provided trade
tensions are managed and do not change investor sentiments. Total investment as a
percentage of GDP is expected to grow from 22.0 percent in 2018 to 22.7 in 2020.
While investment deteriorated in the sub Saharan region from 21.1 percent in 2017 to
20.5 in 2018. However, the situation is anticipated to change in the future. Emerging
market and developing economies have sustained high levels of investment as a
percentage of their GDP. In 2018, investment was 32.8 percent and not expected to
change in the medium term.
A more entrenched recovery in investment growth is likely to be held back by elevated
levels of uncertainty over future trade policy arrangements, the impact of balance
sheet adjustments in major central banks, as well as high debt and a build-up of longer-
term financial fragilities.
1.2.3 World Fiscal Overview
General government debt levels are rising in all the regions, this is indicative of counter
cyclical fiscal policy stance of many economies that sought to stimulate economic
growth through stimulated aggregate demand. Many countries have sizable
government debt and primary fiscal deficits, elevated or rising private debt, and high
non-performing loans. Corporate borrowers have increasingly relied on bond markets
to finance rising debt levels, and now face significant refinancing needs amid rising
interest rates. This could result in sudden increases in corporate default rates and
have a sustained negative effect on investment and financial stability.
Figure 2: World fiscal position
Source: IMF World Economic Outlook Database, October 2018
15 | P a g e
Advanced economies have the largest accumulated debt, recording an average
government debt to GDP of 104 percent over the past 5 years. Although the gap
between government expenditure and revenue is narrowing, the levels of debt remain
a risk. Emerging market and developing economies are witnessing a rise in
government debt to GDP from 33.9 percent in 2008 to 48.6 percent in 2017 and it’s
expected to rise to 53.1 in 2020. A similar trend is witnessed for Sub-Saharan African
countries whose government debt to GDP is at 45.4 percent from 25.0 percent in 2008.
Debt vulnerabilities in Low-Income Countries (LICs) have increased substantially in
recent years.
1.3 South African Economic Overview
1.3.1 South African growth rate
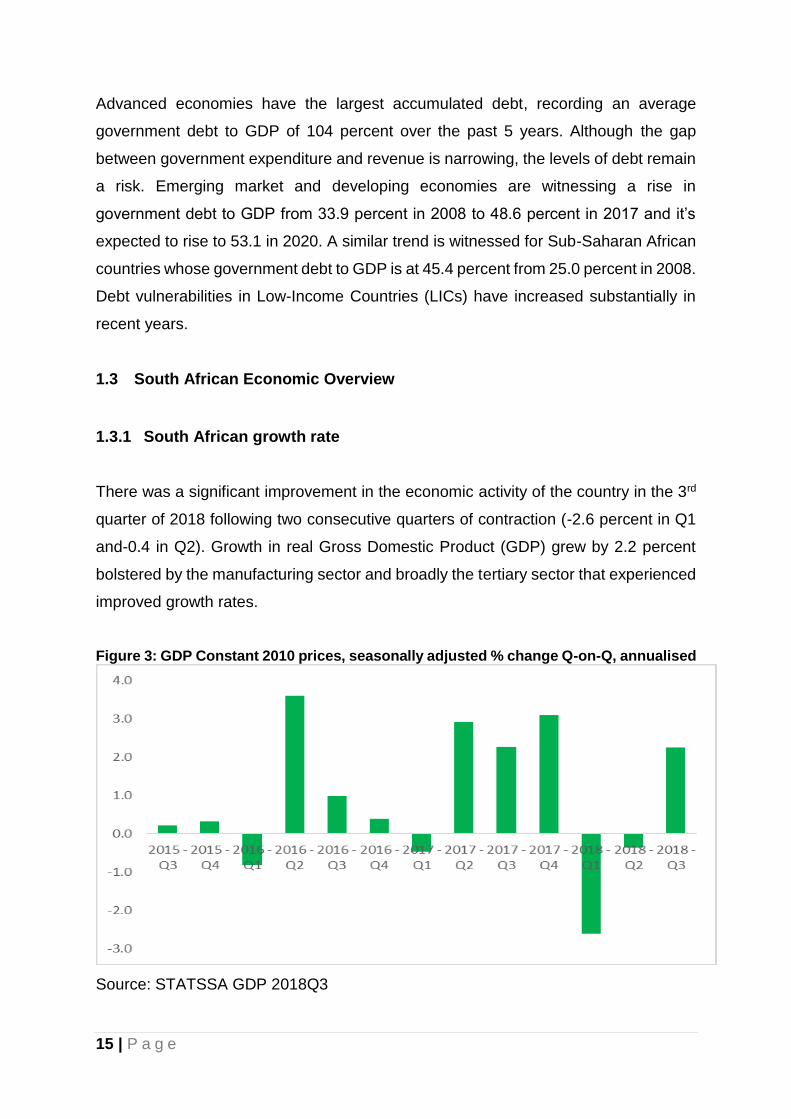
There was a significant improvement in the economic activity of the country in the 3rd
quarter of 2018 following two consecutive quarters of contraction (-2.6 percent in Q1
and-0.4 in Q2). Growth in real Gross Domestic Product (GDP) grew by 2.2 percent
bolstered by the manufacturing sector and broadly the tertiary sector that experienced
improved growth rates.
Figure 3: GDP Constant 2010 prices, seasonally adjusted % change Q-on-Q, annualised
Source: STATSSA GDP 2018Q3
16 | P a g e
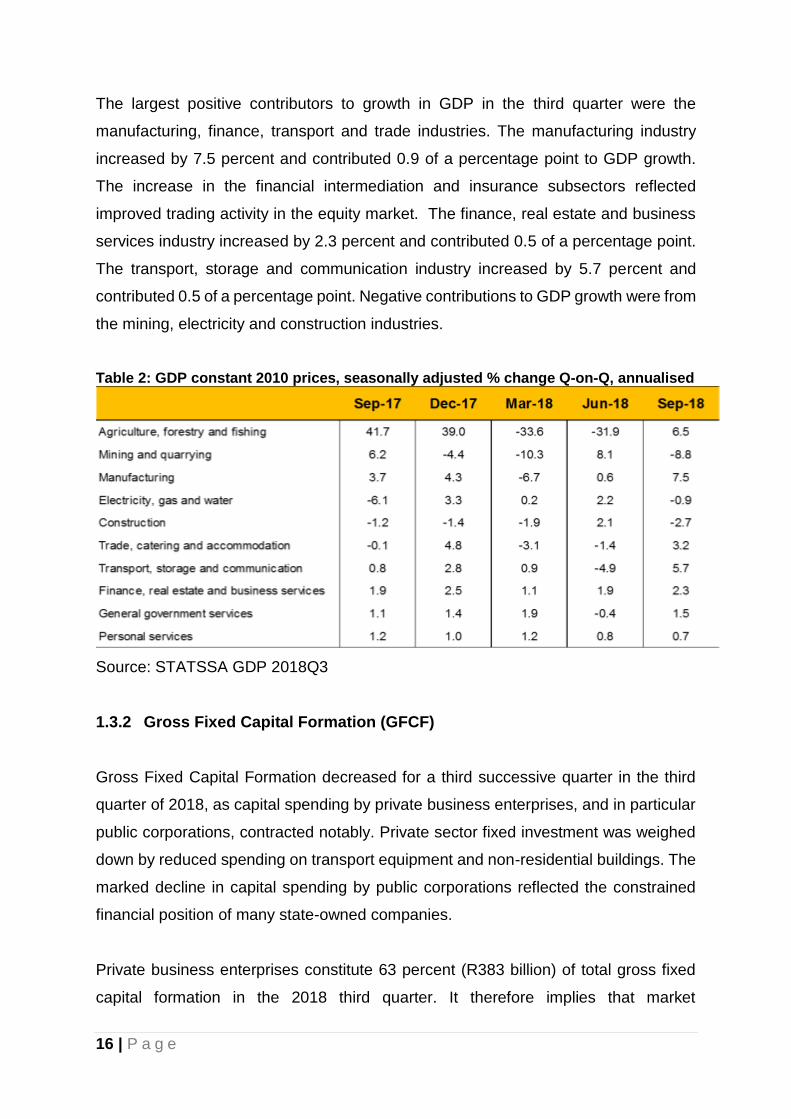
The largest positive contributors to growth in GDP in the third quarter were the
manufacturing, finance, transport and trade industries. The manufacturing industry
increased by 7.5 percent and contributed 0.9 of a percentage point to GDP growth.
The increase in the financial intermediation and insurance subsectors reflected
improved trading activity in the equity market. The finance, real estate and business
services industry increased by 2.3 percent and contributed 0.5 of a percentage point.
The transport, storage and communication industry increased by 5.7 percent and
contributed 0.5 of a percentage point. Negative contributions to GDP growth were from
the mining, electricity and construction industries.
Table 2: GDP constant 2010 prices, seasonally adjusted % change Q-on-Q, annualised
Source: STATSSA GDP 2018Q3
1.3.2 Gross Fixed Capital Formation (GFCF)
Gross Fixed Capital Formation decreased for a third successive quarter in the third
quarter of 2018, as capital spending by private business enterprises, and in particular
public corporations, contracted notably. Private sector fixed investment was weighed
down by reduced spending on transport equipment and non-residential buildings. The
marked decline in capital spending by public corporations reflected the constrained
financial position of many state-owned companies.
Private business enterprises constitute 63 percent (R383 billion) of total gross fixed
capital formation in the 2018 third quarter. It therefore implies that market

17 | P a g e
vulnerabilities and policy uncertainties will have a damning effect of the national GDP
and subsequently the jobs and social wellbeing. Public corporations are the second
largest contributors to total GFCF followed by general government. It is crucial that
state entities/ public corporations efficiently and effectively utilize public resources as
their spending evidently is significant.
Figure 4: GFCF constant 2010 prices, seasonally adjusted % change Q-on-Q, annualized and by organization
Source: STATSSA GDP 2018Q3
1.3.3 Business Confidence
The business confidence in South Africa is being measured by means of indexes like
the RMB/BER Business Confidence Index and the SACCI Business Confidence index.
The indexes are based on monthly surveys amongst the business community. Both
the RMB / BER Business Confidence index and SACCI Business Confidence index
are trending downwards over time. This is an after effect of a number of episodes that
transpired in the country over the years. Investment zeal subsided after 2010 where
business confidence had reached the peak and began its downturn. Political
contestations by opposition parties and within the ruling party weighed on investor
confidence during 2015 and mid-2017. However, the change of leadership in the ruling
party towards the end of 2017 and reassurance of prudent economic policy narrative
significantly boosted investor confidence. RMB / BER Business Confidence index was
reported to be 27 points in the second quarter of 2017, but improved to 44 points in
the first half of 2018. It is rather concerning to observe a decline in the last quarter of
2018 to 31 points. SACCI Business Confidence index generally follows the same
trends as the RMB / BER Business Confidence index, however it recorded improved

18 | P a g e
business confidence of 95.8 points in the fourth quarter of 2018 from 94.7 points in the
third quarter.
Figure 5: RMB / BER Business Confidence index and SACCI Business Confidence index
Source: Econostat 2019
1.3.4 Consumer Price Index (CPI)
Domestic inflationary pressures have increased in the second half of 2018,
accelerated by the surge of international crude oil prices. To a lesser extent, the
depreciation in the exchange value of the rand from February 2018 contributed to this
acceleration. By fourth quarter of 2018, headline CPI was recorded at 5.0. It is
anticipated that it might rise to 5.2 in the first quarter of 2019 but moderate through the
rest of the year, provided that the USA does not increase its interest rate, which is not
likely, and crude oil prices remain stationary. It is therefore expected that wage
increases will be moderate unlike in 2014 and 2016 period where headline inflation
was around 6.5 percent.

19 | P a g e
Figure 6: CPI for total country: All items
Source: Econostat 2019 (Forecasts Own calculation)
1.3.5 Exchange rates
The South African rand has been firming up against the major currencies since the
beginning of 2019. The rand was R14.50 a dollar on 02 January 2019 strengthening
to R13.60 a dollar on 30 January 2019. The same can be said about the Euro.
Government departments need to adopt currency hedging to maximize on their
budgets. Currency hedging is a strategy designed to mitigate the impact of currency
or foreign exchange risk. Popular methods for hedging currency are forward contracts,
spot contracts, and foreign currency options. Imported goods and services are
relatively less expensive now than they were in the beginning of the month, this
strategy of currency hedging could be beneficial for Departments such as Health,
Transport, Agriculture and Energy.
Figure 7: Exchange rate of the rand- Rand per US dollar and Rand per Euro
Source: Econostat 2019

20 | P a g e
1.4 Limpopo Economic Overview
1.4.1 Limpopo economic structure
The Limpopo province economy is the sixth largest economy in the country recording
GDP value of R224 billion surpassing North West, Free State and Northern Cape
provinces. The provincial economy is constituted by five districts of which Capricorn,
Mopani and Waterberg are the largest economies. It is in these three districts where
there is relatively higher human development due to the concentration of economic
activities. However, Limpopo’s human development, when compared to other
provinces, is generally lower as the province is characterized as rural.
Figure 8: Size of economies measured as GDP Constant 2010 prices (R 1000)
Source: IHS Markit Regional Explorer 2019
The province is the leading mining province in the country and has one of the lowest
manufacturing activities. This indicates low diversification in the local economy. The
provincial economy is driven by mining sector and secondly by community services of
which its contributions have not drastically changed since 1994. Provincial government
total expenditure mainly goes to compensation of employees and a small fraction goes
to purchasing of goods and services. The first review the province needs to undertake
is to ensure that it pays personnel who are actually rendering the service and at the
commensurate rate. Secondly, ensure that the goods and services budget boosts local
economy by supporting local manufacturers at the market related rate.

21 | P a g e
Figure 9: Gross Value Added by Region (GVA-R) Region's share of national total (%)
Source: IHS Markit Regional Explorer 2019
1.4.2 Limpopo Economic Growth
The provincial economy has been underperforming or experiencing a negative growth
trajectory since 1997. In 2017, the province recorded growth of 1.8 percent, an
improvement from -0.6 percent in 2016. The 2017 growth was supported by Waterberg
and Sekhukhune districts recording growth of 3.3 percent and 3.1 percent respectively.
The subdued provincial growth can be associated with unfavourable commodity
prices, increasing operating expenses for mines and the El Nino climate phenomenon
that farmers are still recovering from.
Figure 10: GDP Constant 2010 prices percentage change
Source: IHS Markit Regional Explorer 2019

22 | P a g e
1.4.3 Conclusion
Trade organizations such as the World Trade Organization (WTO) and global financial
institutions such as the International Monetary Fund (IMF) need to intervene in unfair
trade policy stances of elite influential countries and ensure financial stability in the
world markets. Failure to do so, vulnerable countries in developing economies stand
to be severely impacted.
South Africa is among the developing economies that seek to catch up with developed
economies. The characteristic of a developing economy implies that the country has
lacked behind on the stages of development. Developed economies are transiting to
service economies, otherwise coined deindustrialization; a decline in the importance
of manufacturing and industry, whether this is a decrease in the size of the industry,
in its share of the GDP or in employment levels within the sector. This is evident in the
United States and Europe, as well as Japan and, more recently, East Asia. This phase
is supported by huge financial injections in research and development and the
emergence of the fourth industrial revolution. As economic structures change, South
Africa needs to swiftly realign its economic framework to remain competitive in the
global arena. Of course without discounting the importance of environmental
sustainability in its plans.
The province is suffering from a low industrial activity such that it is characterized as
an extractive economy. Albeit, it is well endowed with vast natural resources such as
the land mass, sun and other minerals, which are the basis at which it can explore
renewable energies. The fourth industrial revolution can be a niche for the province to
capitalize on by aligning the current skills profile with the market needs.

23 | P a g e
CHAPTER 2: DEMOGRAPHIC PROFILE
2.1. Introduction
Examining the population dynamics of a country or a region continues to be a crucial
element of planning as it entails or outlines more population parameters beyond
breaking down of numbers. Population dynamics, such as changes in population size,
structure and distribution, and the associated demographic factors of births, deaths
and migration, affects all facets of human life. Planners in every sector should examine
the population aspects of their sectors carefully and address their sector plans with
reference to the relevant population issues.
2.2. South African population
Figure 11: South African population growth and projections
Source: StatsSA Mid-Year population estimates 2018
The South African population has been on a rise in recent years, the national
population grew from 49.5 million in 2008 to 57.7 million in 2018. The population in the
country is further projected to grow to 59.1 million in 2020. The growth is stimulated
by a number of factors, among others being, the increasing life expectancy of the
South African population, reduction in terms of mortalities and inward migration from
neighbouring SADC countries.
49.56
52.51
55.91
57.73
59.12
44
46
48
50
52
54
56
58
60
2008 2012 2016 2018 2020
24 | P a g e
2.2.1. South African Population by province
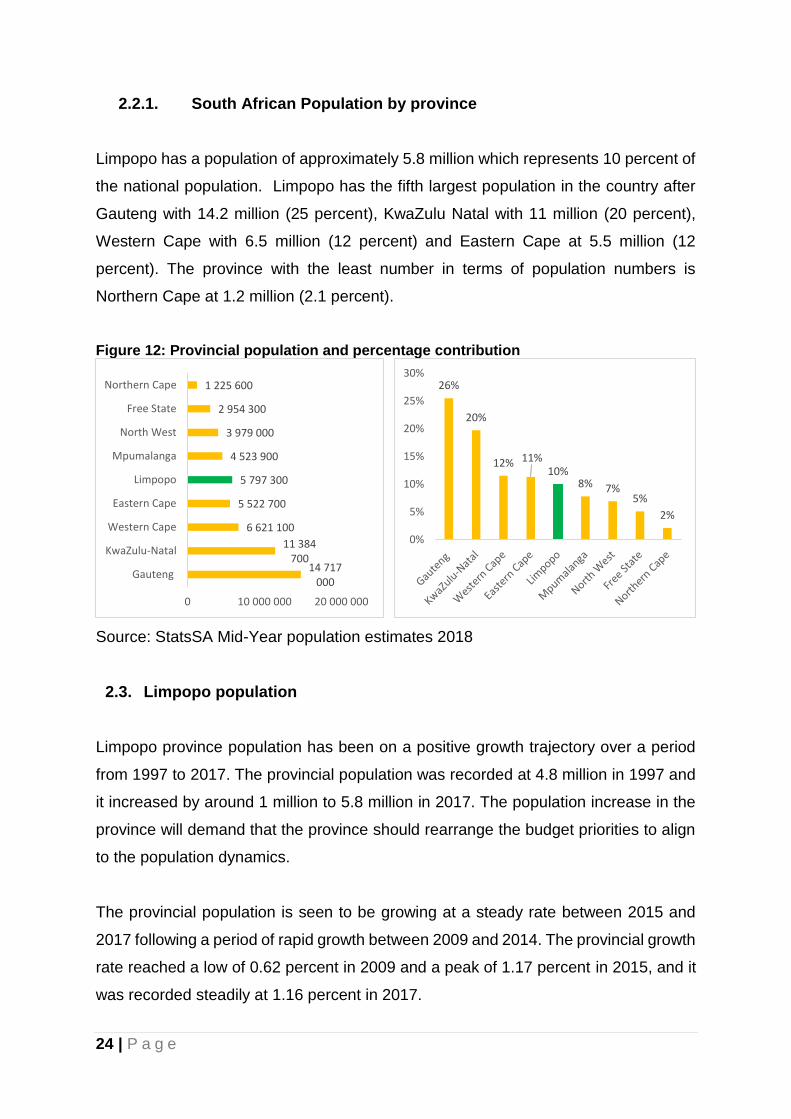
Limpopo has a population of approximately 5.8 million which represents 10 percent of
the national population. Limpopo has the fifth largest population in the country after
Gauteng with 14.2 million (25 percent), KwaZulu Natal with 11 million (20 percent),
Western Cape with 6.5 million (12 percent) and Eastern Cape at 5.5 million (12
percent). The province with the least number in terms of population numbers is
Northern Cape at 1.2 million (2.1 percent).
Figure 12: Provincial population and percentage contribution
Source: StatsSA Mid-Year population estimates 2018
2.3. Limpopo population
Limpopo province population has been on a positive growth trajectory over a period
from 1997 to 2017. The provincial population was recorded at 4.8 million in 1997 and
it increased by around 1 million to 5.8 million in 2017. The population increase in the
province will demand that the province should rearrange the budget priorities to align
to the population dynamics.
The provincial population is seen to be growing at a steady rate between 2015 and
2017 following a period of rapid growth between 2009 and 2014. The provincial growth
rate reached a low of 0.62 percent in 2009 and a peak of 1.17 percent in 2015, and it
was recorded steadily at 1.16 percent in 2017.
14 717 000
11 384 700
6 621 100
5 522 700
5 797 300
4 523 900
3 979 000
2 954 300
1 225 600
0 10 000 000 20 000 000
Gauteng
KwaZulu-Natal
Western Cape
Eastern Cape
Limpopo
Mpumalanga
North West
Free State
Northern Cape 26%
20%
12% 11%10%
8% 7%5%
2%
0%
5%
10%
15%
20%
25%
30%

25 | P a g e
Figure 13: Limpopo population and population growth rate
Source: IHS Markit Regional eXplorer 2018
Limpopo population structure is dominated by youth as it is more imbalanced towards
the youth population, these are people who are 35 years and below. The highest
population concentration is on the years below 14 years, for both males and females.
The total population contribution of the below 14 years’ age group is about two million
people. This indicates that the composition of the population is growing especially
among infants, teenagers and youth.
Figure 14: Limpopo population estimates by age and sex, 2018
Source: StatsSA 2018
4 843 0395 300 527
5 813 302
0
1 000 000
2 000 000
3 000 000
4 000 000
5 000 000
6 000 000
7 000 000
1997 2002 2007 2012 2017
Limpopo Population
0.0%
0.2%
0.4%
0.6%
0.8%
1.0%
1.2%
1.4%
Limpopo Population Growth Rate
-400 000 -200 000 0 200 000 400 000
0-4
10-14
20-24
30-34
40-44
50-54
60-64
70-74
80+
Male Female
688 603677 757
618 971541 501
524 829524 842
484 729390 511
298 944239 729
199 782167 650
139 315109 005
73 27451 56466 271
0 200 000 400 000 600 000 800 000
0-45-9
10-1415-1920-2425-2930-3435-3940-4445-5950-5455-5960-6465-6970-7475-79
80+

26 | P a g e
2.4. Limpopo district population growth
The diagram below shows the 2017 provincial population by district. Vhembe at 1.386
Million and Capricorn at 1.353 Million are the biggest in terms of the provincial
population share, followed by Greater Sekhukhune at 1.180 Million, Mopani at 1.145
Million, and Waterberg at 746 thousand respectively. Vhembe District continues to be
the most populous district in the province.
Figure 15: Limpopo district population growth
Source: IHS Markit Regional eXplorer 2018
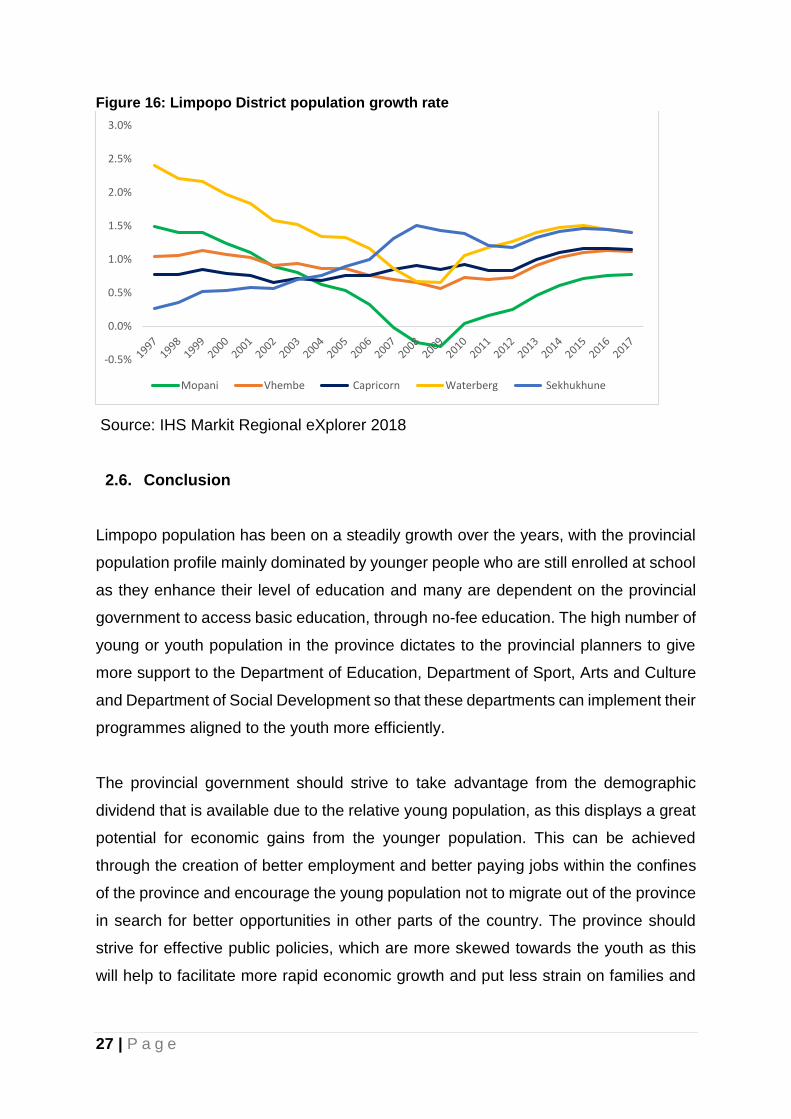
2.5. District population growth rate
Sekhukhune and Waterberg district population growth rate are at high in the province
as they were recorded at an average of around 1.4 percent and 1.5 percent
respectively. Mopani is the slowest growing district in terms of population growth at an
average of 0.7 percent in 2017. The diagrams below indicate that the province should
pay special attention to Sekhukhune and Waterberg districts when planning the
allocation of the provincial resources as these two mining districts have a high potential
to outgrow the other districts due to inward migration as people may be flocking in
looking for better employment opportunities in the mines.
1 145 704
1 386 821
1 353 381
746 772
1 180 624
300 000
500 000
700 000
900 000
1 100 000
1 300 000
1 500 000
1997 2002 2007 2012 2017
District Population
Mopani Vhembe Capricorn Waterberg Sekhukhune
27 | P a g e
Figure 16: Limpopo District population growth rate
Source: IHS Markit Regional eXplorer 2018
2.6. Conclusion
Limpopo population has been on a steadily growth over the years, with the provincial
population profile mainly dominated by younger people who are still enrolled at school
as they enhance their level of education and many are dependent on the provincial
government to access basic education, through no-fee education. The high number of
young or youth population in the province dictates to the provincial planners to give
more support to the Department of Education, Department of Sport, Arts and Culture
and Department of Social Development so that these departments can implement their
programmes aligned to the youth more efficiently.
The provincial government should strive to take advantage from the demographic
dividend that is available due to the relative young population, as this displays a great
potential for economic gains from the younger population. This can be achieved
through the creation of better employment and better paying jobs within the confines
of the province and encourage the young population not to migrate out of the province
in search for better opportunities in other parts of the country. The province should
strive for effective public policies, which are more skewed towards the youth as this
will help to facilitate more rapid economic growth and put less strain on families and
-0.5%
0.0%
0.5%
1.0%
1.5%
2.0%
2.5%
3.0%
Mopani Vhembe Capricorn Waterberg Sekhukhune

28 | P a g e
government in the long-run. The high number of young people also implies that a
substantial number of people in the province is dependent on child grants.
The growth in provincial population in the last decade should be accompanied by the
necessary structural transformation so that equitable human development and
improved livelihoods for the people can be achieved. Changes in the population
dynamics of the provincial districts, such as changes in population size, structure and
distribution, and the associated demographic factors of births, deaths and migration
need to be given more attention. Planners in the province should start to give special
attention to Sekhukhune and Waterberg districts when planning the allocation of the
provincial resources as these two mining districts have a high potential to outgrow the
other districts due to inward migration as people may be flocking in looking for better
employment opportunities in the mines.

29 | P a g e
CHAPTER 3: LABOUR MARKET
3.1. Introduction
The issues related to the labour market has been identified as key in the South African
economy. The national unemployment rate continues to be higher than 25 percent
despite the various efforts to reduce it. Unemployment has been highlighted as a key
policy issue in various government economic policy documents like the National
Development Plan, the New Growth Path and the Limpopo Development Plan (LDP)
The LDP is aligned to the NDP and accepted the NDP target of reducing
unemployment in 2019 to 14 percent and to 6 percent in 2030.
3.2. Unemployment
The unemployment rate in Limpopo decreased from 19.1 percent in quarter 3 in 2017
to 18.7 percent in the same quarter in 2018. This slight decrease in the unemployment
rate is seen in the decrease in the actual number of unemployed people from 373
thousand in the third quarter of 2017 to 344 thousand in the corresponding quarter in
2018.
Figure 17: Number of unemployed people and unemployment rate in Limpopo
Source: StatsSA QLFS various issues
17.00%
17.50%
18.00%
18.50%
19.00%
19.50%
20.00%
20.50%
21.00%
21.50%
22.00%
22.50%
320000
330000
340000
350000
360000
370000
380000
390000
Jul - Sep 2016 Jul - Sep 2017 Jul - Sep 2018
Number of unemployed % of unemployed

30 | P a g e
Despite the decline in the unemployment rate, the current level of unemployment is
still high especially when we have to consider the discouraged workers (people who
have given up looking for work). Some of the issues that needs to be addressed
includes that fact that the labour force participation rate and absorption rate in the
province is still relatively low. The first issue is to increase the labour force participation
and absorption rates in the provincial economy. In the third quarter of 2018 the labour
force participation rate1 was 48.7 percent and absorption rate was 39.5 percent in the
province. More than 1.9 million people were deemed not to be economically active
and 444 thousand job seekers deemed to be discouraged and not actively looking for
work. The labour force participation rate of 48.7 percent implies that 51.3 percent of
the potential workers are not working or actively looking for work.
The effort to create jobs in the provincial economy should focus on the promotion of
the labour absorbing industries. A major challenge in this regard is the capital intensive
nature of mining as a sector which limits the potential to create more jobs. The most
labour intensive sector, where jobs can be created at the lowest cost, is the agricultural
sector. The Economic Active Population (EAP) as share of the total population should
also further be increased. According to IHS Market, the ratio of the EAP to the total
population in Limpopo increased from 16.4 in 1996 to 29.2 percent.
3.3. Sectoral contribution to employment
The contribution of the different sectors to job creation in the Limpopo province is
indicated in the Figure below. The three biggest contributors to employment is the
trade, community services and agricultural sector. The 10 percent contribution of
agriculture is fairly significant in view of the fact that the sector only contributes
approximately 3 percent to the local economy. Mining only contributes 5 percent of
the jobs despite its share of the provincial economy being nearly 28 percent.
1 Employed/labour force ratio

31 | P a g e
Figure 18: Total employment contribution in 2017
Source: IHS Markit Regional Explorer 2018
According to Fourie (2014) the informal sector has great potential to contribute to the
job creation in the provincial economy. According to IHS Markit Regional Explorer
2018, 364 thousand people were employed in the informal sector in the province.
Figure 19: Employment in the informal sector in Limpopo
Source IHS Markit Regional Explorer 2018
3.4. Unemployment rate in the districts
The highest number of unemployed is from the Sekhukhune district, followed by
Capricorn and Vhembe. The Waterberg district only had 37 thousand unemployed
workers. It should however be noted that the Waterberg is also the smallest district in
terms of population, hosting only 12.8 percent of the provincial population.
0
50000
100000
150000
200000
250000
300000
350000
307 843
329 045
344 924
364 269
270 000
280 000
290 000
300 000
310 000
320 000
330 000
340 000
350 000
360 000
370 000
2014 2015 2016 2017

32 | P a g e
Figure 20: Number of unemployed per district
Source IHS Markit Regional Explorer 2018
3.5. Profit, wages and productivity
Burger (2018) investigated the relationship between wages, productivity and profit and
indicated that wage and productivity showed a direct relationship over time. A one
percent increase in productivity in general leads to a one percent increase in wages.
The question that then begs is whether the workers share of total income increased
or decreased as a share of total income over time, especially if compared to the Gross
Operating Surplus (GOS). It is important to compare it to GOS because wages are a
cost factor of companies and impacts negatively on their earning. According to Burger
(2018) the GOS can be seen as a measure of the corporate sectors operating profit.
In 1998, labour’s share of total income stood at 54 percent and then fell over time to
only 47.9 percent in 2002. Since 2009 labour managed to regain its share. In Limpopo
the ratio between wages and total income (GOS plus wages) increased from 34.6 to
40.6 percent between 2009 and 2017. This can be attributed to the relative slow growth
in corporate earnings since the global financial crisis in 2009.
20.3% 19.9%18.1%
13.3%
30.9%
0.0%
5.0%
10.0%
15.0%
20.0%
25.0%
30.0%
35.0%
Mopani Vhembe Capricorn Waterberg Sekhukhune

33 | P a g e
3.6. Conclusion
Despite the fact that the Limpopo province has one of the lowest unemployment rates
amongst the different provinces, some challenges still exist. The challenge of the
relatively low absorption and labour participation rates. This includes the skills
challenge in the province and the relative capital intensive nature of production in the
mining sector. A further strategic issue to be considered is the policy implications to
support the informal sector to play its rightful place in terms of job creation in Limpopo.

34 | P a g e
CHAPTER 4: DEVELOPMENT INDICATORS
4.1. Introduction
It is important to discuss the level of economic development in the Limpopo province
because it provides a broader measure than economic growth. Economic growth
measure the level of production in the local economy as measured by the Gross
Domestic Product (GDP) while economic development includes efforts that seek to
improve the economic well-being and quality of life of a community. The level of
economic development is measured by means of different indicators like the Human
Development Index and the level of income inequality in the economy. Although
economic growth on its own is not sufficient to create economic development it is a
prerequisite for higher levels of economic development.
4.2. Income inequality
South Africa is the country in the world with the skewest distributions in the world.
Traditionally the inequality existed on racial lines but since 1994 the level of inequality
between the White and African population reduced whilest intra African inequality
increased.
The level of inequality on provincial level can be measured by means of the Gini
coefficient. The Gini Coefficient is a calculation that compares the cumulative level of
income with the cumulative percentage of the population that is receiving the income.
Theoretically the indicator can have a value of between 0 and 1. If the value of the
Gini Coefficient is equal to 1 it implies that one person will receive all the income. If
the value of the Gini Coefficient is equal to 0 it means that the distribution of income
is perfectly equal. The target of the level of inequality was to reduce the level of
inequality to 0.5 by 2019. The aim in the National Development Plan (NDP) is to
significantly reduce the level of inequality from 0.69 to 0.60 by means of various policy
measures.

35 | P a g e
In 2017 the Gini Coefficient of South Africa was 0.63. Although this is an improvement
from the 0.69 mentioned in the NDP, it is still an indication of a skewed distribution of
income on national level.
Figure 21:The Gini coefficient in the Limpopo
Source: IHS Markit Regional Explorer 2018
From the table below it is clear that the Sekhukhune district has the most equal
distribution of income in Limpopo. The city of Polokwane has a Gini Coefficient of 0.61
and Lephalale 0.62. It should however be noted that a low Gini coefficient is not
necessary a better indicator of the level of economic development than a high level of
inequality. In previous research in Limpopo the poorer towns in Limpopo had lower
Gini coefficients than the prospering towns. The difference is that not everybody is
benefitting equally from the growth in the town. Lephalale and Polokwane is a case in
point. The income distribution in the towns are more unequal than Sekhukhune but
both a growth point that is prospering.
Table 3: Inequality in on district level
2014 2015 2016 2017
Mopani 0.59 0.59 0.59 0.59
Vhembe 0.57 0.57 0.57 0.57
Capricorn 0.61 0.60 0.60 0.60
Waterberg 0.60 0.60 0.60 0.61
Sekhukhune 0.56 0.56 0.56 0.57
Source IHS Markit Regional Explorer 2018
0.56
0.57
0.58
0.59
0.60
0.61
0.62
0.63
0.64
1996 1998 2000 2002 2004 2006 2008 2010 2012 2014 2016

36 | P a g e
4.3. Human Development Index (HDI)
Human Development Index (HDI) can be defined as a composite relative index used
to compare human development across population groups or regions. HDI is the
combination of three basic dimensions of human development namely a long and
healthy life, knowledge or education and a decent standard of living. The status of
health is measured by means of life expectancy at birth. The status of knowledge or
educations is determined by measuring the levels of adult literacy and/or the enrolment
in primary, secondary and tertiary schools. A decent standard of living is typically
measured using GDP per capita.
From the graph below it is clear that the level of human development has improved
since 2010 with the HDI increasing from 0.52 to 0.59. The increase in the HDI can
ascribed to improved access to health and education in Limpopo. In the districts the
situation in terms of human development is fairly much the same as on provincial level.
Waterberg, with a HDI level of 0.61 in 2017 , is on the highest level of development
followed by Capricorn with a HDI of 0.6.
Figure 22: HDI in Limpopo
Source: IHS Markit Regional Explorer 2018
0.52
0.540.55
0.560.57
0.580.58
0.59
0.48
0.50
0.52
0.54
0.56
0.58
0.60
2010 2011 2012 2013 2014 2015 2016 2017

37 | P a g e
4.4. Poverty
Poverty is a multi dimentional concept which has been defined in various ways in the
literature. The World Bank traditionally used $1 a day and $2 per day measures.
Absolute poverty was defined by the United Nations (2016) as a condition
characterised by severe deprivation of basic human needs, including food, safe
drinking water, sanitation facilities, health, shelter, education and information. Poor
people do not have control or agency about the outcome of their level of well being.
The poor lack sufficient access to economic opportunities and cannot avoid poverty
unless their economic opportunities improve (Duncan 1984)
The selection of a defintion for poverty in any study also depends on the availability of
data. In this Chapter the Lower Poverty Line as defined by Statistics SA will be used
as the measure for poverty. It is also chosen because it provides a more conservative
estimate of poverty in the Limpopo Province.
4.4.1. The Lower Poverty Line in Limpopo
According to IHS Markit Regional Explorer 2018, the lower poverty line is defined by
StatsSA as the level of consumption that includes both food and essential non-food
items, but requires that individuals sacrifice some food items in order to obtain the
non-food items. The level of consumption that was set as the minimum in 2017 was
R750. Both the number and the percentage of people below the Lower Poverty Line
will be reported. A province or town can theoretically have very high percentage of
people living in poverty but a low number of people in poverty. The opposite is also
true.
In 2017 the number of people below the Lower Poverty Line in South Africa was 24.2
million persons or 42.1 percent of the population, while in Limpopo the comaparable
numbers were 3,1 million persons or 52.7 percent. This is a significant improvement
from the 75.1 percent of persons in poverty in 1999.

38 | P a g e
Figure 23: The % and number of people in poverty in Limpopo
Source: IHS Markit Regional Explorer 2018
4.4.2. Poverty in the districts
According to the below table Sekhukhune has the highest number of people in poverty
and also the highest percentage of people in poverty. There is no significant difference
in the poverty gap rate between the Limpopo districts.
Table 4: The poverty levels in the districts
No below the
poverty line
% below the
poverty line
Poverty gap
rate
Mopani 629 920 54.7% 31.2%
Vhembe 777 447 56.2% 31.2%
Capricorn 667 087 49.2% 31.2%
Waterberg 342 933 46.0% 31.1%
Sekhukhune 684 125 58.0% 31.2%
Source: IHS Markit Regional Explorer 2018
From the discussion it is clear that Limpopo province continues to face a serious
challenge in terms of inequality, human development and poverty. Research has
indicated that higher levels of growth is needed to address these challenges. It is also
important to promote more labour absorbing activities in the Limpopo province. The
improvement of the skills levels of the poor is also very important.
0.0%
10.0%
20.0%
30.0%
40.0%
50.0%
60.0%
70.0%
80.0%
0
500 000
1 000 000
1 500 000
2 000 000
2 500 000
3 000 000
3 500 000
4 000 000
Number in poverty % in poverty

39 | P a g e
In terms of fiscal policy, it is important that stable macro-economic policy be
implemented on national level. With the current budget constraint on provincial level,
it leaves limited scope to allocate funding to additional priorities. Provincial Treasury
should continue to ensure that the provincial budget is spent efficiently and
economically.
4.4.3. Climate change and poverty
The countries that are currently at the same level of development as developed
countries decades ago are subjected to much more stringent climate change
regulations than the developed countries were decades ago. It can be argued that this
situation is putting the current developing countries at a disadvantage in terms of their
efforts to catch up with the level of development of the developed and rich countries
because they have to implement more climate friendly policies. The climate friendly
policies might lead to slower levels of economic growth, due to the costs that mitigation
and adaption puts on the economy.
Research in various developing countries indicated that their key priorities in terms of
climate change is agriculture, health and the protection of their water resources. In
terms of health the focus is on how to treat waterborne diseases like malaria, which is
expected to be more prevalent due to climate change. A number of countries
highlighted the risk climate change poses for their energy sector, particularly those
that derive a significant portion of their electricity from hydropower. They see the need
to diversify their energy systems, such as by expanding geothermal, solar and biogas
production. They also want to improve energy efficiency and expand the adoption of
efficient technologies.
4.5. Crime Outlook
Crime puts an additional cost on the economy because people tend to spend money
to hire security to protect them against crime. Crime also negatively impacts on the
image of the province in terms of trying to attract more foreign direct investment.

40 | P a g e
The top 4 reported crimes in the province relate to civilians and domestic cases; there
are 19 580 cases of drug related crimes, 14 328 Burglary at residential premises, and
11 998 Assault with the intent to inflict grievous bodily harm. While Burglary at
business premises has the 7th most reported cases. It’s given that every effective
crime fighting and prevention effort must seek to deal with the causes of the crime.
4.5.1. Crime by Category
Table 5: The number of cases per category
Drug-related crime 19 580
Burglary at residential premises 14 328
Assault with the intent to inflict grievous bodily harm 11 998
Common assault 7 514
Robbery with aggravating circumstances 7 037
Malicious damage to property 6 808
Burglary at business premises 6 713
Driving under the influence of alcohol or drugs 5 674
Common robbery 2 836
Source IHS Markit Regional Explorer 2018
4.6. Conclusion
The overview about the poverty situation in Limpopo indicates that, despite an
improvement in the poverty situation, the province still faces a serious challenge in
terms of poverty. The province will need higher levels of economic growth to
signifincantly lower the number and the percentage of people living in poverty. It is
also important to create more jobs to try and reduce the level of poverty. The poor is
the most vulrenable to the negative impact in terms of climate change and will benefit
from the drive towards sustainable development. It is clear that despite the fact that
the province also experiences crime, it is relatively under control. It is important to
continue to make a concerted effort to improve the situation.

41 | P a g e
CHAPTER 5: HEALTH
5.1. Introduction
Healthcare or health is one of the important factors in the human nature as people fall
ill, accidents and emergencies happen and hospitals are needed as the first point of
access for diagnoses to be made, for diseases to be treated and managed so they do
not escalate into something worse.
5.2. Public healthcare expenditure per person
According to StatsSA General Household Survey 2017, seven in every ten households
go to a public clinic or public hospital as their first point of access if a household
member becomes ill, while only a quarter of households opted to go to a private
institution. Public Healthcare continues to be of high priority for public sector spending
as the government continues to increase its public health spending in recent years.
For every Rand that the South African government spent, 11 cents went to healthcare.
The bulk of the Health budget, namely 86 percent, is spent by provincial governments,
which is tasked to manage the nation’s public healthcare system, comprising 422
hospitals and 3 841 clinics and health centres. In Limpopo the department of health is
allocated about 30 percent of the provincial budget, which is aimed at assisting about
40 hospitals, 454 clinics, 26 community health centres and 123 mobile clinics.
Information in Stats SA’s latest financial statistics of provincial government sets the
healthcare bill for provincial government at R150 billion. This translates to an average
of R3 332 spent per person for the 45 million people who do not have medical cover.
The below graph indicates that the Northern Cape government is the biggest spender
in terms of public healthcare spending R4 082 per person, followed by Western Cape
at R3 867, Limpopo, North West and Mpumalanga are the lowest spenders in public
healthcare spending at R2 924, R2 761 and R2 704 respectively.

42 | P a g e
Figure 24: A public healthcare spending per person
Source: StatsSA General Household Survey 2017
5.3. Level of satisfaction of public and private healthcare
Studies shows that users of private healthcare facilities seemed to be more satisfied
with those facilities than users of public healthcare facilities across Limpopo province.
About 75.1 percent of individuals who are using public healthcare facilities in Limpopo
province are very satisfied, followed by 14.9 percent who are somewhat satisfied,
about 4.2 percent are neither satisfied nor unsatisfied, while about 4.1 percent are
somewhat dissatisfied with the level of service they receive from public healthcare
facilities and about 1.7 percent is very dissatisfied with the level of service received
from public healthcare. In terms SA, about 55.1 percent of individuals are very satisfied
with the level of service received from public healthcare, 26.7 are somewhat satisfied,
8.4 percent are neither satisfied nor unsatisfied, while about 4.5 percent are somewhat
dissatisfied and 5.3 percent are very dissatisfied with the level of service received at
public healthcare facilities.

43 | P a g e
Figure 25: Limpopo and SA level of satisfaction public and private healthcare
Source: StatsSA General Household Survey 2017
In terms of the level of satisfaction with service received at private healthcare facilities
in the province, about 93.1 percent are very satisfied, 3.5 percent somewhat satisfied,
1.8 percent neither satisfied nor dissatisfied, with 0.6 and 0.9 percent who are
somewhat dissatisfied and very dissatisfied respectively. In comparison to the national
Average in the private health care service, about 91.5 percent of individuals are very
satisfied with the level of service received from private healthcare, about 5.8 percent
are somewhat satisfied, 1.4 percent are neither satisfied nor dissatisfied, while about
0.7 percent are somewhat dissatisfied and 0.6 percent are very dissatisfied with the
level of service received at public healthcare facilities.
5.4. Medical Aid Coverage
Being a member of a medical aid scheme in South Africa can be considered as a
privilege, as it is only the lucky few who have access to medical aid coverage. The
lack of medical cover is expressed in the decisions that families make due to
consideration of the cost of the medical aid schemes in the country. Access to medical
aid is determined by wealth, the middle class and the rich mostly have access to
medical aid coverage in South Africa, while the poor are left with only one option, using
the public health facilities.
44 | P a g e
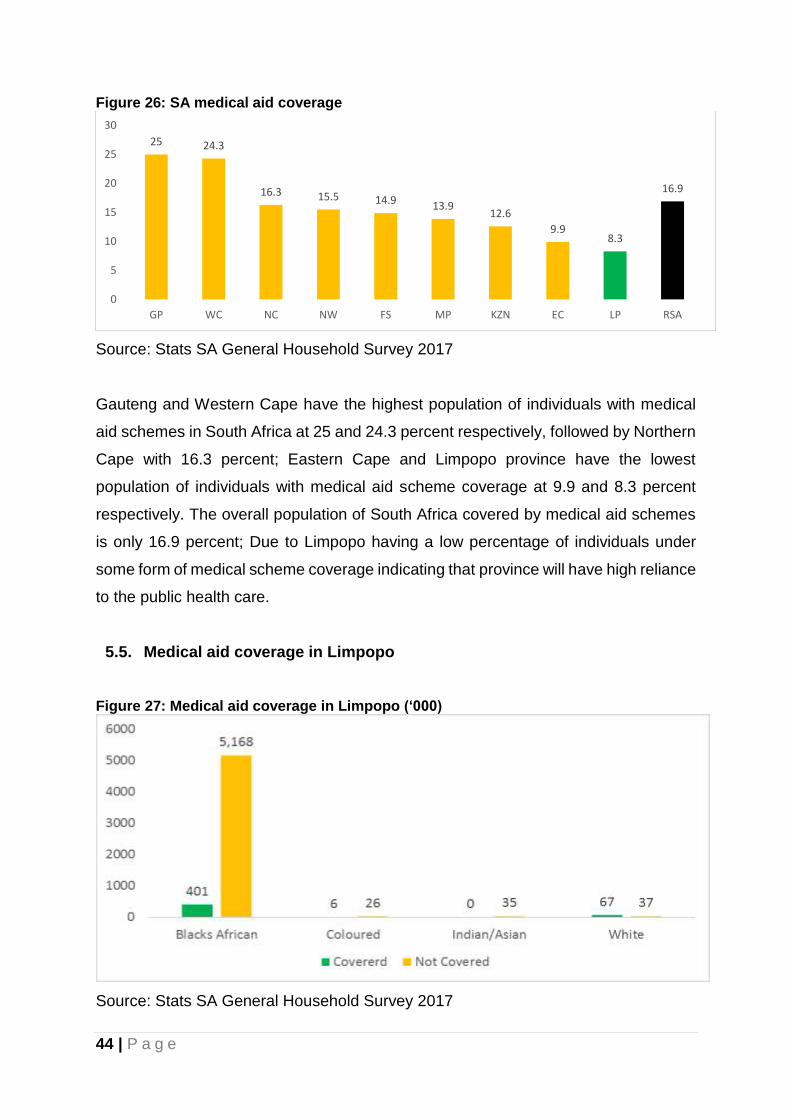
Figure 26: SA medical aid coverage
Source: Stats SA General Household Survey 2017
Gauteng and Western Cape have the highest population of individuals with medical
aid schemes in South Africa at 25 and 24.3 percent respectively, followed by Northern
Cape with 16.3 percent; Eastern Cape and Limpopo province have the lowest
population of individuals with medical aid scheme coverage at 9.9 and 8.3 percent
respectively. The overall population of South Africa covered by medical aid schemes
is only 16.9 percent; Due to Limpopo having a low percentage of individuals under
some form of medical scheme coverage indicating that province will have high reliance
to the public health care.
5.5. Medical aid coverage in Limpopo
Figure 27: Medical aid coverage in Limpopo (‘000)
Source: Stats SA General Household Survey 2017
25 24.3
16.3 15.5 14.9 13.912.6
9.98.3
16.9
0
5
10
15
20
25
30
GP WC NC NW FS MP KZN EC LP RSA
45 | P a g e
401 thousand Black Africans in the province are covered by medical aid, followed by
67 and 6 thousand Whites and Coloureds respectively. In terms of those not covered,
about 5.168 million of the black population are not covered by medical aid, followed
by 37, 35 and 26 thousand Whites, Indians and Coloureds respectively. Those not
covered by medical aid in Limpopo will rely on public health facilities for assistance
with medical issues.
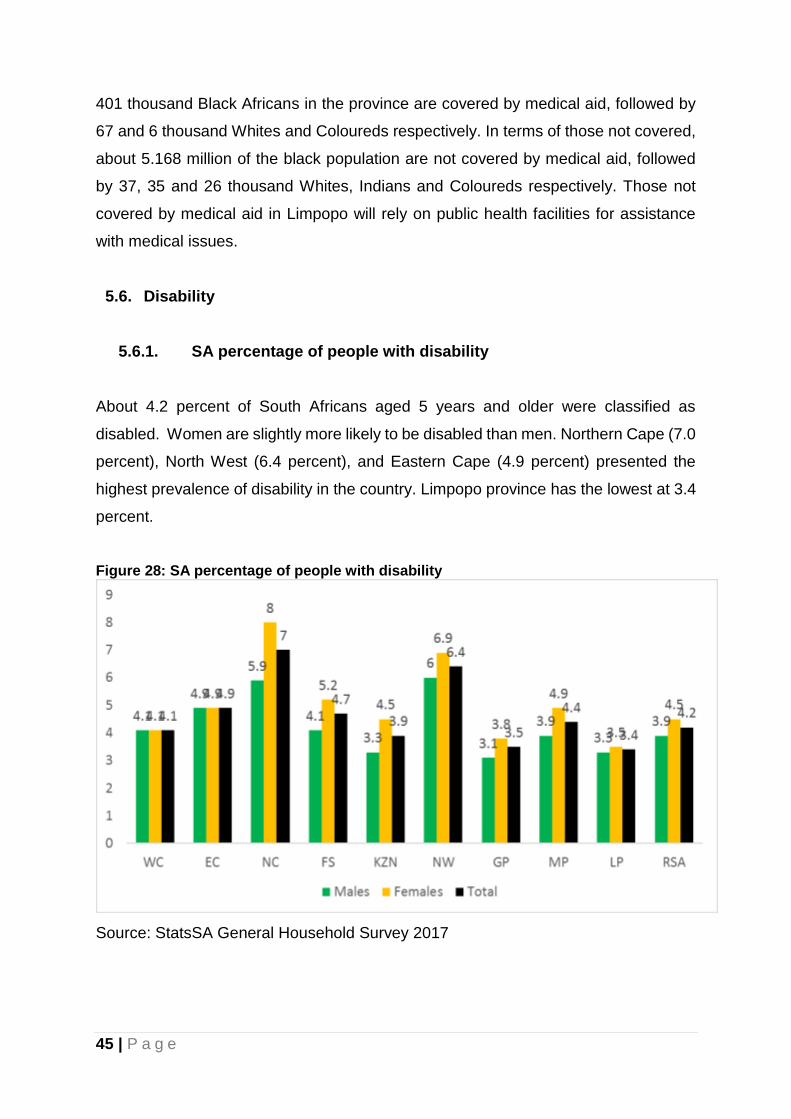
5.6. Disability
5.6.1. SA percentage of people with disability
About 4.2 percent of South Africans aged 5 years and older were classified as
disabled. Women are slightly more likely to be disabled than men. Northern Cape (7.0
percent), North West (6.4 percent), and Eastern Cape (4.9 percent) presented the
highest prevalence of disability in the country. Limpopo province has the lowest at 3.4
percent.
Figure 28: SA percentage of people with disability
Source: StatsSA General Household Survey 2017

46 | P a g e
Northern Cape has the highest percentage of females who are disabled at 8 percent,
followed by North West at about 6.9 percent disabled females, Gauteng and Limpopo
province have the lowest percent of females who are disabled at about 3.8 and 3.5
percent respectively. North West has the highest number of males who are disabled
at about 6 percent, followed by Northern Cape at 5.9 percent. Limpopo, Gauteng and
KwaZulu-Natal have the lowest number of males who are disabled at 3.3 and 3.1
percent respectively.
5.7. Limpopo social grant recipients
The total number of grant recipients in the province was recorded at 2.5 million, with
child support grant being the highest in the province at around 1.8 million recipients
followed by old age at 471 thousand recipients. The high number of child support grant
beneficiaries are supported by the composition structure of the Limpopo population in
the above section which shows that the province is dominated by young people.
Figure 29: Total number of social grant by grant type in Limpopo (2018)
Source: SASSA 2018
5.8. Limpopo fertility rates
The below graph indicates that fertility rates from 2006-2011 were 3.3 percent, from
2011-2016 fertility rates decreased to 3.1 percent and from 2016-2021 fertility rates
are expected to decrease further to 2.9 percent.
15 925
1 843 859
96 969
36 730
48 878
471 322
3
2 513 686
0 500 000 1 000 000 1 500 000 2 000 000 2 500 000 3 000 000
Care Dependency
Child Support
Disability
Foster Care
Grant-in-Aid
Old Age
War Veteran
Total Grant Recipient

47 | P a g e
Figure 30: Limpopo fertility rates
Source: Stats SA General Household Survey 2017
5.9. South African life expectancy for Male and Female
Life expectancy at birth has significantly increased over time between the period 2008
and 2018, as it moved from 58.1 and 53.8 years respectively in 2008 to 67.3 and 61.1
years in 2018 for females and males respectively. This significant improvement in life
expectancy can mainly be credited to the impact of the massive introduction and
campaigns for the use of Antiretroviral by the national government to curb the deadly
HIV and AIDS epidemic which was destroying our people. Expansion of health
programmes to prevent mother to child transmission as well as access to antiretroviral
treatment has partly led to the increase in life expectancy since 2008. By 2018 life
expectancy at birth is estimated at 61,1 years for males and 67,3 years for females.
Figure 31: South African life expectancy for Male and Female
Source: StatsSA Mid-Year population estimates 2018
3.32
3.14
2.86
2.6
2.7
2.8
2.9
3
3.1
3.2
3.3
3.4
2006-2011 2011-2016 2016-2021
58.1
67.3
53.8
61.1
0
10
20
30
40
50
60
70
80
2008 2009 2010 2011 2012 2013 2014 2015 2016 2017 2018
Female Male

48 | P a g e
5.10. Crude birth and death rate
The crude birth and death rate measures the number of births and death case per
100 000 without taking the sex of the person into account. The crude birth rate is
viewed as a measure of the fertility of the population. The SA crude birth rate and
death rate has been on decline for the period 2008 and 2018. The birth rate was
recorded at 24.2 percent in 2008 and it declined to 20.8 percent in 2018, while the
death rate decreased from 12.9 percent in 2008 to 9.1 percent in 2018.
Figure 32: Crude Birth and Death Rate
Source: StatsSA Mid-Year population estimates 2018
5.11. Limpopo life expectancy for males and female
The below graph indicates that from 2006-2011 life expectancy for males and females
was 52.6 and 55.8 years, from 2011-2016 life expectancy increased to 56.4 years for
males, 62.8 years for females and from 2016-2021 life expectancy is expected to
increase to 58.6 years and 65.4 years for males and females respectively.
24.2
20.8
12.9
9.1
0
5
10
15
20
25
30
2008 2009 2010 2011 2012 2013 2014 2015 2016 2017 2018
Crude birth rate Crude death rate

49 | P a g e
Figure 33: Limpopo life expectancy for males and female
Source: StatsSA Mid-Year Population Estimates 2018
5.12. SA HIV Positive estimates
The number of people infected with HIV increased from 5.47 million in 2009 to 7.52
million in 2018. This shows an increase of about 2 million new infections in the past
10 years. The increase in the number of new HIV infections raises a concern as the
government has in recent years embarked on several awareness campaigns about
the dangers associated with the spread of HIV in the country.
Figure 34: South African HIV Population growth
Source: StatsSA Mid-Year population estimates 2018
52.656.4 58.6
55.8
62.865.4
0
10
20
30
40
50
60
70
2006-2011 2011-2016 2016-2021
Males Females
5.475.69
5.926.17
6.426.65
6.897.13 7.32 7.52
0
1
2
3
4
5
6
7
8
2009 2010 2011 2012 2013 2014 2015 2016 2017 2018

50 | P a g e
5.13. Limpopo HIV positive estimates
The estimated number of people who are HIV positive was 434 thousand in 2008. The
number has been increasing from 2008 and was 480 thousand in 2017.
Figure 35: Limpopo HIV positive estimates
Source: IHS Regional Explorer 2018
5.14. Conclusion
Better health is central to human happiness and well-being. It also makes an important
contribution to economic progress, as a healthy population lives longer and becomes
more productive. According to the latest Statistics South Africa General Household
Survey only a few privileged South Africans have medical aid cover, which is the
essential key that opens the door to private healthcare and the majority of South
Africans, fall outside the medical aid net, and as a result are largely dependent on
public healthcare. Limpopo province has the lowest percentage of individuals under
some form of medical scheme coverage which leads to the majority of the provincial
citizens relying heavily on the public clinics or public hospitals as their first point of
access if a household member becomes ill.
The provincial government should ensure that the provincial health budget is utilised
sparingly with the main aim of improving the standards of the health facilities in the
province. The fast tracking of the roll out of the National Health Insurance (NHI) in the
434 553437 443
441 498 443 872 444 971449 591
456 382
463 357
471 335
480 022
400 000
410 000
420 000
430 000
440 000
450 000
460 000
470 000
480 000
490 000
2008 2009 2010 2011 2012 2013 2014 2015 2016 2017

51 | P a g e
province will be key as the province is in need of better health facilities. The turn-
around time and the quality of medications in the provincial hospitals should be
improved so as to reduce the long queues and people coming back for further
consultations.
The increase in the HIV positive numbers in the province raises a serious policy
concern as one would be expecting a reduction in the number of people with HIV given
the number of initiatives implemented by the Department of Health. On the other hand,
this could be attributed to good campaigns which encouraged the communities to
come forward to be tested. The Limpopo provincial government should consider
developing intervention strategies towards the stigmatisation of HIV as well as coming
up with plans to assist the most affected groups.

52 | P a g e
CHAPTER 6: EDUCATION
6.1. Introduction
Limpopo faces some grave challenges economically. Unemployment,
underemployment, poverty and unequal distribution of wealth being few of them. A
pool of literature has demonstrated that literacy can present solutions to almost all
these problems. Furthermore, literacy also reduces the economic inequality and
reduces income disparity.
6.2. GDP per capita and Literacy rate
There is a positive correlation between GDP per capita and literacy rate. Provinces
such as Western Cape and Gauteng reported the largest GDP per Capita of R66 738
and R80 410 respectively have witnessed the highest levels of literacy rates in 2017.
Rural provinces such as Eastern Cape, Kwazulu Natal, North West and Limpopo
reported the lowest GDP per capita of R33 150, R44 715, R44 385 and R38 543
respectively witnessed by low literacy rates.
Citizens with high literacy levels are naturally concentrated in economic buoyant
regions where the demand of their labour is high and possibilities of securing
employment are high. This explains why Western Cape and Gauteng enjoy relatively
high literacy rates. Moreover, the fore mentioned regions enjoy high gross capital
formation in both economic and social infrastructures supported by high density levels
implying that the unit cost of rolling out such stock is relatively less expensive and
benefiting more citizens compared to rural provinces - where settlements are scattered
and population densities are very low,

53 | P a g e
Figure 36: GDP per capita and Literacy rate
Source: IHS Markit Regional Explorer 2018
6.3. Levels of education
6.3.1. No schooling
Industrial economies such as Western Cape and Gauteng have a low share of its
population without schooling. The converse can be said for less industrialized
provinces or alternatively described - rural provinces. There is a relatively high share
of citizens who have not been to school in rural provinces - Limpopo recording the
highest. The worse affected districts are Mopani, Sekhukhune and Vhembe which
recorded a share of 9 percent (103 643 people), 8.3 percent (98 230 people) and 7.2
percent (99 525. People) respectively.
Figure 37: Share of people with no schooling and by district
Source: IHS Markit Regional Explorer 2018

54 | P a g e
6.3.2. Post Matric Qualification
Almost 40 percent of the citizens of Limpopo fall in the cohort of people possessing
either Grade 7 – 9, Grade 10 – 11 and Grade 12. People who possess Grade 7 to
Grade 11 have lower probabilities of securing a job or further acquiring a post matric
qualification. This is representative of the demographic structure of the province where
the majority of the people living in the province are youth. In essence the province has
a relatively large pool of youth that is not streamlined into special skills to contribute
meaningfully in the provincial economy. Given the development framework of the
province to industrialize, the province is likely to fall short of the requisite skills to
support its industrialization and growth trajectory.
Figure 38: Matric only senior phase by district
Source: IHS Markit Regional Explorer 2018
The share of people with Diplomas are relatively higher than those in possession of
degrees in the country, however it is pronounced in the province. This is explained by
the number of private and public colleges that outnumber university enrolment
particularly in the diploma segment. What is of strategic importance is whether the
diploma graduates are aligned to the market demand and broader provincial
development trajectory. If not, the education system or curriculum outcomes are not
adding value to the development and growth of the province. Over and above
graduating, the question is whether the graduate is employable and able to actively
participate in the local economy.

55 | P a g e
Figure 39: Post matric qualifications and by district
Source: IHS Markit Regional Explorer 2018
6.3.3. Learner/ Teacher Ratio
According to the OECD, smaller class sizes are often seen as beneficial because they
allow teachers to focus more on the needs of individual students, and reduce the
amount of class time needed to deal with disruptions. The ratio is also often used as
a selling point for private schools, as they boast that smaller class sizes allow for more
one on one time, and innovative teaching methods.
The learner/teacher ratio for public schools is generally higher than that of the private
schools. This disparity is exacerbated by the fact that a pure public good is not
supposed to be exclusive, therefore government seeks to accommodate as many
students as possible with the limited resources it has at its disposal. There is a notable
increase in the learner teacher ratio in public schools from 1:32 in 2016 to 1:34 in
2018. Public schools are experiencing a great leakage of educators in the system, in
2017 the public sector educators contracted by 6.1 percent when learner population
declined by 0.9 percent. Independent schools’ learner teacher ratio has averaged 1:24
over the past 3 years which helps to explain the quality of education in such
institutions.

56 | P a g e
Figure 40: Learner teacher ratio for Limpopo for private and public schools and growth rate of educators and learners in public schools
Source: IHS Markit Regional Explorer 2018
6.4. Conclusion
The World Inequality Database on Education (WIDE) highlights the powerful influence
of circumstances, such as wealth, gender, ethnicity and location, over which people
have little control but which play an important role in shaping their opportunities for
education. It draws attention to unacceptable levels of inequality in access and
learning across countries and within countries, with the aim of helping to inform policy
design and public debate.
Due to these market failures, there is a need for government to manage the country’s
education system to ensure quality education for all regardless of circumstances. This
emphasis is based on the premise that rural provinces are underfunded and under
resourced to provide the expected quality education.
The literacy rate is one of the key development indicators of the economic situation in
a country as increased literacy rate leads to enhancement of a country's human capital
development. Literacy, especially obtaining tertiary degrees at university, also
provides better employment prospects and gives a higher socio-economic status.

57 | P a g e
CHAPTER 7: BASIC SERVICES
7.1. Introduction
South Africa is a country that faces many disparities because of its colonial and
oppressive history. This has resulted in multiple socio-economic challenges that need
redress across the different spheres of government to achieve transformation.
Ensuring that redress occurs is complex, and the real needs of citizens are often
overlooked. Though the government has made significant gains with regards to
creating a more equal society, divides and challenges are still rife. The slow pace and
lack of quality service delivery has fuelled protests all over the country, and have
brought local government under the spotlight. These protests have been characterized
by high levels of violence, xenophobic attacks, and looting and police brutality. The
dissatisfaction about service delivery is prominent in informal settlements and rural
areas like the Vhembe region in Limpopo.
Despite these challenges with basic service delivery the situation improved
dramatically since 1994. The inhabitants in the province with access to water,
sanitation and electricity improved markedly since the dawn of democracy.
7.2. Housing
The share of households occupying formal dwellings increased from 86.7 percent in
2007 to 90.2 percent in 2017. What is concerning for policy planners at provincial and
local government sphere is households that still reside in informal and traditional
dwellings. There are generally logistical challenges of providing decent dwelling and
supplementary amenities such as water and sewage systems for households in rural
areas due to scattered settlements and unfavourable topographic features. The most
noticeable backlog of housing among the districts is Vhembe, where 55.7 thousand
households do not live in formal dwellings.

58 | P a g e
Table 6: Share of households occupying formal dwellings and formal dwellings backlog
Source: IHS Markit Regional Explorer 2018
A further challenge is that the occupants of these houses, in many cases, do not have
the title deed to the property. This limits the wealth impact of having access to proper
housing.
7.3. Sanitation
The Strategic Framework for Water Services (2003) defines sanitation services as the
provision of a basic sanitation facility which is easily accessible to a household, the
sustainable operation of the facility, including the safe removal of human waste and
wastewater from the premises where this is appropriate and necessary, and the
communication of good sanitation, hygiene and related practices. Drought is endemic
to South Africa in general and presents a major challenge to the achievement of
sustainable development. The impact of the current drought conditions is resulting in
water restrictions and is causing substantial socio-economic hardships, a decline in
public health, land degradation and bio-diversity loss. The limited availability of water
also has a negative impact of the provisioning of sanitation.
The situation, however, varies significantly by province. While flush toilets were quite
common in Western Cape (93.4 percent) and Gauteng (86.3 percent), they were much
less common in Limpopo (23.6 percent), Mpumalanga (45.7 percent), Eastern Cape
(46.7 percent), KwaZulu-Natal (46.8 percent) and North West (47.7 percent). Pit
latrines without ventilation pipes were most common in Limpopo (39.8 percent),
Mpumalanga (28.8 percent) and North West (28.2 percent).
2007 2012 2017 2007 2012 2017
Limpopo 86.7% 90.5% 90.2% 172,314 133,759 154,960
Mopani 88.6% 91.1% 91.8% 32,255 26,427 26,466
Vhembe 81.2% 89.2% 84.9% 56,816 35,894 55,795
Capricorn 91.2% 92.8% 94.7% 27,398 24,447 20,106
Waterberg 86.0% 87.9% 88.9% 24,735 22,105 22,997
Sekhukhune 86.2% 90.4% 90.0% 31,111 24,886 29,595
National Average 75.4% 77.9% 78.8% 3,236,573 3,186,967 3,405,757
Share of household occupying formal dwellings Formal dwelling backlog

59 | P a g e
Table 7: Household access to sanitation in South Africa, 2011 and 2016
Source: StatsSA 2017
The share of households with hygienic toilets increased from 34.2 percent in 2007 to
53.2 percent in 2017 in Limpopo province, however, more still needs to be done as
736 thousand households are without hygienic sanitation. The problem is worse in
Mopani, Vhembe, and Capricorn districts.
Table 8: Share of households with hygiene toilets and sanitation backlogs
Source: IHS Markit Regional Explorer 2018
7.4. Water Services
Safe and sufficient drinking water and adequate sanitation are both essential
ingredients to ensure health and well-being of human beings, and they are necessary
for economic development. The right for everyone to have access to sufficient water
is Legislated. Only 67.9 percent of households in Limpopo have access to piped water.
About 419 thousand households do not have access to piped water. Mopane, Vhembe
and Sekhukhune districts recorded 109 thousand, 134 thousand and 100 thousand
households without access to piped water respectively in 2017.
2011 2016 Change
Flush toilet connected to public sewerage system 57,0 60,6 3,6
Flush toilet connected to a septic system 3,1 2,7 -0,4
Chemical toilet (including ecological sanitation) 2,5 4,5 2,0
Pit latrine with ventilation pipe 8,8 12,2 3,4
Pit latrine without ventilation pipe 19,3 13,7 -5,6
Bucket toilet 2,1 2,2 0,0
Other 2,1 1,6 -0,5
None 5,2 2,4 -2,8
2007 2012 2017 2007 2012 2017
Limpopo 34.2% 45.5% 53.2% 854,174 769,386 736,441
Mopani 33.3% 47.2% 60.0% 189,015 157,119 129,579
Vhembe 33.1% 42.1% 56.2% 201,778 191,972 161,505
Capricorn 36.5% 48.9% 53.6% 196,766 173,104 175,342
Waterberg 53.0% 61.4% 68.6% 82,806 70,673 65,081
Sekhukhune 18.7% 32.2% 30.7% 183,808 176,519 204,934
National Average 68.0% 76.1% 80.1% 4,206,841 3,457,086 3,203,865
Share of households with Hygienic toilets (%) Sanitation backlog

60 | P a g e
Table 9: Share of households with piped water and water backlogs
Source: IHS Markit Regional Explorer 2018
The share of households with no access to water has declined significantly over the
years. While the households with access to water within their yards has improved
remarkably. This is evident of the strides that government is making in ensuring that
citizens have access to the most basic yet critical services. However, more needs to
be done for rural and remote settlements where citizens are deprived and most
vulnerable.
Figure 41: Households by water infrastructure Limpopo
Source: IHS Markit Regional Explorer 2018
South Africa is a dry country with limited fresh water resources and adequately
accessing water and sanitation is a challenge for many households in rural and peri-
2007 2012 2017 2007 2012 2017
Limpopo 67.9% 68.6% 73.3% 415,793 442,749 419,636
Mopani 63.0% 67.6% 66.4% 104,786 96,409 109,049
Vhembe 62.0% 67.4% 63.6% 114,655 108,141 134,282
Capricorn 76.7% 75.2% 86.5% 72,244 83,908 51,102
Waterberg 81.6% 78.8% 88.0% 32,442 38,786 24,751
Sekhukhune 59.5% 55.7% 66.0% 91,666 115,505 100,453
National Average 81.9% 84.1% 86.6% 2,377,960 2,298,867 2,152,886
Share of households with piped water at or above RDP-level (%) Water backlog
0%
10%
20%
30%
40%
50%
60%
70%
80%
90%
100%
1996 1998 2000 2002 2004 2006 2008 2010 2012 2014 2016
Inside dwelling In Yard <200m from dwelling >200m from dwelling None

61 | P a g e
urban communities. The NPC (2011) points out that inadequate access to water can
be the result of insufficient bulk infrastructure, poor municipal service delivery and/or
poor maintenance of existing infrastructure, as well as households being too poor to
pay for the cost of services. As a long-term driver of development policy in the country,
the NDP envisages that all South Africans will have full, affordable and reliable access
to sufficient safe water and hygienic sanitation by 2030. The LDP seeks to improve
access to basic services (water) from 83 percent in 2014 to 90 percent 2019, it is clear
from the current data that the provincial government is lagging behind as only 73.3
percent of households have access to water.
7.5. Access to electricity
The provision of electricity can contribute significantly to the improvement of human
quality of life. In addition to providing a host of social benefits, access to electricity
could also stimulate local economic development. Local governments play an
important role in the distribution of electricity, and the profit on the sale of electricity is
an important Source of local government funding, particularly for larger urban
municipalities. Although significant progress has been made since 1994 with the
provision of electricity, significant challenges remain.
Figure 42: Percentage of households with access to electricity by municipal category,
Source: StatsSA 2017

62 | P a g e
In 2016, access to electricity is higher in more urban municipalities than in rural
municipalities. While 88,7 percent and 88,6 percent of households used electricity in
metros and secondary cities (category A and B1 municipalities) respectively, access
was a few percentage points lower in rural (B4) municipalities.
About 94 percent of the households in the province have access to Electricity. Only
about 94 thousand do not have electricity connections. Among the basic services,
government has outperformed itself in ensuring that most people are connected to
electricity. However, 42 thousand households in Waterberg and Sekhukhune districts
do not have electricity.
Table 10: Share of households with electricity and electricity backlog
Source: IHS Markit Regional Explorer 2018
7.6. Provincial Roads Infrastructure
Economic theory and empirical research suggest that investment in economic
infrastructure spurs economic growth. It is also expected to generate employment
directly through the actual construction, operation and maintenance requirements but
also through indirect multiplier effects across the economy. Generally, good
infrastructure reduces the operating costs for firms thereby increasing profitability
margins. Furthermore, good infrastructure, particularly roads, increases mobility of
labour allowing firms to increase productivity and attract factor inputs.
A sizable portion (69 percent) of provincial roads are unpaved and such roads are
concentrated mainly in the rural areas. Unpaved roads deteriorate over time due to
the combined effects of traffic and environment, maintenance is essential to ensure
the desired level of service of unpaved roads. Maintenance types can be classified
2007 2012 2017 2007 2012 2017
Limpopo 80.0% 89.7% 94.0% 260,081 145,457 94,363
Mopani 82.7% 90.8% 95.6% 48,961 27,417 14,148
Vhembe 82.2% 89.2% 95.2% 53,548 35,829 17,842
Capricorn 79.2% 89.8% 95.0% 64,592 34,584 18,769
Waterberg 75.5% 90.6% 89.6% 43,093 17,239 21,623
Sekhukhune 77.9% 88.3% 92.6% 49,887 30,389 21,982
National Average 80.8% 86.6% 90.5% 2,528,674 1,933,252 1,519,187
Share of households with electrical connections (%) Number of households with no electrical connection

63 | P a g e
into routine maintenance, rehabilitation and reconstruction or emergency
maintenance. Given the accelerated rate of deterioration observed on unpaved roads,
routine and periodic maintenance should be performed continuously and with a higher
frequency than that observed in paved roads.
Figure 43: Provincial road classification 2019 and network by districts 2019
Source: Limpopo Department of Public Works 2019
The Waterberg district has the least population and the least number of households,
however it has the longest road network in the province. This is explained by the
vastness of the district, dispersed human settlement and fragmented economic
activities. The least or shortest provincial road network is in Mopani and Sekhukhune
districts.
RAL’s budget is driven by Maintenance and Repairs (39 percent) Upgrading and
additions (25 percent) and Rehabilitation Renovations & Refurbishment (20 percent).
It is imperative that a cost and benefit analysis be conducted to ensure that resources
are used and directed to areas where there are high social and economic benefits.
Figure 44: Resource allocation on provincial road infrastructure 2019
Source: Limpopo Department of Public Works 2019

64 | P a g e
7.7. Conclusion
The analysis of the household infrastructure provides an important opportunity to track
the improvement of basic service delivery across the province. The analysis finds that
the available infrastructure and accompanying service levels are worst for households
in the poorer, mostly rural municipalities, particularly Limpopo where many households
have to rely on informal and health risk practices to survive. Resources, both human
and financial must be monitored to ensure that it attains maximum social benefit.

65 | P a g e
CHAPTER 8: TOURISM
8.1. Introduction
The tourism industry has been identified in various policy documents like the National
Development Plan, the New Growth Path and the Limpopo Development Plan as one
of the key sectors in the economy that must be promoted. The tourism sector has the
advantage that it is labour intensive in nature with the potential to create a substantial
number of jobs. The sector showed good growth during the last few years and
established Limpopo as one of the leading tourism destinations in South Africa. Huge
potential however still exists to further promote tourism in the province.
8.2. The comparative advantage of Limpopo Province as tourism destination
The comparative advantage Limpopo has as a tourist destination is entrenched in its
diverse wildlife and vast natural landscapes. The uniqueness of these landscapes are
showcased through international recognized conservation areas namely the three
registered UNESCO Biosphere Reserves in the province and two World Heritage
Sites. In addition, three national parks are located in the province and two trans-
frontier conservation areas that positions Limpopo as a boundless destination. Wildlife
viewing opportunities and birding remain popular activities in Limpopo with bird
watching seen as one of the fastest growing nature-based activities worldwide. To
date, the longest running route, the Soutpansberg-Limpopo Birding Route estimated
that local birders spend about R700 million rand a year on their pastime.
Limpopo is also known for offering unique cultural and historical experiences that are
celebrated through a number of cultural festivals and heritage celebrations. With the
discovery of sediments, fossils, bones and artefacts Limpopo has also become a
popular destination for palaeontology, archaeology and San rock art found throughout
the province. Limpopo is further known as a welcoming province with its people playing
an important part in the tourism industry. It is therefore not surprising that social
tourism opportunities such as culture, culinary, educational and family gatherings

66 | P a g e
provide opportunities for tourists to not only interact with one another, but also with the
local cultures.
An area where Limpopo is experiencing continuous growth is hunting and therefore
the province acknowledges the hunting industry as one of the economic drivers that
contributes to tourism growth. It is estimated that about 51 percent of the Limpopo
wildlife ranching industry also takes part in ecotourism activities. The relationship
between these activities should therefore be well managed and regulated to ensure
that responsible practices and sustainable resource utilisation remains a priority to
sustain Limpopo’s competitive edge in the wildlife industry.
Sport tourism is growing and picking up rapidly across the globe. To leverage from this
trend Limpopo started to position itself as a destination offering unique sporting
opportunities closely linked with wildlife and wilderness settings. These include
amongst others, warrior races, trail running, mountain biking, cycling, etc. The
province has three soccer teams participating in the highest soccer league in the
country, Therefore, the utilization of Peter Mokhaba and Thohoyandou Stadium for
Premier Soccer league matches also positions the province as an important host
province for soccer enthusiasts.
Another sector with tremendous potential in Limpopo is business tourism. Hosting
meetings, and conventions remain a strong segment when contributing to the
economy. In Limpopo, the business and events cluster has been identified to focus
mainly for medium to small conferences, meetings and exhibitions. Incentive travel in
particular has been identified as a potential market Limpopo should leverage from. It
also showcases the opportunity to expand the domestic market through offering short
breakaways. These are for example, local food and wine festivals and also flower,
fruit, music and cultural festivals that are unique to Limpopo.
8.3. Tourism Performance in Limpopo
Limpopo recorded the second most visits per province by international tourists, with
more than 1.8 million international arrivals in 2017. This reflects a 22 percent increase
from 2016 and is a clear indication that Limpopo remains a competitive tourist

67 | P a g e
destination in the international market. The current economic recession in South Africa
and the favourable exchange rate of the Rand, also makes it more affordable for
international tourists to visit South Africa. The main long-haul international markets of
the province are USA, Germany, UK, Netherlands, France, Australia, Denmark, Italy,
Brazil, and Canada.
On the domestic front Limpopo reached the 8.3 million mark in 2016. With a 60 percent
growth in the domestic market since 2013, made Limpopo the leading province in the
domestic tourism space. However, after experiencing such high performance, the
country in general experienced low growth in domestic travellers. One of the most
likely reasons for the big drop in domestic tourists were the decrease in affordability
caused by poor economic conditions experienced throughout South Africa. In total
Limpopo recorded 3.1 million domestic travellers and this trend is anticipated to
continue while the economy is under strain. However, Limpopo is the province that
received the most revenue from domestic tourists in 2017, amounting to a total of over
R5.4 billion.
Travelers from the SADC countries enjoy most of the key drivers for tourism in
Limpopo too. South African Tourism confirmed the main purpose for SADC countries
travelling to Limpopo in 2017 was to visit family and friends, which accounted for 51.3
percent of visits. This reinforces the fact that Limpopo must apply its marketing and
destination offerings creatively to involve these tourists also in other activities.
Furthermore, the SADC countries travelling to Limpopo enjoy shopping for personal
reasons at 13.5 percent, holiday at 7.1 percent and religion at 2.4 percent as the key
attractions. To cater for the regional niche markets, Limpopo would have to market
attractions and activities for families and friends to enjoy. Providing more shopping
experiences and holiday packages would also attract more of the regional markets to
Limpopo.

68 | P a g e
Figure 45: International tourism performance and spent in Limpopo 2013-2017
Source: South African Tourism
The number of local tourism arrivals increased from just more than 1.4 million visitors
during 2013 to more than 1.8 million during 2017. From the Figure above it is clear
that the biggest tourism spend in Limpopo still comes from the traditional international
markets of the United States of America, Germany, United Kingdom and the rest of
Europe.
Figure 46: Domestic trips to Limpopo 2013-2017
Source: South African Tourism
1 4
22
55
6
1 6
39
76
6
1 3
44
83
0
1 5
41
12
0
1 8
82
19
12013 2014 2015 2016 2017
R 6
12
R 1
75
R 2
43
R 9
1
R 9
6
R 8
4 R 1
88
R 5
3
R 2
2
R 3
7
5 5
83 0
00
7 3
67 0
00
5 6
66 0
00 8
343 0
00
3,1
00,0
00
2013 2014 2015 2016 2017

69 | P a g e
8.4. Tourism Clusters as building blocks for tourism growth in Limpopo.
As mentioned, tourism in Limpopo had been identified as a sector with a very strong
competitive advantage in ecotourism linked to wildlife, culture and vast landscapes.
The wide variety of tourism destinations, attractions, products and services led to the
creation of six tourism clusters. As indicated in the introduction, six tourism clusters
were identified as the building blocks of the strategy, namely the Family & Recreation
cluster, Business & Events cluster, Sport & Wildlife cluster, Safari and Hunting cluster,
and the Special Interest cluster. A tourism cluster presents the unique attributes of
Limpopo that distinguishes itself from other tourist destinations and offers similar
activities and experiences to existing and future identified market segments. It does
not follow specific boundaries but rather links independent products and services
associated with similar offerings and depicts the close linkages tourism has with the
natural environment, landscapes and diverse wildlife offering unique to Limpopo.
It is furthermore important to note that these clusters do not necessarily exist in
isolation but are in many ways interlinked and therefore enhance the tourist experience
in a number of ways.
8.5. Conclusion
Although tourism is seen as a complex system of interrelated yet independent parts,
it proved to be a resilient sector with tremendous growth potential despite certain
challenges. The growth in tourist numbers clearly indicates that numerous
opportunities still exist. To leverage from this competitive edge and to expand tourism
opportunities in Limpopo that will contribute to economic growth, in especially rural
and wilderness settings, six tourism clusters were identified. These clusters respond
to the identified tourism market segments that showed potential for further growth. It
is also acknowledged that tourism is not an isolated sector but depends on the
performance of other sector departments, local destination planning and development
and strong partnerships with the private sector.