cover page - wordpress.com · cover page this sample business plan has been made available to users...
TRANSCRIPT

Cover Page
This sample business plan has been made available to users of Business Plan Pro®, business
planning software published by Palo Alto Software, Inc. Names, locations and numbers may have
been changed, and substantial portions of the original plan text may have been omitted to preserve confidentiality and proprietary information.
You are welcome to use this plan as a starting point to create your own, but you do not have permission to resell, reproduce, publish, distribute or even copy this plan as it exists here.
Requests for reprints, academic use, and other dissemination of this sample plan should be emailed
to the marketing department of Palo Alto Software at [email protected]. For product
information visit our website: www.paloalto.com or call: 1-800-229-7526.
Copyright © Palo Alto Software, Inc., 1995-2009 All rights reserved.

Legal Page
Confidentiality Agreement
The undersigned reader acknowledges that the information provided by _______________ in this
business plan is confidential; therefore, reader agrees not to disclose it without the express written permission of _______________.
It is acknowledged by reader that information to be furnished in this business plan is in all respects
confidential in nature, other than information which is in the public domain through other means
and that any disclosure or use of same by reader, may cause serious harm or damage to _______________.
Upon request, this document is to be immediately returned to _______________.
___________________ Signature
___________________
Name (typed or printed)
___________________ Date
This is a business plan. It does not imply an offering of securities.

Table of Contents
Page 1
1.0 Executive Summary .................................................................................................................... 1
Chart: Highlights .......................................................................................................................... 1
1.1 Yearly Profit Potential ............................................................................................................. 2
1.2 Keys to Success ........................................................................................................................ 2
2.0 Company Summary ..................................................................................................................... 2
2.1 Start-up Summary ................................................................................................................... 2
Table: Start-up Funding ............................................................................................................ 3
Chart: Start-up ............................................................................................................................. 4
Table: Start-up .............................................................................................................................. 4
2.2 Financial Picture of Current Laundromat ........................................................................ 5
2.3 Company Locations and Facilities ...................................................................................... 5
3.0 Services ............................................................................................................................................ 5
3.1 Competitive Comparison ....................................................................................................... 6
4.0 Marketing Strategy ...................................................................................................................... 6
4.1 Target Market ............................................................................................................................ 6
Table: Market Analysis ............................................................................................................... 6
5.0 Management Summary .............................................................................................................. 6
5.1 Management Team .................................................................................................................. 7
5.2 Personnel Plan ........................................................................................................................... 7
Table: Personnel ........................................................................................................................... 8
5.3 Handling of Money ................................................................................................................... 8
6.0 Financial Plan ................................................................................................................................. 8
6.1 Payback Plan for a 10-year Term Loan ........................................................................... 9
6.2 Factors Minimizing Risk of Loan Default ......................................................................... 9
6.3 Key Financial Indicators ....................................................................................................... 10
Chart: Benchmarks .................................................................................................................... 10
6.4 Break-even Analysis .............................................................................................................. 11
Chart: Break-even Analysis ................................................................................................... 11
Table: Break-even Analysis .................................................................................................... 11
6.5 Sales Forecast ......................................................................................................................... 12
Chart: Sales Monthly ................................................................................................................ 12
Table: Sales Forecast ............................................................................................................... 12
6.6 Projected Profit and Loss ..................................................................................................... 13
6.6 Projected Profit and Loss ..................................................................................................... 13
Table: Profit and Loss ............................................................................................................... 13
Chart: Profit Monthly ................................................................................................................ 14
6.7 Projected Cash Flow .............................................................................................................. 15
Chart: Cash .................................................................................................................................. 15
Table: Cash Flow ........................................................................................................................ 16
6.8 Projected Balance Sheet ...................................................................................................... 17
Table: Balance Sheet ................................................................................................................ 17
6.9 Business Ratios ....................................................................................................................... 17
6.9 Business Ratios ....................................................................................................................... 17
Table: Ratios ................................................................................................................................ 18

Table of Contents
Page 2
Table: Sales Forecast ......................................................................................................................... 1
Table: Personnel ................................................................................................................................... 2
Table: Personnel ................................................................................................................................... 2
Table: General Assumptions ............................................................................................................ 3
Table: General Assumptions ............................................................................................................ 3
Table: Profit and Loss ......................................................................................................................... 4
Table: Profit and Loss ......................................................................................................................... 4
Table: Balance Sheet .......................................................................................................................... 6
Table: Balance Sheet .......................................................................................................................... 6
Table: Cash Flow .................................................................................................................................. 7
Table: Cash Flow .................................................................................................................................. 7

Universal Laundromat
Page 1
1.0 Executive Summary
Universal Laundromat is a full-service coin-op laundry (washing, drying, and optional folding)
service dedicated to consistently providing high customer satisfaction by rendering reliable
machines and furnishing a clean, enjoyable atmosphere at a competitive price/value
relationship.
Our Mission: To provide convenient, clean, and friendly laundry service.
Our Motto: "Professional, convenient, friendly service and competitive pricing"
The timing is right for starting this new venture. After patiently searching for two months for
the perfect location, one was finally found. The demand of laundry service, the ambitions of the
owner to one day start his own laundry business, and knowledge to support the venture, has made it a business opportunity with great potential.
Currently, Mr. Mihn Doung owns a small permanent shop in 7th Berryessa Flea Market selling
power tools every weekend. That store brings in approximately $4,500/month on average in
revenue. The profit averages out to approximately $2,500/month. Considering the potentiality
in the coin-op laundromat industry, he'd like to take on further challenges by starting another venture.
To achieve this objective, Universal Laundromat is seeking $150,000 in additional loan
financing. This loan will be paid by the cash flow from both the shop at the Flea Market and the
laundry business, and will be collateralized by the assets of the business and steady income it
brings along with an initial $75,000 down payment, and backed by the character, experience,
and personal guarantees of the owner.
Chart: Highlights

Universal Laundromat
Page 2
1.1 Yearly Profit Potential
It is very important to note that the minimum monthly amount of loan payback should decrease
as principal decreases. Furthermore, the profit projected in the table is after all expenses and
monthly loan payback have been subtracted. All net profit will then be paid as an additional
sum to greatly shorten the term of the loan.
1.2 Keys to Success
The keys to success in our business are:
Location: the potential business is to be located in a nice small shopping center of a poor
to lower-middle class, ethnically Mexican neighborhood, where it's the closest and most
convenient place to get services. In addition, there are two apartment complexes located
nearby. In addition to being the sole laundromat in this neighborhood and surrounded by
residences, there is no potential for a competitor.
Convenience: offering clients services ranging from full-service washing and drying to
optional folding, and extended business hours.
Environment: providing an environment conducive to giving clean, friendly, and
professional service.
Reputation: long-term reputation resulting from friendly, professional service will encourage customers to return.
2.0 Company Summary
Universal Laundromat will, upon commencement of operations, supply full washing, drying, and
optional folding services. We will also provide quality products to ensure clean washing of
clothes as well as household retail products to meet the demand for easy access for the
neighborhood. What will set Universal Laundromat apart from the competition is our
commitment to providing professional, friendly, prompt, and, most importantly, convenient
services.
2.1 Start-up Summary
This laundromat is a rare business opportunity that not many people can get. Having an
excellent proven track record of steady income, the current owner is reluctant to sell. However,
in desperation of a large sum of money to pay back loans before his retirement, he is, in a way,
forced to sell. Nevertheless, this sale has not been announced or listed to the public yet. Priority
is given to acquaintances before being given to the public. Being an acquaintant, Minh has first priority to the business opportunity.

Universal Laundromat
Page 3
Table: Start-up Funding
Start-up Funding Start-up Expenses to Fund $225,500 Start-up Assets to Fund $7,262 Total Funding Required $232,762
Assets Non-cash Assets from Start-up $0 Cash Requirements from Start-up $7,262 Additional Cash Raised $0 Cash Balance on Starting Date $7,262 Total Assets $7,262
Liabilities and Capital
Liabilities Current Borrowing $0 Long-term Liabilities $150,000 Accounts Payable (Outstanding Bills) $0 Other Current Liabilities (interest-free) $0 Total Liabilities $150,000
Capital
Planned Investment Minh Duong $82,762 Other $0 Additional Investment Requirement $0 Total Planned Investment $82,762
Loss at Start-up (Start-up Expenses) ($225,500) Total Capital ($142,738)
Total Capital and Liabilities $7,262
Total Funding $232,762

Universal Laundromat
Page 4
Chart: Start-up
Table: Start-up
Start-up
Requirements
Start-up Expenses Rent Deposit $0 Misc. $500 Cost of Business Acquisition $225,000 Total Start-up Expenses $225,500
Start-up Assets Cash Required $7,262 Other Current Assets $0 Long-term Assets $0 Total Assets $7,262
Total Requirements $232,762

Universal Laundromat
Page 5
2.2 Financial Picture of Current Laundromat A few tips from the expert:
In the laundromat industry, we should always consider an established venture.
The estimated value of the business should be 50 times the net profit; the investor should
regain investment in 3 years or less.
In the laundromat business, size doesn't matter. Only NET PROFIT (income) does.
Financial Picture of T. Le Super Wash laundromat:
REVENUE -
Laundromat Sales (On Average) $12,000
Supplies and Game Arcade Sales $1,100
Subletting Revenue $500
Total Monthly Revenue $13,600
OPERATIONAL ADMINISTRATIVE EXPENSES -
Rent $1,975
Garbage and Sewage $50
Business Insurance ($1,000,000 Liability) $107
Utilities (Gas, Electric, and Water) $2,300
Machine Maintenance $70
Payroll Expense $600
Direct Cost of Sales (Supplies, Miscellaneous) $300
Total Monthly Expenses $5,402
NET PROFIT (On Average) $8,198
2.3 Company Locations and Facilities
The laundromat is located in San Jose, California. It will utilize 1,500 square feet. The location
is strategically situated on one of the busiest streets in East San Jose. More specifically, it's
located in a small attractive shopping center next to the poor to lower-middle class homes;
therefore, there is NO possible competitor (after very careful examining). In addition, there are
two apartment complexes located nearby. Surrounding it, there is a Mexican neighborhood
whose residents get most of their services and needed goods in this plaza where the
laundromat is located.
3.0 Services
Universal Laundromat is considered a full-service laundry service. There are 34 washers and 20
dryers. We offer a wide range of services, including:
Washing
Drying
Folding (potentially)
Game arcade
Laundry supplies Retail household products

Universal Laundromat
Page 6
3.1 Competitive Comparison
Universal Laundromat would like to set itself apart from other laundromats that may offer only
one or two services. Although the focus of Universal Laundromat is a washing and drying
service, we do wish to offer our clients the convenience of these other services in one location.
Those services include folding and potentially pick-up/delivery service, as well as online
reservation and membership for pick-up and delivery. Most importantly, it's our convenience that sets us apart from the competition.
4.0 Marketing Strategy
It's been shown that the best method of advertising is through word-of-mouth. No major
newspaper ad campaign is planned. However, we shall run weekly specials. In addition, we
shall have an incentive program for referrals. Those customers who refer someone else to the
store will be rewarded with two free washes, and the referee will receive an introductory gift of
a free wash. In addition, we will ensure a clean environment, reliable machines, and friendly,
prompt services.
4.1 Target Market
Universal Laundromat's target market is every household that needs laundromat services within
the immediate area of east San Jose. There is no market segmentation strategy associated with
this potential market. The Market Analysis table indicates the estimated number of potential customers and their growth rate.
Table: Market Analysis
Market Analysis
Year 1 Year 2 Year 3 Year 4 Year 5
Potential Customers Growth CAGR Local Laundry Users in East San Jose 2% 6,434 6,531 6,629 6,728 6,829 1.50%
Other 0% 0 0 0 0 0 0.00% Total 1.50% 6,434 6,531 6,629 6,728 6,829 1.50%
5.0 Management Summary
The business is managed by the owner, who has extensive leadership and management skills
as well as an innovative and creative character. Unlike most laundromat businesses, Universal
Laundromat will have an on-site staff person(Maintenance/Cashier) dedicated not only to store
and machine maintenance but who also acts as a cashier to the retail business within the
laundromat. As part of the management philosophy, this Maintenance/Cashier person will be
carefully evaluated for friendliness, professionalism, efficiency, and honesty. The salaries are
shown in the personnel plan table. As Mr. Mihn Duong already has a steady income from his
power tool shop, his salary will be less than what would be expected if this was his sole source
of income.

Universal Laundromat
Page 7
5.1 Management Team
Minh Duong is an ambitious, hardworking, philosophical leader and businessman. He has
extensive business experience, and knowledge in various fields including retail sales, service
and the Internet industry. Over the years, he has started various small businesses ranging from
offline retail sales of a wide variety of products and services to online hosting services. He has
extensive leadership skills as he had been elected to be President of five different clubs in High
School. In college, Minh had founded two organizations at the University of California, Berkeley.
In addition, he had also been elected to various leadership roles such as President and Vice-
president of three different large organizations with membership over 500 members. School-
wide, Minh had been fortunate to be elected by the student body of the university to be a
Senator in the student government. During his term of office, he headed the Finance
Committee that dealt with over $500,000 in student fund allocation. Moreover, he also headed
the Student Affairs Committee as well as the Computing Facilities of the student government.
Realizing his service and efficiency, fellow senators elected him to the board of directors of the
Berkeley Student Foundation, the largest scholarship foundation for minority students
sponsored by the Associated Students of the University of California. There, Minh dealt with the
decision process of fund allocations to top high school minority students throughout the
country. In the business world, Minh currently owns a permanent Flea Market Power Tools Shop
at the Berryessa Flea Market in San Jose, CA. He is also the President/CEO of a small start-up
Internet company providing business solutions to other businesses. He is currently working
with five other colleagues at his college on that business. In academia, he is currently working
with Professor Bradford Delong, a former Bill Clinton's Foreign Policy Advisor Committee
member, as a Research Assistant on a book titled, A Time Series of Changes Due to
Globalization. Independently, he is currently working on a research paper titled, "Is Chinese Reform Sustainable? Is It Different?"
Minh is currently a fifth year Pre-med, Pre-MBA student with a triple major in Economics,
Mathematics, and Statistics. He is currently 22 years old. He came to the U.S. on Nov. 7, 1990
from Viet Nam. After finishing his college education, he plans to achieve an MBA from Harvard Business School and an MD from John Hopkins Medical School.
5.2 Personnel Plan
There will be one Attendant/Cashier employee whose duties include store and machine
maintenance, and being a cashier/retailer for the small retail business in the laundromat. As
time progresses, we will expand to include full folding service. Depending on the demand for
the service, we might add more personnel. The current salary for the existing personnel is
$700/mo. With the added duties and responsibilities, it's reasonable and possible to increase salaries.
As for machine maintenance, this will be outsourced at Xuan Repair Services. This is an on-call
independent repair service. They have been known within the community, as one of the reliable
and prompt repair services. They usually service within the same day. It's been estimated to cost approximately $150 per month for maintenance.

Universal Laundromat
Page 8
Table: Personnel
Personnel Plan
Year 1 Year 2 Year 3
Production Personnel Maintenance Contractor $1,650 $1,650 $1,650 Other $0 $0 $0 Subtotal $1,650 $1,650 $1,650
Sales and Marketing Personnel None $0 $0 $0 Other $0 $0 $0 Subtotal $0 $0 $0
General and Administrative Personnel Owner $22,000 $24,000 $24,000 Maintenance/Cashier $7,700 $8,400 $8,400 Subtotal $29,700 $32,400 $32,400
Other Personnel None $0 $0 $0 Other $0 $0 $0 Subtotal $0 $0 $0
Total People 2 2 2
Total Payroll $31,350 $34,050 $34,050
5.3 Handling of Money
Money from machines will be collected twice a week by Minh Duong. It will be counted by a
counting machine and deposited directly into the bank account. The collection time will vary to maximize security of revenue.
6.0 Financial Plan
In this business, it is expected that the revenue is 30% more in the winter due to more
machine-drying and less hang-drying. Conversely, it's also expected that revenue is 30% less
in the summer due to hang-drying in the sunlight. Furthermore, with the potential in this
particular laundromat and the management confidence, it's expected that growth should be at
least 15% annually. It should be noted again that monthly profit shown has already taken into
account the minimum monthly loan payback amount. It's planned that all remaining profit will
be paid towards loan as additional payback.

Universal Laundromat
Page 9
6.1 Payback Plan for a 10-year Term Loan
Plan of Payback for a 10-year term loan:
Total amount of loan $150,000
Monthly payback including interest $2,109
Additional payback amount from monthly net profit $2,838
Monthly net profit ($13,100 - $5402 -$2617.25) $5,081
Total monthly payback $4,946
For $3,508/month loan payment, the 10-year term loan (11.5% interest rate) will be shortened
to less than 36 months (three years). If the interest rate is lower, then the loan will be paid off
sooner. Also, if the business does better than usual,then the loan term will be further
shortened. The motive here is to pay off the loan as soon as possible to reduce cost of interest
paid on the loan. Based on the cash flow and profitability projections in this plan, this accelerated payment scheme could be started at the beginning of FY2002.
The monthly payment against principal is reflected in the Cash Flow table (Long-term Liabilities Principal Repayment).
The monthly interest payment is reflected in the Profit and Loss table (Interest Expense).
6.2 Factors Minimizing Risk of Loan Default
Factors that minimize risk of default on a loan:
Proven steady net profit from laundromat; it is a reliable source of proof of net steady
income.
Utility bills are the best estimators since no laundromat has income statement due to tax
disadvantage reasons.
Current owner is someone Minh's known for five years in value and trust.
Current owner sincerely expressed his belief in the accuracy of net income and reassured it
by his living next door to the laundromat and first year property tax coverage along with
free three months machine maintenance.
Current owner is also confident that if the business doesn't produce what he claims it has,
even without improvement of current store condition, he is willing to carry an interest-free
loan up to $20,000 to help keep it up to speed if necessary. This is to ensure the accuracy
on the numbers he claimed about Net Income.
Current owner also covers any raise in rent for the first 2 years at the time of signing a new
10-year lease.
Additional payback amount will be supplemented from the business' monthly net profit. This
will shorten a 10-year loan to less than 36 months. Therefore, this will be a major
contributing factor in minimizing risk to a loan.
Minh owns a Flea Market Power Tools shop. This could be used as a secondary source of
capital support to the laundry venture if business doesn't go well.
Minh will put up $80,000 out-of-pocket investment. According to California Coin Laundry
Association, the formula for estimating the value of the business is 50 times the net profit.
Since the business brings an average net profit of $7,000 or more, the market value for the
business if it was to be sold according to this standard is 47 times (multiplier subtracted

Universal Laundromat
Page 10
because of some older machines) $7,000 = $329,000. Fortunately, the business is under
sold (very much below market price) for $225,000, a difference of $104,000.
Non-depreciation market value of business. In the worst case scenario, if the business
doesn't prosper, then it could be sold for at least the amount invested in. Let's say even
worse, if the business loses $20,000 after the business is sold, then the loan would be paid
in full and Minh will absorb the loss of the amount.
History has shown that there's NOT a local competitor. In addition, there are two apartment
complexes located nearby. Surrounding it, there is also a poor Mexican neighborhood where
residents get most of their services and needed goods in this plaza where the laundromat is
located.
In the case of Minh's death, the loan will be insured by his 10-year term, $250,000 life
insurance. The bank shall be the primary beneficiary. The insurance policy shall begin once the loan is approved by the bank.
6.3 Key Financial Indicators
This financial indicator shows the potential changes such as growth. This is based on the annual
sales, and operating expenses as measured in gross amounts (gross margin is in percentage
terms).
Chart: Benchmarks

Universal Laundromat
Page 11
6.4 Break-even Analysis
The break-even analysis shows that Universal Laundromat has a good balance of fixed costs
and sufficient sales strength to remain healthy. Our break-even point is only 745 customers a
month. This was derived by using an average revenue of $8 per customer, and fixed costs of
approximately $4,900. This also includes the cost of products for retail sales and all other costs such as payroll, maintenance, garbage, utilities, and insurance.
Chart: Break-even Analysis
Table: Break-even Analysis
Break-even Analysis
Monthly Revenue Break-even $5,961
Assumptions: Average Percent Variable Cost 19% Estimated Monthly Fixed Cost $4,821

Universal Laundromat
Page 12
6.5 Sales Forecast The following table and chart illustrate the sales forecast. The first year is an accurate
description of the current sales condition based on the last two years of growth. The company's
cost of sales or variable cost consists of the company's utility expenses, which are dependant on the number of customers. This is normally a fixed cost for most companies.
Chart: Sales Monthly
Table: Sales Forecast
Sales Forecast
Year 1 Year 2 Year 3
Sales Sales of Laundry Service $132,000 $165,600 $190,440 Subletting Sale $5,500 $6,600 $7,200 Sales of Retail Products and Games $12,100 $15,180 $17,457 Total Sales $149,600 $187,380 $215,097
Direct Cost of Sales Year 1 Year 2 Year 3 Sales of Laundry Service $25,300 $29,095 $33,459 Subletting Sale $0 $0 $0 Sales of Retail Products and Games $3,300 $4,000 $4,500 Subtotal Direct Cost of Sales $28,600 $33,095 $37,959

Universal Laundromat
Page 13
6.6 Projected Profit and Loss
The profit projected in the table is after all expenses and monthly loan payback have been
taken into account. All net profit will then be paid as an additional sum to greatly shorten the term of the loan.
Table: Profit and Loss
Pro Forma Profit and Loss
Year 1 Year 2 Year 3 Sales $149,600 $187,380 $215,097 Direct Cost of Sales $28,600 $33,095 $37,959 Production Payroll $1,650 $1,650 $1,650 Other $0 $0 $0 Total Cost of Sales $30,250 $34,745 $39,609
Gross Margin $119,350 $152,635 $175,488 Gross Margin % 79.78% 81.46% 81.59%
Operating Expenses
Sales and Marketing Expenses Sales and Marketing Payroll $0 $0 $0 Business Insurance $1,177 $1,177 $1,177 Miscellaneous $0 $0 $0 Total Sales and Marketing Expenses $1,177 $1,177 $1,177 Sales and Marketing % 0.79% 0.63% 0.55%
General and Administrative Expenses General and Administrative Payroll $29,700 $32,400 $32,400 Sales and Marketing and Other Expenses $0 $0 $0 Depreciation $0 $0 $0 Misc. $0 $0 $0 Garbage/Sewage $550 $550 $550 Rent $21,725 $23,700 $24,300 Payroll Taxes $4,703 $5,108 $5,108 Other General and Administrative Expenses $0 $0 $0 Total General and Administrative Expenses $56,678 $61,758 $62,358 General and Administrative % 37.89% 32.96% 28.99%
Other Expenses: Other Payroll $0 $0 $0 Consultants $0 $0 $0 Others $0 $0 $0 Total Other Expenses $0 $0 $0 Other % 0.00% 0.00% 0.00%
Total Operating Expenses $57,854 $62,935 $63,535
Profit Before Interest and Taxes $61,496 $89,701 $111,954 EBITDA $61,496 $89,701 $111,954 Interest Expense $16,826 $13,981 $9,140 Taxes Incurred $11,096 $18,930 $26,132
Net Profit $33,574 $56,790 $76,682 Net Profit/Sales 22.44% 30.31% 35.65%

Universal Laundromat
Page 14
Chart: Profit Monthly

Universal Laundromat
Page 15
6.7 Projected Cash Flow
The following is a chart and table showing the cash flow and cash balance every month. The
cash flow is the net income after all expenses have been paid. The cash balance shows the
accumulation of cash in the business over the periods. The main point of this chart and table is
to show the excess cash flow that could be used as additional payback on the loan. Therefore,
after such additional payback takes place, all bars should be stabilized and cash flow should be down to zero because none of the profit is withdrawn.
Chart: Cash

Universal Laundromat
Page 16
Table: Cash Flow
Pro Forma Cash Flow
Year 1 Year 2 Year 3
Cash Received
Cash from Operations Cash Sales $149,600 $187,380 $215,097 Subtotal Cash from Operations $149,600 $187,380 $215,097
Additional Cash Received Sales Tax, VAT, HST/GST Received $0 $0 $0 New Current Borrowing $0 $0 $0 New Other Liabilities (interest-free) $0 $0 $0 New Long-term Liabilities $0 $0 $0 Sales of Other Current Assets $0 $0 $0 Sales of Long-term Assets $0 $0 $0 New Investment Received $0 $0 $0 Subtotal Cash Received $149,600 $187,380 $215,097
Expenditures Year 1 Year 2 Year 3
Expenditures from Operations Cash Spending $31,350 $34,050 $34,050 Bill Payments $76,121 $97,160 $103,722 Subtotal Spent on Operations $107,471 $131,210 $137,772
Additional Cash Spent Sales Tax, VAT, HST/GST Paid Out $0 $0 $0 Principal Repayment of Current Borrowing $0 $0 $0 Other Liabilities Principal Repayment $0 $0 $0 Long-term Liabilities Principal Repayment $7,381 $42,096 $42,096 Purchase Other Current Assets $0 $0 $0 Purchase Long-term Assets $0 $0 $0 Dividends $0 $0 $0 Subtotal Cash Spent $114,852 $173,306 $179,868
Net Cash Flow $34,748 $14,074 $35,229 Cash Balance $42,010 $56,084 $91,313

Universal Laundromat
Page 17
6.8 Projected Balance Sheet The balance sheet numbers are shown below and in the appendix.
Table: Balance Sheet
Pro Forma Balance Sheet
Year 1 Year 2 Year 3
Assets
Current Assets Cash $42,010 $56,084 $91,313 Other Current Assets $0 $0 $0 Total Current Assets $42,010 $56,084 $91,313
Long-term Assets Long-term Assets $0 $0 $0 Accumulated Depreciation $0 $0 $0 Total Long-term Assets $0 $0 $0 Total Assets $42,010 $56,084 $91,313
Liabilities and Capital Year 1 Year 2 Year 3
Current Liabilities Accounts Payable $8,555 $7,935 $8,578 Current Borrowing $0 $0 $0 Other Current Liabilities $0 $0 $0 Subtotal Current Liabilities $8,555 $7,935 $8,578
Long-term Liabilities $142,619 $100,523 $58,427 Total Liabilities $151,174 $108,458 $67,005
Paid-in Capital $82,762 $82,762 $82,762 Retained Earnings ($225,500) ($191,926) ($135,136) Earnings $33,574 $56,790 $76,682 Total Capital ($109,164) ($52,374) $24,308 Total Liabilities and Capital $42,010 $56,084 $91,313
Net Worth ($109,164) ($52,374) $24,308
6.9 Business Ratios
Business ratios for the years of this plan are shown below. Industry profile ratios based on the
Standard Industrial Classification (SIC) code 7215, Coin-Operated Laundries and Cleaning, are
shown for comparison.

Universal Laundromat
Page 18
Table: Ratios
Ratio Analysis
Year 1 Year 2 Year 3 Industry Profile Sales Growth n.a. 25.25% 14.79% 5.30%
Percent of Total Assets Other Current Assets 0.00% 0.00% 0.00% 37.50% Total Current Assets 100.00% 100.00% 100.00% 55.70% Long-term Assets 0.00% 0.00% 0.00% 44.30% Total Assets 100.00% 100.00% 100.00% 100.00%
Current Liabilities 20.36% 14.15% 9.39% 30.00% Long-term Liabilities 339.49% 179.24% 63.99% 24.00% Total Liabilities 359.85% 193.38% 73.38% 54.00% Net Worth -259.85% -93.38% 26.62% 46.00%
Percent of Sales Sales 100.00% 100.00% 100.00% 100.00% Gross Margin 79.78% 81.46% 81.59% 0.00% Selling, General & Administrative Expenses 62.17% 70.06% 63.90% 71.70% Advertising Expenses 0.79% 0.63% 0.55% 2.40% Profit Before Interest and Taxes 41.11% 47.87% 52.05% 4.50%
Main Ratios Current 4.91 7.07 10.65 1.97 Quick 4.91 7.07 10.65 1.48 Total Debt to Total Assets 359.85% 193.38% 73.38% 54.00% Pre-tax Return on Net Worth -40.92% -144.58% 422.96% 6.90% Pre-tax Return on Assets 106.33% 135.01% 112.59% 15.00%
Additional Ratios Year 1 Year 2 Year 3 Net Profit Margin 22.44% 30.31% 35.65% n.a Return on Equity 0.00% 0.00% 315.46% n.a
Activity Ratios Accounts Payable Turnover 9.90 12.17 12.17 n.a Payment Days 27 31 29 n.a Total Asset Turnover 3.56 3.34 2.36 n.a
Debt Ratios Debt to Net Worth 0.00 0.00 2.76 n.a Current Liab. to Liab. 0.06 0.07 0.13 n.a
Liquidity Ratios Net Working Capital $33,455 $48,149 $82,735 n.a Interest Coverage 3.65 6.42 12.25 n.a
Additional Ratios Assets to Sales 0.28 0.30 0.42 n.a Current Debt/Total Assets 20% 14% 9% n.a Acid Test 4.91 7.07 10.65 n.a Sales/Net Worth 0.00 0.00 8.85 n.a Dividend Payout 0.00 0.00 0.00 n.a

Appendix
Page 1
Table: Sales Forecast
Sales Forecast
Month 1 Month 2 Month 3 Month 4 Month 5 Month 6 Month 7 Month 8 Month 9 Month 10 Month 11 Month 12
Sales Sales of Laundry Service 0% $0 $15,000 $15,000 $14,000 $12,000 $10,000 $9,000 $9,000 $9,000 $12,000 $12,000 $15,000 Subletting Sale 0% $0 $500 $500 $500 $500 $500 $500 $500 $500 $500 $500 $500 Sales of Retail Products and Games 0% $0 $1,100 $1,100 $1,100 $1,100 $1,100 $1,100 $1,100 $1,100 $1,100 $1,100 $1,100 Total Sales $0 $16,600 $16,600 $15,600 $13,600 $11,600 $10,600 $10,600 $10,600 $13,600 $13,600 $16,600
Direct Cost of Sales Month 1 Month 2 Month 3 Month 4 Month 5 Month 6 Month 7 Month 8 Month 9 Month 10 Month 11 Month 12
Sales of Laundry Service $0 $2,990 $2,990 $2,300 $2,300 $2,300 $1,610 $1,610 $1,610 $2,300 $2,300 $2,990
Subletting Sale $0 $0 $0 $0 $0 $0 $0 $0 $0 $0 $0 $0
Sales of Retail Products and Games $0 $300 $300 $300 $300 $300 $300 $300 $300 $300 $300 $300
Subtotal Direct Cost of Sales $0 $3,290 $3,290 $2,600 $2,600 $2,600 $1,910 $1,910 $1,910 $2,600 $2,600 $3,290

Appendix
Page 2
Table: Personnel
Personnel Plan
Month 1 Month 2 Month 3 Month 4 Month 5 Month 6 Month 7 Month 8 Month 9 Month 10 Month 11 Month 12
Production Personnel
Maintenance Contractor $0 $150 $150 $150 $150 $150 $150 $150 $150 $150 $150 $150
Other $0 $0 $0 $0 $0 $0 $0 $0 $0 $0 $0 $0
Subtotal $0 $150 $150 $150 $150 $150 $150 $150 $150 $150 $150 $150
Sales and Marketing Personnel
None $0 $0 $0 $0 $0 $0 $0 $0 $0 $0 $0 $0
Other $0 $0 $0 $0 $0 $0 $0 $0 $0 $0 $0 $0
Subtotal $0 $0 $0 $0 $0 $0 $0 $0 $0 $0 $0 $0
General and Administrative Personnel
Owner $0 $2,000 $2,000 $2,000 $2,000 $2,000 $2,000 $2,000 $2,000 $2,000 $2,000 $2,000
Maintenance/Cashier $0 $700 $700 $700 $700 $700 $700 $700 $700 $700 $700 $700
Subtotal $0 $2,700 $2,700 $2,700 $2,700 $2,700 $2,700 $2,700 $2,700 $2,700 $2,700 $2,700
Other Personnel
None $0 $0 $0 $0 $0 $0 $0 $0 $0 $0 $0 $0
Other $0 $0 $0 $0 $0 $0 $0 $0 $0 $0 $0 $0
Subtotal $0 $0 $0 $0 $0 $0 $0 $0 $0 $0 $0 $0
Total People 2 2 2 2 2 2 2 2 2 2 2 2
Total Payroll $0 $2,850 $2,850 $2,850 $2,850 $2,850 $2,850 $2,850 $2,850 $2,850 $2,850 $2,850

Appendix
Page 3
Table: General Assumptions
General Assumptions
Month 1 Month 2 Month 3 Month 4 Month 5 Month 6 Month 7 Month 8 Month 9 Month 10 Month 11 Month 12
Plan Month 1 2 3 4 5 6 7 8 9 10 11 12
Current Interest Rate 10.00% 10.00% 10.00% 10.00% 10.00% 10.00% 10.00% 10.00% 10.00% 10.00% 10.00% 10.00%
Long-term Interest Rate 11.50% 11.50% 11.50% 11.50% 11.50% 11.50% 11.50% 11.50% 11.50% 11.50% 11.50% 11.50%
Tax Rate 30.00% 25.00% 25.00% 25.00% 25.00% 25.00% 25.00% 25.00% 25.00% 25.00% 25.00% 25.00%
Other 0 0 0 0 0 0 0 0 0 0 0 0
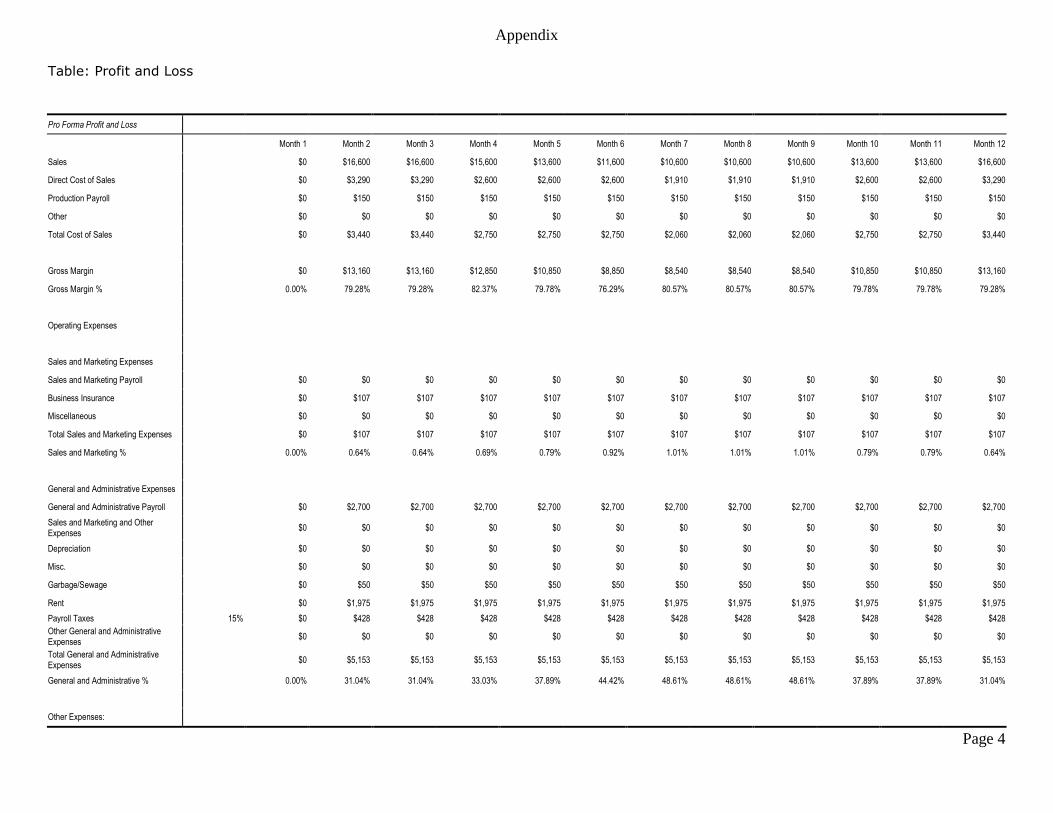
Appendix
Page 4
Table: Profit and Loss
Pro Forma Profit and Loss
Month 1 Month 2 Month 3 Month 4 Month 5 Month 6 Month 7 Month 8 Month 9 Month 10 Month 11 Month 12
Sales $0 $16,600 $16,600 $15,600 $13,600 $11,600 $10,600 $10,600 $10,600 $13,600 $13,600 $16,600
Direct Cost of Sales $0 $3,290 $3,290 $2,600 $2,600 $2,600 $1,910 $1,910 $1,910 $2,600 $2,600 $3,290
Production Payroll $0 $150 $150 $150 $150 $150 $150 $150 $150 $150 $150 $150
Other $0 $0 $0 $0 $0 $0 $0 $0 $0 $0 $0 $0
Total Cost of Sales $0 $3,440 $3,440 $2,750 $2,750 $2,750 $2,060 $2,060 $2,060 $2,750 $2,750 $3,440
Gross Margin $0 $13,160 $13,160 $12,850 $10,850 $8,850 $8,540 $8,540 $8,540 $10,850 $10,850 $13,160
Gross Margin % 0.00% 79.28% 79.28% 82.37% 79.78% 76.29% 80.57% 80.57% 80.57% 79.78% 79.78% 79.28%
Operating Expenses
Sales and Marketing Expenses
Sales and Marketing Payroll $0 $0 $0 $0 $0 $0 $0 $0 $0 $0 $0 $0
Business Insurance $0 $107 $107 $107 $107 $107 $107 $107 $107 $107 $107 $107
Miscellaneous $0 $0 $0 $0 $0 $0 $0 $0 $0 $0 $0 $0
Total Sales and Marketing Expenses $0 $107 $107 $107 $107 $107 $107 $107 $107 $107 $107 $107
Sales and Marketing % 0.00% 0.64% 0.64% 0.69% 0.79% 0.92% 1.01% 1.01% 1.01% 0.79% 0.79% 0.64%
General and Administrative Expenses
General and Administrative Payroll $0 $2,700 $2,700 $2,700 $2,700 $2,700 $2,700 $2,700 $2,700 $2,700 $2,700 $2,700 Sales and Marketing and Other Expenses $0 $0 $0 $0 $0 $0 $0 $0 $0 $0 $0 $0
Depreciation $0 $0 $0 $0 $0 $0 $0 $0 $0 $0 $0 $0
Misc. $0 $0 $0 $0 $0 $0 $0 $0 $0 $0 $0 $0
Garbage/Sewage $0 $50 $50 $50 $50 $50 $50 $50 $50 $50 $50 $50
Rent $0 $1,975 $1,975 $1,975 $1,975 $1,975 $1,975 $1,975 $1,975 $1,975 $1,975 $1,975 Payroll Taxes 15% $0 $428 $428 $428 $428 $428 $428 $428 $428 $428 $428 $428 Other General and Administrative Expenses $0 $0 $0 $0 $0 $0 $0 $0 $0 $0 $0 $0
Total General and Administrative Expenses $0 $5,153 $5,153 $5,153 $5,153 $5,153 $5,153 $5,153 $5,153 $5,153 $5,153 $5,153
General and Administrative % 0.00% 31.04% 31.04% 33.03% 37.89% 44.42% 48.61% 48.61% 48.61% 37.89% 37.89% 31.04%
Other Expenses:

Appendix
Page 5
Other Payroll $0 $0 $0 $0 $0 $0 $0 $0 $0 $0 $0 $0
Consultants $0 $0 $0 $0 $0 $0 $0 $0 $0 $0 $0 $0
Others $0 $0 $0 $0 $0 $0 $0 $0 $0 $0 $0 $0
Total Other Expenses $0 $0 $0 $0 $0 $0 $0 $0 $0 $0 $0 $0
Other % 0.00% 0.00% 0.00% 0.00% 0.00% 0.00% 0.00% 0.00% 0.00% 0.00% 0.00% 0.00%
Total Operating Expenses $0 $5,259 $5,260 $5,260 $5,260 $5,260 $5,260 $5,260 $5,260 $5,260 $5,260 $5,260
Profit Before Interest and Taxes $0 $7,901 $7,901 $7,591 $5,591 $3,591 $3,281 $3,281 $3,281 $5,591 $5,591 $7,901
EBITDA $0 $7,901 $7,901 $7,591 $5,591 $3,591 $3,281 $3,281 $3,281 $5,591 $5,591 $7,901
Interest Expense $1,438 $1,431 $1,425 $1,418 $1,412 $1,405 $1,399 $1,392 $1,386 $1,380 $1,373 $1,367
Taxes Incurred ($431) $1,617 $1,619 $1,543 $1,045 $546 $470 $472 $474 $1,053 $1,054 $1,633
Net Profit ($1,006) $4,852 $4,857 $4,629 $3,134 $1,639 $1,411 $1,416 $1,421 $3,158 $3,163 $4,900
Net Profit/Sales 0.00% 29.23% 29.26% 29.67% 23.04% 14.13% 13.31% 13.36% 13.40% 23.22% 23.26% 29.52%

Appendix
Page 6
Table: Balance Sheet
Pro Forma Balance Sheet
Month 1 Month 2 Month 3 Month 4 Month 5 Month 6 Month 7 Month 8 Month 9 Month 10 Month 11 Month 12
Assets Starting Balances
Current Assets Cash $7,262 $7,228 $19,038 $23,219 $26,431 $28,406 $28,886 $28,880 $29,620 $30,365 $34,073 $36,560 $42,010 Other Current Assets $0 $0 $0 $0 $0 $0 $0 $0 $0 $0 $0 $0 $0 Total Current Assets $7,262 $7,228 $19,038 $23,219 $26,431 $28,406 $28,886 $28,880 $29,620 $30,365 $34,073 $36,560 $42,010
Long-term Assets Long-term Assets $0 $0 $0 $0 $0 $0 $0 $0 $0 $0 $0 $0 $0 Accumulated Depreciation $0 $0 $0 $0 $0 $0 $0 $0 $0 $0 $0 $0 $0 Total Long-term Assets $0 $0 $0 $0 $0 $0 $0 $0 $0 $0 $0 $0 $0 Total Assets $7,262 $7,228 $19,038 $23,219 $26,431 $28,406 $28,886 $28,880 $29,620 $30,365 $34,073 $36,560 $42,010
Liabilities and Capital Month 1 Month 2 Month 3 Month 4 Month 5 Month 6 Month 7 Month 8 Month 9 Month 10 Month 11 Month 12
Current Liabilities Accounts Payable $0 $973 $8,601 $8,597 $7,850 $7,362 $6,874 $6,128 $6,123 $6,118 $7,339 $7,334 $8,555 Current Borrowing $0 $0 $0 $0 $0 $0 $0 $0 $0 $0 $0 $0 $0 Other Current Liabilities $0 $0 $0 $0 $0 $0 $0 $0 $0 $0 $0 $0 $0 Subtotal Current Liabilities $0 $973 $8,601 $8,597 $7,850 $7,362 $6,874 $6,128 $6,123 $6,118 $7,339 $7,334 $8,555
Long-term Liabilities $150,000 $150,000 $149,329 $148,658 $147,987 $147,316 $146,645 $145,974 $145,303 $144,632 $143,961 $143,290 $142,619 Total Liabilities $150,000 $150,973 $157,930 $157,255 $155,837 $154,678 $153,519 $152,102 $151,426 $150,750 $151,300 $150,624 $151,174
Paid-in Capital $82,762 $82,762 $82,762 $82,762 $82,762 $82,762 $82,762 $82,762 $82,762 $82,762 $82,762 $82,762 $82,762 Retained Earnings ($225,500) ($225,500) ($225,500) ($225,500) ($225,500) ($225,500) ($225,500) ($225,500) ($225,500) ($225,500) ($225,500) ($225,500) ($225,500) Earnings $0 ($1,006) $3,846 $8,703 $13,332 $16,466 $18,105 $19,516 $20,932 $22,353 $25,511 $28,674 $33,574 Total Capital ($142,738) ($143,744) ($138,892) ($134,035) ($129,406) ($126,272) ($124,633) ($123,222) ($121,806) ($120,385) ($117,227) ($114,064) ($109,164) Total Liabilities and Capital $7,262 $7,228 $19,038 $23,219 $26,431 $28,406 $28,886 $28,880 $29,620 $30,365 $34,073 $36,560 $42,010
Net Worth ($142,738) ($143,744) ($138,892) ($134,035) ($129,406) ($126,272) ($124,633) ($123,222) ($121,806) ($120,385) ($117,227) ($114,064) ($109,164)

Appendix
Page 7
Table: Cash Flow
Pro Forma Cash Flow
Month 1 Month 2 Month 3 Month 4 Month 5 Month 6 Month 7 Month 8 Month 9 Month 10 Month 11 Month 12 Cash Received Cash from Operations Cash Sales $0 $16,600 $16,600 $15,600 $13,600 $11,600 $10,600 $10,600 $10,600 $13,600 $13,600 $16,600 Subtotal Cash from Operations $0 $16,600 $16,600 $15,600 $13,600 $11,600 $10,600 $10,600 $10,600 $13,600 $13,600 $16,600
Additional Cash Received Sales Tax, VAT, HST/GST Received 0.00% $0 $0 $0 $0 $0 $0 $0 $0 $0 $0 $0 $0 New Current Borrowing $0 $0 $0 $0 $0 $0 $0 $0 $0 $0 $0 $0 New Other Liabilities (interest-free) $0 $0 $0 $0 $0 $0 $0 $0 $0 $0 $0 $0 New Long-term Liabilities $0 $0 $0 $0 $0 $0 $0 $0 $0 $0 $0 $0 Sales of Other Current Assets $0 $0 $0 $0 $0 $0 $0 $0 $0 $0 $0 $0 Sales of Long-term Assets $0 $0 $0 $0 $0 $0 $0 $0 $0 $0 $0 $0 New Investment Received $0 $0 $0 $0 $0 $0 $0 $0 $0 $0 $0 $0 Subtotal Cash Received $0 $16,600 $16,600 $15,600 $13,600 $11,600 $10,600 $10,600 $10,600 $13,600 $13,600 $16,600
Expenditures Month 1 Month 2 Month 3 Month 4 Month 5 Month 6 Month 7 Month 8 Month 9 Month 10 Month 11 Month 12
Expenditures from Operations Cash Spending $0 $2,850 $2,850 $2,850 $2,850 $2,850 $2,850 $2,850 $2,850 $2,850 $2,850 $2,850 Bill Payments $34 $1,269 $8,898 $8,867 $8,104 $7,599 $7,085 $6,339 $6,334 $6,371 $7,592 $7,629 Subtotal Spent on Operations $34 $4,119 $11,748 $11,717 $10,954 $10,449 $9,935 $9,189 $9,184 $9,221 $10,442 $10,479
Additional Cash Spent Sales Tax, VAT, HST/GST Paid Out $0 $0 $0 $0 $0 $0 $0 $0 $0 $0 $0 $0 Principal Repayment of Current Borrowing $0 $0 $0 $0 $0 $0 $0 $0 $0 $0 $0 $0 Other Liabilities Principal Repayment $0 $0 $0 $0 $0 $0 $0 $0 $0 $0 $0 $0 Long-term Liabilities Principal Repayment $0 $671 $671 $671 $671 $671 $671 $671 $671 $671 $671 $671 Purchase Other Current Assets $0 $0 $0 $0 $0 $0 $0 $0 $0 $0 $0 $0 Purchase Long-term Assets $0 $0 $0 $0 $0 $0 $0 $0 $0 $0 $0 $0 Dividends $0 $0 $0 $0 $0 $0 $0 $0 $0 $0 $0 $0 Subtotal Cash Spent $34 $4,790 $12,419 $12,388 $11,625 $11,120 $10,606 $9,860 $9,855 $9,892 $11,113 $11,150
Net Cash Flow ($34) $11,810 $4,181 $3,212 $1,975 $480 ($6) $740 $745 $3,708 $2,487 $5,450 Cash Balance $7,228 $19,038 $23,219 $26,431 $28,406 $28,886 $28,880 $29,620 $30,365 $34,073 $36,560 $42,010